the Creative Commons Attribution 4.0 License.
the Creative Commons Attribution 4.0 License.
 | 29 Jul 2022
Decline in Etesian winds after large volcanic eruptions in the last millennium
Ioannis Logothetis
Mads F. Knudsen
Christoffer Karoff
Vassilis Amiridis
Kleareti Tourpali
The northerly Etesian winds are a stable summertime circulation system in the eastern Mediterranean, emerging from a steep pressure gradient between the central Europe and Balkans high-pressure and the Anatolian low-pressure systems. Etesian winds are influenced by the variability in the Indian summer monsoon (ISM), but their sensitivity to external forcing on interannual and longer timescales is not well understood. Here, for the first time, we investigate the sensitivity of Etesian winds to large volcanic eruptions in a set of model simulations over the last millennium and reanalysis of the 20th century. We provide model evidence for significant volcanic signatures, manifested as a robust reduction in the wind speed and the total number of days with Etesian winds in July and August. These are robust responses to all strong eruptions in the last millennium, and in the extreme case of Samalas, the ensemble-mean response suggests a post-eruption summer without Etesians. The significant decline in the number of days with Etesian winds is attributed to the weakening of the ISM in the post-eruption summers, which is associated with a reduced large-scale subsidence and weakened surface pressure gradients in the eastern Mediterranean. Our analysis identifies a stronger sensitivity of Etesian winds to the Northern Hemisphere volcanic forcing, particularly for volcanoes before the 20th century, while for the latest large eruption of Pinatubo modelled and observed responses are insignificant. These findings could improve seasonal predictions of the wind circulation in the eastern Mediterranean in the summers after large volcanic eruptions.
- Article
(4730 KB) - Full-text XML
-
Supplement
(1034 KB) - BibTeX
- EndNote


Etesian winds (“Etesians” for brevity) represent a stable manifestation of the monsoonal activity in the eastern Mediterranean (EMed), established by excessive heating in the summer months that builds a steep surface pressure gradient between the high-pressure system over the central Europe and the Balkans and the Anatolian low-pressure system (Carapiperis, 1951; Tyrlis and Lelieveld, 2013; Dafka et al., 2016). The topography in the EMed channels surface winds to accelerate over the Aegean Sea, where the winds speed often exceeds 15 m s−1, taking an almost northerly direction at the central sector and turning to a north-western direction further south (Tyrlis and Lelieveld, 2013; Dafka et al., 2016; see also Fig. 1). Etesians display a pronounced seasonal variation, with peak intensity and persistence in July and August, as they are synchronised with the development of Indian summer monsoon (Rodwell and Hoskins, 2001; Tyrlis et al., 2013; Dafka et al., 2016; Logothetis et al., 2020). This synoptic system in the EMed and particularly its Anatolian low-pressure component is frequently viewed as the westernmost extension of the Persian trough (e.g. Bollasina and Nigam, 2011). The Etesians advect cool air masses over the Aegean Sea and Levant to compensate the persistent adiabatic heating established in the summer months by the large-scale subsidence, thus regulating summertime conditions in the EMed (Ziv et al., 2004). For this reason, the Etesians are a key climatic component in the EMed, and changes in their intensity and persistence considerably affect several environmental and socio-economic sectors in the region (e.g. Athanasopoulou et al., 2015; Dafka et al., 2018 and references therein).
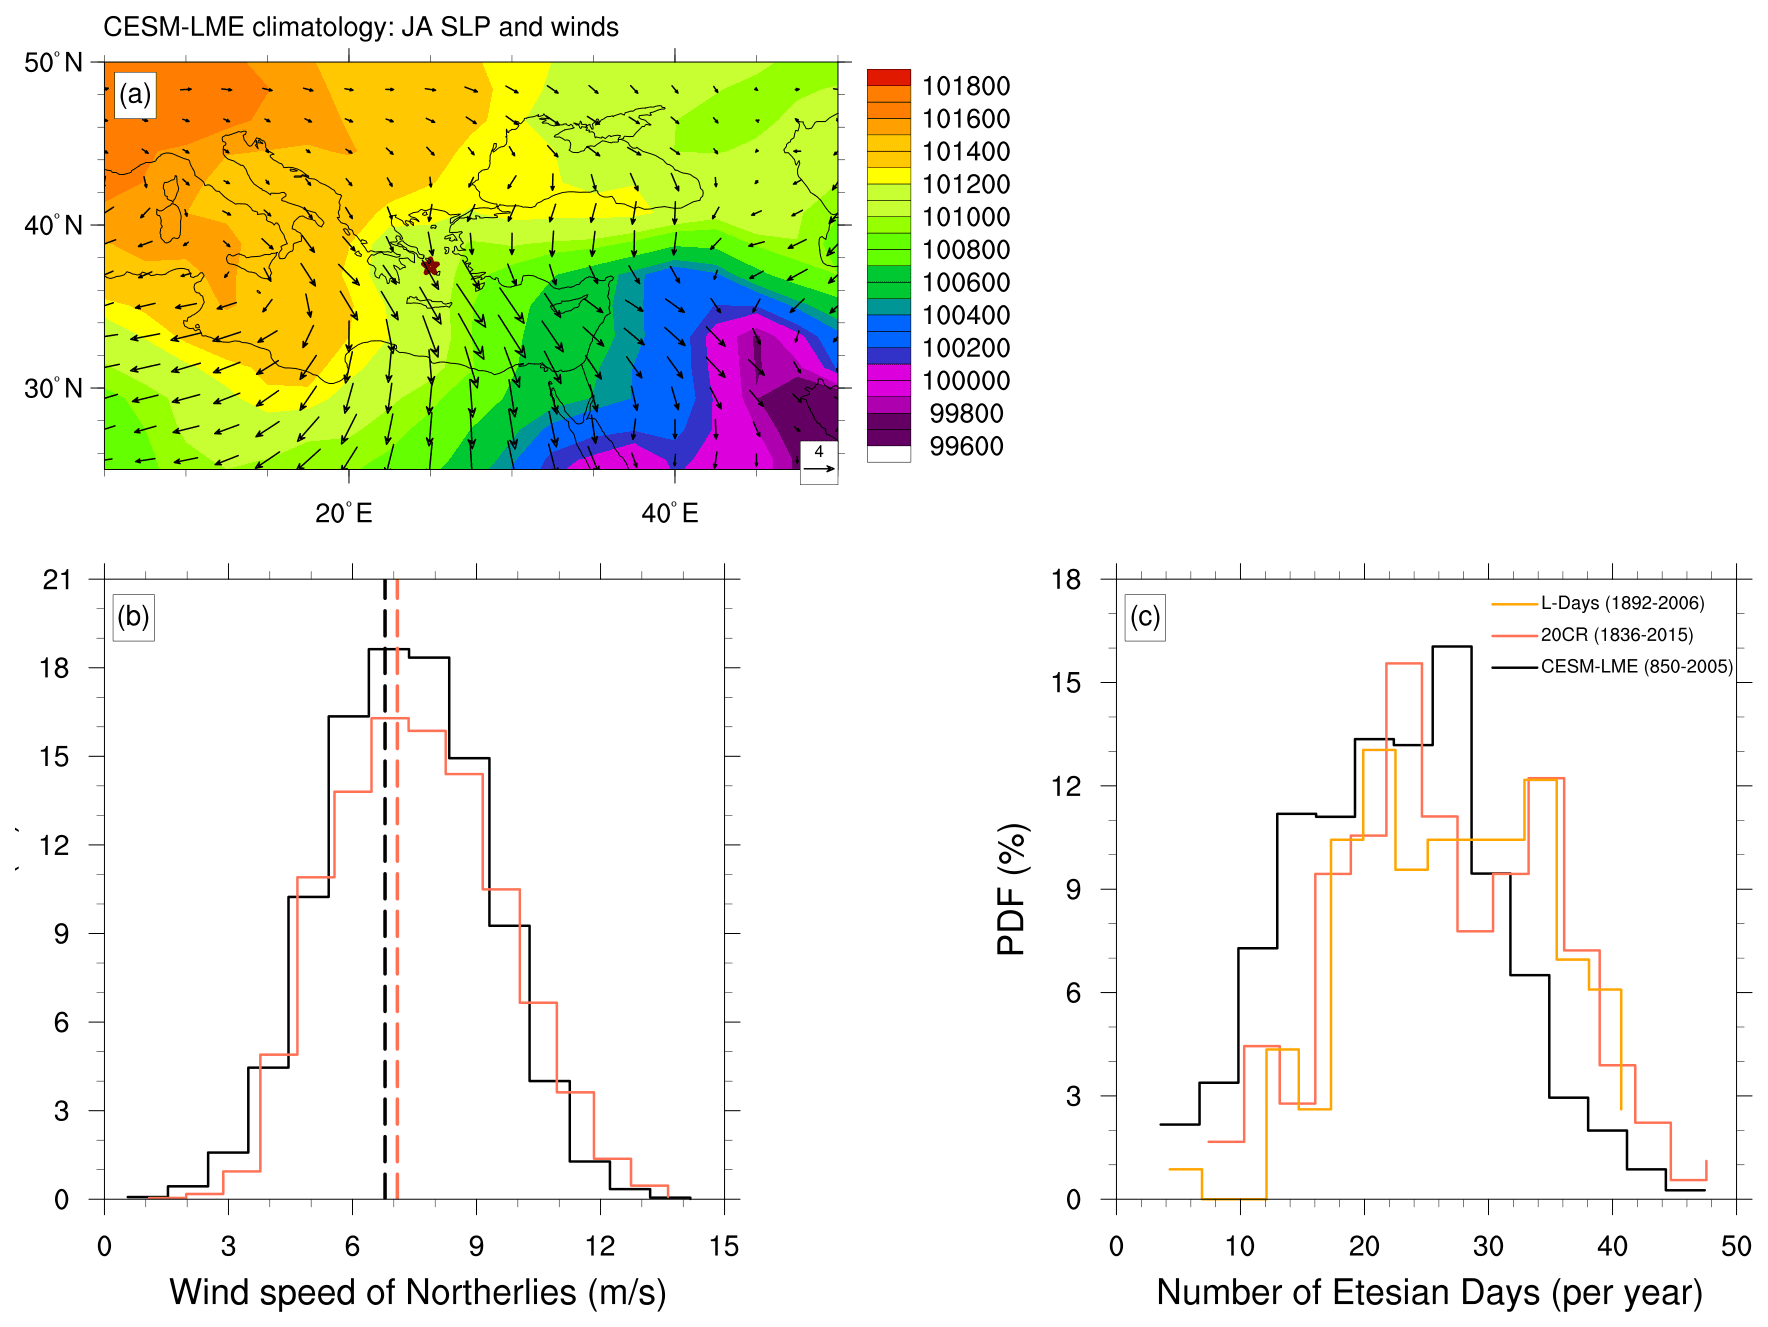
Figure 1Climatology and variability in the Etesians. (a) Climatology of July and August (JA) SLP (Pa; contours) and 10 m wind (m s−1; arrows) in CESM-LME over the 1980–2005 period. The red star symbol indicates the fixed grid point (37.5∘ N, 25.0∘ E) in the central Aegean Sea used for calculating the number of Etesian days (NED) and wind speed (WSP). (b) Probability density functions of northerly (315–45∘) JA WSP for CESM-LME (black) and 20CR (red). Dash lines denote the median northerly WSP of 6.8 and 7.1 m s−1 for CESM-LME and 20CR, respectively. (c) Probability density functions of NED for CESM-LME, 20CR and L-days. Probability density functions (PDFs) are calculated for the full period of each dataset. CESM-LME is represented by the all-forcing ensemble member 7.
Past studies have assessed the frequency and occurrence of the Etesians on different timescales and forcings. On a sub-seasonal scale, increased atmospheric blocking activity over Europe is shown to decrease the frequency of the Etesians, as manifested in the summer of 2014 (Tyrlis et al., 2015). Tropical and extra-tropical teleconnections have also been proposed as an important component of Etesian wind variability on interannual timescales. Specifically, the Indian summer monsoon (ISM) is thought to influence the Etesians by emanating westward-propagating Rossby waves that strengthen subsidence in the EMed (Rodwell and Hoskins, 2001; Ziv et al., 2004; Tyrlis et al., 2013). A stronger ISM, therefore, should favour adiabatic heating in the EMed, which is compensated by advective cooling by stronger Etesian wind speeds. Logothetis et al. (2022) analysed the relationship between wind anomalies in the EMed and the strength of the ISM over the period 1900–2000 and demonstrated that an intensified monsoon activity increases meridional wind speed in the Aegean Sea, consistent with the ISM–EMed teleconnection. This teleconnection is more prominent in extreme monsoon years often associated with the El Niño–Southern Oscillation (ENSO) (Kumar et al., 1999; Singh et al., 2020). However, the ISM–EMed teleconnection does not systematically hold through the 20th century, and opposite correlations have been found in the first half of the 20th century, suggesting that other mechanisms might also be important (Gomez-Delgado et al., 2019). Increased frequency of the Etesians has been associated with changes in the high-pressure system over central Europe and the Balkans (Metaxas and Bartzokas, 1994; Poupkou et al., 2011), and Chronis et al. (2011) linked the interannual variability in Etesians to the summertime North Atlantic Oscillation. Climate model simulations under anthropogenic greenhouse gas forcing project a growing number of Etesian days on decadal and longer timescales attributed to the ISM–EMed teleconnection (Anagnostopoulou et al., 2014; Dafka et al., 2019; Ezber, 2019) because monsoon intensity increases in a warmer climate (Kitoh et al., 2013; Sharmila et al., 2015). Such positive trends in model simulations, however, are not supported by observations over the past decades given that negative trends in Etesian winds have been identified (Poupkou et al., 2011; Rizou et al., 2018). These negative trends could be explained by the observational evidence for a weakened ISM in the past few decades (Kumar et al., 2020). The response, therefore, of Etesians to external forcing on interannual and decadal timescales is not well constrained.
To improve our understanding of the circulation variability in the EMed, a region that has been characterised as a “hot spot” of anthropogenic climate change (Lelieveld et al., 2012), we here investigate a possible sensitivity of Etesians to volcanic forcing. Explosive volcanic eruptions inject sulfur-containing gases in the lower stratosphere, where they are oxidised to long-lived sulfates that can be globally dispersed within a few weeks (Robock, 2000). These aerosols scatter incoming radiation and absorb long-wave radiation, hereby altering the global energy budget, which leads to a cooling of the surface (Timmreck, 2012; Zanchettin et al., 2016) and changes in large-scale ocean circulation (Knudsen et al., 2014; Pausata et al., 2015). Several studies have pointed to hydroclimatic responses to volcanic eruptions, characterised by a reduced precipitation in the summer monsoon regions (Trenberth and Dai, 2007; Iles and Hegerl, 2014; Zuo et al., 2019; Tejedor et al., 2021). The hydroclimatic response is found to be sensitive to the latitude of the forcing as tropical and Northern Hemisphere (NH) eruptions tend to suppress the summer monsoon, opposite to Southern Hemisphere (SH) eruptions (Liu et al., 2016; Stevenson et al., 2016). A weakened NH monsoon circulation has been identified in the CMIP5 models (Paik et al., 2020), which might be linked to an increased tendency for El Niño warm conditions in the first post-eruption year (Khodri et al., 2017), but the relative amplitude of forced responses compared to natural variability is debated (e.g. Dee et al., 2020).
In this study, we present model evidence for a significant decline in the Etesian winds in response to volcanic eruptions over the last millennium, with a stronger sensitivity to NH eruptions. This response is physically explained by the ISM–EMed teleconnection in the summer months. Specifically, strong volcanic eruptions weaken the ISM circulation, reduce large-scale subsidence in the EMed, weaken the surface pressure over the EMed and Anatolia, and ultimately diminish the number of summer days with Etesians. Aspects of the simulated responses can be found in observations, although they are of low statistical significance partly because there are not enough strong volcanic events over the 20th century. We conclude by discussing the implications of our results for improving near-term prediction and understanding changes in Etesians in a warming climate.
2.1 Datasets
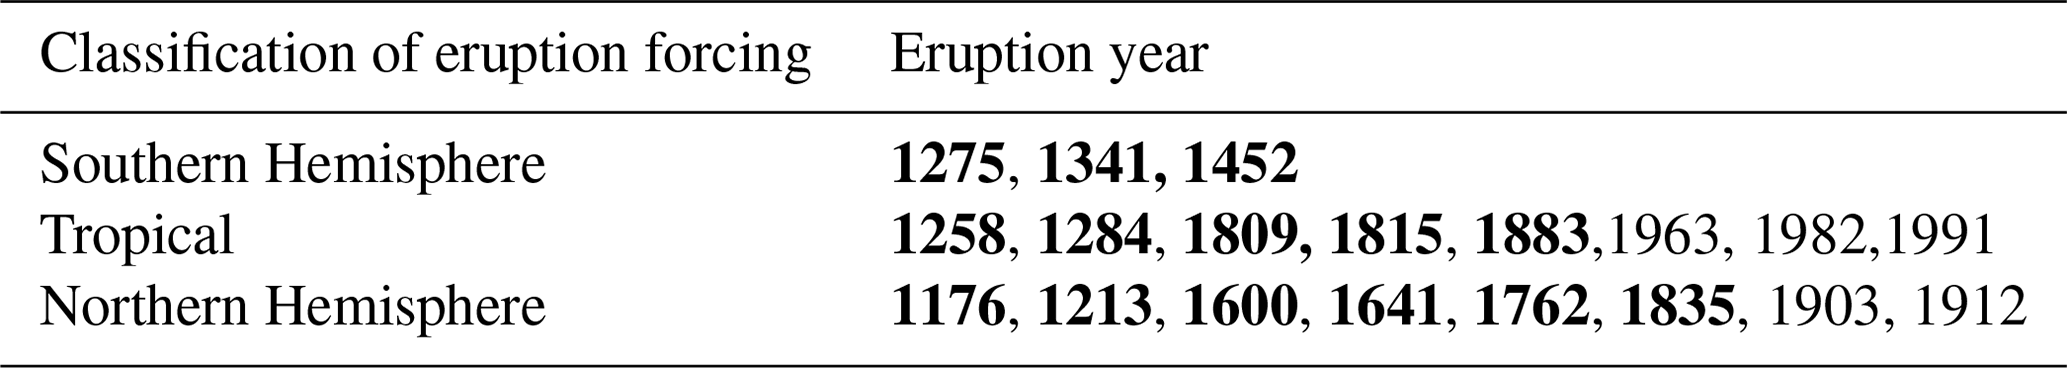
We use daily 10 m winds, sea-level pressure (SLP), surface temperature and omega velocity from the Last Millennium Ensemble Project that carried out simulations over the 850–2005 period with the Community Earth System Model (CESM) coupled atmosphere–ocean model (Otto-Bliesner et al., 2016). The model horizontal resolution in the atmosphere and ocean is ∼2 and , respectively. We present results from (a) an ensemble of 12 simulations (archived runs 2–13; run 1 omitted because it did not archive daily wind fields before 1700) that consider all known historical forcings (greenhouse gases, solar variability, volcanic, land use and orbital) and (b) a twin ensemble of 5 members but considering volcanic forcing only. Volcanic forcing in CESM follows the ice-core–based reconstruction of Gao et al. (2008), in which zonally uniform fixed single-size stratospheric aerosols are prescribed in the three layers in the lower stratosphere above the tropopause (Otto-Bliesner et al., 2016). Given our focus on volcanic signatures, those two sets of simulations are merged into a grant ensemble (CESM-LME hereafter) of 17 members spanning over the 850–2005 period, and all results are based on this merged dataset. From 850 to 1850, we analyse all strong tropical and high-latitude eruptions according to the classification of Stevenson et al. (2016), while over the 1851–2005 period we additionally consider Krakatau (1883), Santa Maria (1903), Novarupta (1912), Mount Agung (1963), El Chichón (1982) and Pinatubo (1991) (all selected eruptions are listed in Table 1). However, we find that CESM-LME simulates significant responses for the pre-20th-century eruptions only (bold eruption years in Table 1), presumably because the pre-20th-century volcanic forcing was much larger than the more recent events. To demonstrate the consistency of our findings with different volcanoes, we discuss results for the strongest tropical eruptions of Samalas (1258) and Tambora (1815) and the high-latitude eruption of Laki (1762), while over the 20th century we consider Pinatubo only, a selection based on the magnitude of the volcanic forcing in the model (note that in the CESM-LME, Samalas and Laki erupt in 1258 and 1762 and not in the true year 1257 and 1783, respectively). However, similar signatures are found for most of the pre-20th-century eruptions as shown in the figures in the Supplement. The Laki eruption serves as an example to demonstrate the amplified sensitivity of Etesian wind response to NH eruptions. This is further elaborated in Sect. 3.1 by comparing differences for all SH, tropical and NH pre-20th-century eruptions.
Table 1List of the volcanic eruptions considered in this study. Eruptions from 850 to 1850 are classified as Southern Hemisphere, tropical and Northern Hemisphere following the methodology of Stevenson et al. (2016). In bold are the SH, tropical and NH pre-20th-century eruptions used in Fig. 4.
CESM-LME signatures for Pinatubo are evaluated against version 3 of the NOAA–CIRES–DOE 20th Century Reanalysis project (20CR hereafter), which reconstructs past climate over the 1836–2015 period by assimilating historical air pressure observations into a global atmospheric model (0.5∘ horizontal resolution) and specifying sea ice and sea-surface temperatures at the model surface boundary (Slivinski et al., 2019). Dafka et al. (2016) reported an overall consistency in the representation of Etesians in different reanalyses compared with station wind observations, and similarly our results do not critically depend on the choice of the reanalysis dataset (not shown). This is additionally confirmed by considering the updated L-days dataset of Carapiperis (1951), which is an independent observation-based index for the number of Etesian days from 1892 to 2006 that describes Etesian outbreaks when the northerly wind in Athens exceeds the local wind breeze.
2.2 Definition of Etesians
We calculate daily wind speed (WSP) and wind direction (WDIR) during the late summer (July and August, JA hereafter) at a fixed grid point (37.5∘ N, 25.0∘ E) in the central Aegean Sea (red star in Fig. 1) so as to select the months typically demonstrating the strongest wind speeds under the influence of monsoonal convection over northern India (Tyrlis and Lelieveld, 2013). Following the methodology of Logothetis et al. (2020), a day with Etesians occurs when the following criteria are satisfied simultaneously: (a) WDIR is northerly between NW (315∘) and NE (45∘), (b) daily WSP exceeds its long-term median, and (c) criteria (a) and (b) are fulfilled for at least 2 consecutive days. The latter criterion filters out intermittent disturbances unrelated to the semi-persistent synoptic system of Etesians winds (Hochman et al., 2019). Finally, we calculate the number of Etesian days (NED) per year as the sum of all Etesian days in the JA season. Our definition of the NED index is similar to the “northerly wind index” of Gomez-Delgado et al. (2019) based on ship-log observations with the addition that our method identifies days with moderate to strong wind speeds only, which better correspond with the historical L-days index (Poupkou et al., 2011). This is validated by the significant correlation between the NED from the 20CR dataset and the L-days index over the common 1892–2006 period (r=0.59, p<0.01 based on a two-tailed t test; see also Fig. 2c). Other methodologies for calculating days with Etesians (e.g. surface pressure gradients) give consistent results (e.g. Dafka et al., 2016).
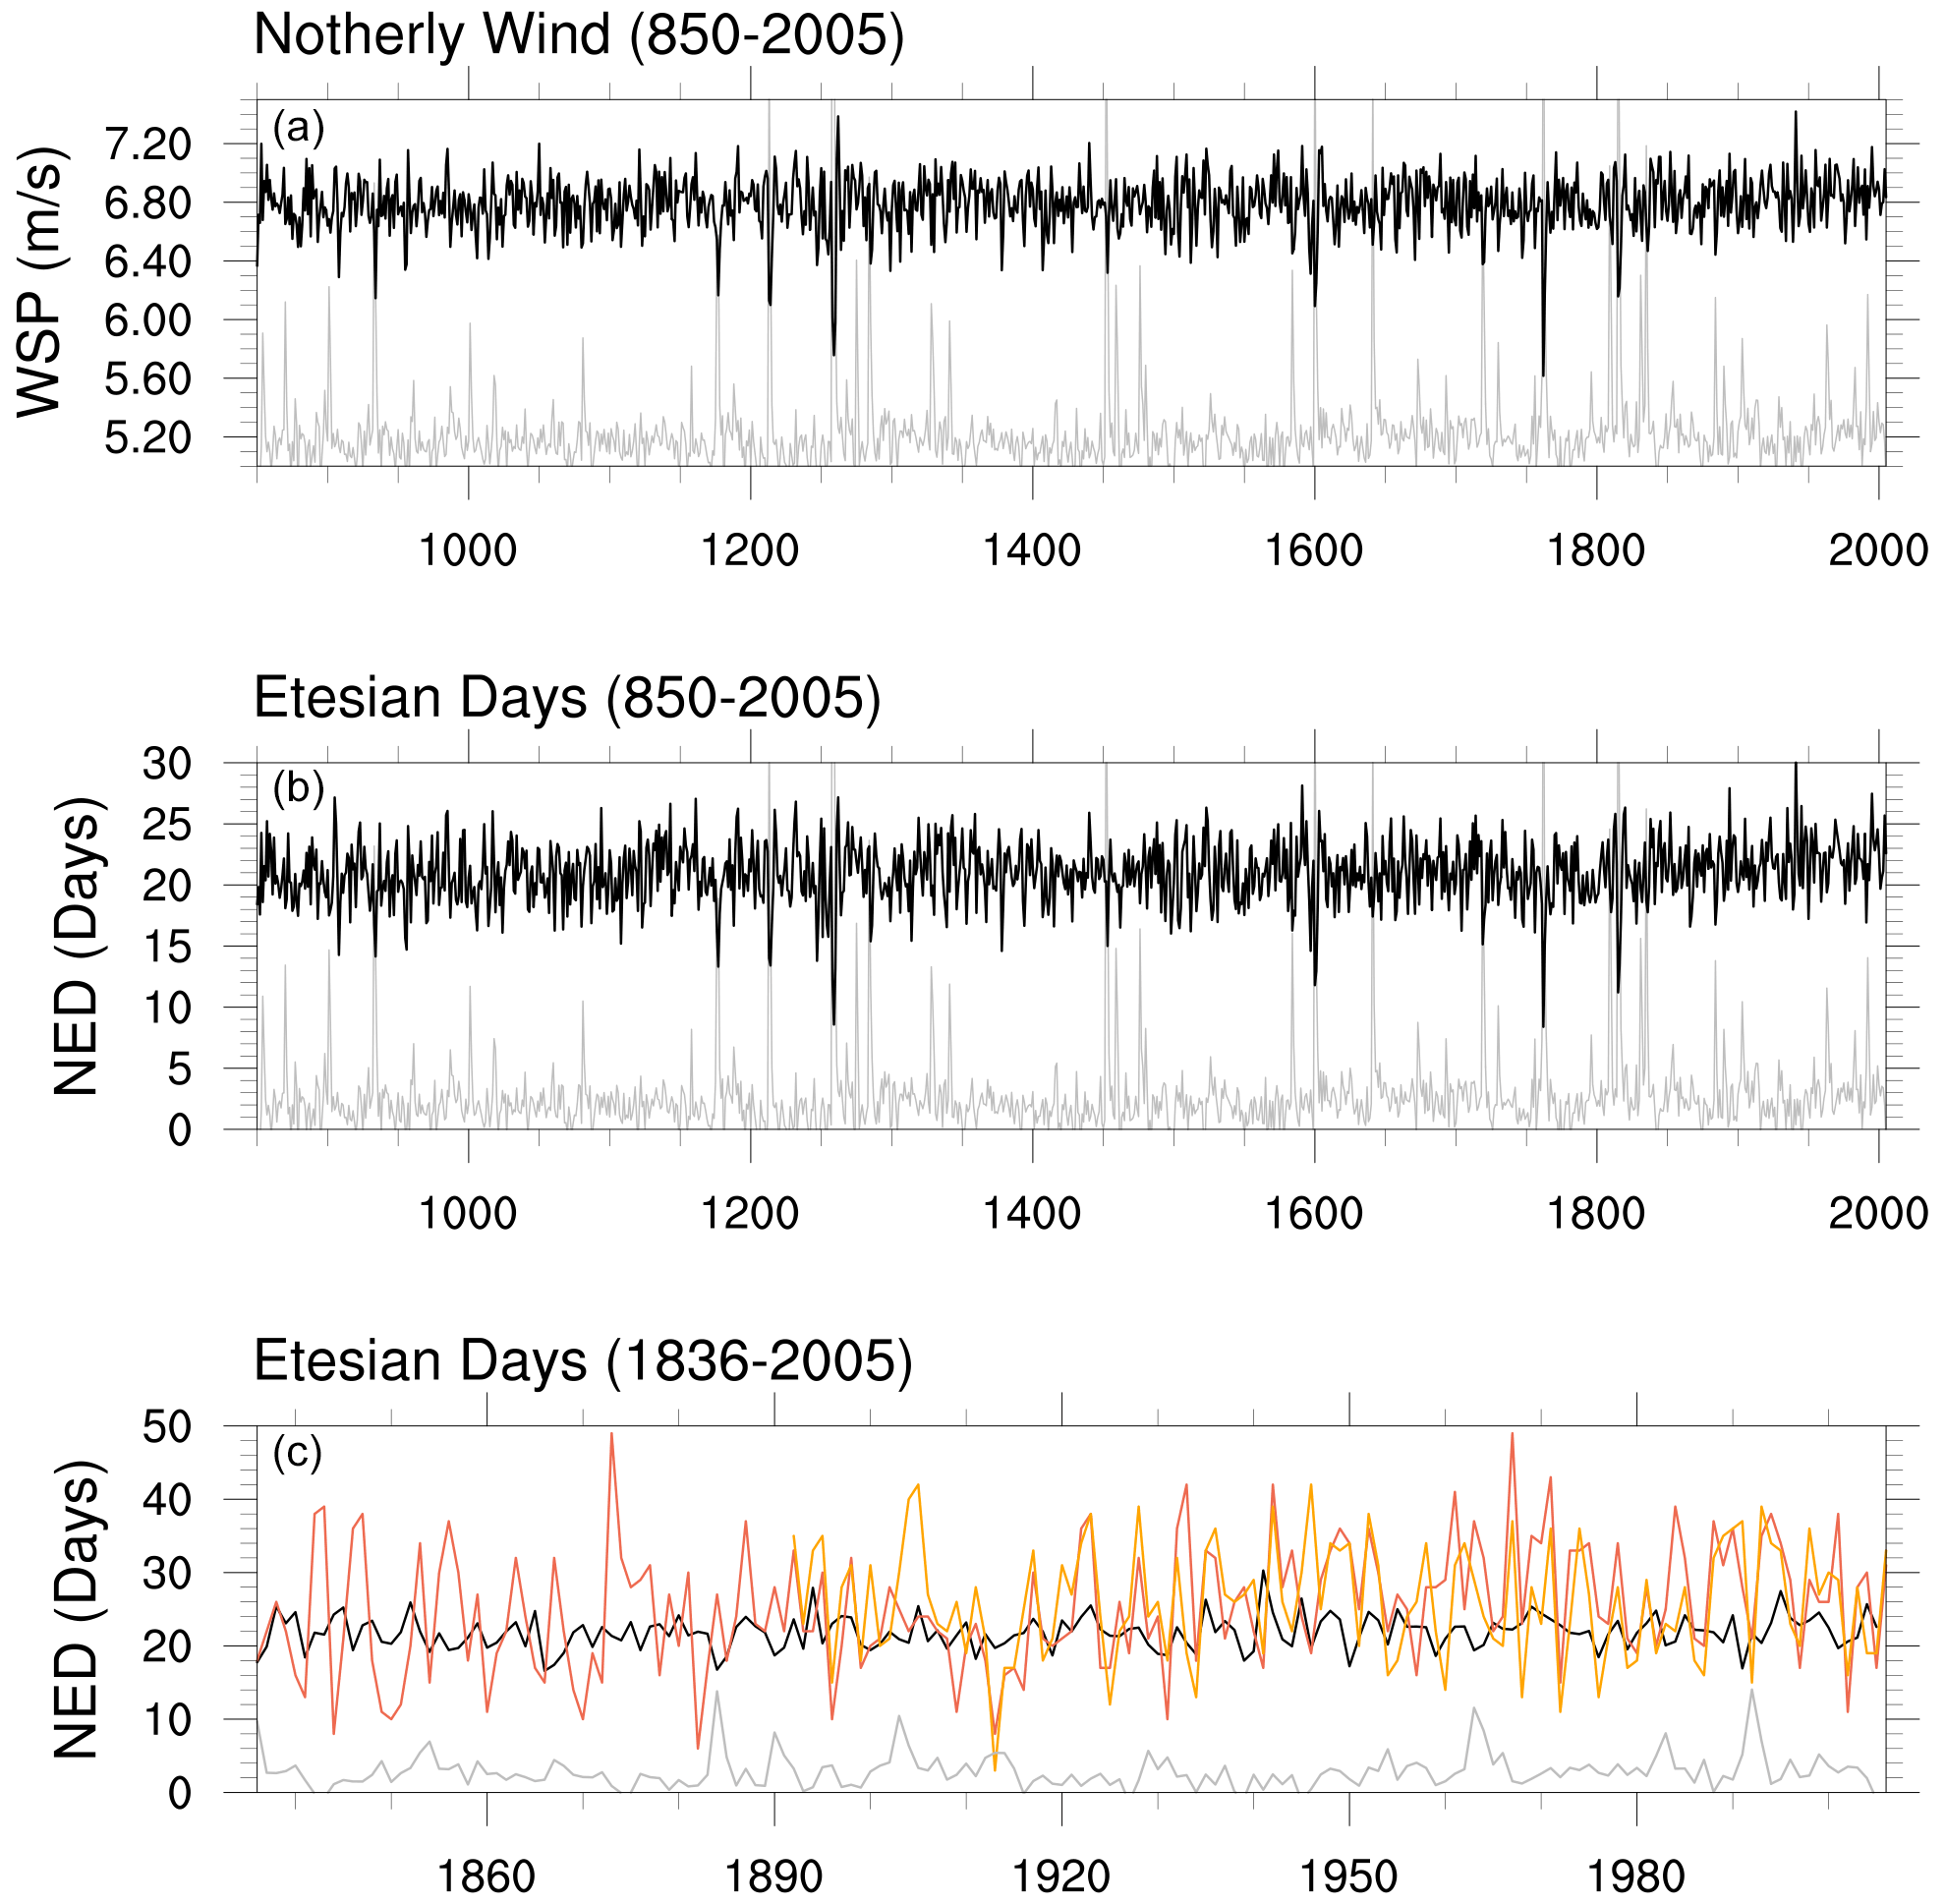
Figure 2Time series of the JA northerly WSP (m s−1) and NED (days) over the last millennium (850–2005) for CESM-LME (black), 20CR (red) and L-days (orange). (a) CESM-LME ensemble-mean WSP time series. (b) CESM-LME ensemble-mean NED time series. (c) NED time series over the common period 1836–2005 for CESM-LME, 20CR and L-days. Note the different range between panels (b) and (c). The outgoing clear-sky SW radiation at the top of the atmosphere, averaged over the Northern Hemisphere (0–90∘ N, grey lines, relative scaling), is used here as a proxy for stratospheric aerosol loading, with peaks indicating volcanic eruptions.
Despite differences in the period considered and the horizontal resolution that could impact the representation of the wind speed climatology (Kotroni et al., 2001), the CESM model simulates realistic mean wind and SLP fields in the summer EMed (Fig. 1a). A comparison of the probability density functions of the northerly WSP in the central Aegean Sea (red star in Fig. 1a) finds comparable mean and higher statistical moments, with median values applied to the classification methodology of Etesians (second criterion) of 6.8 and 7.1 m s−1, respectively (Fig. 1b). The NED over the last millennium in one arbitrarily selected CESM-LME run varies from 3 to 50 d, with a median of 21 d, and similar statistics are found in the other runs. NED in the 20CR dataset ranges from 9 to 48 d, and the L-days index demonstrates a minimum of 3 and maximum of 42 d (Fig. 1c). However, the PDF of NED in the observations is skewed to higher NED values compared to CESM-LME, likely related to the coarser horizontal resolution of the CESM model compared to 20CR.
3.1 Reduction in the number of summer days with Etesians
We first analyse the ensemble-mean time series of the northerly WSP (criterion a; see Sect. 2.2) and NED, respectively, over the last millennium, as simulated in the CESM-LME (black lines in Fig. 2). We find that the most notable deviations in the ensemble-mean WSP and NED are simulated in volcanically active years. Major volcanic eruptions, as noted by increased outgoing NH (0–90∘ N) clear-sky short-wave radiation at the top of the atmosphere (grey lines in Fig. 2) that is used as a proxy for stratospheric aerosol loading, frequently reduce the northerly WSP and consequently the NED up to 2 years after the eruption. For Samalas, the largest eruption in the last millennium, CESM-LME simulates negative WSP anomalies exceeding −1.3 m s−1 in the 2 post-eruption years, while the ensemble-mean NED hardly exceeds 10 d in the summer of 1259. Interestingly, the second-strongest WSP and NED reduction is found for the NH Laki eruption, even surpassing changes associated with Kuwae, the second-strongest eruption in the last millennium, and all other tropical eruptions (e.g. Tambora).
Figure 2c zooms over the common 1836–2006 period to compare CESM-LME with the 20CR and L-days. We caution about the first years in 20CR given the scarcity and quality of observations, but this early period lacks any large eruption; 20CR does not simulate any significant NED reduction after Krakatau, broadly consistent with CESM-LME. On the other hand, the Pinatubo eruption reduces NED in the summer of 1992 (and wind speed; not shown) as evidenced in both the 20CR and L-days datasets. It is interesting to note that the absolute minimum NED anomaly in the 20th century is found in the summer of 1913, with only 8 and 3 d, respectively, in 20CR and L-days, which could be associated with the Novarupta (Katmai) eruption in Alaska (Hildret and Fierstein, 2012). However, this postulation is not supported by the CESM-LME runs, possibly because of the unrealistically weak forcing imposed in the model. Such an underestimation of the NH volcanic forcing is commonly found in many forcing datasets used in model intercomparison activities (Toohey et al., 2019). A comparison of the NH clear-sky, top-of-atmosphere, outgoing SW radiation finds about 5-times-stronger anomalies in the 20CR compared with CESM-LME, further supporting this possibility (not shown).
The previous discussion highlighted a tendency for reduced NED in volcanically active periods. This is further substantiated with a superposed epoch analysis of NED in the 5 post-eruption years (years 1 to 5) compared to the pre-eruption 5-year average (years −5 to −1; see Fig. 3). To facilitate the comparison, anomalies are given in percentages. For completeness, Fig. S1 in the Supplement presents modelled responses for all selected eruptions from 850 to 2005. After Samalas, the NED declines in all individual runs (17 thin grey lines) with maximum anomalies up to −90 % peaking at year +1. The large number of realisations in CESM-LME facilitates the detection of volcanic signatures versus natural variability (Stevenson et al., 2016), and we detect a significant response exceeding 2 standard deviations of the previous 5 years. The absolute minimum NED in the summer of 1259 is 3 d, found in two runs, essentially describing a summer without Etesians. Similar summers are also simulated after Tambora, but with higher intra-ensemble spread regarding the timing of the peak reduction, given that NED in individual runs reduces in either year −0 or year +1. As for strong tropical explosive eruptions, the NH Laki effusive eruption causes a significant NED decline, with the strongest ensemble-mean reduction of −60 % found in year −0. In individual model runs, NED anomalies are as large as those of Samalas, with magnitudes up to −80 % (Fig. 3b). Because of the high latitude and the relative low altitude of the eruption, the lifetime of the Laki influence is relatively short; NED returns to the pre-eruption conditions the following year. Yet, Pinatubo does not significantly impact the ensemble-mean NED (Fig. 3d), despite the fact that some runs show strong reductions with amplitudes exceeding −60%. The peak response of −20% at year −0 is not significant and in addition is suspiciously early as it peaks just 2 months after the eruption date (June 1991). In observations, NED drops by 20 %–40 % in the summer of 1992 in both 20CR and L-days, but the signal is neither significant based on a t test nor exceptional as NED also drops by about the same magnitude at year −4. Hence, we conclude that the observed NED reduction in the summer of 1992 is not significant and might not be related to the volcanic forcing, which is consistent with the model results. This is further discussed in the following section.
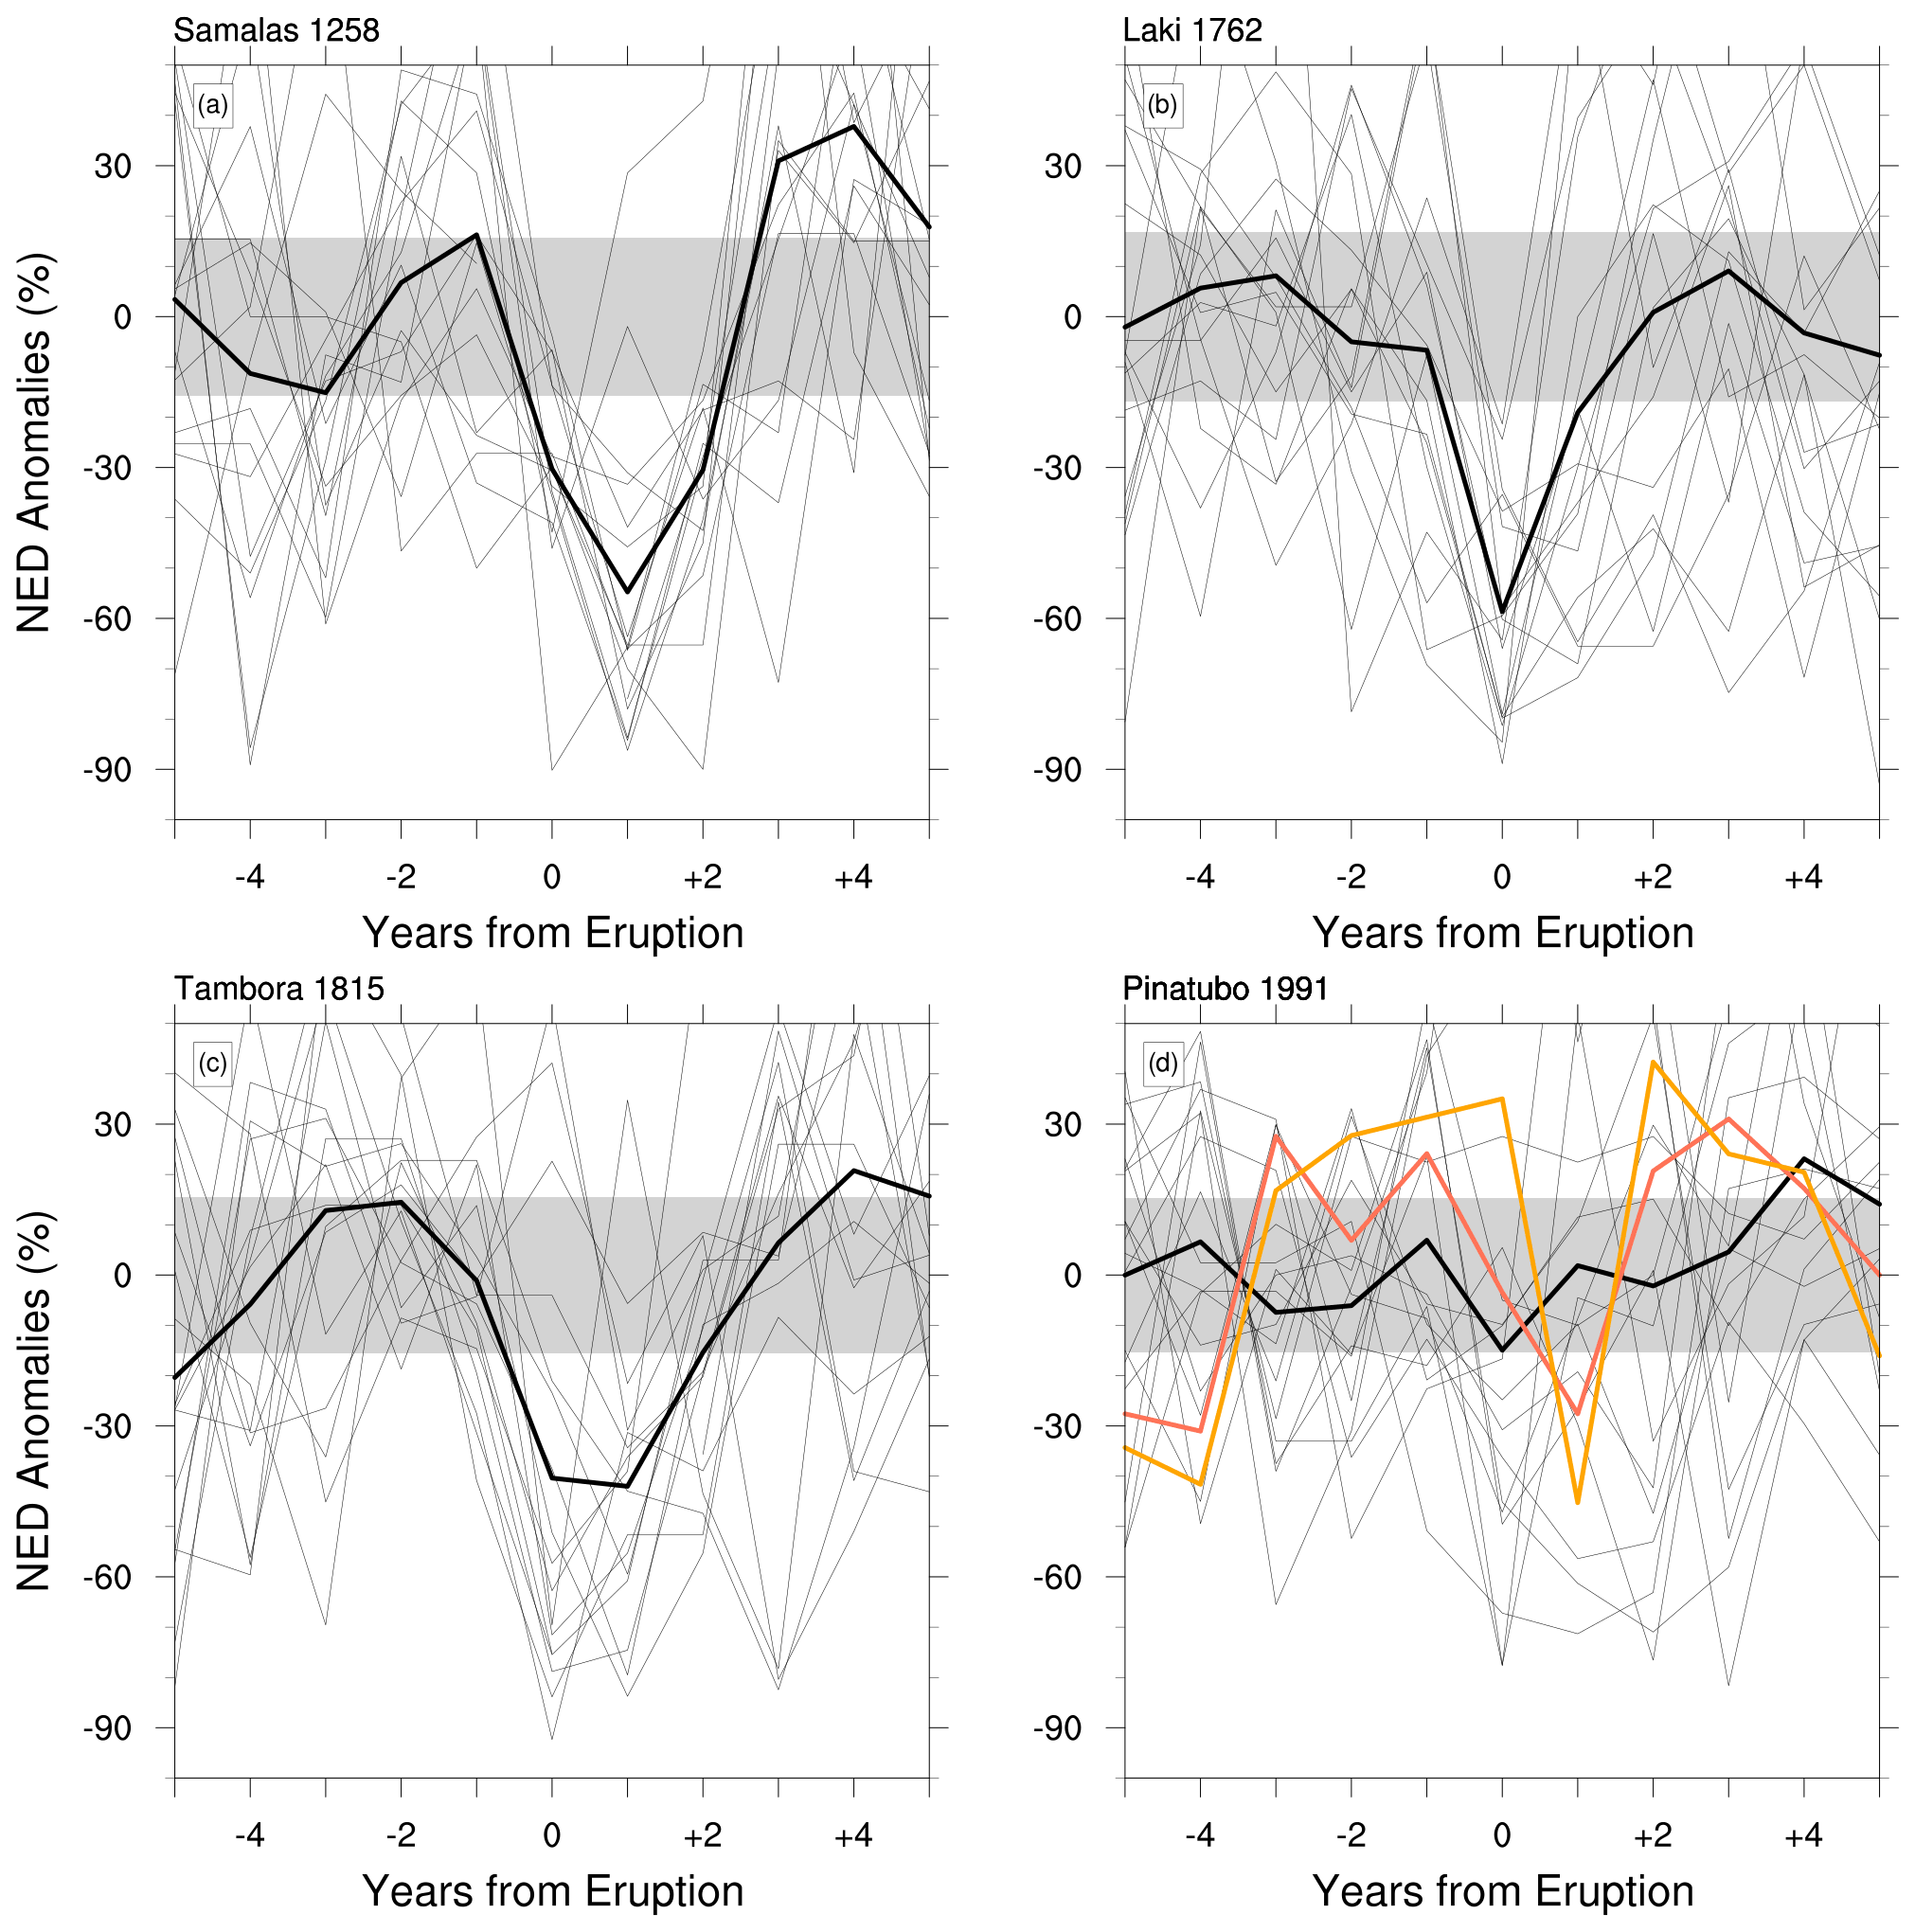
Figure 3Percentage anomalies of NED for (a) Samalas, (b) Laki, (c) Tambora and (d) Pinatubo eruptions in CESM-LME (black), 20CR (red) and L-days (orange), from 5 pre-eruption to 5 post-eruption years. Zero denotes the year of eruption as listed in Table 1. Thin black lines show percentage NED anomalies for the 17 individual runs of the CESM-LME ensemble. Grey shading measures the ±2 standard deviation of pre-eruption (−5 to −1 years) NED in CESM-LME. See Fig. S1 for all eruptions listed in Table 1.
As the historical volcanic forcing is larger than in recent events (e.g. see grey lines in Fig. 2), it is not surprising that the CESM simulates a robust decline in the ensemble-mean NED for volcanoes prior to 1900 only, while signatures are insignificant over the 20th century. In addition, not all strong eruptions impact Etesians in the same way because of interhemispheric differences in the forcing. This is demonstrated in Fig. 4, which shows NED anomalies separately for all SH, tropical and NH eruptions from 850 to 1900 (bold eruption years in Table 1). For the SH eruptions, only Kuwae causes a significant NED anomaly at year +1 but nevertheless of considerably weaker magnitude compared to strong tropical and NH volcanoes (Fig. 4a). Tropical eruptions typically reduce NED in year +1, as previously discussed for Samalas and Pinatubo (Figs. 3 and S1). NED also reduces after all NH eruptions, with a multi-eruption average anomaly of −30 %, larger than the mean response of all tropical eruptions. Given the generally weaker amplitude of NH eruptions compared to strong tropical eruptions, CESM-LME suggests an amplified sensitivity of Etesians to NH volcanoes. This is consistent with studies that show disproportionally stronger climate forcing between NH high-latitude and tropical eruptions of an equal magnitude (Liu et al., 2016; Toohey et al., 2019).
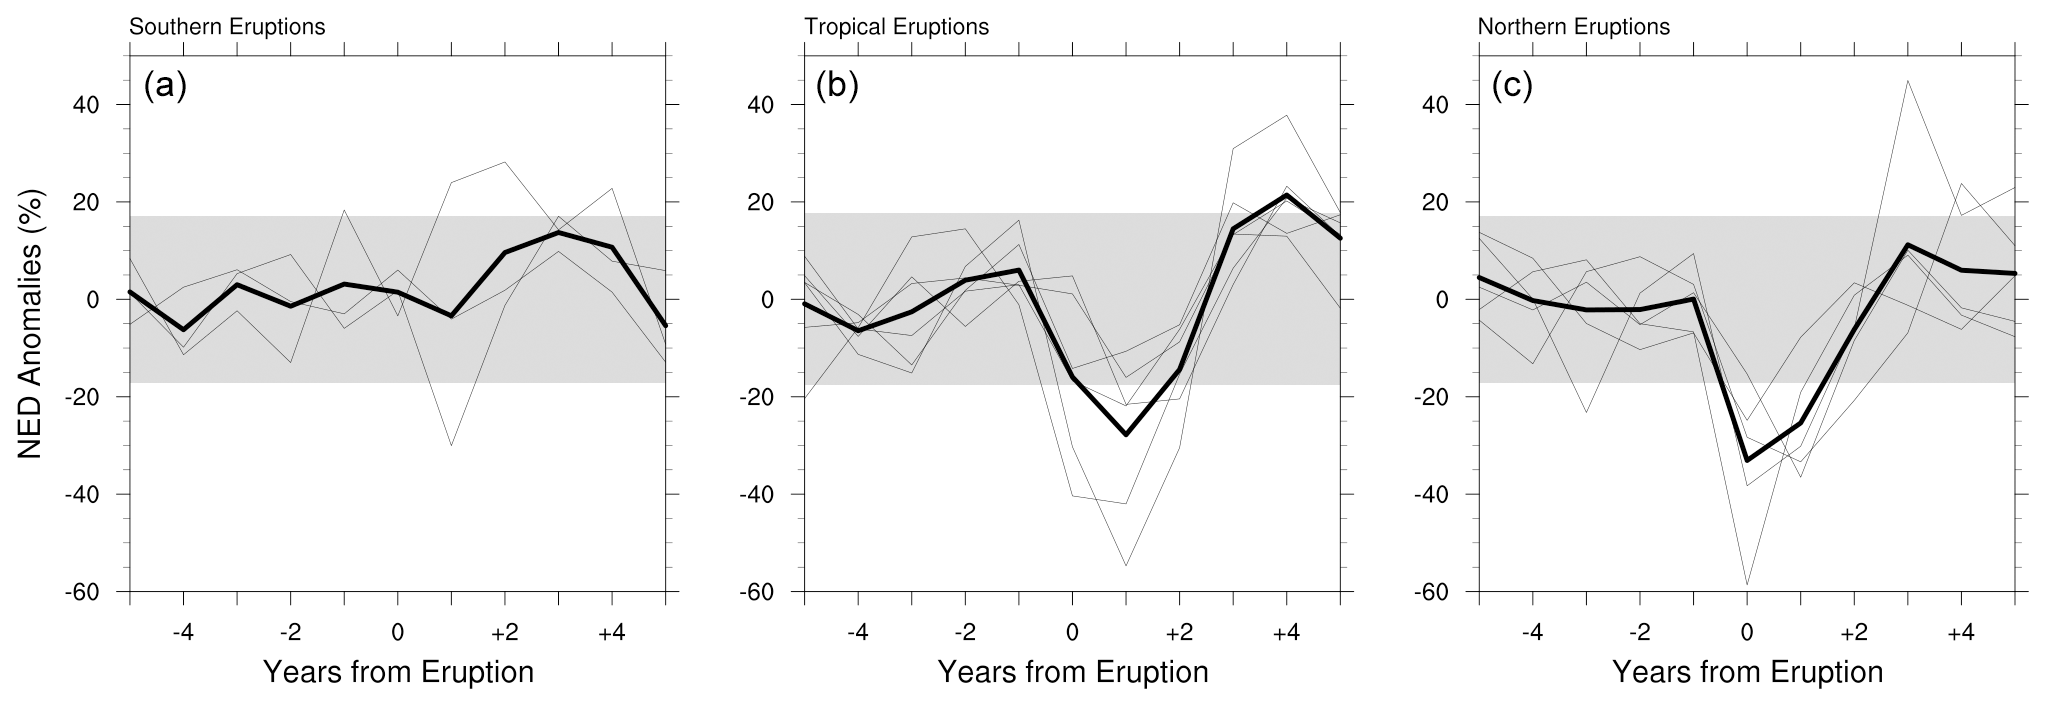
Figure 4Percentage anomalies of NED in CESM-LME for (a) Southern Hemisphere, (b) tropical and (c) Northern Hemisphere volcanic eruptions from 850 to 1900 (bold eruption years in Table 1). Zero denotes the year of eruption. Thin black lines show the ensemble-mean anomalies for every eruption, and the thick black line shows the multi-eruption mean response. Grey shading measures the ±2 standard deviation of pre-eruption (−5 to −1 years) NED.
3.2 Waning Indian summer monsoon reduces summer days with Etesians
CESM-LME simulates a decline in NED of considerable magnitude in the post-eruption summers, which additionally is found to be sensitive to the hemisphere of the volcanic forcing. To understand these key findings, we need to investigate the large-scale circulation changes in relation to the ISM. As a first step, we analyse large-scale surface temperature, SLP and wind anomalies using monthly mean data.
Previous analyses of the CESM-LME simulations have identified the coldest annual NH temperatures after major volcanic eruptions, with magnitudes generally stronger than in the reconstructions, possibly related to uncertainties in the specified volcanic forcing (e.g. Otto-Bliesner et al., 2016). Likewise, the strongest summer (JA) cooling in southern Europe and northern Africa is simulated after Samalas, with anomalies exceeding −3.5 K in the EMed, Balkans and Levant (Figs. 5a and S2 for all eruptions). A similar albeit weaker cooling is also simulated in the post-eruption summers after the Laki and Pinatubo eruptions, which can be explained by the reduction in the incoming radiation by the volcanic aerosols in the stratosphere. The considerably weaker sea surface temperature anomalies in the EMed are related to the heat capacity of water that dumps a response to an intermittent forcing. The direct radiative cooling is superimposed on dynamical signatures associated with changes in the large-scale circulation and regional land–sea contrasts. These dynamical signatures can be isolated by subtracting the zonal mean temperature response (e.g. about −2 K in the 30–40∘ N band). This approach isolates a spatial pattern that is characterised by an amplified cooling over the land masses in the EMed, Balkans and Levant (Fig. S3). In the extreme case of Samalas, the dynamical cooling pattern contributes to about −1.5 K in the total cooling simulated in the EMed.

Figure 5Anomalies of surface temperature (K; shaded), 10 m winds (m s−1; arrows) and SLP (Pa; contours) in the post-eruption summers (JA) following Samalas, Laki, Tambora and Pinatubo. Panels (a)–(c) from CESM-LME and panel (e) from 20CR. Anomalies relative to the average 5 years before the eruption year (see Table 1). No significance test is overlaid. See Fig. S2 for all eruptions listed in Table 1.
The surface cooling in the post-eruption summers is associated with an increased SLP in the EMed and Anatolian low, exceeding 300 Pa in the case of Samalas and Laki (contours in Figs. 5 and S2). This indicates a weakened SLP gradient over the Aegean Sea, which is associated with reduced wind speeds as evidenced by the southerly anomalies of about 1 m s−1 (arrows in Figs. 5 and S2). Hence, fewer days with Etesians are expected under such surface conditions as found in Fig. 3. The positive SLP anomalies extend throughout the Middle East and the Arabian Peninsula. The north-easterly wind anomalies in the Arabian Sea oppose the prevailing south-westerlies in the summer season, which is associated with a weakened ISM. This can also explain the anomalous surface warming simulated over India given that a reduction in the cloud amount and increased downward short-wave radiation in years of reduced ISM can cause positive surface temperature anomalies (Dogar and Sato, 2019). This pattern is robust and is simulated for all strong NH and tropical eruptions prior to 1900 (Fig. S2). We note that the strongest ensemble-mean surface warming over India is found after Laki, with temperature anomalies exceeding +1.5 K (Fig. 5b). Likewise, there is also some evidence in CESM-LME for north-west wind anomalies in the Arabian Sea after Pinatubo in the summer of 1992, but the simulated surface cooling in the EMed is considerably weaker compared to 20CR (Fig. 5e). In 20CR, SLP anomalies in the Anatolian low are trivial after Pinatubo, which is consistent with the insignificant observed NED response shown in Fig. 2d.
This pattern of forced response in the temperature and surface winds shown in Fig. 5, which has also been simulated with other models (e.g. Dogar and Sato, 2019), suggests a possible connection to the ISM. This possibility is investigated by analysing the omega velocity (expressed in −Pa s−1 to denote an upward direction) fields at 200 hPa (Figs. 6 and S4 for all eruptions). The climatology of omega velocity in JA is characterised by ascending motions over the Bay of Bengal, India and Nepal (positive contours in Fig. 6), linked to the monsoonal activity, while subsidence prevails over the region of the EMed (Rizou et al., 2018; Logothetis et al., 2020). These two opposite vertical motions are connected in the summer months, linking the Indian and South Asian summer monsoons to the circulation in the EMed (Rodwell and Hoskins, 2001; Tyrlis et al., 2013). CESM-LME simulates negative anomalies in the region of the Indian monsoon after the volcanic eruptions of Samalas, Pinatubo and Laki, indicating a significant reduction in the upward motion and a waning monsoon activity, which can also be inferred by the reduced precipitation (not shown). The anomalous descending in the ISM region is paired with positive anomalies over the EMed, indicating a reduced subsidence in the post-eruption years. A comparable pattern, although of weaker magnitude, is obtained at 500 hPa (not shown). Anomalies are significant at p<0.05 based on a two-tailed t test, and the strongest changes exceeding −0.04 −Pa s−1 (0.02 −Pa s−1) in the ascending (descending) branch are found for the Samalas eruption.
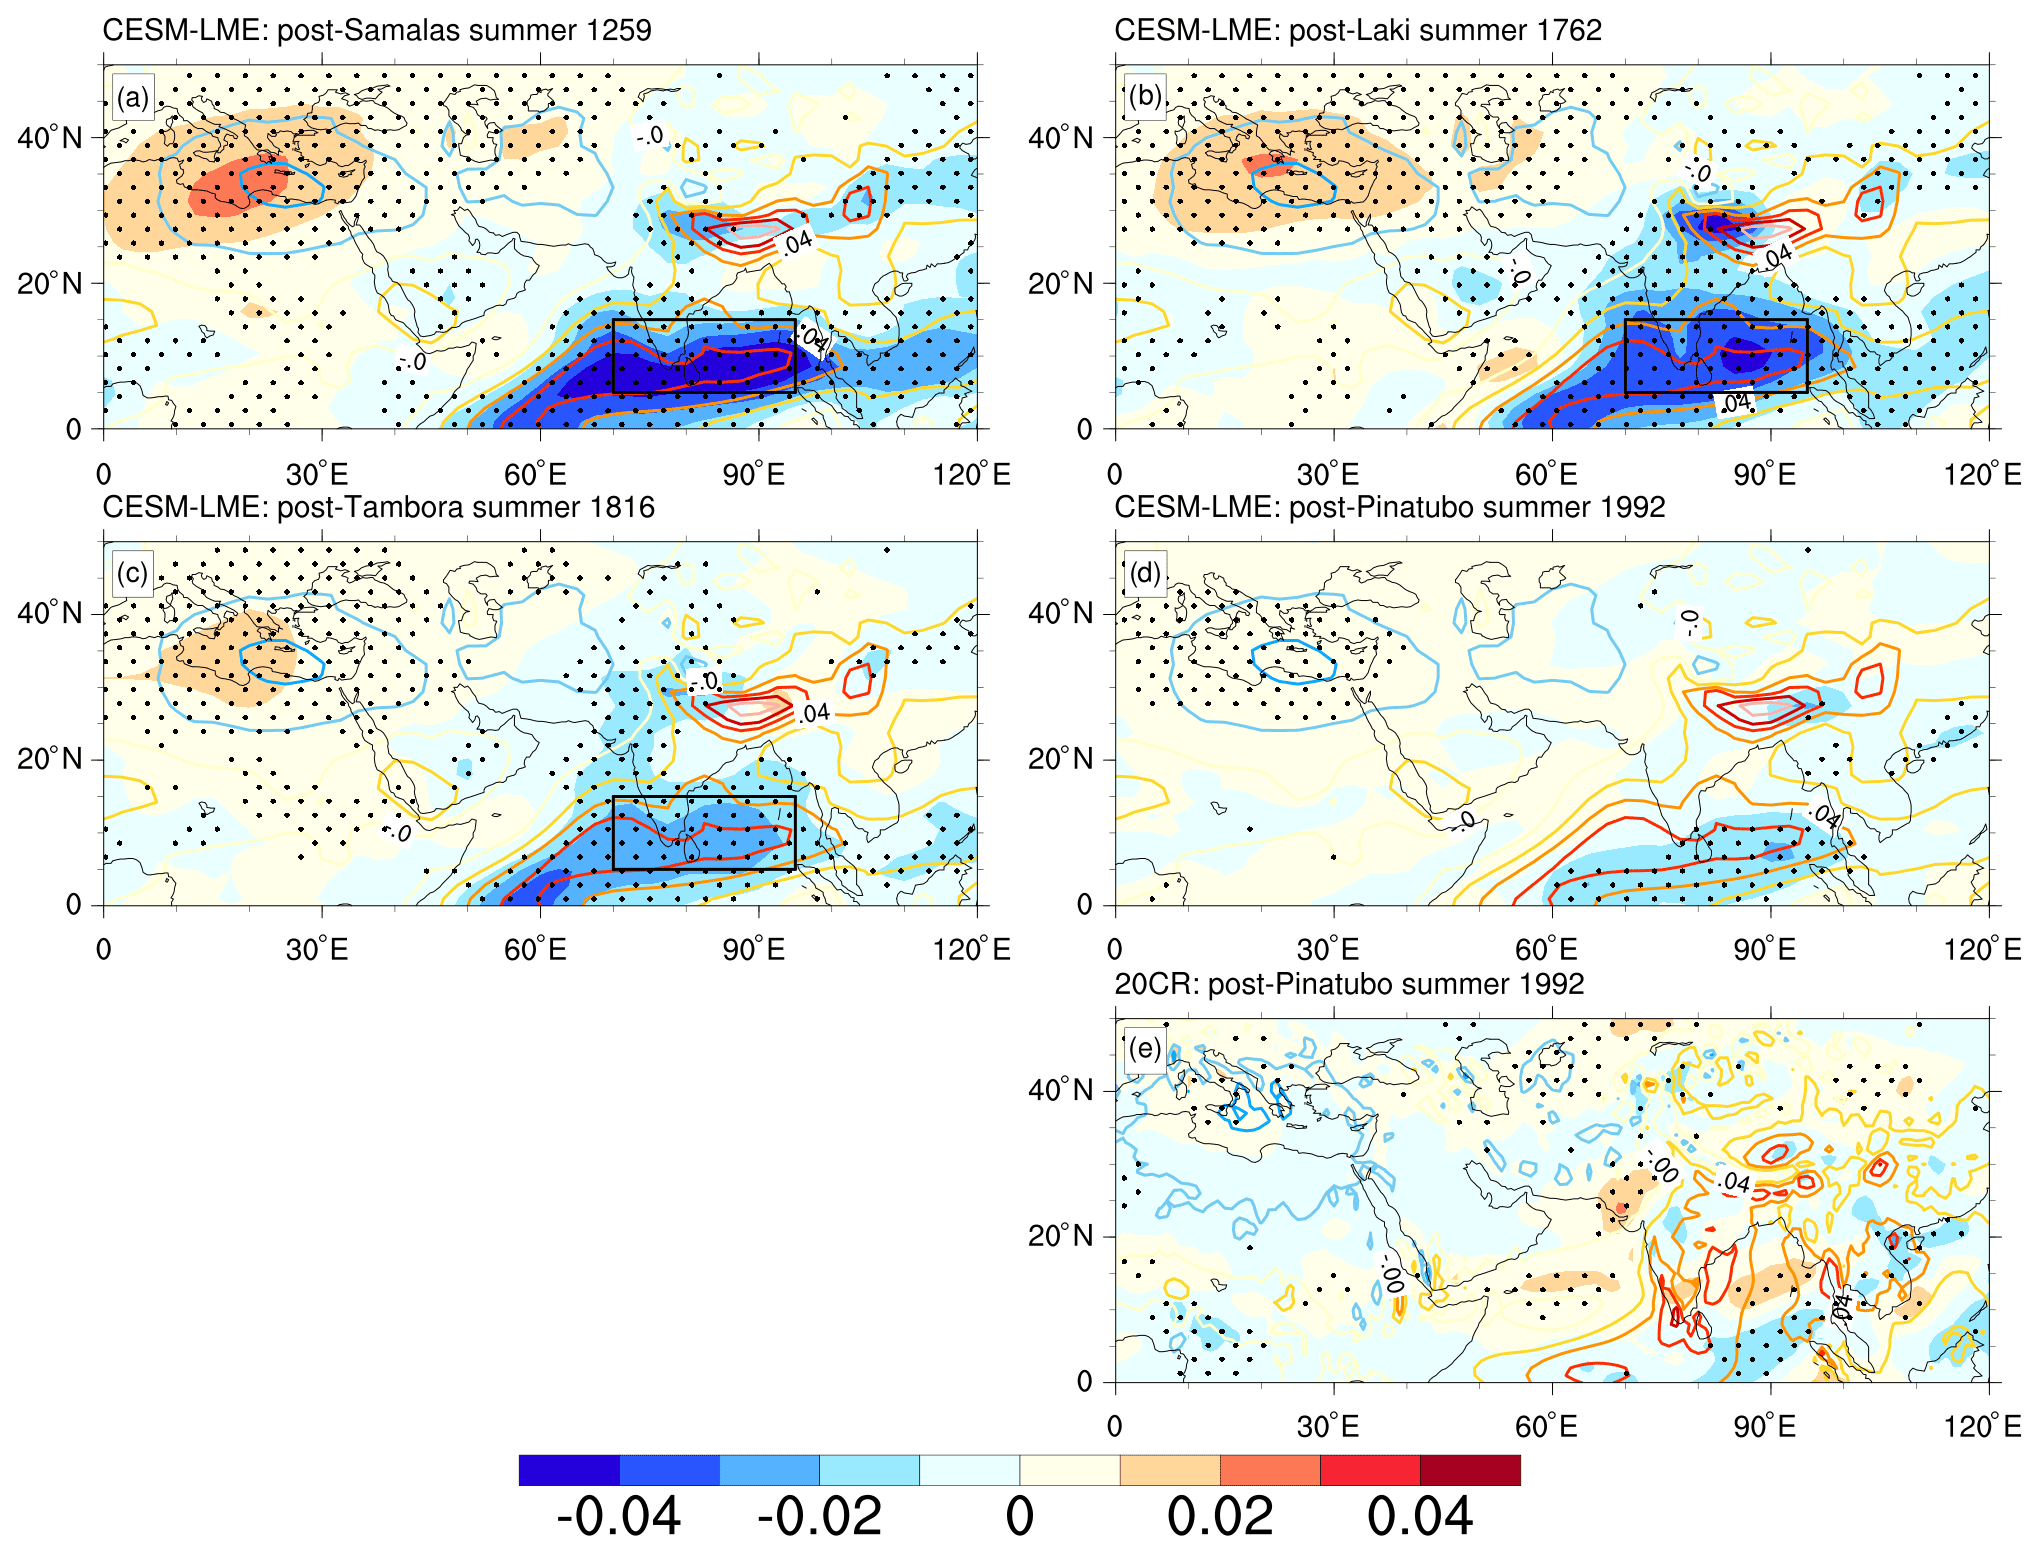
Figure 6Anomalies of omega velocity (−Pa s−1; shaded) at 200 hPa in the post-eruption summers (JA) following Samalas, Laki, Tambora and Pinatubo. Climatology of omega velocity (−Pa s−1) show regions of upwelling (red positive contours) and downwelling (blue negative contours). Panels (a)–(c) from CESM-LME and panel (e) from 20CR. Positive (negative) anomalies indicate reduced descending (ascending) motions. Anomalies relative to the average 5 years before the eruption year (see Table 1). Regions of p<0.05 based on a two-tailed t test are stippled. See Fig. S4 for all eruptions listed in Table 1. Black boxes in panels (a)–(c) denote areas used for averaging omega velocity anomalies shown in Fig. 7. The negative sign in the unit of omega velocity denotes an upward direction.
Previous studies detected a substantial decrease in precipitation over land after the Pinatubo eruption, associated with a reduction in the ISM and positive surface temperature anomalies over India (Trenberth and Dai, 2007). This is consistent with the surface temperature and wind anomalies found in 20CR (Fig. 5e) and broadly supports the pattern of warming in India and cooling in the EMed found in CESM-LME. Yet, the surface temperature response after Pinatubo is considerably weaker in CESM-LME compared to 20CR. The reduced ISM in the summer of 1992 causes negative anomalies in the ascending region, but the observed signature in the descending branch in the EMed is negligible and insignificant (Fig. 6e). This is consistent with the weak SLP anomalies shown in Fig. 5e, associated with insignificant anomalies in the observed NED.
Despite the inconsistent signatures after Pinatubo, CESM-LME simulates similar patterns of omega velocity anomalies for all tropical and NH eruptions prior to 1900 (Fig. S4). Moreover, we identify an almost linear relationship between changes in ISM strength and NED anomalies (Fig. 7). Following Logothetis et al. (2022), the ISM strength is approximated by the omega velocity anomalies at 200 hPa (−Pa s−1) averaged over the region of the strongest mean ascending motion (black boxes in Fig. 6). As previously discussed, all selected eruptions cause negative omega velocity anomalies over the ascending region, and this significantly correlates with the corresponding NED anomalies (r=0.8, p<0.01 according to a two-tailed t test) in the first post-eruption year. A linear regression calculates a positive slope of about 2.3 d per 0.01 −Pa s−1 increase, significant with p<0.01 based on a two-tailed t test. If we additionally consider the three SH eruptions before 1900, the linear regression shows a steeper slope of about 3.5 d per 0.01 −Pa s−1, mainly attributed to the outlier of the 1341 eruption, which shows positive NED and omega anomalies (Figs. S1, S4). This linear relationship, therefore, suggests that the reduction in NED can mainly be explained by the response of the ISM to volcanic forcing through the ISM–EMed teleconnection.
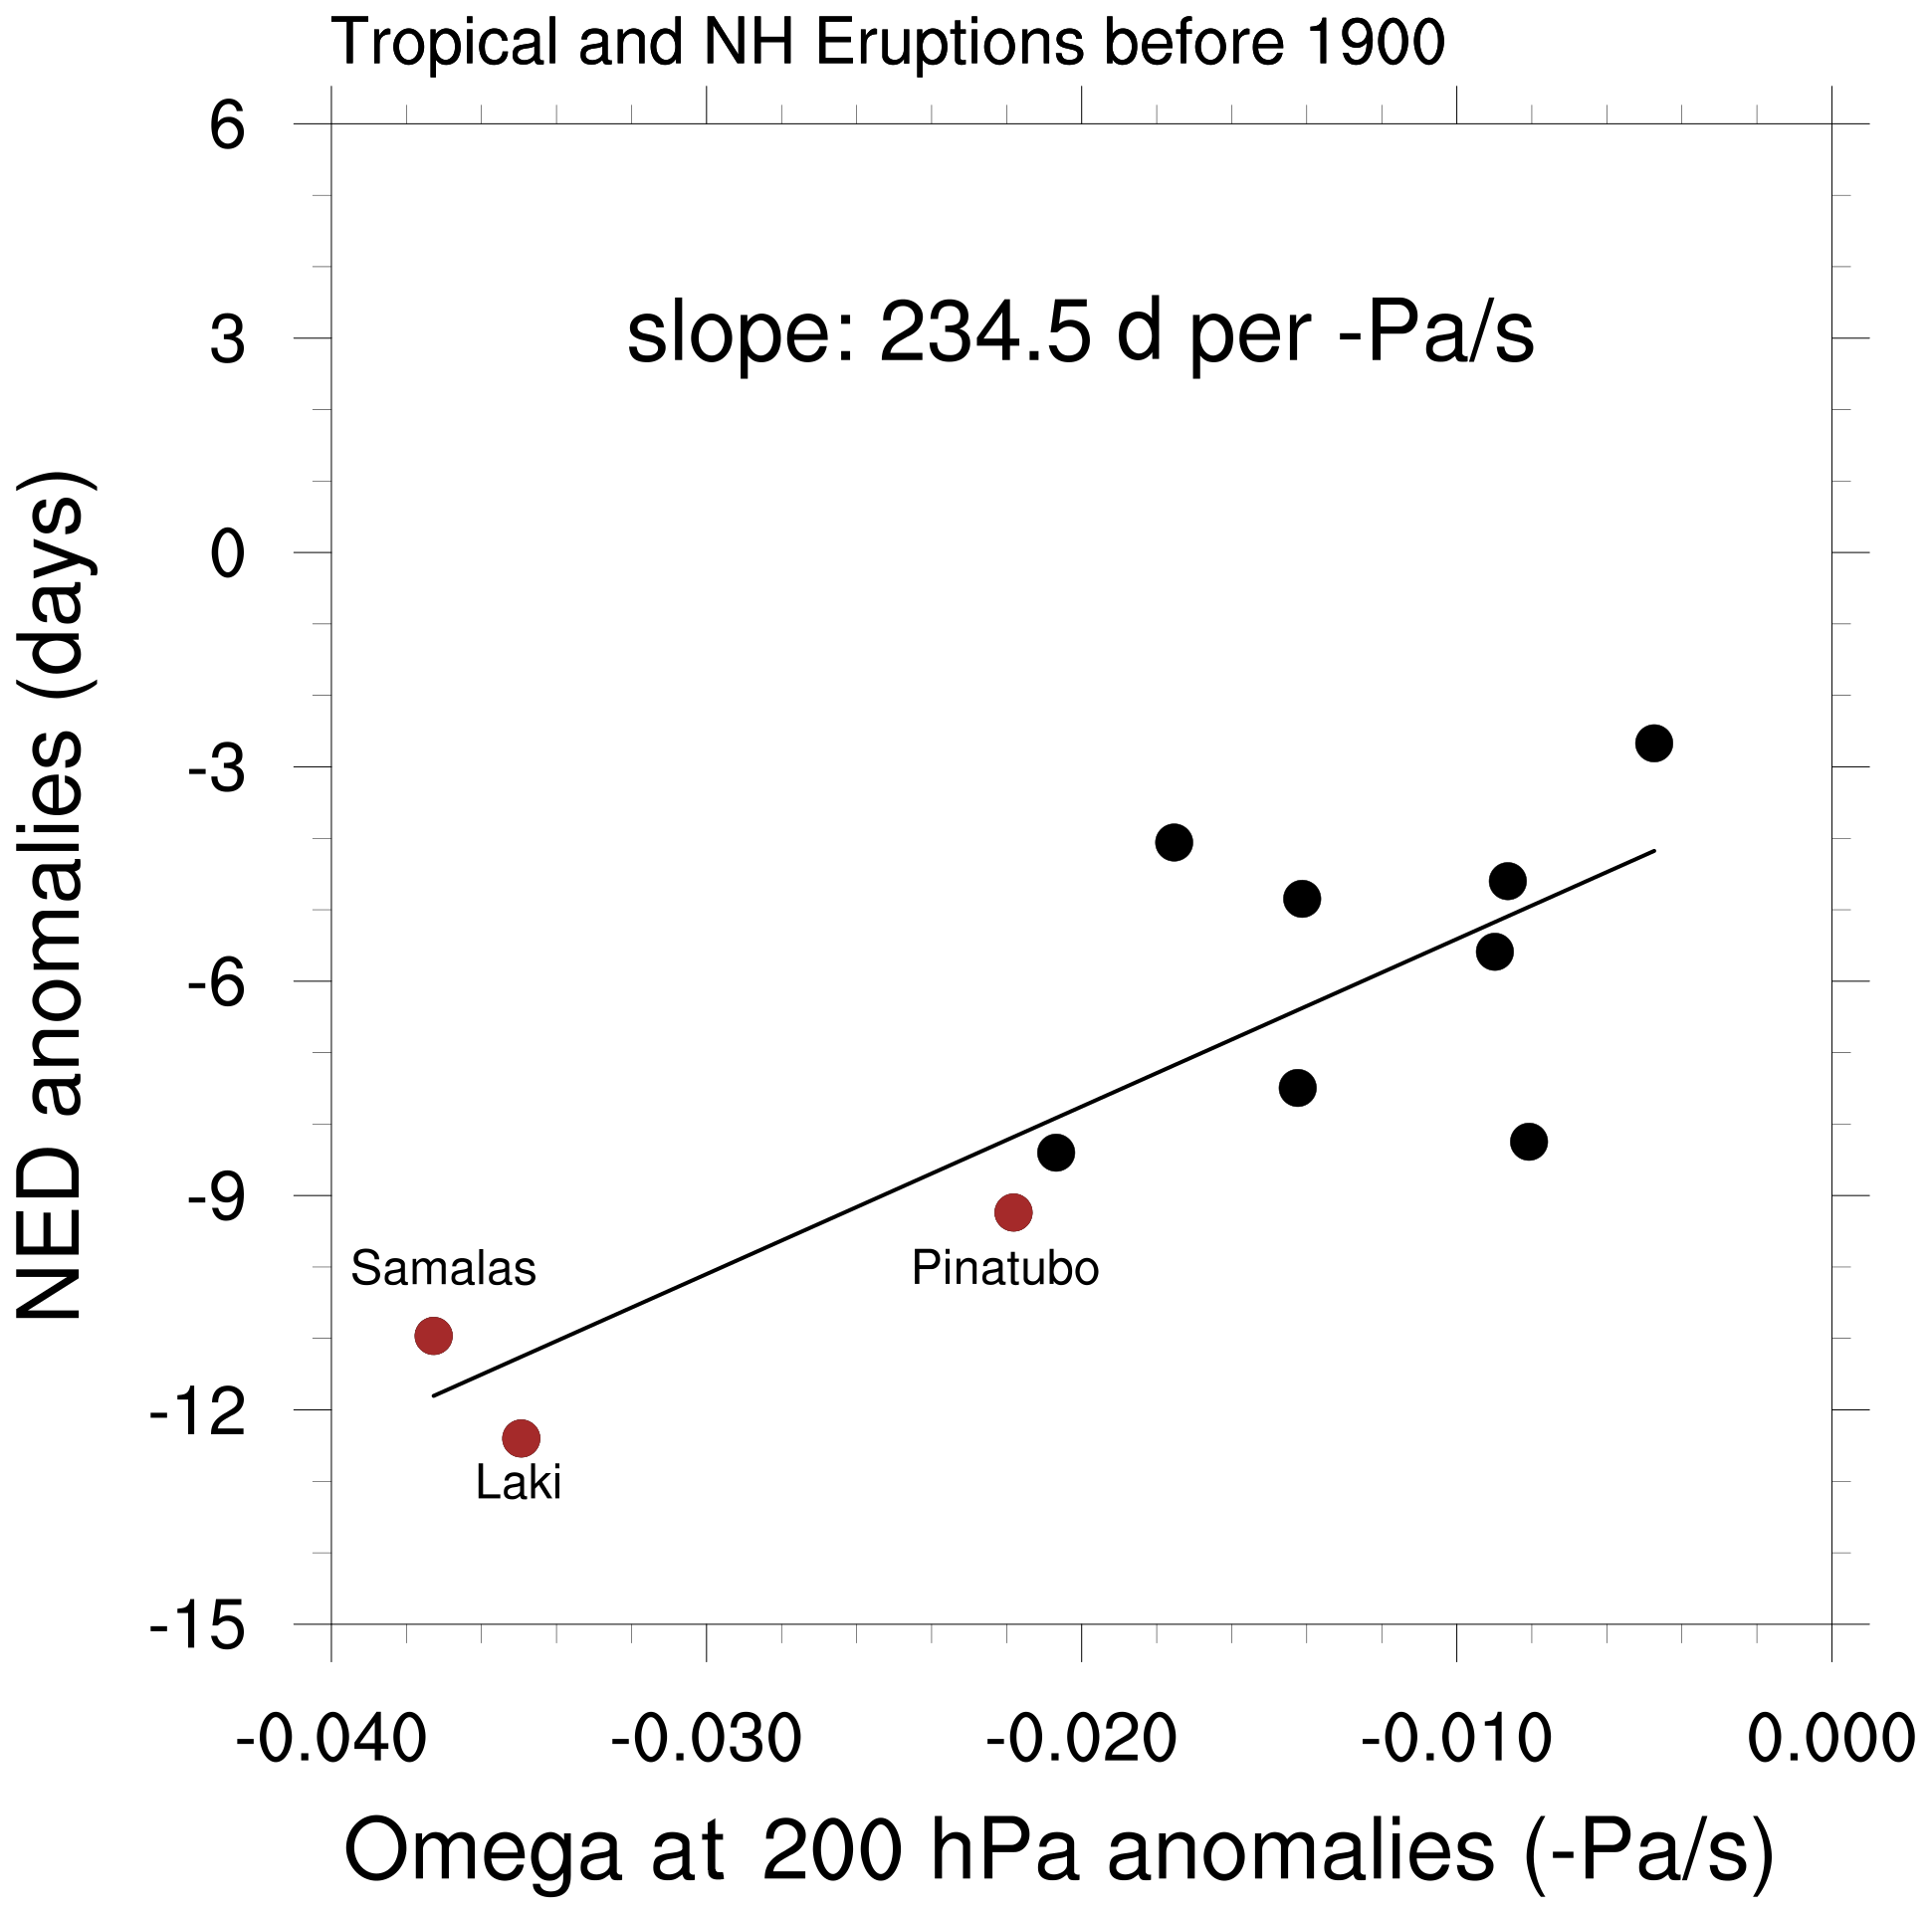
Figure 7Scatter plot of the JA omega velocity anomalies (−Pa s−1) at 200 hPa averaged over the mean ascending region (black boxes in Fig. 6) against the corresponding NED anomalies in the CESM-LME. Selected summers correspond to the maximum NED reduction according to Fig. S1. Negative omega velocity anomalies indicate reduced upwelling. Tropical and NH volcanoes before 1900 are used only. Brown circles denote Pinatubo, Samalas and Laki. A linear regression calculates a positive slope of about 2.3 d per 0.01 −Pa s−1 significant at p<0.01 based on a two-tailed t test. The negative sign in the unit of omega velocity denotes an upward direction.
Large eruptions are ideal test cases for evaluating the climate response to external forcing and can improve our understanding of the mechanisms mediating global signatures at regional scales (Robock, 2000; Zanchettin et al., 2016). However, the superposition of the volcanic forcing and internal climate variability complicates the detection of forced signatures in the observation record. For this reason, large model ensembles help to disentangle regional forced responses. Using the CESM-LME last-millennium ensemble, we investigate, for the first time, volcanic influences on the Etesians in post-eruption summers. The ensemble-mean response is characterised by anomalously colder summers in the Mediterranean after all last-millennium eruptions, an effect that is the strongest in the EMed (Figs. 5, S2 and S3) because of reduced descending motions and a weakened adiabatic heating (Fig. S4). Reconstructions of summer temperatures indicate that several cold spells in the EMed often coincide with volcanic eruptions (Klesse et al., 2015; Klippel et al., 2019), but the strongest reconstructed cooling in the last millennium is not associated with the strongest eruptions (e.g. Samalas), which contrasts with CESM-LME. However, this should be expected given that the ensemble averaging in CESM-LME suppresses internal variability. Volcanic eruptions are found to impact SLP primarily over the Anatolian low and EMed, whereas changes associated with the central Europe and Balkan SLP high are weaker. This wanes SLP gradients over the Aegean Sea, reduces wind speeds and diminishes the number of summer days with Etesians. These circulation changes are clearly detected after the largest eruptions in the past millennium. According to the CESM-LME, the first post-eruption year after Samalas in the observation record should have been a summer without Etesians, provided the internal variability had been negligible.
Tropical and NH eruptions suppress convection over the Pacific warm pool, reduce ISM precipitation and weaken monsoonal circulation as reported in previous studies (Liu et al., 2016; Stevenson et al., 2016; Toohey et al., 2019) and demonstrated here by the weakened ascending motions reflected in the omega velocity anomalies (Fig. 6). A suppressed ISM in the post-eruption summer is associated with reduced subsidence in the EMed and higher SLP along the western margin of the monsoon (Ziv et al., 2004). This explains the SLP anomalies in the EMed and Anatolian low and hence the simulated decline in NED after strong volcanic eruptions. The volcanic eruptions in the NH typically cause strong Equator-to-pole gradients of temperature anomalies, given that they induce negligible cooling in the tropics (Stevenson et al., 2016; Toohey et al., 2019). This leads to an enhanced monsoon suppression compared to tropical and SH eruptions, which could explain the stronger sensitivity of NED to NH eruptions. Yet, CESM-LME does not provide evidence that a tropical eruption of Pinatubo-like magnitude can alter NED significantly. This is supported by the observations, which also show insignificant anomalies. On the other hand, NH eruption of Pinatubo magnitude might cause a considerable reduction in Etesians owing to the amplified hemispheric sensitivity.
Our results are based on simulations with the CESM model that assumes some simplifications regarding aerosol transport in the stratosphere, aerosol distribution and the seasonality of eruptions (Gao et al., 2008). Eruptions of unknown dates are assumed to begin in April and peak in June–July, a simplification that leads to very similar time evolution of the volcanic forcing (Stevenson et al., 2016). This might lead to an overestimation of the volcanic forcing in the summer months for some of the unknown eruptions. The CESM model also suffers from over-active ENSO variations compared to the observations, which need to be considered when disentangling direct volcanic effects and ENSO. By averaging over 17 ensemble members, the effects of ENSO on ISM should be alleviated, but there is evidence that volcanic eruptions in the CESM-LME promote positive ENSO conditions (Stevenson et al., 2016). This means that, in the model, the monsoon response to the volcanic forcing could have been amplified by an ENSO warming in the post-eruption year. Observations and reconstructions do not yet provide undisputable evidence regarding the ENSO response to volcanic forcing (Khodri et al., 2017; Dee et al., 2020).
We conclude that the suppressed monsoon and the ISM–EMed teleconnection mediate global volcanic signatures to the EMed, affecting the synoptic pattern of Etesians. These findings could help us separate naturally and anthropogenically forced variations. Model simulations of future global warming indicate a strengthening of the land–ocean temperature contrasts and low-level monsoon circulation, accompanied by enhanced precipitation over the ISM region (Kitoh et al., 2013; Sharmila et al., 2015). According to our results, an intensification of the ISM under increased greenhouse gas forcing might strengthen the surface pressure gradient in the Aegean Sea and ultimately increase NED in future. This is supported by the all-forcing CESM simulations, which provide evidence for significant positive trends of NED over the last century (not shown). Evidence for intensified Etesians has been inferred from simulations of future scenarios (Anagnostopoulou et al., 2014; Ezber, 2019), suggesting nevertheless that additional mechanisms related to changes in the midlatitude westerly flow might also play an important role in strengthening SLP gradients in the Aegean Sea (Dafka et al., 2019).
Prediction of the frequency, intensity and persistence of Etesians in the summer months is important for ecosystem services, wildfire prevention, air quality forecasts, tourism, energy production and economic development (Athanasopoulou et al., 2015; Dafka et al., 2018). The synoptic system associated with the Etesians exhibits high predictability compared to the other weather patterns in the EMed (Hochman et al., 2019). Given the recent progress in seasonal predictions of the ISM after volcanic eruptions (Singh et al., 2020), our results could be used for improved seasonal predictions of wind circulation in summer months in the EMed.
The CESM-LME simulations (Otto-Bliesner et al., 2016; https://doi.org/10.1175/bams-d-14-00233.1) can be downloaded on the Earth System Grid (https://www.earthsystemgrid.org/, last access: 17 May 2022). Data from the NOAA-CIRES-DOE 20th Century Reanalysis project are available here: https://psl.noaa.gov/data/gridded/data.20thC_ReanV3.html (last access: 17 May 2022; NOAA-CIRES-DOE, 2022). Code for the analysis is available upon request.
The supplement related to this article is available online at: https://doi.org/10.5194/wcd-3-811-2022-supplement.
SM designed the analysis and wrote the manuscript. IL, MFK, CK, VA and KT contributed to the manuscript and provided feedback.
The contact author has declared that neither they nor their co-authors have any competing interests.
Publisher’s note: Copernicus Publications remains neutral with regard to jurisdictional claims in published maps and institutional affiliations.
The authors thank the two anonymous reviewers and the editorial team for their constructive comments on the manuscript. Mads F. Knudsen and Christoffer Karoff acknowledge the Villum Foundation Experiment Programme “Environmental consequences of solar cosmic rays”. The authors acknowledge the CESM1(CAM5) Last Millennium Ensemble Community Project for simulations analysed here, the production of which relied on supercomputing resources provided by NSF/CISL/Yellowstone.
This research has been supported by the H2020 Marie Skłodowska-Curie Action “Climatic impacts of volcanic ash electrification-ElectricVolcano” (grant no. 895461).
This paper was edited by Heini Wernli and reviewed by two anonymous referees.
Anagnostopoulou, C., Zanis, P., Katragkou, E., Tegoulias, I., and Tolika, K.: Recent past and future patterns of the Etesian winds based on regional scale climate model simulations, Clim. Dynam., 42, 1819–1836, https://doi.org/10.1007/s00382-013-1936-0, 2014.
Athanasopoulou, E., Protonotariou, A. P., Bossioli, E., Dandou, A., Tombrou, M., Allan, J. D., Coe, H., Mihalopoulos, N., Kalogiros, J., Bacak, A., Sciare, J., and Biskos, G.: Aerosol chemistry above an extended archipelago of the eastern Mediterranean basin during strong northern winds, Atmos. Chem. Phys., 15, 8401–8421, https://doi.org/10.5194/acp-15-8401-2015, 2015.
Bollasina, M. and Nigam, S.: The summertime “heat” low over Pakistan/northwestern India: evolution and origin, Clim. Dynam., 37, 957–970, https://doi.org/10.1007/s00382-010-0879-y, 2011.
Carapiperis, L. N.: ON THE PERIODICITY OF THE ETESIANS IN ATHENS, Weather, 6, 378–379, https://doi.org/10.1002/j.1477-8696.1951.tb01292.x, 1951.
Chronis, T., Raitsos, D. E., Kassis, D., and Sarantopoulos, A.: The Summer North Atlantic Oscillation Influence on the Eastern Mediterranean, J. Climate, 24, 5584–5596, https://doi.org/10.1175/2011jcli3839.1, 2011.
Dafka, S., Xoplaki, E., Toreti, A., Zanis, P., Tyrlis, E., Zerefos, C., and Luterbacher, J.: The Etesians: from observations to reanalysis, Clim. Dynam., 47, 1569–1585, https://doi.org/10.1007/s00382-015-2920-7, 2016.
Dafka, S., Toreti, A., Luterbacher, J., Zanis, P., Tyrlis, E., and Xoplaki, E.: Simulating Extreme Etesians over the Aegean and Implications for Wind Energy Production in Southeastern Europe, J. Appl. Meteorol. Clim., 57, 1123–1134, https://doi.org/10.1175/Jamc-D-17-0172.1, 2018.
Dafka, S., Toreti, A., Zanis, P., Xoplaki, E., and Luterbacher, J.: Twenty-First-Century Changes in the Eastern Mediterranean Etesians and Associated Midlatitude Atmospheric Circulation, J. Geophys. Res.-Atmos., 124, 12741–12754, https://doi.org/10.1029/2019jd031203, 2019.
Dee, S. G., Cobb, K. M., Emile-Geay, J., Ault, T. R., Edwards, R. L., Cheng, H., and Charles, C. D.: No consistent ENSO response to volcanic forcing over the last millennium, Science, 367, 1477–1481, https://doi.org/10.1126/science.aax2000, 2020.
Dogar, M. M. and Sato, T.: A Regional Climate Response of Middle Eastern, African, and South Asian Monsoon Regions to Explosive Volcanism and ENSO Forcing, J. Geophys. Res.-Atmos., 124, 7580–7598, https://doi.org/10.1029/2019jd030358, 2019.
Ezber, Y.: Assessment of the changes in the Etesians in the EURO-CORDEX regional model projections, Int. J. Climatol., 39, 1213–1229, https://doi.org/10.1002/joc.5872, 2019.
Gao, C. C., Robock, A., and Ammann, C.: Volcanic forcing of climate over the past 1500 years: An improved ice core-based index for climate models, J. Geophys. Res., 113, D23111, https://doi.org/10.1029/2008JD010239, 2008.
Gomez-Delgado, F. D., Gallego, D., Pena-Ortiz, C., Vega, I., Ribera, P., and Garcia-Herrera, R.: Long term variability of the northerly winds over the Eastern Mediterranean as seen from historical wind observations, Global Planet. Change, 172, 355–364, https://doi.org/10.1016/j.gloplacha.2018.10.008, 2019.
Hildret, W. and Fierstein, J.: The Novarupta-Katmai Eruption of 1912 – Largest Eruption of the Twentieth Century: Centennial Perspectives, U.S. Geological Survey Professional Paper 1791, p. 259, 2012.
Hochman, A., Alpert, P., Harpaz, T., Saaroni, H., and Messori, G.: A new dynamical systems perspective on atmospheric predictability: Eastern Mediterranean weather regimes as a case study, Science Advances, 5, eaau0936, https://doi.org/10.1126/sciadv.aau0936, 2019.
Iles, C. E. and Hegerl, G. C. : The global precipitation response to volcanic eruptions in the CMIP5 models, Environ Res Lett, 9, 104012, https://doi.org/10.1088/1748-9326/9/10/104012, 2014.
Khodri, M., Izumo, T., Vialard, J., Janicot, S., Cassou, C., Lengaigne, M., Mignot, J., Gastineau, G., Guilyardi, E., Lebas, N., Robock, A., and McPhaden, M. J.: Tropical explosive volcanic eruptions can trigger El Niño by cooling tropical Africa, Nat. Commun., 8, 778, https://doi.org/10.1038/s41467-017-00755-6, 2017.
Kitoh, A., Endo, H., Krishna Kumar, K., Cavalcanti, I. F. A., Goswami, P., and Zhou, T.: Monsoons in a changing world: A regional perspective in a global context, J. Geophys. Res.-Atmos., 118, 3053–3065, https://doi.org/10.1002/jgrd.50258, 2013.
Klesse, S., Ziehmer, M., Rousakis, G., Trouet, V., and Frank, D.: Synoptic drivers of 400 years of summer temperature and precipitation variability on Mt. Olympus, Greece, Clim. Dynam., 45, 807–824, https://doi.org/10.1007/s00382-014-2313-3, 2015.
Klippel, L., Krusic, P. J., Konter, O., St. George, S., Trouet, V., and Esper, J.: A 1200+ year reconstruction of temperature extremes for the northeastern Mediterranean region, Int. J. Climatol., 39, 2336–2350, https://doi.org/10.1002/joc.5955, 2019.
Knudsen, M. F., Jacobsen, B. H., Seidenkrantz, M. S., and Olsen, J.: Evidence for external forcing of the Atlantic Multidecadal Oscillation since termination of the Little Ice Age, Nat. Commun., 5, 3323, https://doi.org/10.1038/ncomms4323, 2014.
Kotroni, V., Lagouvardos, K., and Lalas, D.: The effect of the island of Crete on the Etesian winds over the Aegean Sea, Q. J. Roy. Meteor. Soc., 127, 1917–1937, https://doi.org/10.1002/qj.49712757604, 2001.
Kumar, K. K., Rajagopalan, B., and Cane, M. A.: On the weakening relationship between the indian monsoon and ENSO, Science, 284, 2156–2159, https://doi.org/10.1126/science.284.5423.2156, 1999.
Kumar, P. V., Naidu, C. V., and Prasanna, K.: Recent unprecedented weakening of Indian summer monsoon in warming environment, Theor. Appl. Climatol., 140, 467–486, https://doi.org/10.1007/s00704-019-03087-1, 2020.
Lelieveld, J., Hadjinicolaou, P., Kostopoulou, E., Chenoweth, J., El Maayar, M., Giannakopoulos, C., Hannides, C., Lange, M. A., Tanarhte, M., Tyrlis, E., and Xoplaki, E.: Climate change and impacts in the Eastern Mediterranean and the Middle East, Climatic Change, 114, 667–687, https://doi.org/10.1007/s10584-012-0418-4, 2012.
Liu, F., Chai, J., Wang, B., Liu, J., Zhang, X., and Wang, Z.: Global monsoon precipitation responses to large volcanic eruptions, Scientific Reports, 6, 24331, https://doi.org/10.1038/srep24331, 2016.
Logothetis, I., Tourpali, K., Misios, S., and Zanis, P.: Etesians and the summer circulation over East Mediterranean in Coupled Model Intercomparison Project Phase 5 simulations: Connections to the Indian summer monsoon, Int. J. Climatol., 40, 1118–1131, https://doi.org/10.1002/joc.6259, 2020.
Logothetis, I., Dafka, S., Tourpali, K., Misios, S., Zanis, P., Xoplaki, E., Luterbacher, J., and Papagianoulis, E.: The Southeast Asian monsoon and El Nino-Southern Oscillation impact on the summer atmospheric circulation of East Mediterranean during 20th century based on ERA-20C and CMIP5 simulations, Int. J. Climatol., 1–16, https://doi.org/10.1002/joc.7510, 2022.
Metaxas, D. A. and Bartzokas, A.: Pressure covariability over the Atlantic, Europe and N. Africa. application: Centers of action for temperature, winter precipitation and summer winds in Athens, Greece, Theor. Appl. Climatol., 49, 9–18, https://doi.org/10.1007/BF00866284, 1994.
NOAA-CIRES-DOE: NOAA/CIRES/DOE 20th Century Reanalysis (V3), NOAA PSL [data set], Boulder, Colorado, USA, https://psl.noaa.gov/data/gridded/data.20thC_ReanV3.html, last access: 17 May 2022.
Otto-Bliesner, B. L., Brady, E. C., Fasullo, J., Jahn, A., Landrum, L., Stevenson, S., Rosenbloom, N., Mai, A., and Strand, G.: Climate Variability and Change since 850 CE: An Ensemble Approach with the Community Earth System Model, B. Am. Meteorol. Soc., 97, 735–754, https://doi.org/10.1175/BAMS-D-14-00233.1, 2016 (data available at: https://www.earthsystemgrid.org/, last access: 17 May 2022).
Paik, S., Min, S. K., Iles, C. E., Fischer, E. M., and Schurer, A. P.: Volcanic-induced global monsoon drying modulated by diverse El Nino responses, Science Advances, 6, eaba1212, https://doi.org/10.1126/sciadv.aba1212, 2020.
Pausata, F. S. R., Chafik, L., Caballero, R., and Battisti, D. S.: Impacts of high-latitude volcanic eruptions on ENSO and AMOC, P. Natl. Acad. Sci. USA, 112, 13784–13788, https://doi.org/10.1073/pnas.1509153112, 2015.
Poupkou, A., Zanis, P., Nastos, P., Papanastasiou, D., Melas, D., Tourpali, K., and Zerefos, C.: Present climate trend analysis of the Etesian winds in the Aegean Sea, Theor. Appl. Climatol., 106, 459–472, https://doi.org/10.1007/s00704-011-0443-7, 2011.
Rizou, D., Flocas, H. A., Hatzaki, M., and Bartzokas, A.: A Statistical Investigation of the Impact of the Indian Monsoon on the Eastern Mediterranean Circulation, Atmosphere-Basel, 9, 90, https://doi.org/10.3390/atmos9030090, 2018.
Robock, A.: Volcanic eruptions and climate, Rev. Geophys., 38, 191–219, https://doi.org/10.1029/1998RG000054, 2000.
Rodwell, M. J. and Hoskins, B. J.: Subtropical anticyclones and summer monsoons, J. Climate, 14, 3192–3211, https://doi.org/10.1175/1520-0442(2001)014<3192:SAASM>2.0.CO;2, 2001.
Sharmila, S., Joseph, S., Sahai, A. K., Abhilash, S., and Chattopadhyay, R.: Future projection of Indian summer monsoon variability under climate change scenario: An assessment from CMIP5 climate models, Global Planet. Change, 124, 62–78, https://doi.org/10.1016/j.gloplacha.2014.11.004, 2015.
Singh, M., Krishnan, R., Goswami, B., Choudhury, A. D., Swapna, P., Vellore, R., Prajeesh, A. G., Sandeep, N., Venkataraman, C., Donner, R. V., Marwan, N., and Kurths, J.: Fingerprint of volcanic forcing on the ENSO-Indian monsoon coupling, Science Advances, 6, eaba8164, https://doi.org/10.1126/sciadv.aba8164, 2020.
Slivinski, L. C., Compo, G. P., Whitaker, J. S., Sardeshmukh, P. D., Giese, B. S., McColl, C., Allan, R., Yin, X. G., Vose, R., Titchner, H., Kennedy, J., Spencer, L. J., Ashcroft, L., Bronnimann, S., Brunet, M., Camuffo, D., Cornes, R., Cram, T. A., Crouthamel, R., Dominguez-Castro, F., Freeman, J. E., Gergis, J., Hawkins, E., Jones, P. D., Jourdain, S., Kaplan, A., Kubota, H., Le Blancq, F., Lee, T. C., Lorrey, A., Luterbacher, J., Maugeri, M., Mock, C. J., Moore, G. W. K., Przybylak, R., Pudmenzky, C., Reason, C., Slonosky, V. C., Smith, C. A., Tinz, B., Trewin, B., Valente, M. A., Wang, X. L., Wilkinson, C., Wood, K., and Wyszynski, P.: Towards a more reliable historical reanalysis: Improvements for version 3 of the Twentieth Century Reanalysis system, Q. J. Roy. Meteor. Soc., 145, 2876–2908, https://doi.org/10.1002/qj.3598, 2019.
Stevenson, S., Brady, E., Fasullo, J., Otto-Bliesner, B., and Stevenson, S.: “El Niño Like” Hydroclimate Responses to Last Millennium Volcanic Eruptions, J. Climate, 29, 2907–2921, https://doi.org/10.1175/jcli-d-15-0239.1, 2016.
Tejedor, E., Steiger, N. J., Smerdon, J. E., Serrano-Notivoli, R., and Vuille, M.: Global hydroclimatic response to tropical volcanic eruptions over the last millennium, P. Natl. Acad. Sci. USA, 118, e2019145118, https://doi.org/10.1073/pnas.2019145118, 2021.
Timmreck, C.: Modeling the climatic effects of large explosive volcanic eruptions, WIREs Clim. Change, 3, 545–564, https://doi.org/10.1002/wcc.192, 2012.
Toohey, M., Krüger, K., Schmidt, H., Timmreck, C., Sigl, M., Stoffel, M., and Wilson, R.: Disproportionately strong climate forcing from extratropical explosive volcanic eruptions, Nat. Geosci., 12, 100–107, https://doi.org/10.1038/s41561-018-0286-2, 2019.
Trenberth, K. E. and Dai, A.: Effects of Mount Pinatubo volcanic eruption on the hydrological cycle as an analog of geoengineering, Geophys. Res. Lett., 34, L15702, https://doi.org/10.1029/2007GL030524, 2007.
Tyrlis, E. and Lelieveld, J.: Climatology and Dynamics of the Summer Etesian Winds over the Eastern Mediterranean, J. Atmos. Sci., 70, 3374–3396, https://doi.org/10.1175/Jas-D-13-035.1, 2013.
Tyrlis, E., Lelieveld, J., and Steil, B.: The summer circulation over the eastern Mediterranean and the Middle East: influence of the South Asian monsoon, Clim. Dynam., 40, 1103–1123, https://doi.org/10.1007/s00382-012-1528-4, 2013.
Tyrlis, E., Tymvios, F. S., Giannakopoulos, C., and Lelieveld, J.: The role of blocking in the summer 2014 collapse of Etesians over the eastern Mediterranean, J. Geophys. Res.-Atmos., 120, 6777–6792, https://doi.org/10.1002/2015JD023543, 2015.
Zanchettin, D., Khodri, M., Timmreck, C., Toohey, M., Schmidt, A., Gerber, E. P., Hegerl, G., Robock, A., Pausata, F. S. R., Ball, W. T., Bauer, S. E., Bekki, S., Dhomse, S. S., LeGrande, A. N., Mann, G. W., Marshall, L., Mills, M., Marchand, M., Niemeier, U., Poulain, V., Rozanov, E., Rubino, A., Stenke, A., Tsigaridis, K., and Tummon, F.: The Model Intercomparison Project on the climatic response to Volcanic forcing (VolMIP): experimental design and forcing input data for CMIP6, Geosci. Model Dev., 9, 2701–2719, https://doi.org/10.5194/gmd-9-2701-2016, 2016.
Ziv, B., Saaroni, H., and Alpert, P.: The factors governing the summer regime of the eastern Mediterranean, Int. J. Climatol., 24, 1859–1871, https://doi.org/10.1002/joc.1113, 2004.
Zuo, M., Zhou, T. J., and Man, W. M.: Hydroclimate Responses over Global Monsoon Regions Following Volcanic Eruptions at Different Latitudes, J. Climate, 32, 4367–4385, https://doi.org/10.1175/jcli-d-18-0707.1, 2019.