the Creative Commons Attribution 4.0 License.
the Creative Commons Attribution 4.0 License.
 | 20 Sep 2023
Exploiting the signal-to-noise ratio in multi-system predictions of boreal summer precipitation and temperature
Juan Camilo Acosta Navarro
Andrea Toreti
Droughts and heatwaves are among the most impactful climate extremes. Their co-occurrence can have adverse consequences on natural and human systems. Early information on their possible occurrence on seasonal timescales is beneficial for many stakeholders. Seasonal climate forecasts have become openly available to the community, but a wider use is currently hindered by limited skill in certain regions and seasons. Here we show that a simple forecast metric from a multi-system ensemble, the signal-to-noise ratio, can help overcome some limitations. Forecasts of mean daily near-surface air temperature and precipitation in boreal summers with a high signal-to-noise ratio tend to coincide with observed larger deviations from the mean than summers with a low signal-to-noise ratio. The signal-to-noise ratio of the ensemble predictions may serve as a complementary measure of forecast reliability that could benefit users of climate predictions.
- Article
(8165 KB) - Full-text XML
- BibTeX
- EndNote


Droughts are typically slow-onset climate extreme events (Mishra and Singh, 2010), yet they can be disruptive and affect millions of people every year (Below et al., 2007; Enenkel et al., 2020). Heatwaves can intensify and trigger a faster drought evolution (Bevacqua et al., 2022). Compound droughts and heatwaves can strongly impact socio-economic and ecological systems and may even compromise our ability to reach the United Nations (UN) sustainable development goal on climate action while strongly reducing the Earth system's current natural capacity to absorb and store carbon (Yin et al., 2023). The use of seasonal climate forecasts can provide actionable information to reduce the risks and the impacts of these events on key sectors like agriculture, energy, transport, and water supply (Buontempo et al., 2018; Ceglar and Toreti, 2021).
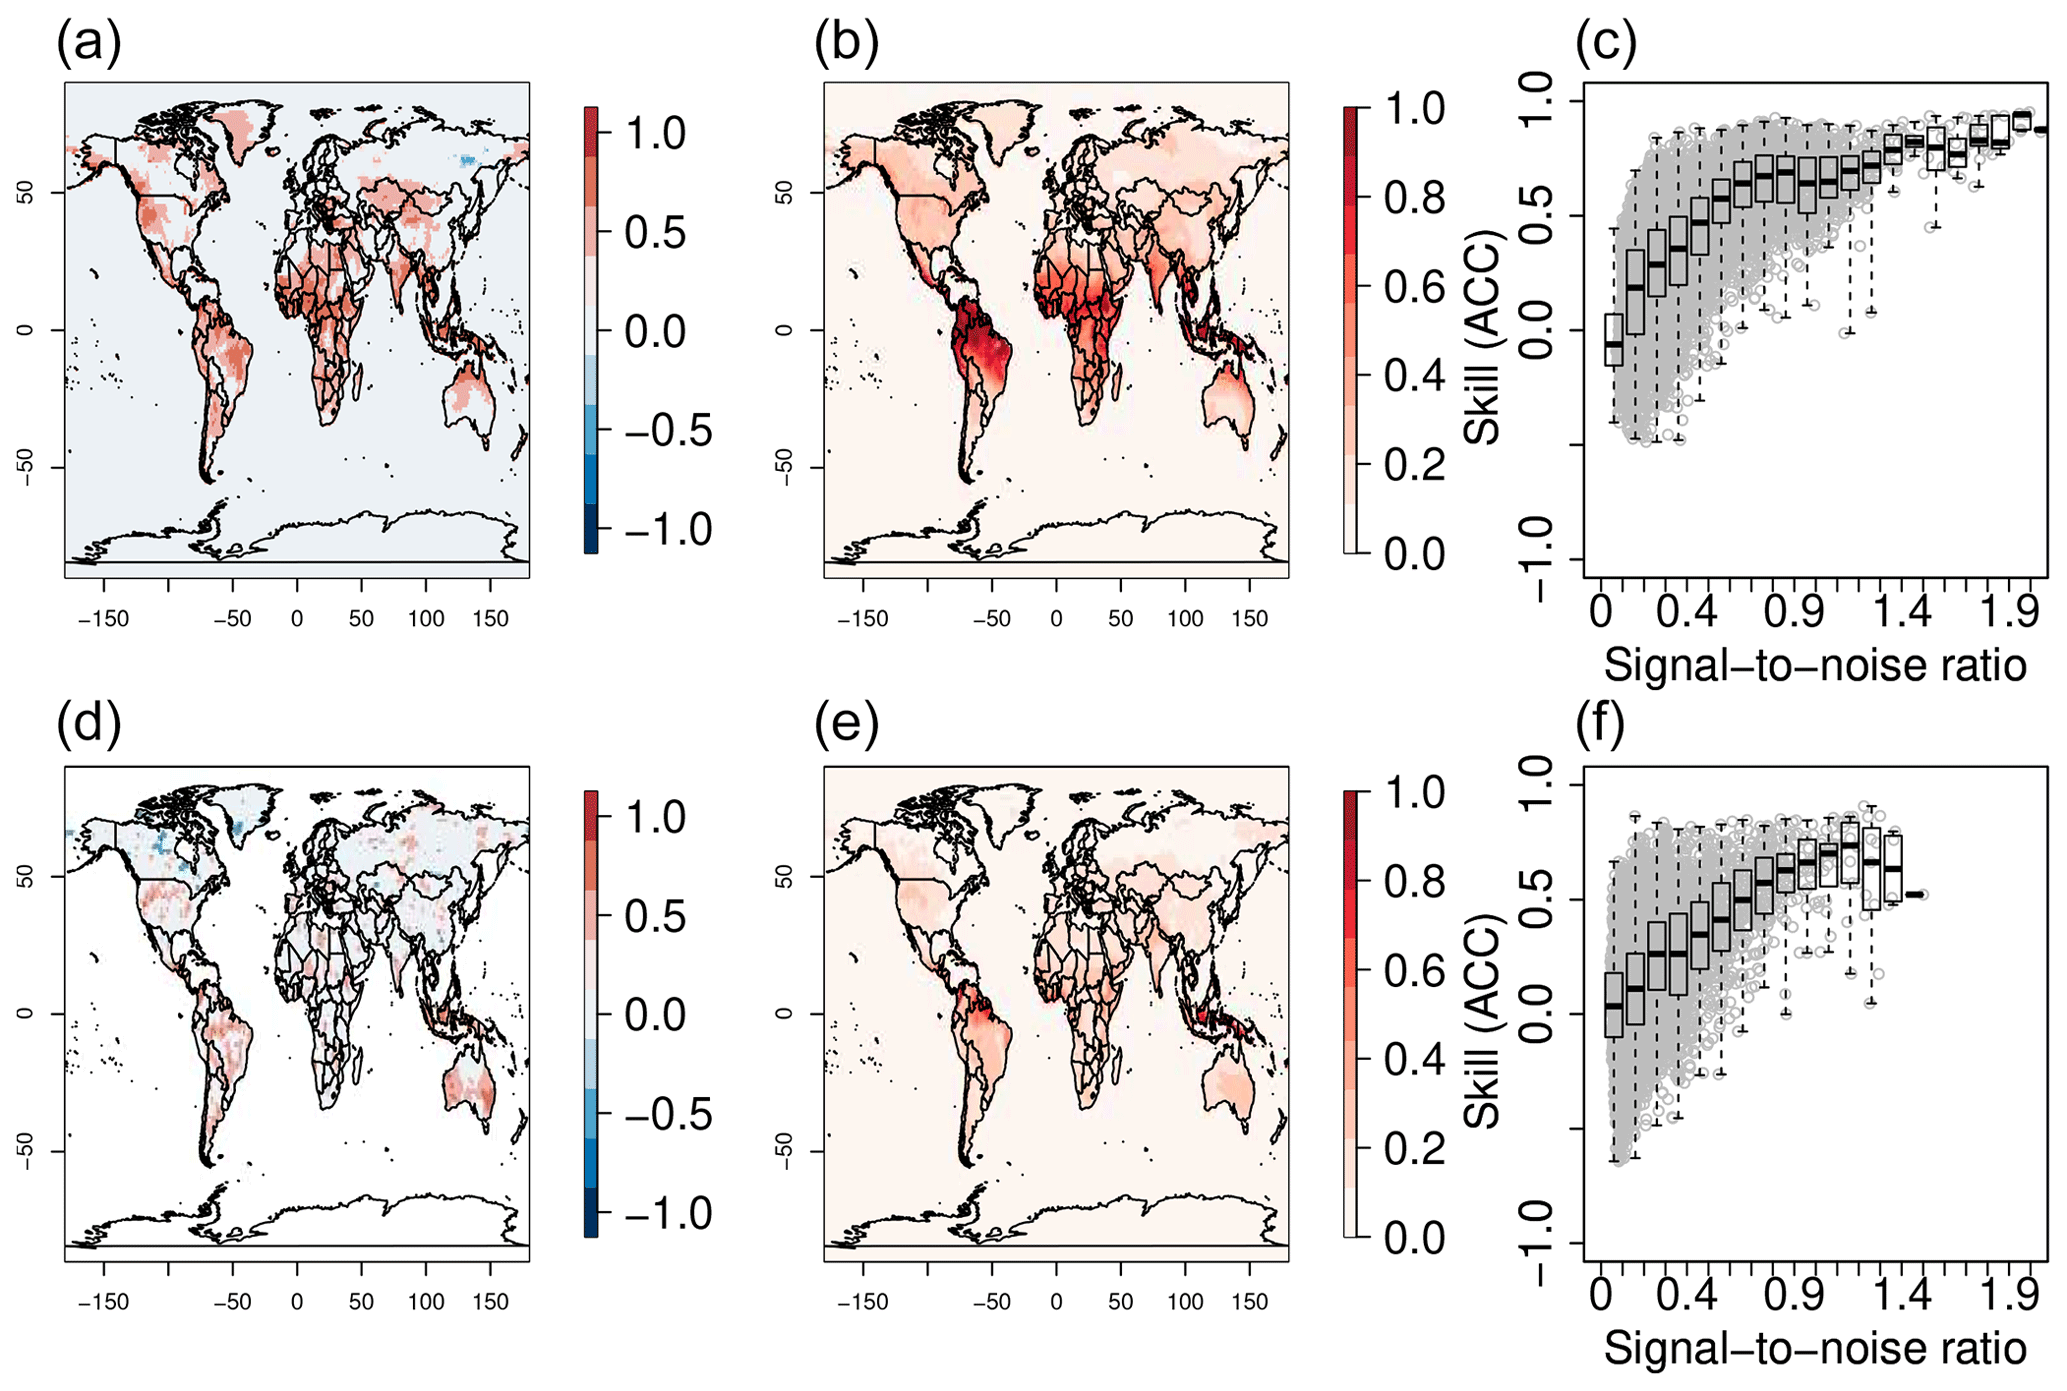
Figure 1June–August skill (ACC), time-averaged SNR, and scatterplots of the local relation between the ACC and SNR for (a–c) T2m and (d–f) precipitation. Each gray dot in (c) and (f) represents the values of the ACC and SNR at each grid box. Only statistically significant values with a 90 % confidence based on a t test are displayed in (a) and (d). The re-forecasts are initialized every May.
In the last couple of decades, climate predictions have shown important progress in anticipating the evolution of various components of the climate system across the subseasonal-to-decadal time range (Merryfield et al., 2020; Meehl et al., 2021). A combination of multiple forecast systems has shown overall benefits as compared with single systems and can improve forecast quality up to a certain extent (Hagedorn et al., 2005; Mishra et al., 2019). In spite of the recent progress, climate predictions still exhibit low to moderate skill in many regions and seasons (e.g., European summer; Mishra et al., 2019), something that limits their use and represents a barrier for stakeholders. Furthermore, multiple studies have shown that large ensembles are required to achieve skillful predictions, something that seems to be related to the forecast systems being more skillful at predicting the real climate than at predicting their own realizations (i.e., ensemble members). This odd phenomenon has been called the signal-to-noise paradox (Eade et al., 2014; Scaife and Smith, 2018; Smith et al., 2020). It is particularly evident in the Euro-Atlantic region during winter both on seasonal and decadal timescales. However, boreal summer predictions have been generally overlooked. A recent study based on a single forecasting system has shown that sampling years with a high signal-to-noise ratio (SNR) results in more skillful predictions of monthly temperatures in Japan throughout the year (Doi et al., 2022).
In this study we exploit multi-system ensembles to test whether specific boreal summers with higher-than-normal predictability can be detected through the local relation between skill and the SNR. We explore this for near-surface air temperature and precipitation, both locally and on large aggregated mid-latitude regions of the Northern Hemisphere.
This analysis is based on seasonal re-forecasts (also known as hindcasts) of mean boreal summer precipitation and 2 m mean daily temperature (T2m) for the period 1993–2016 from ECMWF SEAS5 (S5; Johnson et al., 2019), UKMO (UK Meteorological Office) GloSea6 (S600; MacLachlan et al., 2015), Météo-France (S8; Batté et al., 2021), CMCC (Centro Euro-Mediterraneo sui Cambiamenti Climatici) (S35; Gualdi et al., 2020), and DWD (Deutscher Wetterdienst) (S21; Baehr et al., 2015), available from the Copernicus C3S Climate Data Store. The observationally based datasets to evaluate the re-forecasts are ERA5 (Hersbach al., 2020) for T2m and GPCC (Global Precipitation Climatology Centre) (Schnider et al., 2011) for precipitation. The use of summer mean T2m is not intended to characterize single heatwaves but rather to estimate average daily deviations from the mean on a seasonal scale. In a climatological sense, more intense, more frequent, or longer-than-normal heatwaves generally define hot summers, and hence average T2m may be seen as a seasonal integrator of heatwave activity. Forecast skill is evaluated with the anomaly correlation coefficient (ACC) between the ensemble mean and the observational reference. To complement the skill estimates of the ACC, two additional deterministic skill metrics are computed: the mean squared skill score (MSSS; Murphy, 1988) and the Gilbert skill score (GSS; WMO, 2014). The mean squared skill score compares the mean squared error of the forecasts with the mean squared error of the climatological value. It ranges from negative infinity to 1, and values above 0 indicate skill in the predictions. The GSS measures the fraction of correctly predicted events over the total number of predicted events plus misses and takes into consideration the randomly predicted events. The thresholds to define event/non-event are the top and bottom 25 % summers for T2m (hot) and precipitation (dry), respectively. Standardization of the anomalies of each ensemble member and the observational reference data is performed prior to the analysis. This step guarantees that each member from each system has a year-to-year variability comparable to the observed one. Additionally, the standardized T2m anomalies are linearly detrended at the grid level and for each member of the re-forecasts and in ERA5 to isolate the impact of the long-term warming as much as possible.
Following Doi et al. (2022), the SNR is calculated as SNR , where μe is the multi-system ensemble mean and σe is the multi-system standard deviation after standardization, computed across ensemble members for every summer (June–August) and for each grid box; 25 members per system are used to have an equal contribution from each system.
Figure 1 displays spatial maps of the mean (boreal) summer T2m ACC and time-averaged SNR and a scatterplot which shows the local relation between the ACC and SNR. On average, skill values over land increase with higher SNR values. Negative values of the ACC are nearly non-existent when the threshold of the SNR exceeds the value of about 0.5 in the same grid box. Statistically significant skill in T2m is mostly confined to the tropics and subtropics. However, significant skill is also found in western North America, the eastern Mediterranean, central Asia, and southern South America. Notable exceptions in the tropics are Congo and parts of the Amazon rainforests. The patterns of the SNR largely mirror those of the ACC. Generally, there is a good agreement between areas of high skill (ACC) and areas with a high SNR, something that is further confirmed by the local relation between the ACC and SNR (Fig. 1c).
Precipitation follows a similar behavior in terms of the ACC and SNR, although statistically significant skill is less widespread (Fig. 1d–f). Areas under the influence of El Niño–Southern Oscillation (ENSO; Lenssen et al., 2020) appear as regions with a significant ACC and high SNR. Skillful values are mostly located in the Americas, the Maritime Continent, and Australia. Precipitation skill and the SNR in Africa and Asia are much lower, making these the regions with the largest qualitative differences between the two variables.
In Fig. 2 we show the effect of the ensemble coherence on skill. Ensemble coherence is defined as the inverse of the ensemble standard deviation (σe) minus 1. The spatial distribution of time-averaged ensemble coherence displays many similarities to the SNR for both T2m and precipitation, although the signal is clearly dominated by the tropics and subtropics with virtually no contribution from the extratropics, except for a minor one from T2m in western North America and from precipitation in the Middle East (Fig. 2a, c). In terms of the local relation between ensemble coherence and skill, T2m displays a clear increase in skill with higher values of coherence (Fig. 2b). Skill is virtually always positive when coherence values exceed 0.3, implying that ensemble spread may also be a good indicator of skill for T2m, similar to the SNR. For precipitation there is a weaker relation between skill and ensemble coherence than for T2m as there appear to be as many locations of high coherence with low skill as locations with high skill and high coherence (Fig. 2d). This may not only be a result of a weaker relation between skill and ensemble coherence than between skill and the SNR but may also be at least partially a result of the large uncertainty in observed precipitation in many regions.
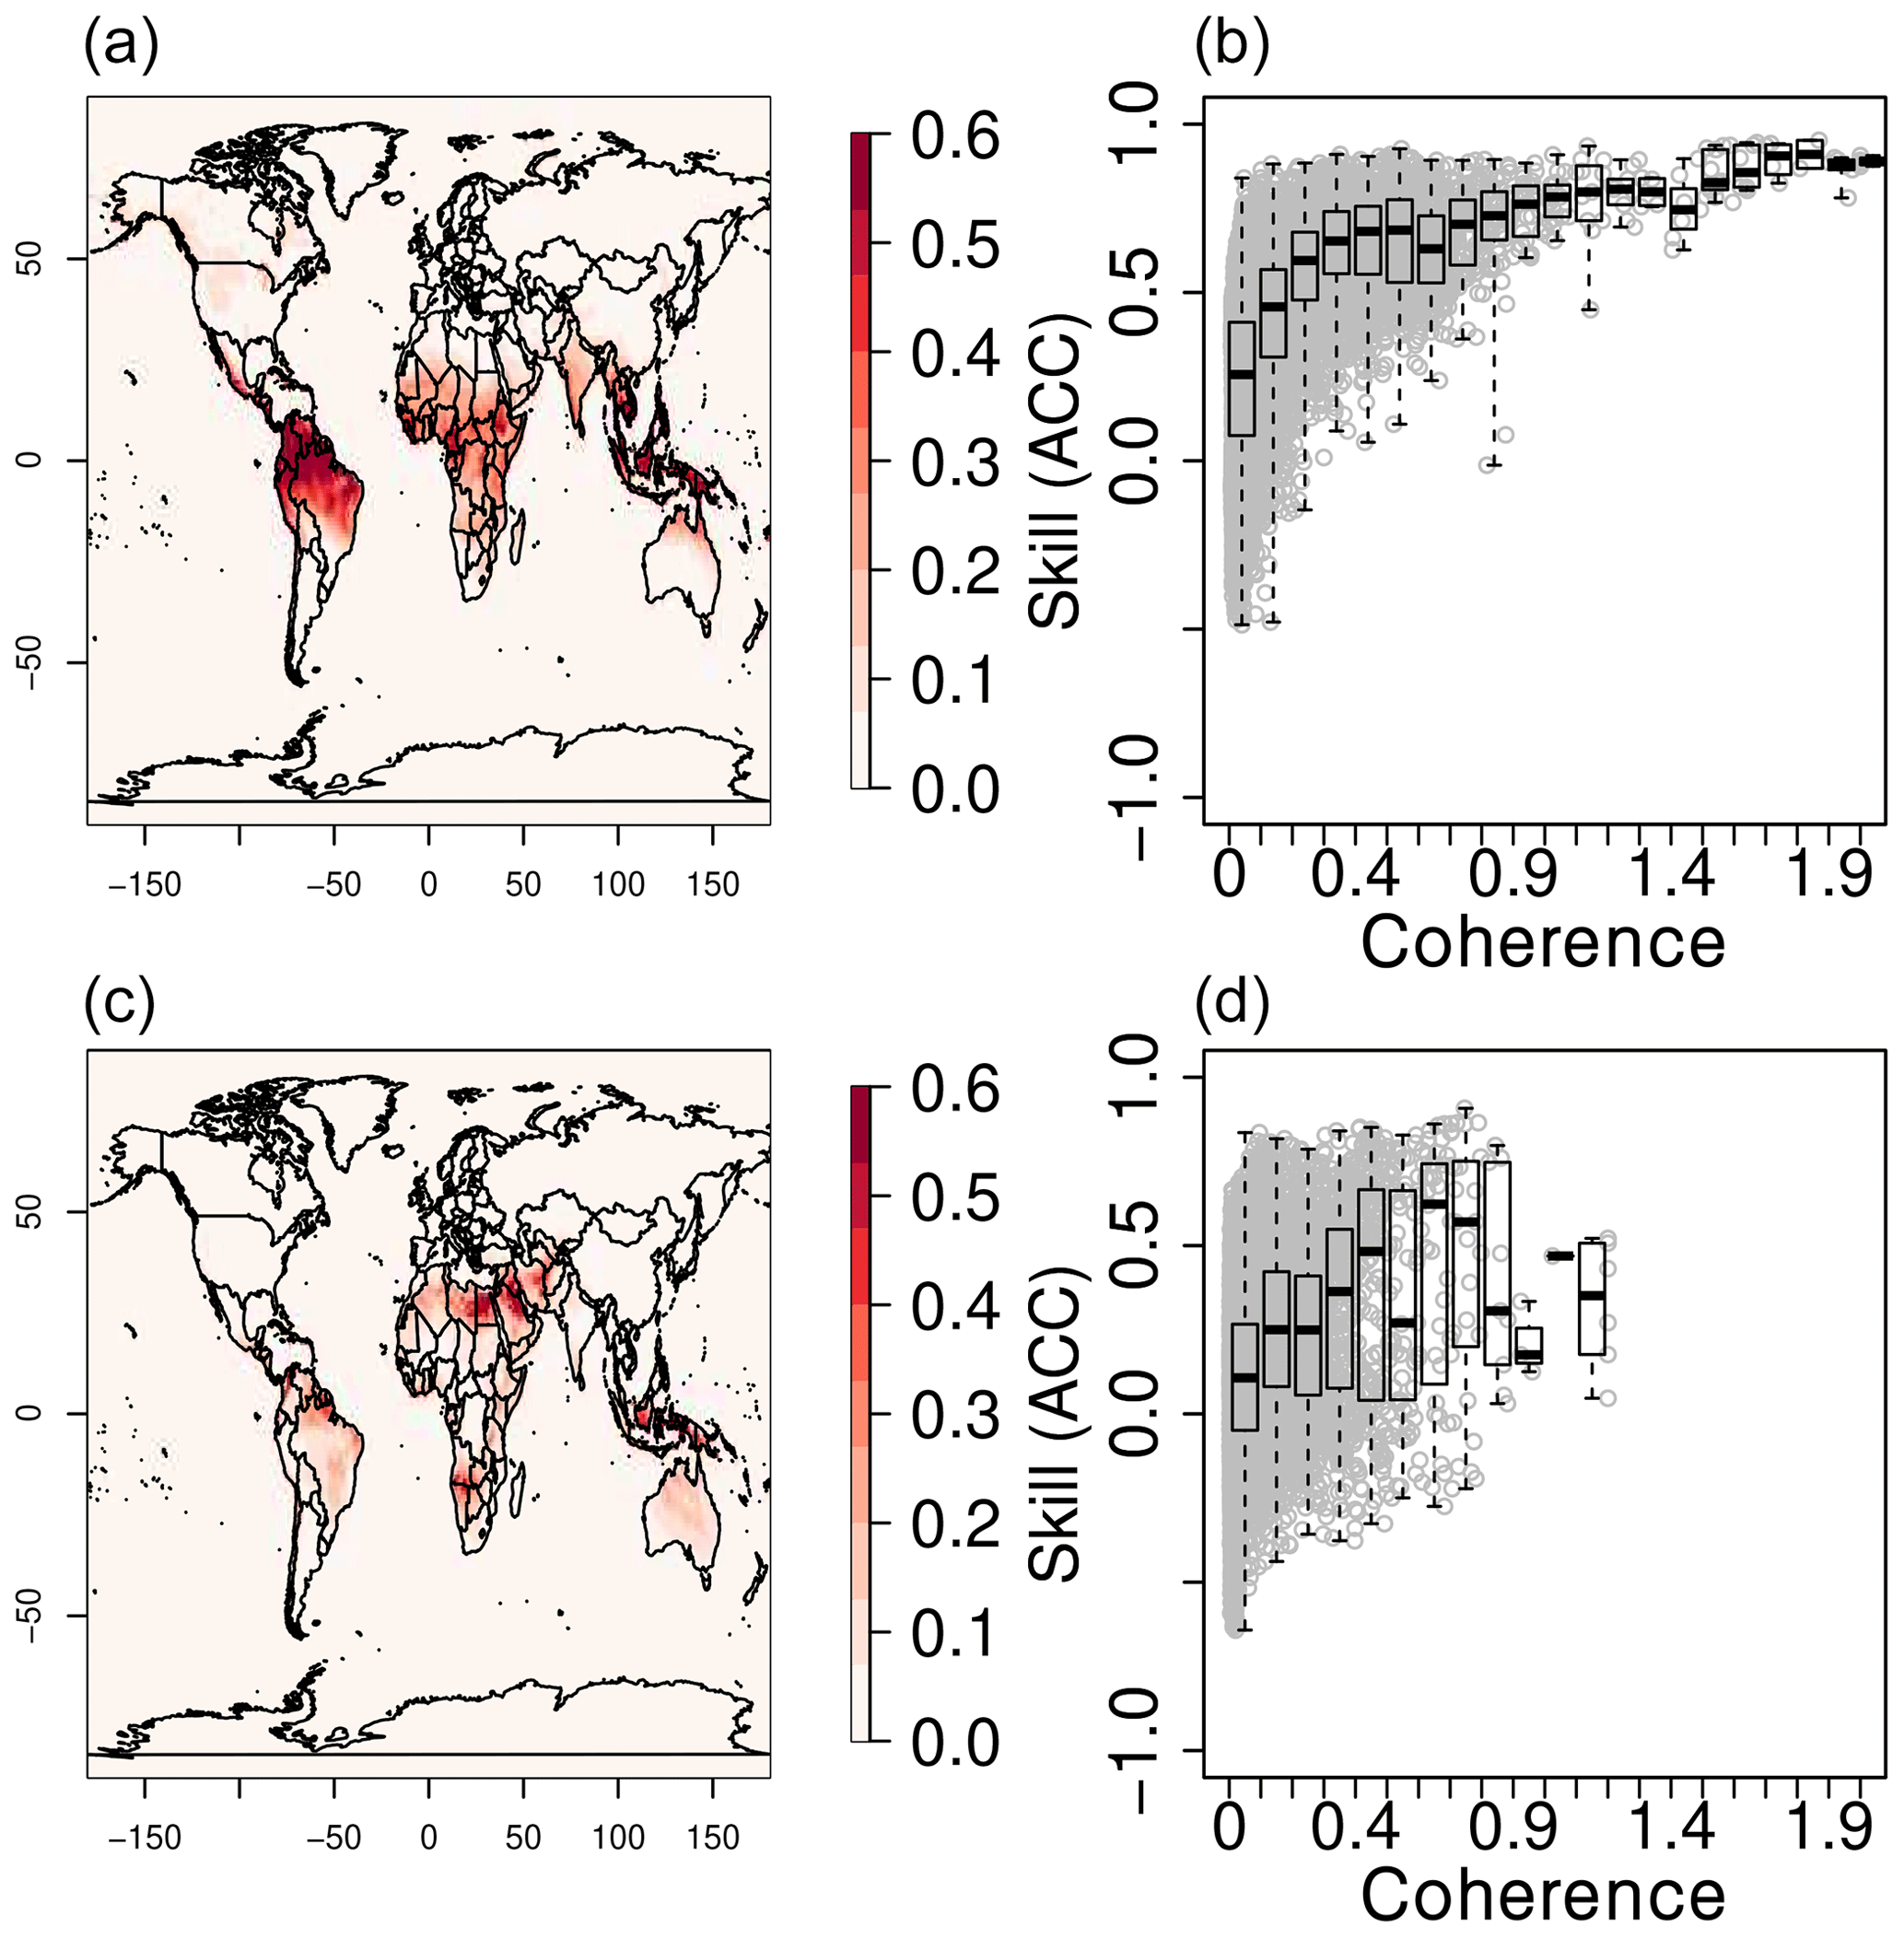
Figure 2June–August time-averaged ensemble coherence and scatterplots of the local relation between the ACC and ensemble coherence for (a–b) T2m and (c–d) precipitation. Each gray dot in (b) and (d) represents the values of the ACC and ensemble coherence at each grid box. The re-forecasts are initialized every May.
Based on the observed link between skill and the SNR, we use the latter one as the single criterion to exclude from the re-forecasts years with very low and very high values to understand their impact on skill. When 25 % of the years (6 years in total) with the highest SNR (Fig. 3a) are excluded, the results overall show much lower values of the ACC than when only 25 % of the years with the lowest SNR are excluded (Fig. 3b). Furthermore, differences between the latter and the former result (in many cases) in values that are more highly statistically significant than the ACC computed when selecting only years without the highest SNR (Fig. 3a, c). This result highlights the importance that these extreme SNR years can have on skill. In fact, only skill values that are computed by excluding the bottom 25 % of SNR years (Fig. 3b) are comparable to the ones estimated when all years are used for the computation (Fig. 1a).
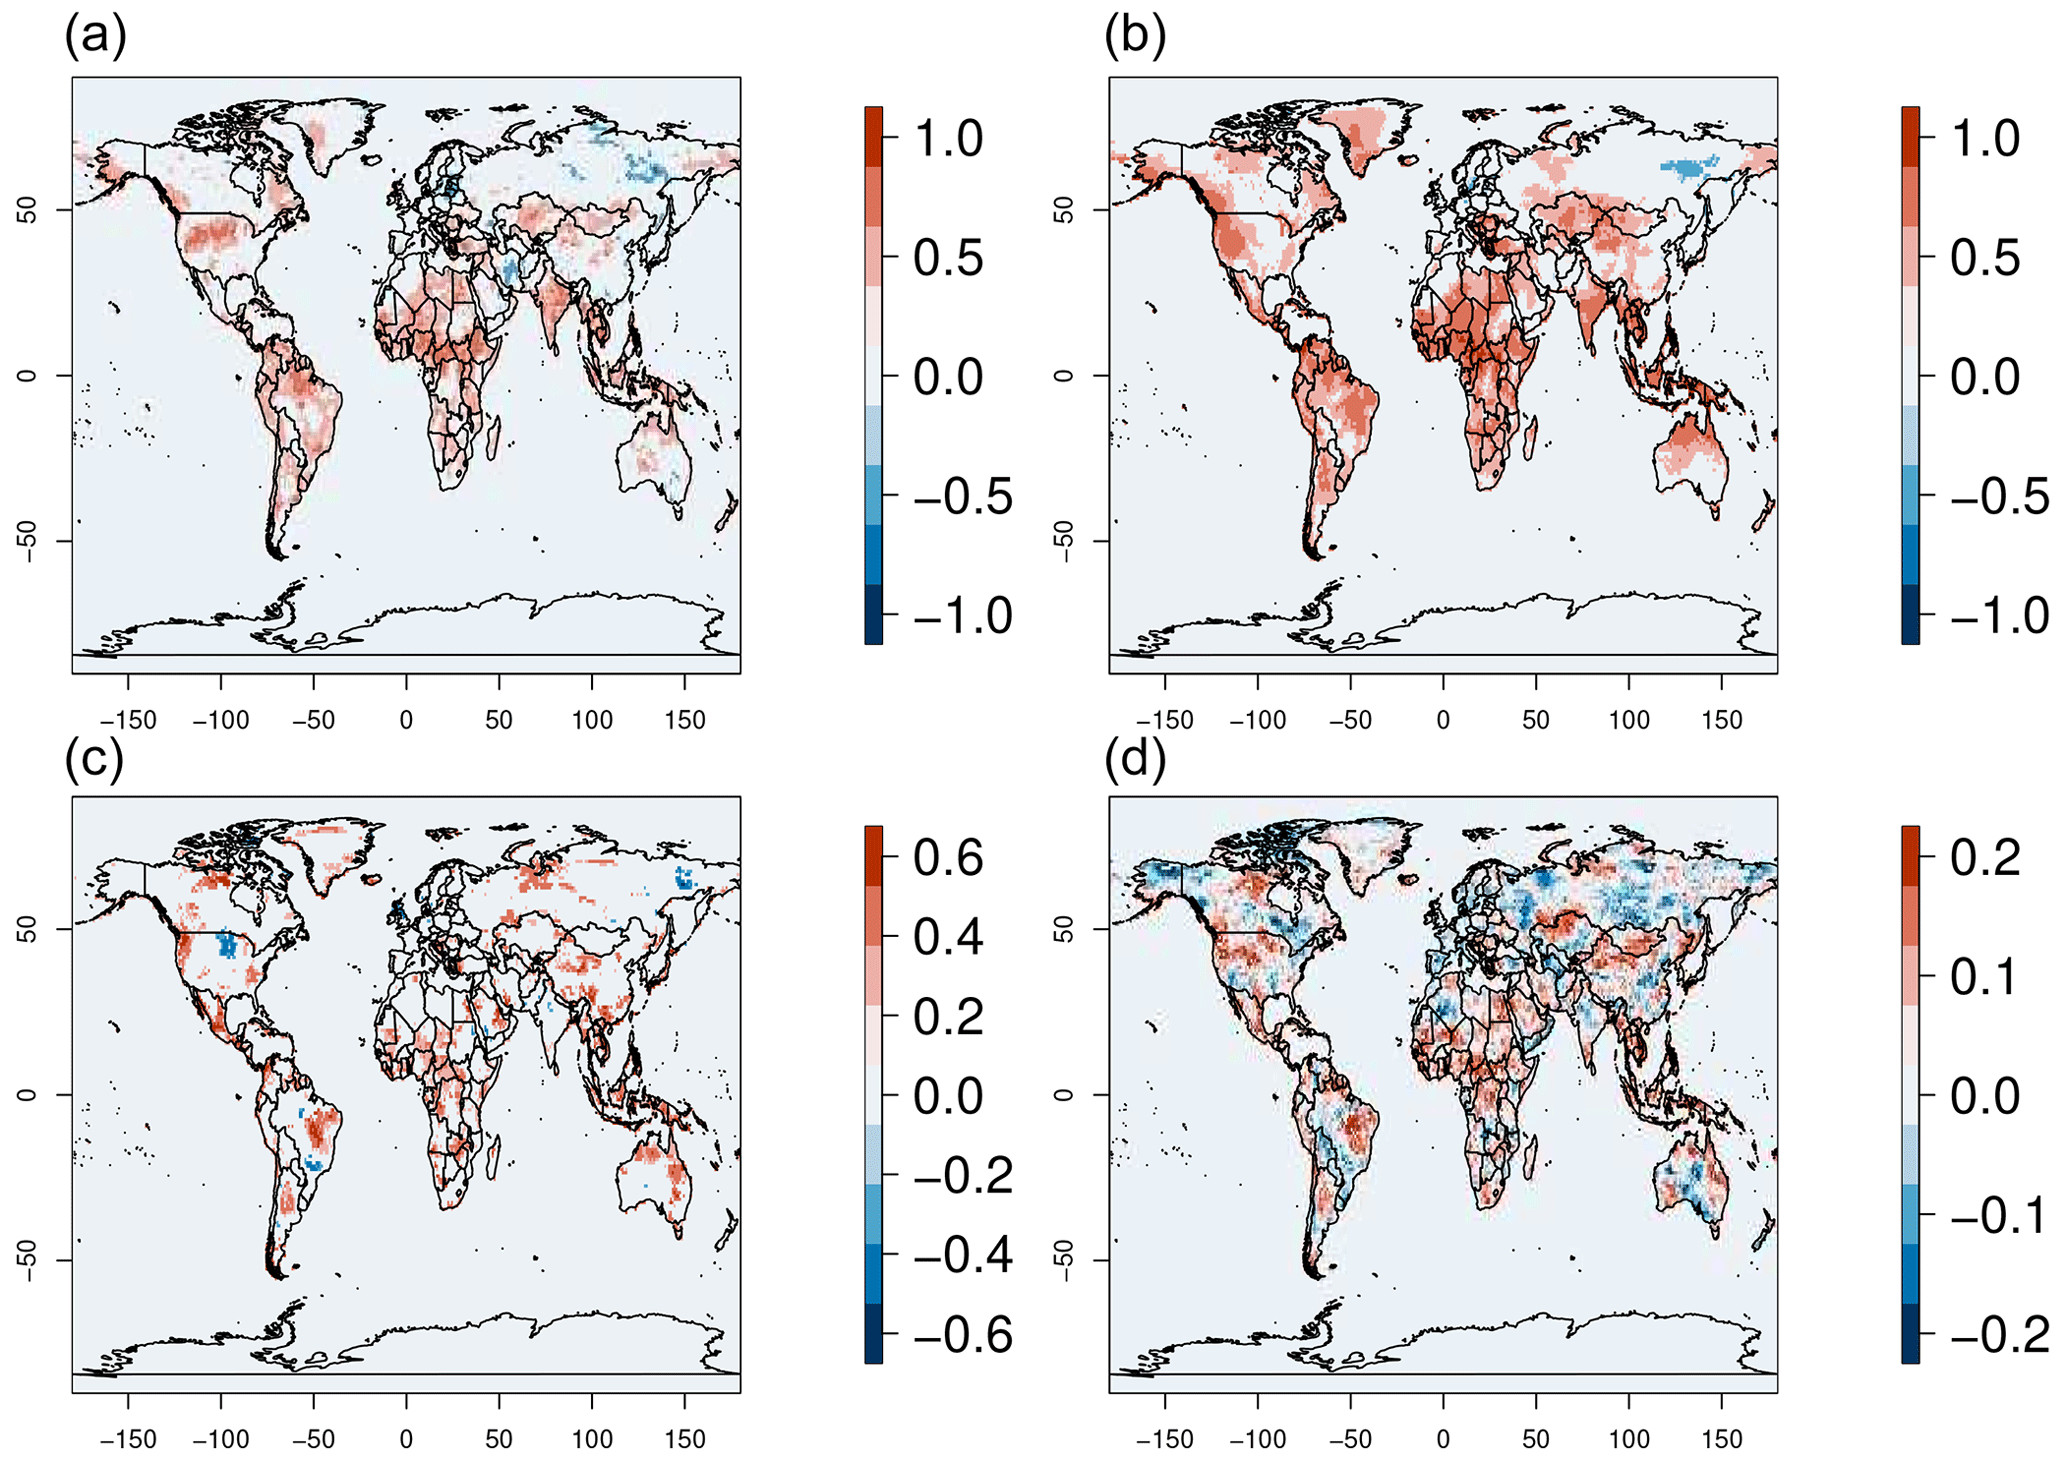
Figure 3(a, b) Skill (ACC) of T2m predictions excluding 25 % of the years with the (a) highest and (b) lowest local SNR. (c) Difference between (a) and (b). (d) Difference in the time-averaged absolute deviation from the mean in ERA5 T2m, excluding years with the 25 % lowest and highest local SNR, respectively. Only statistically significant values with a 90 % confidence based on a t test are displayed in (a–c). The re-forecasts are initialized every May.
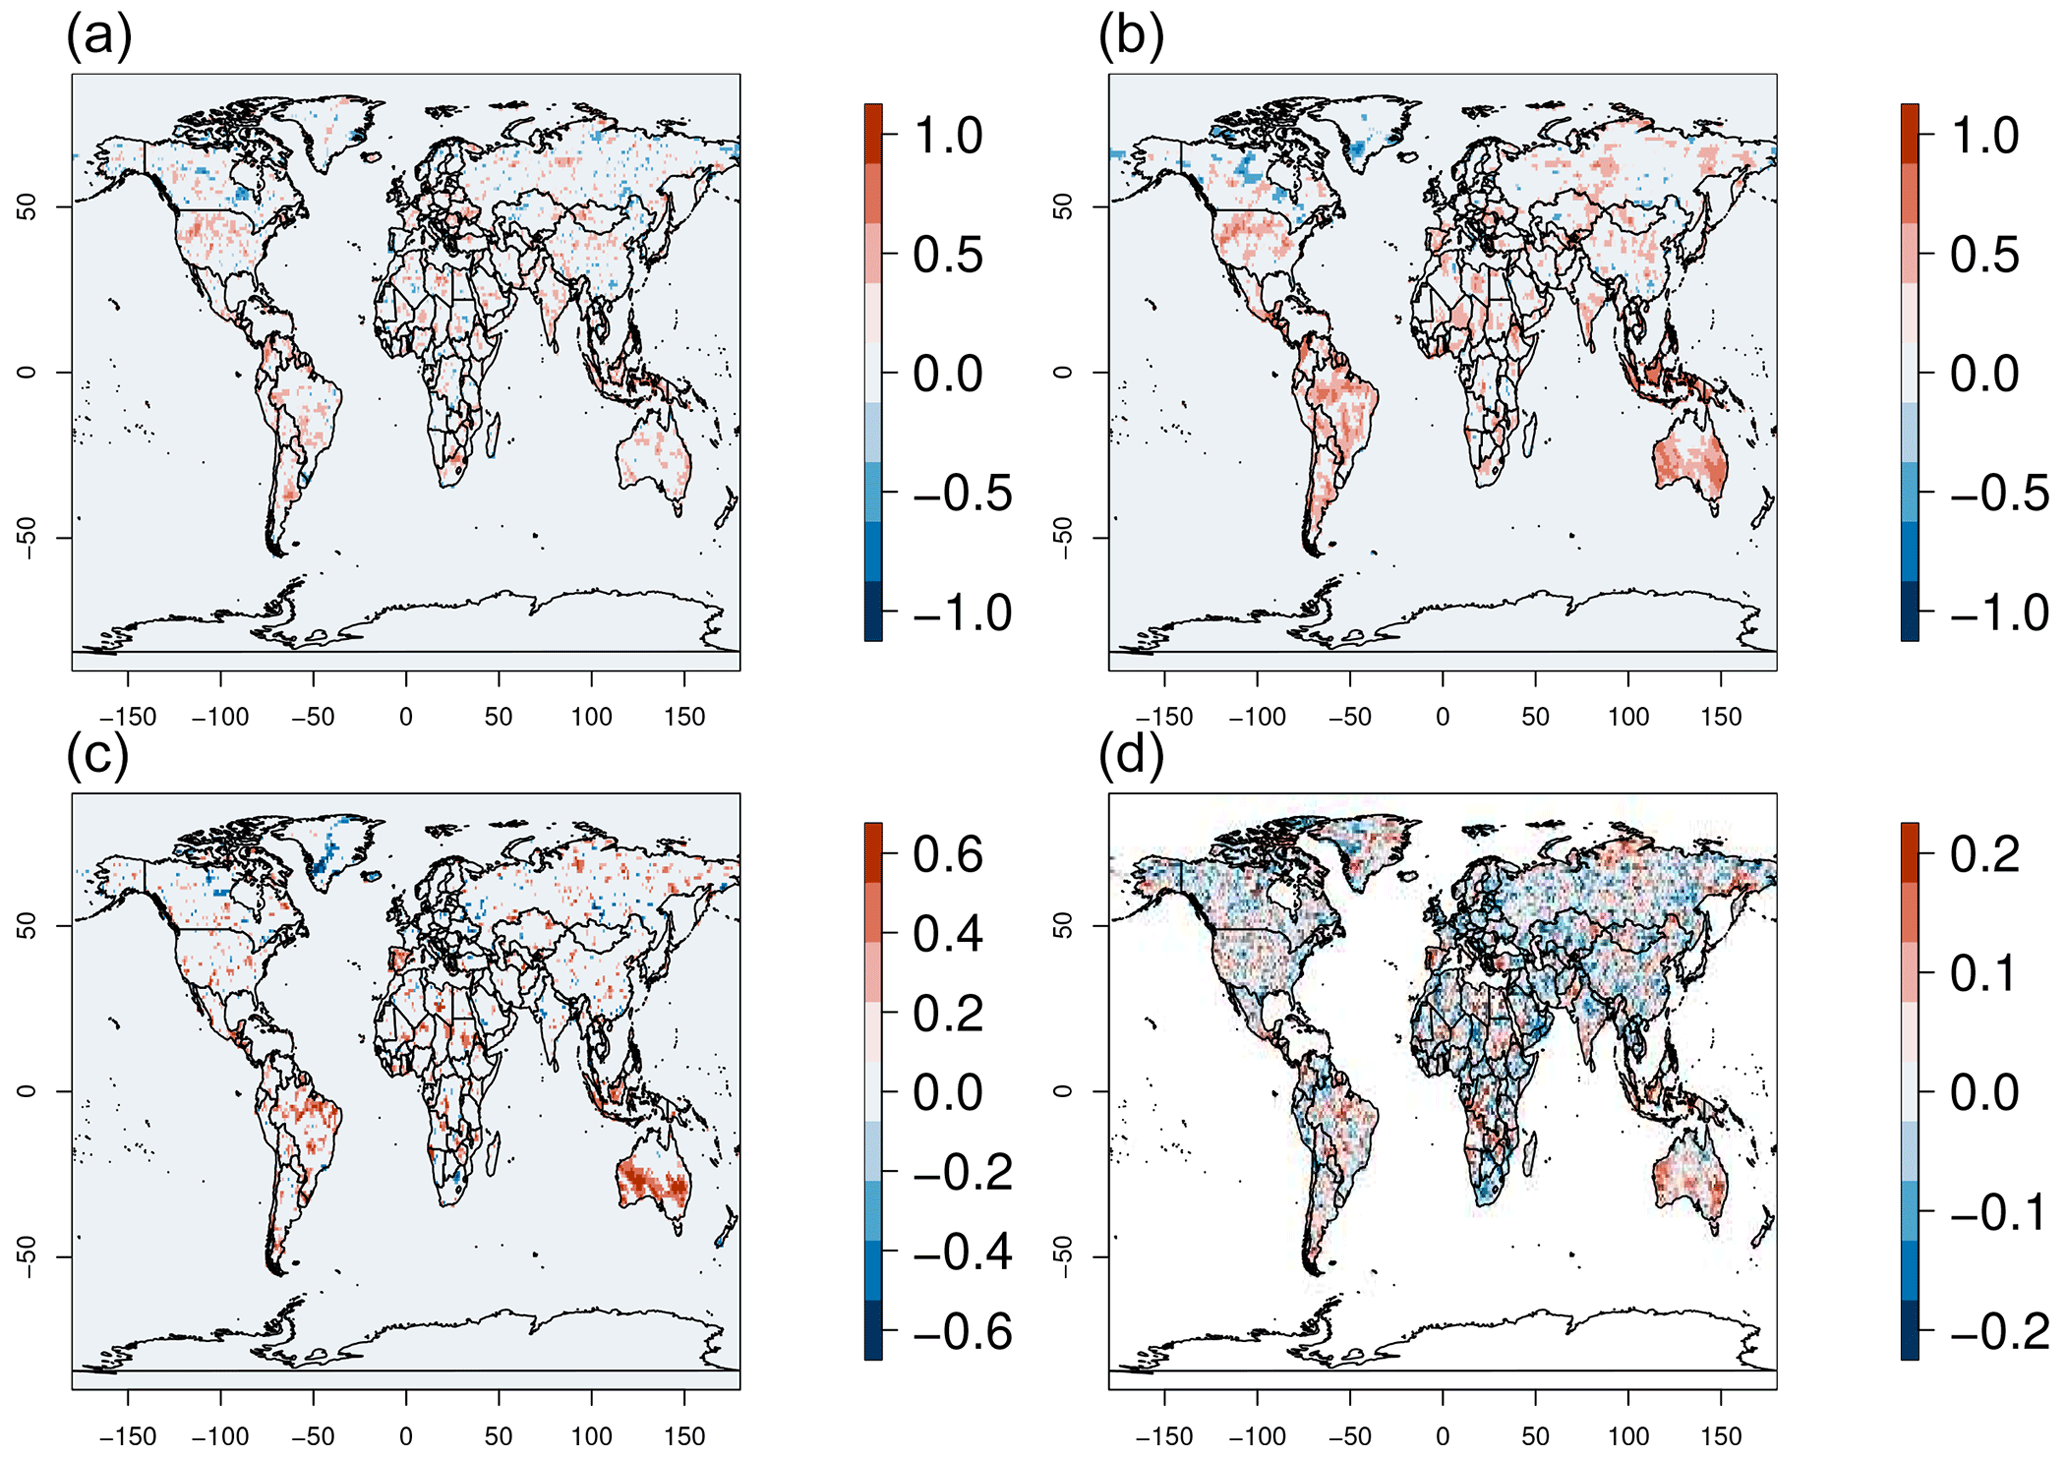
Figure 4Same as Fig. 3 but for precipitation.
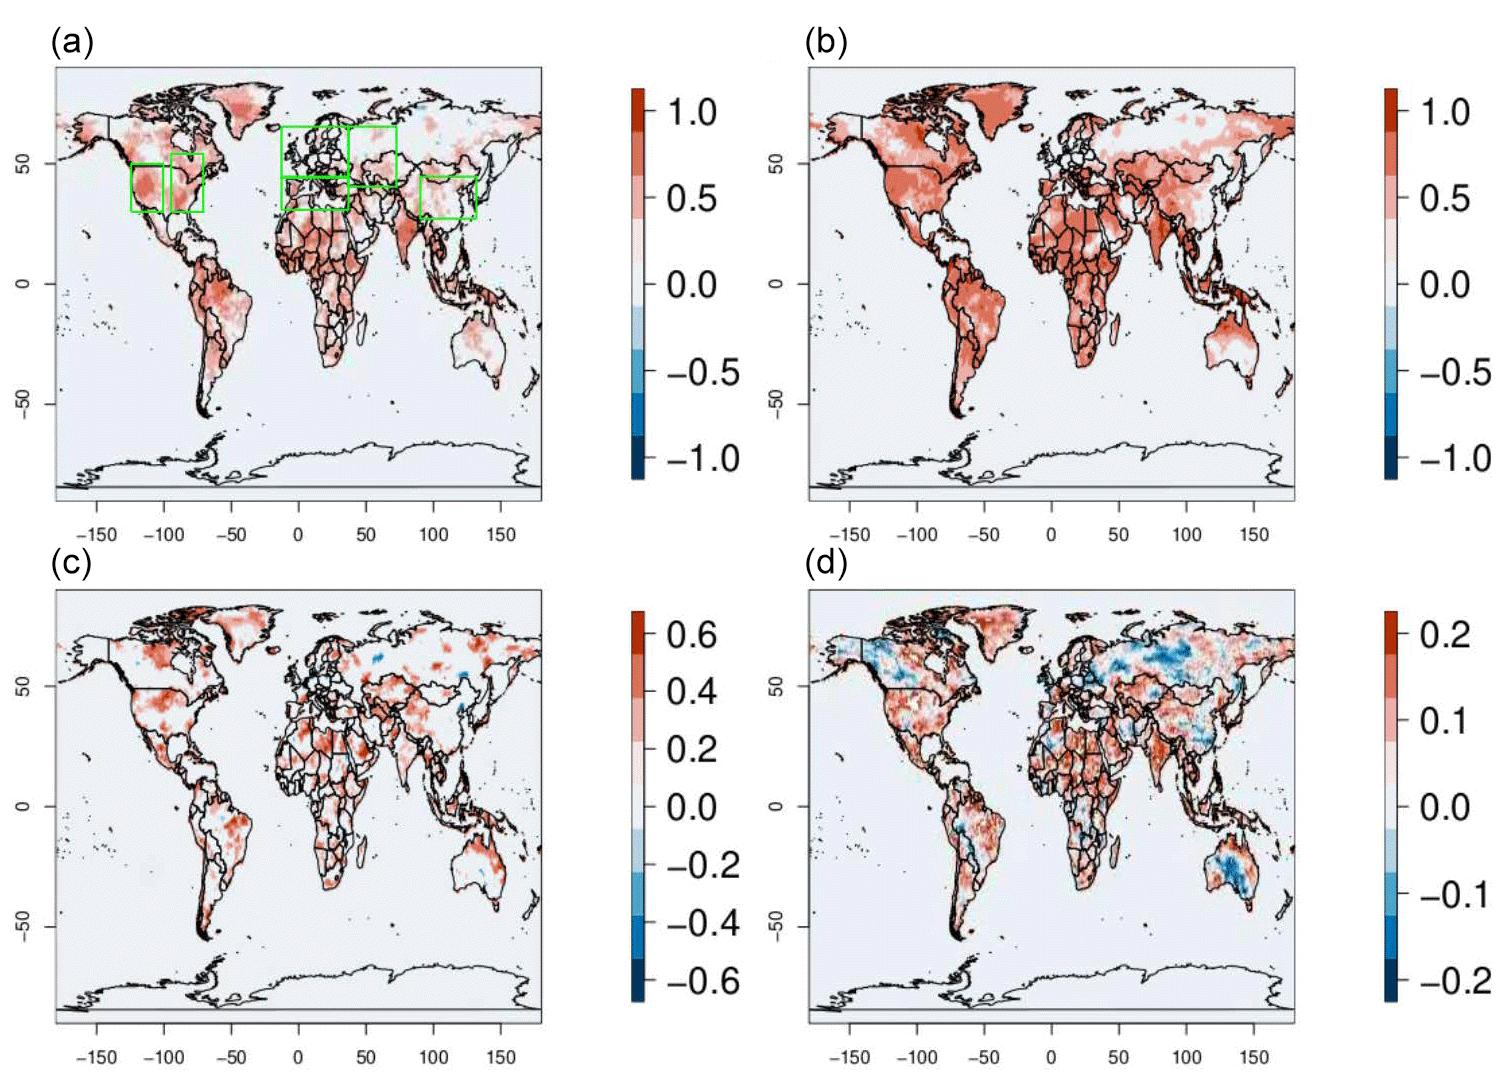
Figure 5The same as Fig. 3 but for re-forecasts initialized every June. Boxes in (a) show the areas used in Figs. 6 and 7.
Interestingly, using the same criterion to select ERA5 T2m values reveals that in general, excluding years with a high ensemble SNR results in lower absolute deviations from the mean than when the low-SNR years are excluded (Fig. 3d). Additionally, these differences overall coincide with regions with significant skill differences (Fig. 3c, d). This implies that years with more extreme deviations from the mean (in the observations/reanalysis) may be identified a priori by calculating the ensemble SNR of the forecast and that forecast systems are in general more skillful when large deviations from the mean occur.
Similar to T2m, the exclusion of years with a high SNR also results in lower overall precipitation skill values than the one obtained when excluding low-SNR years (Fig. 4a, b). Important skill differences appear in the Iberian Peninsula, Brazil, Australia, and Indonesia (Fig. 4c) and in most cases imply a shift from non-significant to significant skill (Fig. 4a and b, respectively). Contrasting with T2m, the relation between the ACC and the mean absolute deviation from the mean in the observations is not obvious for precipitation (Fig. 4c, d). To further investigate this behavior, we analyzed the relationship between skill differences and the differences in absolute deviation from the mean for T2m and precipitation, as usual by using the re-forecasts that exclude the 25 % of the years with the lowest and the highest SNR, respectively. This analysis (not shown) confirms a statistically robust relationship between skill and large deviations from the mean observed precipitation which is still weaker than for T2m.
Figure 5 shows a clearer relation between the impact on skill of the most extreme years in terms of the SNR and the absolute T2m anomalies in ERA5, as compared with Fig. 3. There is a good correspondence in all continents, including parts of Europe (Fig. 5c, d). The only difference between the two figures is that they show the results from re-forecasts with different initialization dates. Both target the boreal summer months (June–August), but Fig. 3 shows the results from the May initialization, while Fig. 5 shows the results from the June initialization. Similar qualitative conclusions can be made for precipitation (not shown).
In Fig. 6 we use the same methodology to sample years based on the T2m SNR but applied to specific Northern Hemisphere mid-latitude regions: the Mediterranean, northern and central Europe, northwestern Asia, eastern Asia, western North America, and eastern North America. All the three skill metrics computed show that sampling the 18 years with the highest SNR generally results in more skillful T2m predictions than when sampling all 24 years or the 18 years with the lowest SNR. The only exceptions are observed in northern and central Europe, where there is basically no skill, as well as in eastern North America, where all the three selection methods show similar skill levels. Examples of successful prediction of extreme (high) T2m years and a high SNR are 1999 and 2003 in the Mediterranean, 2002 in northern and central Europe, 1998 in northwestern Asia, and 2006 and 1998 in western and eastern North America, respectively. There are also some examples of extreme (high) T2m and a low SNR, such as 2012 in the Mediterranean or 1994 and 2016 in eastern Asia. However, a higher overall GSS for the top T2m positive anomalies indicates that, on average, sampling years with a high SNR results in better prediction of the extreme events.
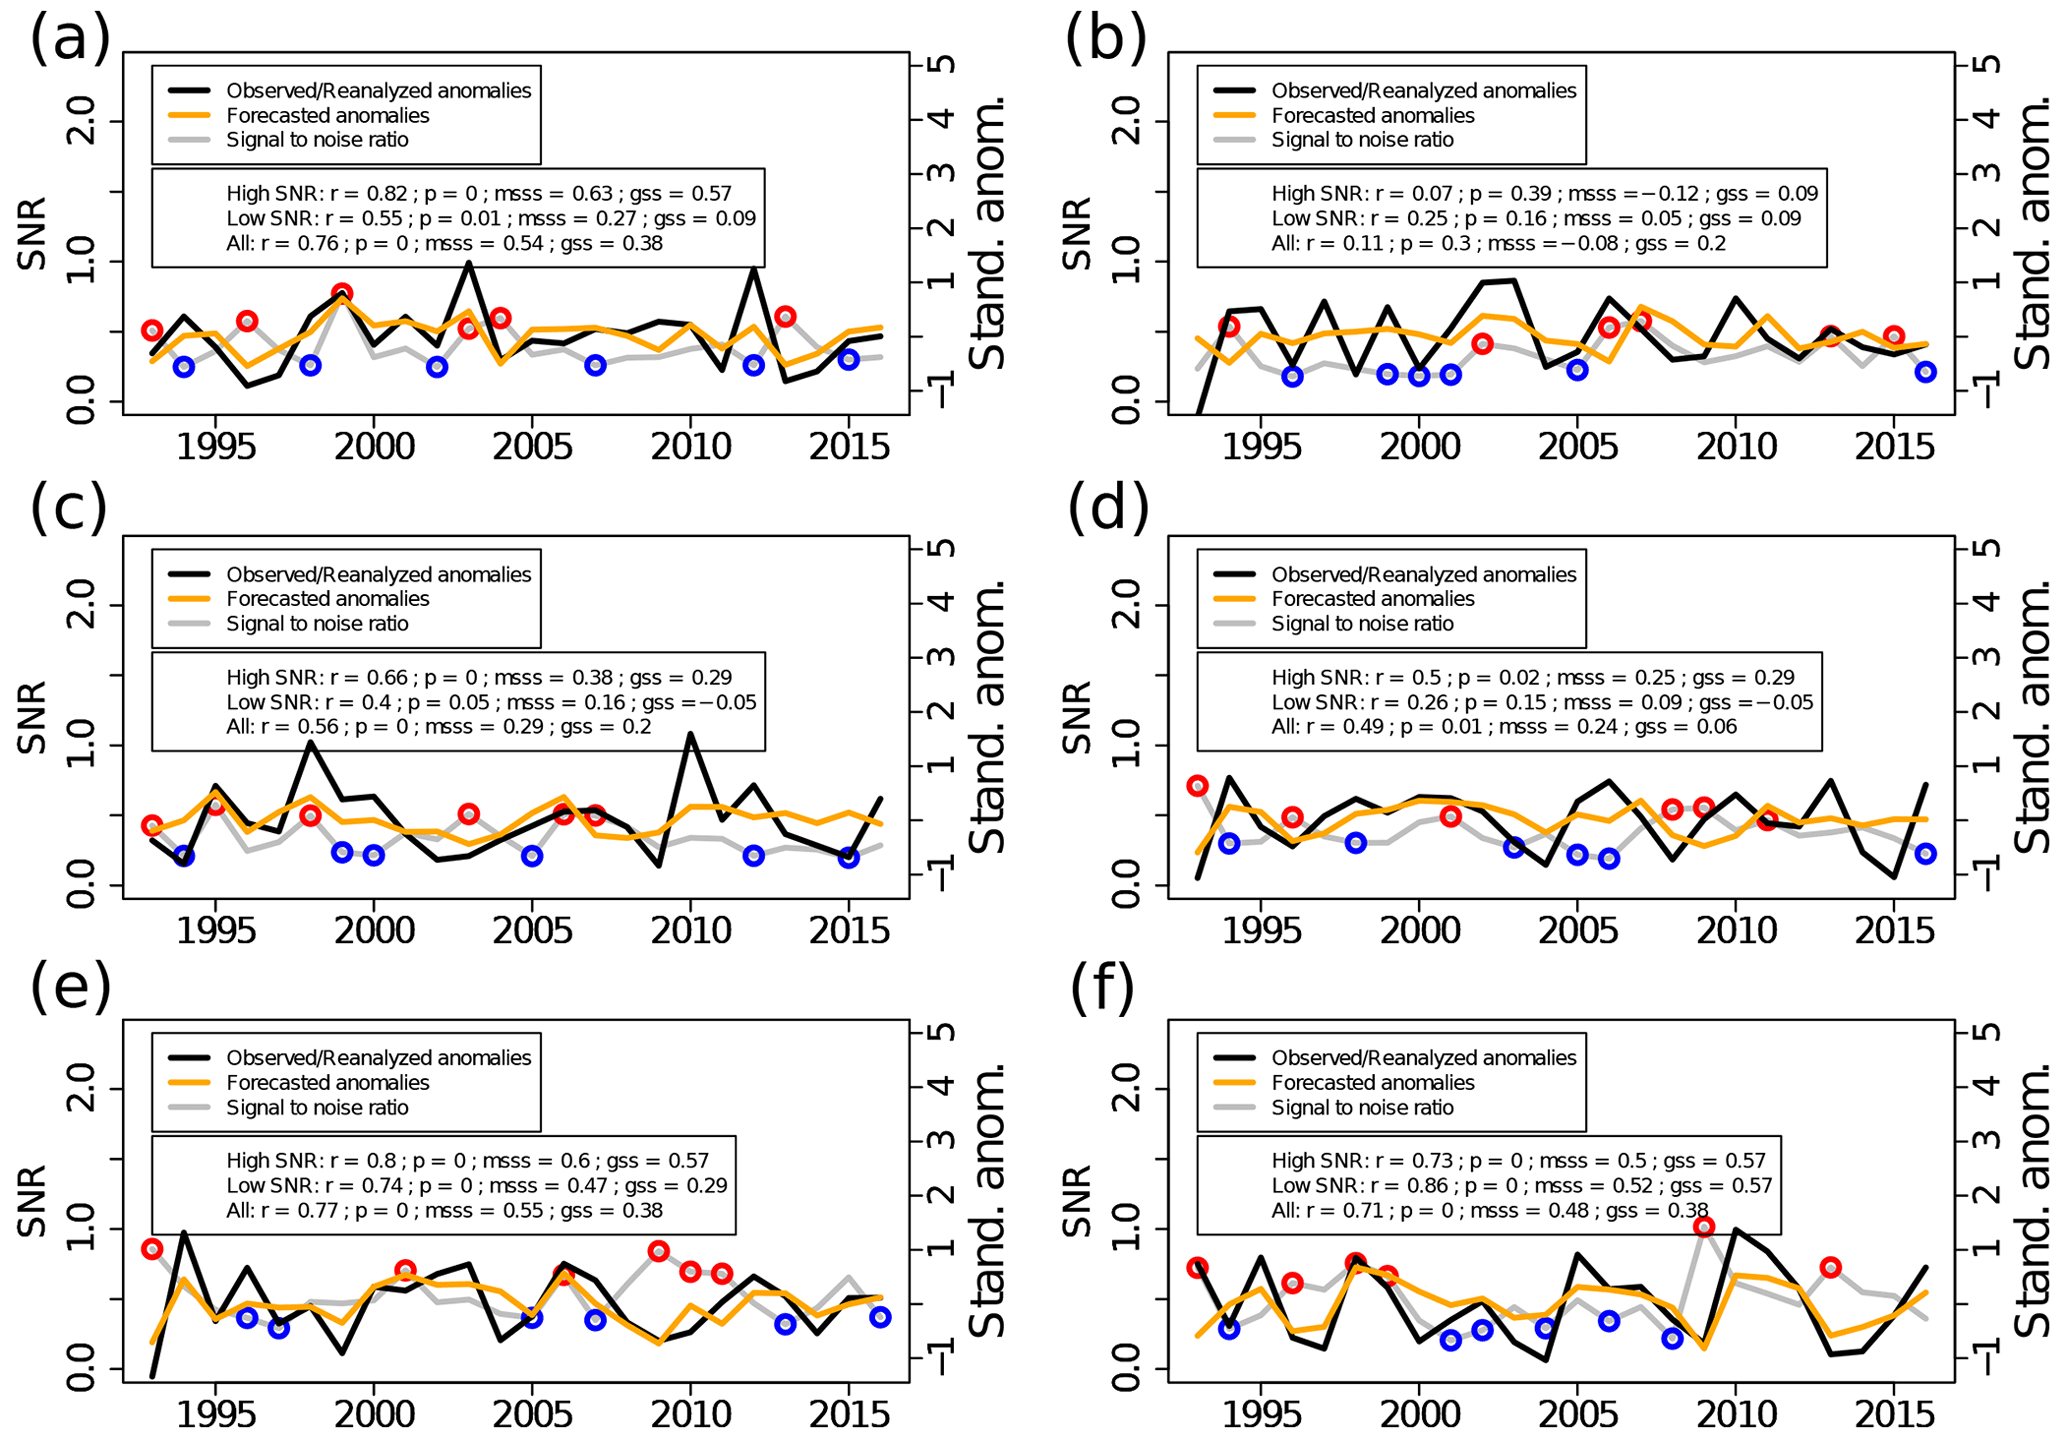
Figure 6Area-averaged time series of observed and predicted, detrended, and standardized mean summer T2m (right axis) and SNR (left axis) in (a) the Mediterranean (10∘ W–35∘ E, 30–45∘ N), (b) northern and central Europe (10∘ W–35∘ E, 45–65∘ N), (c) northwestern Asia (35–70∘ E, 40–65∘ N), (d) eastern Asia (90–130∘ E, 25–45∘ N), (e) western North America (123–100∘ W, 30–50∘ N), and (f) eastern North America (90–70∘ W, 30–55∘ N). Skill metrics are provided separately for the 18 years with the highest SNR (excluding blue circles), the 18 years with the lowest SNR (excluding red circles), and for all 24 years. The skill metrics are linear correlation, the mean squared skill score, and the Gilbert skill score (see “Methods”). The p values of the linear-correlation coefficients are also displayed for each region. The results are from the re-forecasts initialized in June.
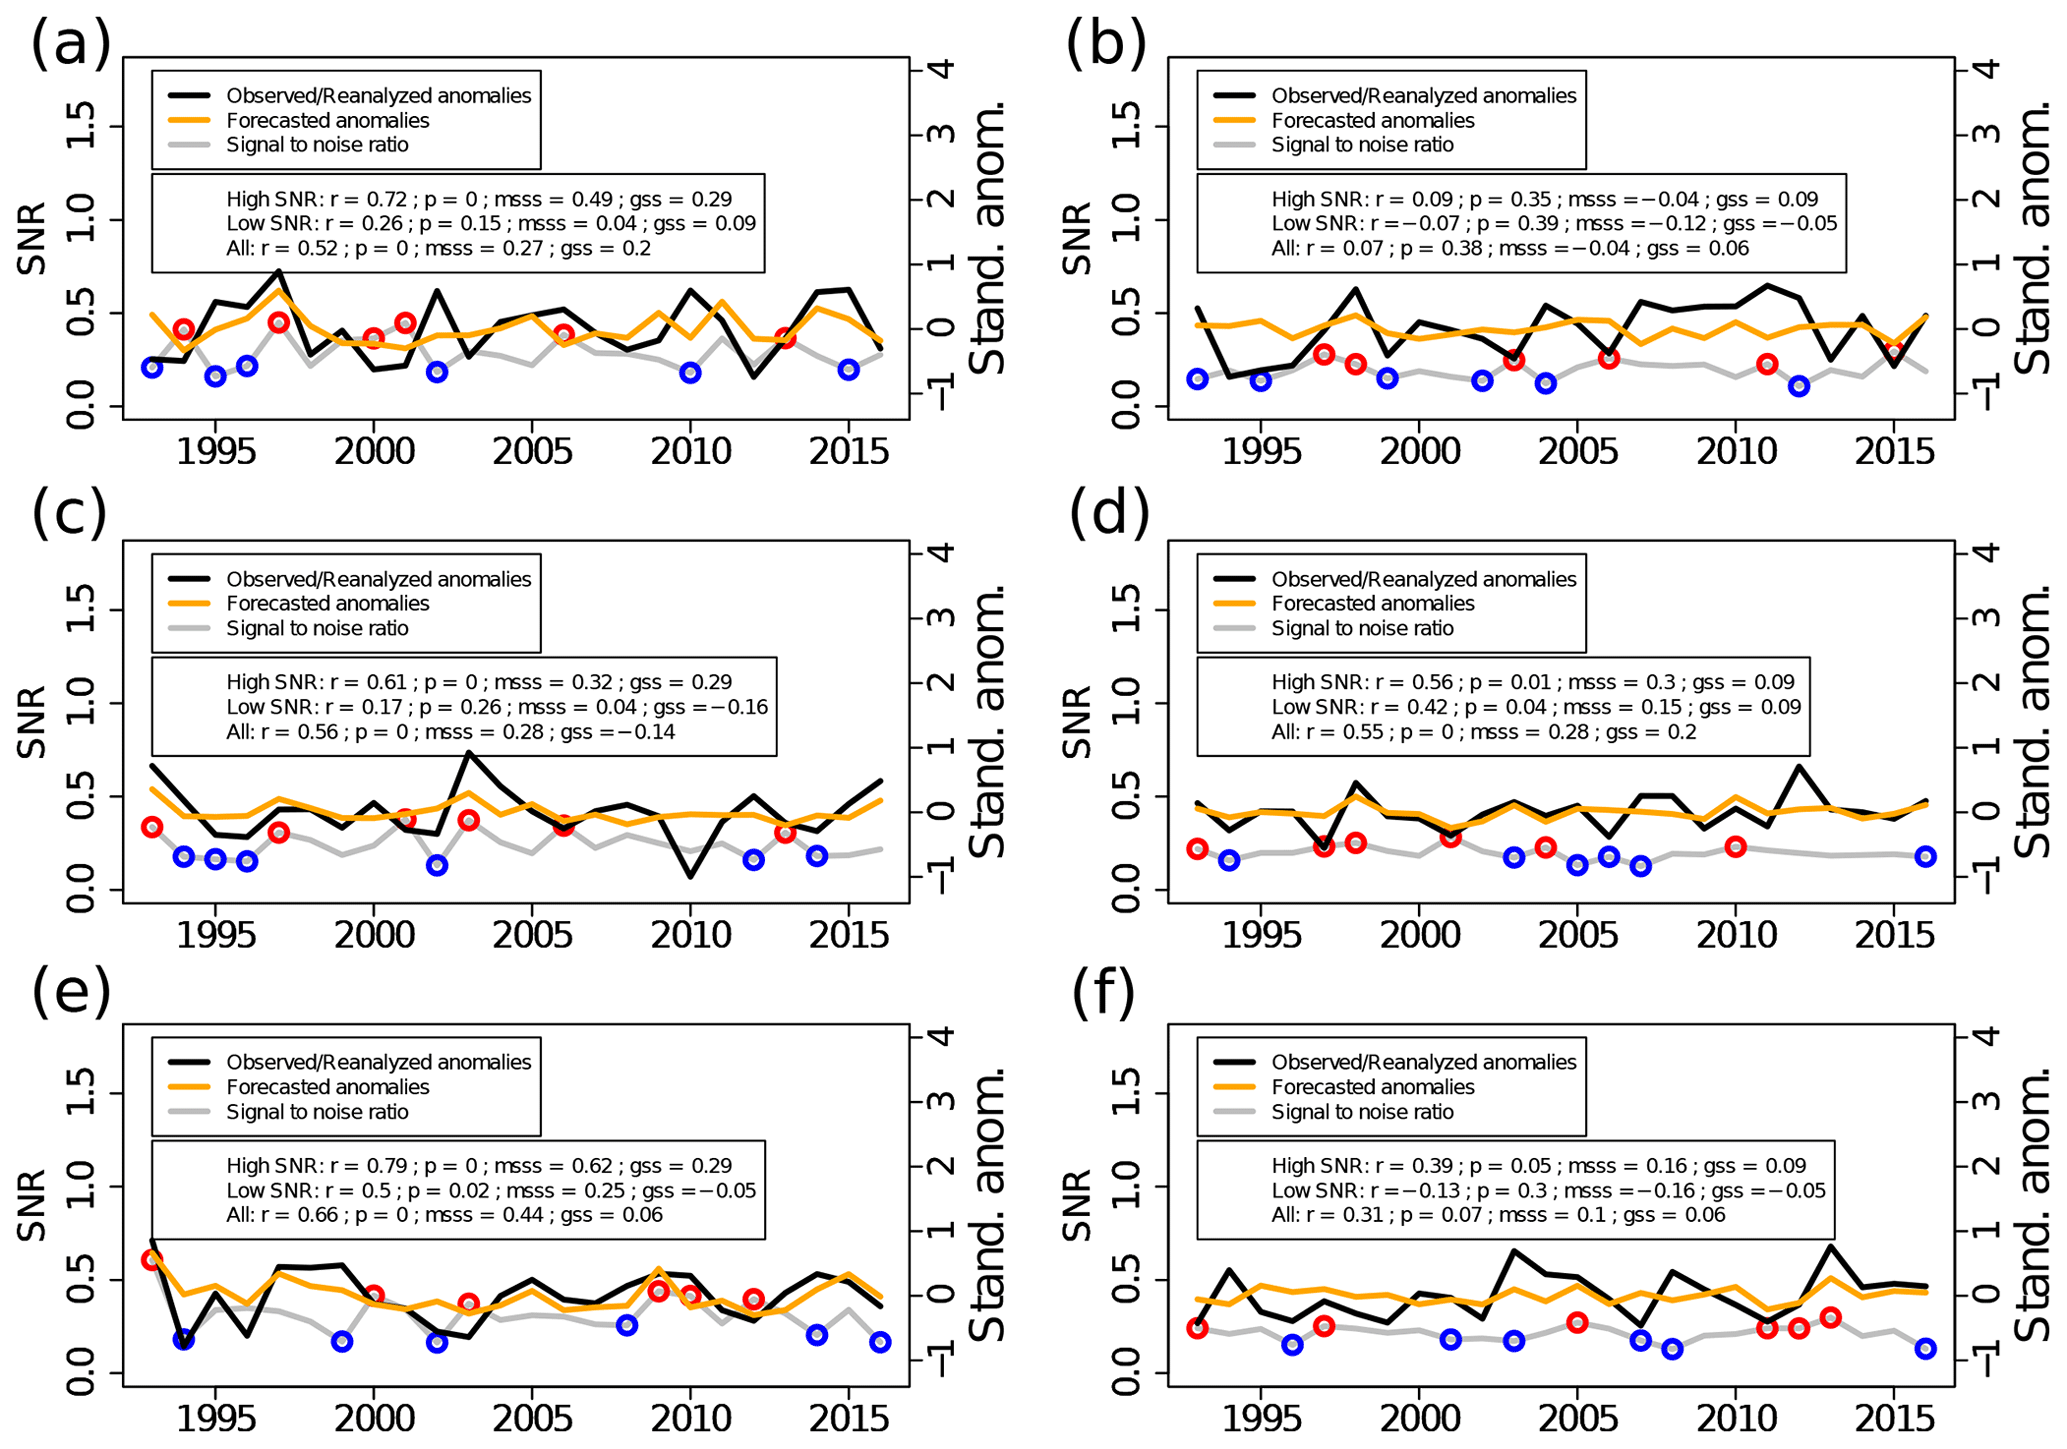
A similar analysis on precipitation is shown in Fig. 7. The results of precipitation qualitatively agree with those of T2m. Precipitation skill is highest for years with the highest SNR and lowest for years with the lowest SNR, the only exception being northern and central Europe, again a region with no skill in either precipitation or T2m predictions. Years of successful predictions of low precipitation and a high SNR are 1994 and 2000 in the Mediterranean, 2015 in northern and central Europe, 1997 and 2001 in eastern Asia, 2003 in western North America, and 2011 in eastern North America. Similar to T2m, the GSS for low-precipitation summers is generally higher for the top 18 years (in terms of the SNR) than for the bottom 18 years or for all 24 years. It is worth noting that skill scores for precipitation are generally lower than those of T2m. This is primarily due to the lower overall predictability of precipitation compared to T2m. Note also that the same conclusions are obtained for both T2m and precipitation when separately sampling only the half of the years with the highest and lowest SNRs and/or when varying the threshold to define the most extreme years used in the GSS calculations (not shown).
The SNR measures the relative weight of the ensemble mean anomalies with respect to the ensemble coherence. Its close resemblance in terms of spatial patterns with a skill metric like the ACC indicates that it can provide complementary information related to seasonal climate predictability. We have shown that in regions where the forecasts are skillful, years with a high SNR exhibit on average larger observed deviations from the mean than years with a low SNR, for both T2m and precipitation. This means that forecast systems are on average more reliable at predicting extremes when there is a higher coherence. This has been further demonstrated for several Northern Hemisphere mid-latitude regions during boreal summer. Ensemble coherence is also a good indicator of T2m and precipitation predictability, although it appears to be only suitable for tropical and subtropical locations.
Despite the well-known limitations of climate forecast systems (e.g., the signal-to-noise paradox), we have shown that in a multi-system ensemble, the SNR may provide valuable information as it represents an intrinsic measure of reliability for T2m and precipitation forecast. The short span of 24 years defining the common hindcast period is a limitation of this study. Hence, longer hindcasts would be necessary to obtain more robust results but are currently unavailable for most of the multiple systems analyzed.
All the data used in this publication are open and available at https://doi.org/10.24381/cds.0b79e7c5 (Copernicus Climate Change Service, 2018). The R scripts used in the analysis are available upon request.
JCAN and AT conceptualized the study and developed the methodology. JCAN performed all analyses and wrote the first draft. Both co-authors contributed with the preparation of the final draft.
The contact author has declared that neither of the authors has any competing interests.
Publisher’s note: Copernicus Publications remains neutral with regard to jurisdictional claims in published maps and institutional affiliations.
The authors would like to acknowledge the two anonymous reviewers who provided valuable comments and helped improve the final version of this study.
This paper was edited by Silvio Davolio and reviewed by two anonymous referees.
Baehr, J., Fröhlich, K., Botzet, M., Domeisen, D. I., Kornblueh, L., Notz, D., Piontek, R., Pohlmann, H., Tietsche, S., and Müller, W. A.: The prediction of surface temperature in the new seasonal prediction system based on the MPI-ESM coupled climate model, Clim. Dynam., 44, 2723–2735, https://doi.org/10.1007/s00382-014-2399-7, 2015.
Batté, L., Dorel, L., Ardilouze, C., and Guérémy, J.-F.: Documentation of the METEO-FRANCE seasonal forecasting system 8, Météo-France, 36, 1–36, https://www.umr-cnrm.fr/IMG/pdf/system8-technical.pdf (last access: 1 February 2023), 2021.
Below, R., Grover-Kopec, E., and Dilley, M.: Documenting drought-related disasters, J. Environ. Dev., 16, 328–344, https://doi.org/10.1177/1070496507306222, 2007.
Bevacqua, E., Zappa, G., Lehner, F., and Zscheischler, J.: Precipitation trends determine future occurrences of compound hot–dry events. Nat. Clim. Change, 12, 350–355, https://doi.org/10.1038/s41558-022-01309-5, 2022.
Buontempo, C., Hanlon, H. M., Bruno Soares, M., Christel, I., Soubeyroux, J.-M., Viel, C., Calmanti, S., Bosi, L., Falloon, P., Palin, E. J., Vanvyve, E., Torralba, V., Gonzalez-Reviriego, N., Doblas-Reyes, F., Pope, E. C. D., Newton, P., and Liggins, F.: What have we learnt from Euporias Climate Service prototypes?, Climate Services, 9, 21–32, https://doi.org/10.1016/j.cliser.2017.06.003, 2018.
Ceglar, A. and Toreti, A.: Seasonal climate forecast can inform the European agricultural sector well in advance of harvesting, NPJ Clim. Atmos. Sci., 4, 1–8, https://doi.org/10.1038/s41612-021-00198-3, 2021.
Copernicus Climate Change Service: Seasonal forecast monthly statistics on pressure levels, Copernicus Climate Change Service (C3S) Climate Data Store [data set], https://doi.org/10.24381/cds.0b79e7c5 (last access: 1 October 2022), 2018.
Doi, T., Nonaka, M., and Behera, S.: Can signal-to-noise ratio indicate prediction skill? Based on skill assessment of 1-month lead prediction of monthly temperature anomaly over Japan, Front. Clim., 4, 887782, https://doi.org/10.3389/fclim.2022.887782, 2022.
Eade, R., Smith, D., Scaife, A., Wallace, E., Dunstone, N., Hermanson, L., and Robinson, N.: Do seasonal-to-decadal climate predictions underestimate the predictability of the real world?, Geophys. Res. Lett., 41, 5620–5628, https://doi.org/10.1002/2014gl061146, 2014.
Enenkel, M., Brown, M. E., Vogt, J. V., McCarty, J. L., Reid Bell, A., Guha-Sapir, D., Dorigo, W., Vasilaky, K., Svoboda, M., Bonifacio, R., Anderson, M., Funk, C., Osgood, D., Hain, C., and Vinck, P.: Why predict climate hazards if we need to understand impacts? Putting humans back into the drought equation, Clim. Change, 162, 1161–1176, https://doi.org/10.1007/s10584-020-02878-0, 2020.
Gualdi, S., Sanna, A., Borrelli, A., Cantelli, A., del Mar Chaves Montero, M., and Tibaldi, S.: The new CMCC Operational Seasonal Prediction System SPS3.5, Centro Euro-Mediterraneo sui Cambiamenti Climatici, CMCC Tech. Note RP0288, https://doi.org/10.25424/CMCC/SPS3.5 2020.
Hagedorn, R., Doblas-Reyes, F. J., and Palmer, T. N.: The rationale behind the success of multi-model ensembles in seasonal forecasting – I. basic concept, Tellus A, 57, 219–233, https://doi.org/10.3402/tellusa.v57i3.14657, 2005.
Hersbach, H., Bell, B., Berrisford, P., Hirahara, S., Horányi, A., Muñoz-Sabater, J., Nicolas, J., Peubey, C., Radu, R., Schepers, D., Simmons, A., Soci, C., Abdalla, S., Abellan, X., Balsamo, G., Bechtold, P., Biavati, G., Bidlot, J., Bonavita, M., Chiara, G., Dahlgren, P., Dee, D., Diamantakis, M., Dragani, R., Flemming, J., Forbes, R., Fuentes, M., Geer, A., Haimberger, L., Healy, S., Hogan, R. J., Hólm, E., Janisková, M., Keeley, S., Laloyaux, P., Lopez, P., Lupu, C., Radnoti, G., Rosnay, P., Rozum, I., Vamborg, F., Villaume, S., and Thépaut, J.: The ERA5 global reanalysis, Q. J. Roy. Meteor. Soc., 146, 1999–2049, https://doi.org/10.1002/qj.3803, 2020.
Johnson, S. J., Stockdale, T. N., Ferranti, L., Balmaseda, M. A., Molteni, F., Magnusson, L., Tietsche, S., Decremer, D., Weisheimer, A., Balsamo, G., Keeley, S. P. E., Mogensen, K., Zuo, H., and Monge-Sanz, B. M.: SEAS5: the new ECMWF seasonal forecast system, Geosci. Model Dev., 12, 1087–1117, https://doi.org/10.5194/gmd-12-1087-2019, 2019.
Lenssen, N. J., Goddard, L., and Mason, S.: Seasonal forecast skill of Enso teleconnection maps, Weather Forecast., 35, 2387–2406, https://doi.org/10.1175/waf-d-19-0235.1, 2020.
MacLachlan, C., Arribas, A., Peterson, K. A., Maidens, A., Fereday, D., Scaife, A. A., Gordon, M., Vellinga, M., Williams, A., Comer, R. E., Camp, J., Xavier, P., and Madec, G.: Global Seasonal Forecast System version 5 (GLOSEA5): A high-resolution seasonal forecast system, Q. J. Roy. Meteor. Soc., 141, 1072–1084, https://doi.org/10.1002/qj.2396, 2015.
Meehl, G. A., Richter, J. H., Teng, H., Capotondi, A., Cobb, K., Doblas-Reyes, F., Donat, M. G., England, M. H., Fyfe, J. C., Han, W., Kim, H., Kirtman, B. P., Kushnir, Y., Lovenduski, N. S., Mann, M. E., Merryfield, W. J., Nieves, V., Pegion, K., Rosenbloom, N., Sanchez, S. C., Scaife, A. A., Smith, D., Subramanian, A. C., Sun, L., Thompson, D., Ummenhofer, C. C., and Xie, S.-P.: Initialized earth system prediction from subseasonal to Decadal Timescales, Nature Reviews Earth & Environment, 2, 340–357, https://doi.org/10.1038/s43017-021-00155-x, 2021.
Merryfield, W. J., Baehr, J., Batté, L., Becker, E. J., Butler, A. H., Coelho, C. A., Danabasoglu, G., Dirmeyer, P. A., Doblas-Reyes, F. J., Domeisen, D. I., Ferranti, L., Ilynia, T., Kumar, A., Müller, W. A., Rixen, M., Robertson, A. W., Smith, D. M., Takaya, Y., Tuma, M., Vitart, F., White, C. J., Alvarez, M. S., Ardilouze, C., Attard, H., Baggett, C., Balmaseda, M. A., Beraki, A. F., Bhattacharjee, P. S., Bilbao, R., de Andrade, F. M., DeFlorio, M. J., Díaz, L. B., Ehsan, M. A., Fragkoulidis, G., Grainger, S., Green, B. W., Hell, M. C., Infanti, J. M., Isensee, K., Kataoka, T., Kirtman, B. P., Klingaman, N. P., Lee, J.-Y., Mayer, K., McKay, R., Mecking, J. V., Miller, D. E., Neddermann, N., Justin Ng, C. H., Ossó, A., Pankatz, K., Peatman, S., Pegion, K., Perlwitz, J., Recalde-Coronel, G. C., Reintges, A., Renkl, C., Solaraju-Murali, B., Spring, A., Stan, C., Sun, Y. Q., Tozer, C. R., Vigaud, N., Woolnough, S., and Yeager, S.: Current and emerging developments in subseasonal to decadal prediction, B. Am. Meteorol. Soc., 101, E869–E896, https://doi.org/10.1175/bams-d-19-0037.1, 2020.
Mishra, A. K. and Singh, V. P.: A review of drought concepts, J. Hydrol., 391, 202–216, https://doi.org/10.1016/j.jhydrol.2010.07.012, 2010.
Mishra, N., Prodhomme, C., and Guemas, V.: Multi-model skill assessment of seasonal temperature and precipitation forecasts over Europe, Clim. Dynam., 52, 4207–4225, https://doi.org/10.1007/s00382-018-4404-z, 2018.
Murphy, A. H.: Skill scores based on the mean square error and their relationships to the correlation coefficient, Mon. Weather Rev., 116, 2417–2424, https://doi.org/10.1175/1520-0493(1988)116<2417:SSBOTM>2.0.CO;2, 1988.
Scaife, A. A. and Smith, D.: A signal-to-noise paradox in climate science, NPJ Clim. Atmos. Sci., 1, 28, https://doi.org/10.1038/s41612-018-0038-4, 2018.
Schnider, U., Becker, A., Finger, P., Meyer-Christoffer, A., Rudolf, B., and Ziese, M.: GPCC Full Data Reanalysis Version 2022 at 1.0: Monthly Land-Surface Precipitation from Rain-Gauges built on GTS-based and Historic Data, DWD [data set], https://doi.org/10.5676/DWD_GPCC/FD_M_V2022_100, 2011.
Smith, D. M., Scaife, A. A., Eade, R., Athanasiadis, P., Bellucci, A., Bethke, I., Bilbao, R., Borchert, L. F., Caron, L.-P., Counillon, F., Danabasoglu, G., Delworth, T., Doblas-Reyes, F. J., Dunstone, N. J., Estella-Perez, V., Flavoni, S., Hermanson, L., Keenlyside, N., Kharin, V., Kimoto, M., Merryfield, W. J., Mignot, J., Mochizuki, T., Modali, K., Monerie, P.-A., Müller, W. A., Nicolí, D., Ortega, P., Pankatz, K., Pohlmann, H., Robson, J., Ruggieri, P., Sospedra-Alfonso, R., Swingedouw, D., Wang, Y., Wild, S., Yeager, S., Yang, X., and Zhang, L.: North Atlantic climate far more predictable than models imply, Nature, 583, 796–800, https://doi.org/10.1038/s41586-020-2525-0, 2020.
Yin, J., Gentine, P., Slater, L., Gu, L., Pokhrel, Y., Hanasaki, N., Guo, S., Xiong, L., and Schlenker, W.: Future socio-ecosystem productivity threatened by compound drought–heatwave events, Nature Sustainability, 6, 259–272, https://doi.org/10.1038/s41893-022-01024-1, 2023.
World Meteorological Organization (WMO): Forecast Verification for the African Severe Weather Forecasting Demonstration Projects, No. 1132, World Meteorological Organization, Geneva, Switzerland, https://www.wmo.int/pages/prog/www/Documents/1132_en.pdf (last access: 1 February 2023), 2014.