the Creative Commons Attribution 4.0 License.
the Creative Commons Attribution 4.0 License.
 | 24 Apr 2024
Understanding winter windstorm predictability over Europe
Gregor C. Leckebusch
Adam A. Scaife
Winter windstorms belong to the most damaging meteorological events in the extra-tropics. Their impact on society makes it essential to understand and improve seasonal forecasts of these extreme events. Skilful predictions on a seasonal timescale have been shown in previous studies by investigating hindcasts from various forecast centres. This study aims to explain storm forecast skill based on relevant dynamical factors. Therefore, a number of factors which are known to influence either windstorms directly or their synoptic relevant systems, mid-latitude cyclones, are investigated. These factors are analysed for their relation to windstorm forecast performance based on a reanalysis (ERA5) and the seasonal hindcast of the UK Met Office (Global Seasonal forecasting system version 5, GloSea5).
Within GloSea5, relevant dynamical factors are (1) validated with respect to their physical connections to windstorms, (2) investigated with respect to the seasonal forecast skill of the factors themselves, and (3) assessed on the relevance and influence of their forecast performance to and on windstorm forecast skill. Although not all investigated factors reveal a clear and consistent influence on windstorm forecast skill over Europe, core factors like mean sea level pressure gradient, sea surface temperature, equivalent potential temperature and Eady growth rate show consistent results within these three steps: their physical connection is well represented in the model; these factors are skilfully predicted in storm-relevant regions, and, consequently, this skill leads to increased forecast skill of winter windstorms over Europe. This study thus explains existing forecast skill in winter windstorms but also indicates potential for further model developments to improve seasonal winter windstorm predictions.
- Article
(16544 KB) - Full-text XML
- BibTeX
- EndNote


The works published in this journal are distributed under the Creative Commons Attribution 4.0 License. This licence does not affect the Crown copyright work, which is re-usable under the Open Government Licence (OGL). The Creative Commons Attribution 4.0 License and the OGL are interoperable and do not conflict with, reduce or limit each other.
© Crown copyright 2023
Severe winter windstorms are one of the most damaging and loss-bringing events in the extra-tropics, especially for the European region (Munich RE, 2014). Hence, it is of great scientific interest for stakeholders and the general public to understand these extreme events. This study aims to understand near-surface windstorms, which are produced by the strongest of extra-tropical cyclones. Windstorms in this study are thus more related to the direct impacts of a cyclonic system rather than just the low-pressure systems. Leckebusch et al. (2008) developed an objective tracking algorithm for these strongest wind events. They used a threshold that intentionally relates to observed losses (Klawa and Ulbrich, 2003) and detects ca. the top 2 % of the strongest, most coherent extreme events in the extra-tropics. This objective windstorm tracking has been used for multiple different studies in the past, spanning different regions and hazards (Ng and Leckebusch, 2021; Nissen et al., 2013), individual event analysis (Donat et al., 2011b), and climate (Donat et al., 2011a; Schuster et al., 2019) and seasonal studies (Befort et al., 2019; Renggli et al., 2011; Walz et al., 2018; Degenhardt et al., 2022).
Seasonal hindcasts have been investigated in multiple studies for different storm-relevant aspects, like the forecast skill of the North Atlantic Oscillation (NAO; Parker et al., 2019; Athanasiadis et al., 2017; Scaife et al., 2019, 2014), stratospheric conditions (Nie et al., 2019), or connections between tropical cyclones and extra-tropical storms (Angus and Leckebusch, 2020). In addition, different regions and events were investigated concerning their seasonal forecast skill (Dunstone et al., 2018; Scaife et al., 2017a). For extreme European winter windstorms, one of the first studies was published in Renggli et al. (2011) based on the DEMETER (Palmer et al., 2004) and ENSEMBLES (Weisheimer et al., 2009) pilot seasonal hindcasts. More recent studies investigated later operational systems, like the ECMWF systems (SEAS 3 and 4) and the UK Met Office's Global Seasonal forecasting system version 5 (GloSea5) (Befort et al., 2019). They found forecast skill in windstorm frequencies and a link to the large-scale pattern of the NAO. Following this, Degenhardt et al. (2022) found strong positive and significant forecast skill for windstorm frequency and (for the first time) intensity. A connection to the three dominant large-scale patterns over Europe showed the NAO, Scandinavian Pattern and East Atlantic Pattern together explain between 60 % and 80 % of the interannual variability of windstorms over Europe in these seasonal hindcasts, corroborating results from Walz et al. (2018) based on century-long reanalysis data. These skilful storm forecasts found in seasonal hindcasts have led to the motivation for this study. This study aims to understand which dynamical factors drive the seasonal winter windstorm prediction skill.
Multiple studies have investigated dynamical factors influencing cyclones, storm generation and storm intensification in the past. The Eady growth rate (EGR) parameter (Eady, 1949) is used as a standard measure for baroclinic instability of the atmospheric flow, which is known as a source of and intensifying factor for extra-tropical cyclones (Hoskins and Valdes, 1990). Pinto et al. (2008) investigated important dynamical factors and their connection to strong cyclones over Europe for future climate change scenarios, based on previously identified contributors like EGR in the upper troposphere (Hoskins and Hodges, 2002), upper-tropospheric divergence (Ulbrich et al., 2001), the jet stream speed (Kurz, 1990; Hoskins et al., 1983; Shaw et al., 2016) and the equivalent potential temperature (Θe) as another stability measure (Chang et al., 1984).
For the EGR, this study uses the same diagnostic level of 400 hPa as in Pinto et al. (2008) for the upper troposphere and 700 hPa (resulting from two available model levels) to diagnose lower-troposphere baroclinicity. The location and strength of the jet stream are important for whether the end of the North Atlantic storm track reaches Europe (Parker et al., 2019). Θe is a parameter that describes the temperature of a fully dried air parcel dry adiabatically lowered onto a reference level, usually 1000 hPa (Bolton, 1980). It not only is a measure of the moisture content in the atmosphere and its static stability but also links to the concept of the isentropic potential vorticity (PV; e.g. Hoskins, 2015; Hoskins et al., 1985). Thus, Raymond (1992) demonstrated that latent heat release leads to a redistribution of PV, with positive PV tendencies below the maximum heating level and negative tendencies above. It is known that the downwards propagation of an upper-tropospheric positive PV anomaly favours the strengthening of cyclones (Hoskins et al., 1985; Büeler and Pfahl, 2017). Hence, PV is connected to cyclonic systems and can indicate their strength and location over the North Atlantic. Hoskins et al. (1985) compared different isentropic levels for the PV, including 350 K, which is used in this study as it is a good average representative of the synoptic scales in the troposphere. They have also connected this concept with Rossby wave transition. Upper-tropospheric divergence is also part of the equation for the Rossby wave source (RWS), a measure of developing Rossby waves which potentially transmit predictability from the tropics to the extra-tropics (Beverley et al., 2019; Dunstone et al., 2018; Scaife et al., 2017b).
Other factors influencing the generation and intensification of cyclones are the general environmental conditions which are thus indirectly connected to windstorms, like the sea surface temperature (SST) distribution, SST gradient and mean sea level pressure (MSLP) gradient (Shaw et al., 2016). Recently, the SST and the jet stream have been identified as drivers of storm track biases in CMIP6 data (Priestley et al., 2023). Beyond these generally well-established factors, other studies identify the important role of tropical precipitation as an indicator of European climate predictability (e.g. Scaife et al., 2017b): tropical convective precipitation triggers enhanced divergence, which again leads to the establishment of Rossby wave trains that impact Europe. Wild et al. (2015) found a connection between European windstorms and a surface temperature anomaly difference. They used the difference in the surface temperature anomalies over North America and the SST over the western North Atlantic.
The current study investigates dynamical factors connected to windstorms in seasonal forecasts from the UK Met Office, GloSea5 (MacLachlan et al., 2015), and the respective seasonal windstorm forecast skill. This study aims for a better understanding of the origin of the seasonal forecast skill and hence confidence in real-time forecasts.
This study uses a three-step approach to understand the role of different dynamical factors in the winter windstorm predictability over Europe.
Step 1 – validation of dynamical factors. Is the observed physical link between factors and storms well represented in the model?
Step 2 – skill of factors. Is the dynamical factor skilfully predicted on a seasonal timescale?
Step 3 – relevance of factors for storm forecast skill. Is the forecast skill of windstorms related to the factor's forecast skill?
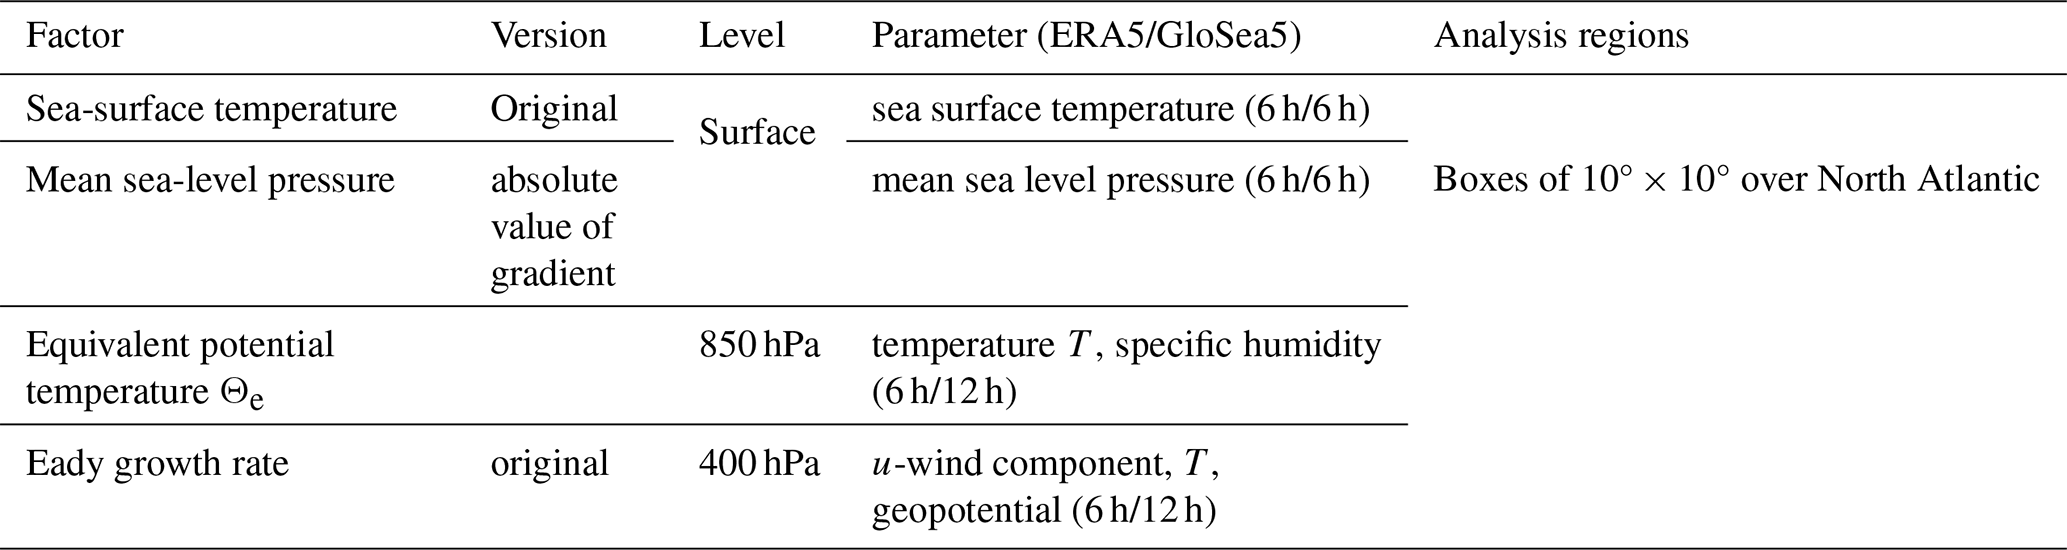
Table 1Dynamical factors (focused on in this paper) concerning storminess, cyclones or windstorms over Europe.
The study first introduces the data sets used in Sect. 2, followed by a description of applied methods in Sect. 3. In Sect. 4, the results are presented and structured in the above-mentioned three-step approach. The study finishes with a discussion and conclusion presented in Sect. 5.
This study investigates the seasonal forecast from the UK Met Office's Global Seasonal Forecasting System version 5 (GloSea5; MacLachlan et al., 2015) in comparison to the ECMWF reanalysis ERA5 (Hersbach et al., 2019). Both data sets are used from 1993 to 2016. GloSea5 is a multi-member ensemble model with four initialisations per month (on the 1st, 9th, 17th and 25th of each month) and seven members per initialisation. Currently, three different model versions are available, which differ in small system updates. This study investigates the Northern Hemisphere winter (December to February, DJF) and therefore uses initial dates around 1 November (25 October, 1 November and 9 November). This leads to 63 ensemble members for GloSea5 (3 system updates × 7 members × 3 initial dates). The seasonal model output has a spatial resolution of 0.56° latitude × 0.83° longitude. ERA5 is a commonly used reanalysis and provides observation-near data, which are used as a reference in this study. The reference data have a resolution of 0.25° × 0.25°. Further details of ERA5 can be found in Hersbach et al. (2019). All factors are calculated as described in Sect. 3 (including the Appendix) and are summarised in Table 1 (for the focused factors and Table A1 in the Appendix for all factors). The windstorm tracking is based on 10 m wind speeds. In the case of a grid-cell-by-grid-cell comparison of both data sets, a regridding from ERA5 to the spatial resolution of GloSea5 has been done by a bilinear interpolation using Climate Data Operators (Schulzweida, 2019).
3.1 Storm tracking
The windstorm analysis is done via an impact-based algorithm developed by Leckebusch et al. (2008). This objective identification and tracking method uses a clustered exceedance of the 98th percentile of surface wind speeds. These synoptic-scale wind clusters are tracked following a nearest-neighbour approach. Only events above a minimum size and duration are considered: a coherent wind cluster must persist for at least 48 h and reach a size of at least 130 000 km2 (see details e.g. in Leckebusch et al., 2008). Consequently, an individual storm track and a grid-cell-based footprint of each storm are created. This footprint is used to count the number of storms over a defined region. The target area in this study is the extended area of the British Isles (48–60° N and −15–10° E). Recently, the authors have shown significantly skilful seasonal windstorm predictions for this area (Degenhardt et al., 2022). The individual windstorm tracks are also used to calculate the track density (used in Sect. 4.3; Kruschke, 2015).
3.2 Factors
The dynamical factors included here are selected based on their known connections to windstorms or cyclones. Factors like EGR or PV are dynamical factors which act on a smaller and shorter scale than other tested factors but can influence the cyclone or windstorm directly. Other factors act on a larger and longer scale. These are, for example, MSLP gradient or SST, and they have a more indirect link to windstorms as they reflect the general state of atmospheric conditions. A summary of all factors and the way they are used can be found in Table A1. Individual factors are used as seasonal (3-month) averages in the following analysis.
Standard calculations have been used, e.g. the gradient of MSLP and SST, the jet characteristics (Parker et al., 2019), or the divergence at 200 hPa. Other factors have been calculated following the original studies, like EGR (Eady, 1949) or PV (Hoskins et al., 1985). Rossby wave source (RWS) has been calculated as described in Beverley et al. (2019), and the temperature dipole is used from Wild et al. (2015).
Figure A1 is a schematic of an idealised storm–cyclone system, which highlights where the respective factors would be expected to be of relevance. The EGR (green), as one of the most important factors that strengthen cyclones, is located northeast of the storm centre (at the lowest level) and slopes towards the northwest with decreasing pressure levels. The upper-tropospheric baroclinicity (EGR 400 hPa) triggers respective upper-level divergence (peach) and hence influences the jet stream (orange). The counterpart to this is the SST (coloured sea areas) which influences the low-level baroclinicity (EGR 700 hPa), the MSLP gradient (light blue) and hence the wind speed (yellow). Another process related to the potential predictability of windstorms is caused by convective tropical precipitation (dark blue) via ascent and divergence, triggering a Rossby wave train (purple) propagating into the North Atlantic region in higher altitudes.
3.3 Composite analysis
To understand how and when these factors and the windstorm forecast quality influence each other, a composite analysis has been done by separating data sets into two different anomaly categories depending on storm frequency and factor prediction skill.
Firstly, separation is done by the number of storms and thus the seasons' overall activity (used in Fig. 1). The storm counts over the extended area of the British Isles (48–60° N and −15–10° E) in ERA5 and each GloSea5 ensemble member are used and separated into three categories, the 10 strongest seasons, the 10 weakest seasons and 3 neutral seasons (10–3–10). A separation into 10–3–10 splitting has the aim of still using data sets with at least 10 years of data to achieve representative results but also to ignore the three neutral seasons to reduce the noise. The separation is done individually per model ensemble member to ensure that each composite compares strong versus weak storm seasons internally. This might lead to different seasons within the sub-samples. The strong–weak composites are presented (individually per member) as standardised composite anomalies to allow for a clear comparison between the ERA5 and GloSea5 data sets. An example categorisation for individual years can be seen in the Appendix (Fig. A2) for ERA5 and GloSea5 ensemble mean windstorm counts in the UK region.
The second categorisation (used in Fig. 4) uses the forecast skill of the respective factor: well-forecasted or poorly forecasted years are identified using the absolute difference of the respective seasonally averaged factor over an individually defined region in the GloSea5 ensemble mean and ERA5. These categories are built for consistency according to the 10–3–10 approach again; i.e. the 10 seasons with the lowest (greatest) absolute difference between the respective ERA5 and GloSea5 factors are used as well-predicted (poorly predicted) seasons.
Both composite methods are presented as composite anomaly differences, tested for significance via Student's t test.
3.4 Statistical metric of prediction skill
All investigation steps include correlations using ranked τb-Kendall correlations (Kendall, 1945). Kendall correlation is a measure similar to the commonly used Pearson's correlation but investigates ranked time series and is less reliant on normally distributed data. In more detail, correlation is used in step 1 for the verification of individual members (Sect. 4.1), in step 2 for the skill analysis (Sect. 4.2) of the factors' individual forecast skills and in step 3 for the relevance study (Sect. 4.3) of the storm forecast skill for different data samples. Correlations are a straightforward statistic to use for either the relationship between two time series or even the forecast skill (e.g. Befort et al., 2019; Athanasiadis et al., 2014; Scaife et al., 2014). Kendall correlation is used because it cannot be assumed that the data are normally distributed. The same correlation method as in Degenhardt et al. (2022) is used for a better comparison, and this study builds upon their results.
In this section, the focus is on four factors, MSLP gradient, SST, Θe (850 hPa) and EGR (400 hPa). The authors have selected these four factors (see full Table A1) because they show coherent results throughout all investigation steps and a postulated link to windstorm forecast skill. More factors (see Table A1) have been tested within the three-step approach, but not all the required links could be clearly identified as discussed in Sect. 5. Additional results for the following five moderately performing factors can be found in the supplementary material (Figs. A3–A6 in the Appendix): EGR (700 hPa), MSLP meridional gradient, precipitation, divergence (200 hPa) and PV (350 K).
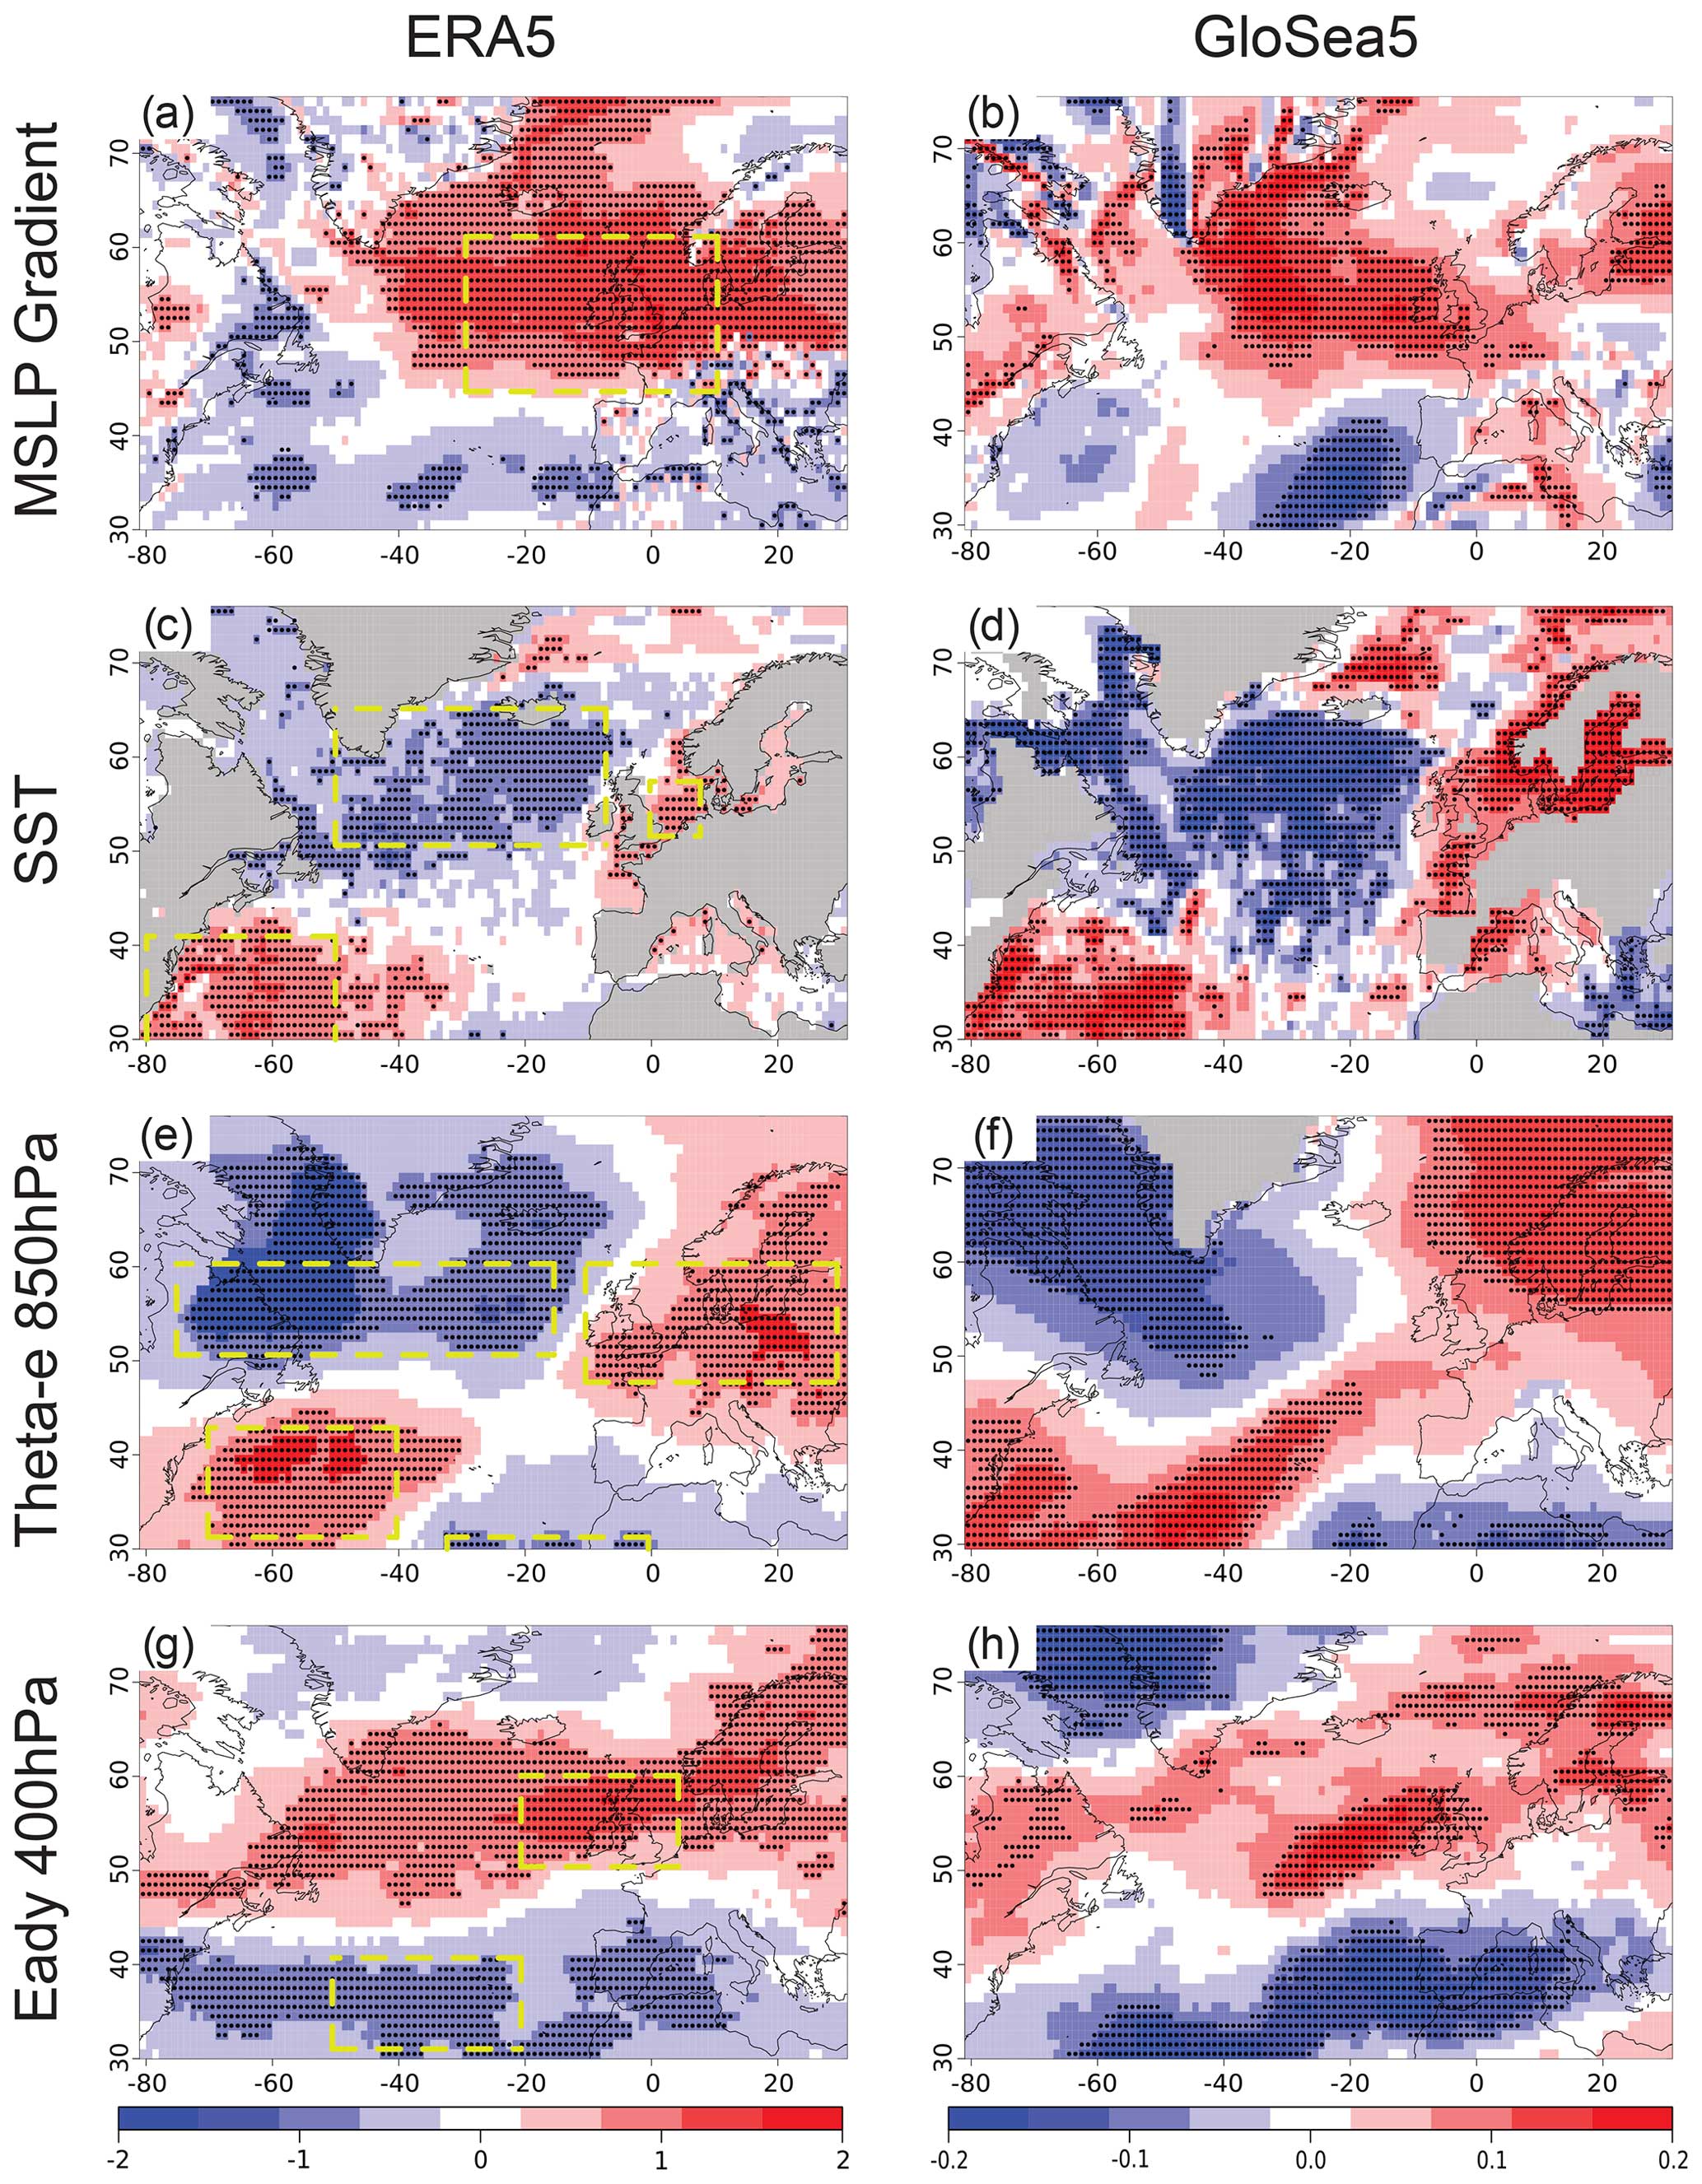
Figure 1Composite anomalies, standardised with respect to the climatology, of the respective factors for strong storm seasons minus weak storm seasons in ERA5 (left column) and over the mean of all GloSea5 ensemble members (right column): (a, b) MSLP gradient, (c, d) SST, (e, f) Θe, (g, h) EGR; dots are shown for differences significant at the 90 % level (p=0.9). The yellow boxes are the selected regions for investigation step 3 (see Fig. 4 right column, process-based view).
4.1 Validation of dynamical factors in GloSea5 via anomaly composite analysis – does the model represent the same physical connections between causal factors as the reanalysis?
Composite anomalies of the dynamical factors separated into strong and weak storm seasons in the observational and model data are compared in Fig. 1. Standardised composite anomalies for ERA5 and GloSea5 (mean over each ensemble member composite) are used to validate the connection between individual factors and windstorms in both data sets (Fig. 1). The composite anomalies between strong and weak storm seasons give a useful indication of how the factors are connected to windstorms.
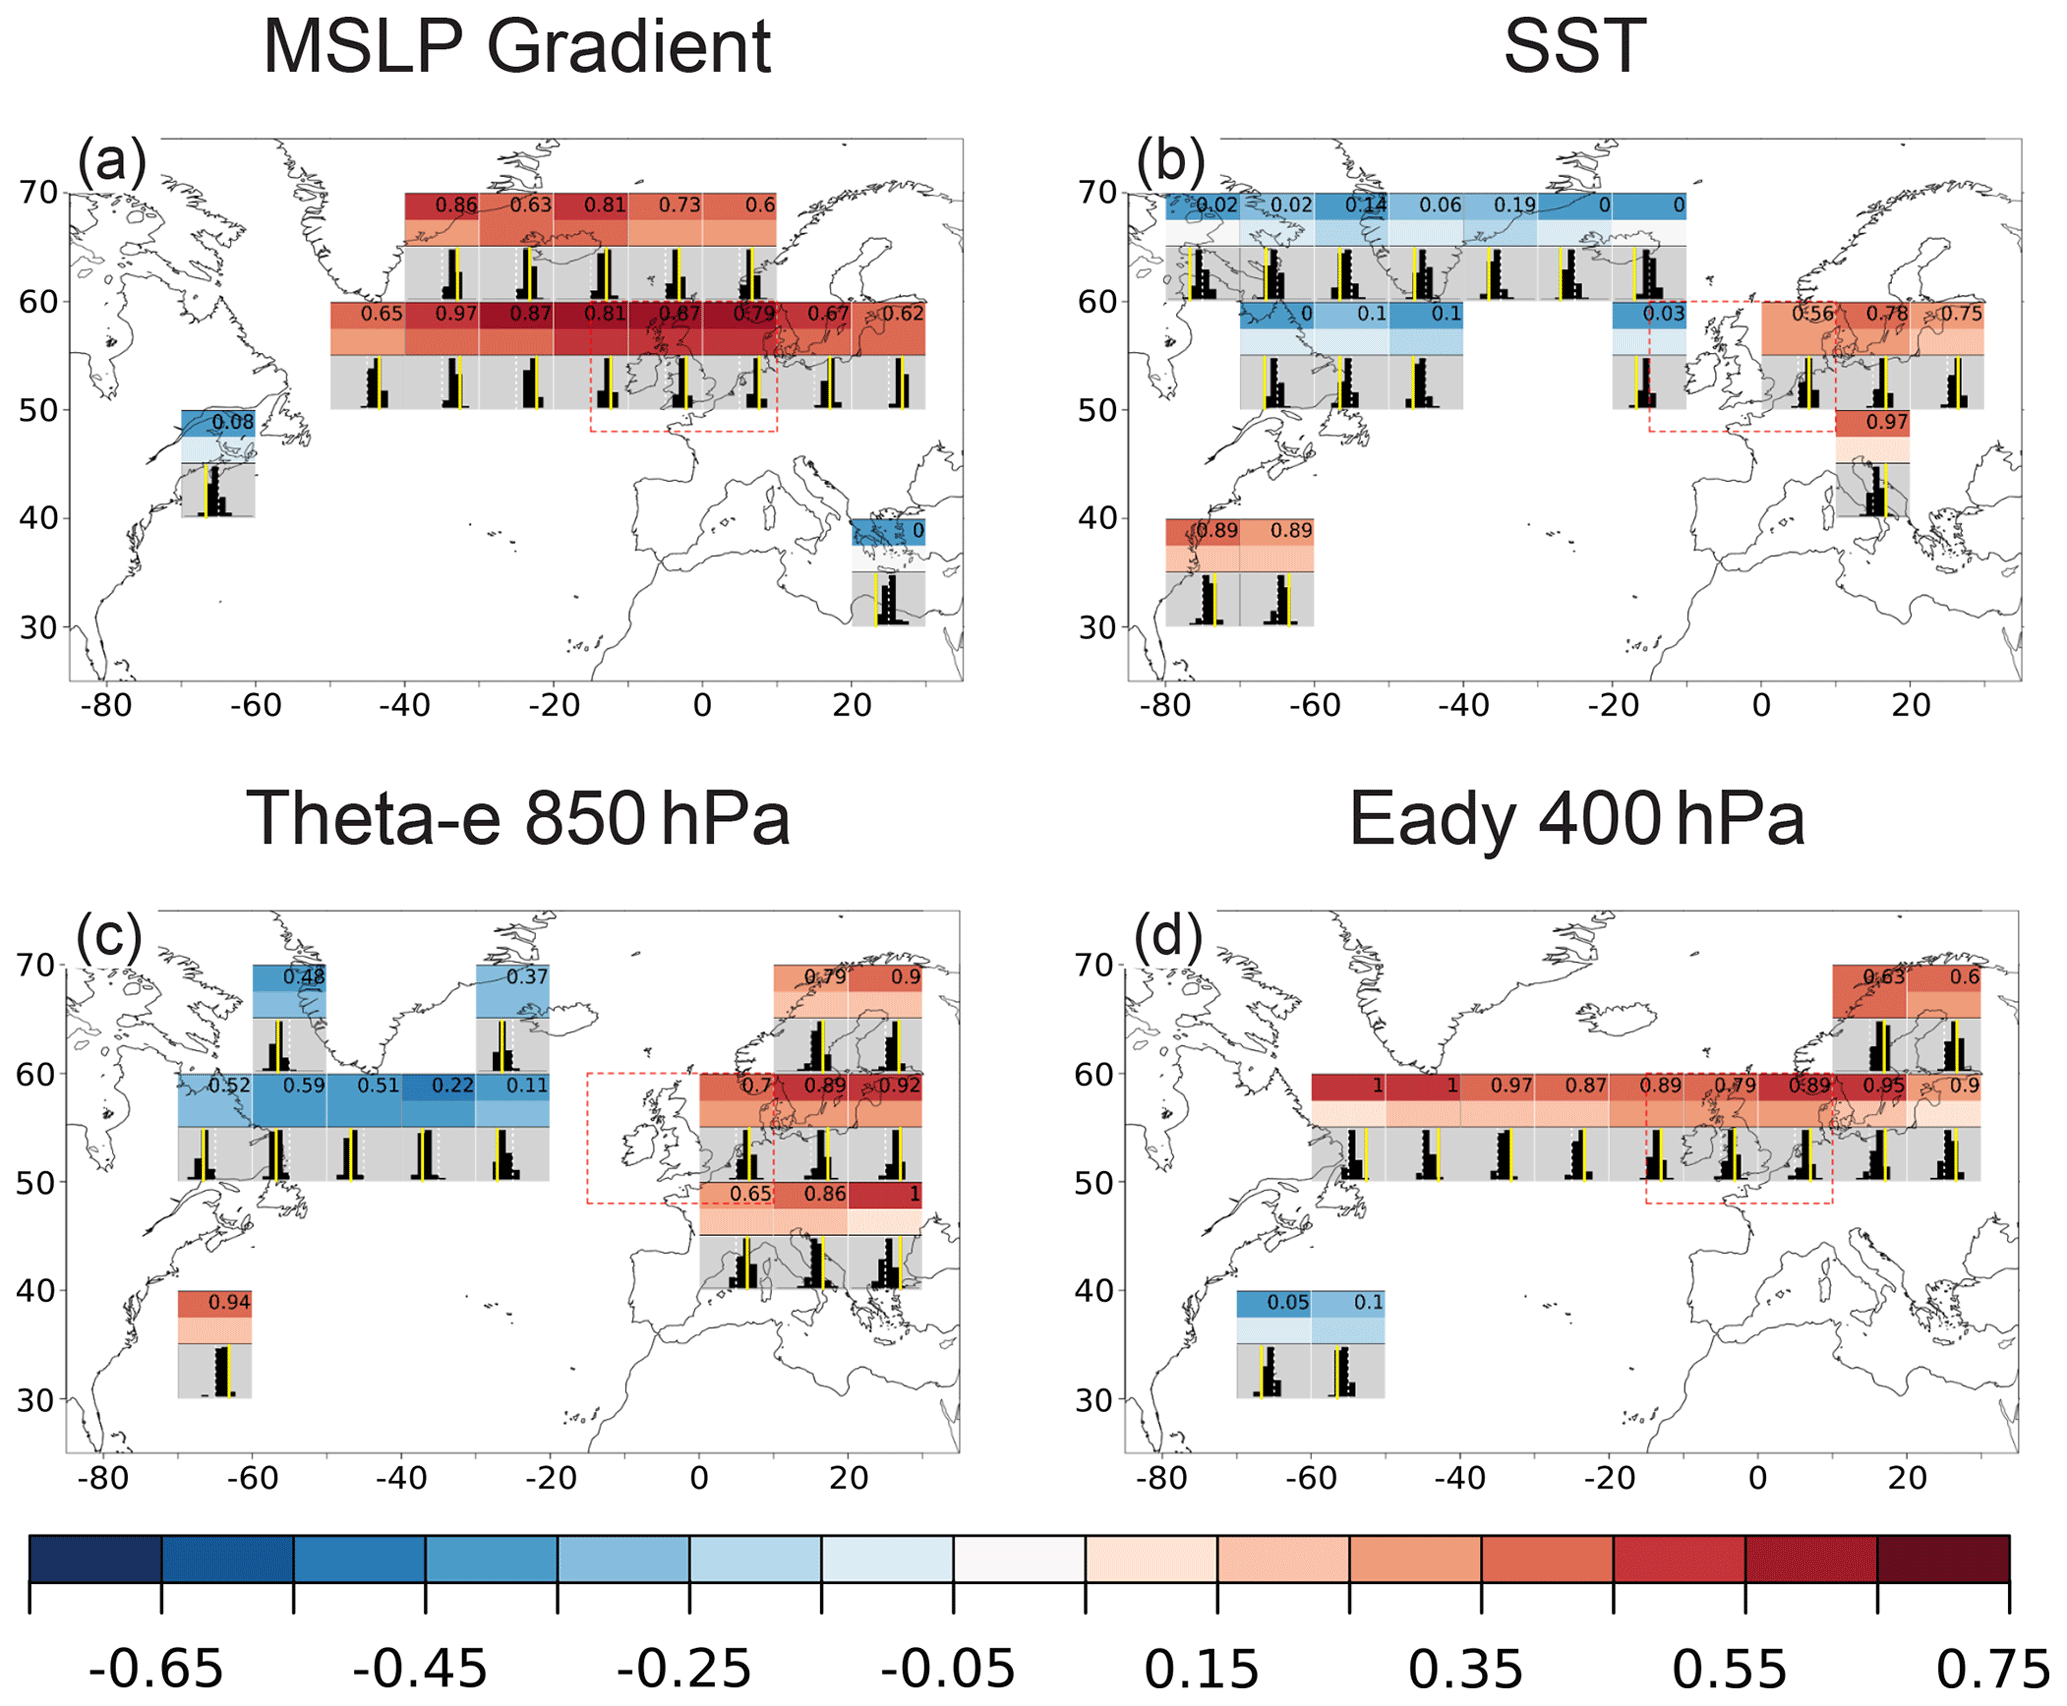
Figure 2Correlation maps between seasonal storm counts over the UK and dynamical factors (averaged in 10° × 10° regions): (a) MSLP gradient, (b) SST, (c) θe (850 hPa) and (d) EGR (400 hPa). Only factors with a 95 % significant correlation in ERA5 are shown. ERA5 connections (first row per 10°×10° box – colour), GloSea5 member connection mean (second row per 10°×10° box – colour), and GloSea5 individual member correlation distribution (histograms below). The distributions are scaled from −1 to 1 with 0 in the centre. The yellow line is the ERA5 correlation value within the GloSea5 member distribution, and the number in the first row represents the percentile of ERA5 in that distribution.
It is clear that a stronger storm season is characterised by a stronger MSLP gradient over the northern part of the North Atlantic, as expected. This pattern is coherent in observations and the model. The SST pattern (Fig. 1c and d) shows a clear tripole (positive–negative–positive anomaly) structure over the North Atlantic in both ERA5 and GloSea5 (Fig. 1d). The GloSea5 mean signal (mean overall ensemble mean composites) is weaker but still reveals a similar pattern. The three centres of action in the SST composite of ERA5 are also reflected in the composite pattern of Θe. The model means of the composites result in a quadrupole pattern for Θe but with a stronger influence of potential latent heat release over the centre of the North Atlantic than in ERA5. Also, the EGR (400 hPa) shows a clear and significant pattern over the North Atlantic, with higher baroclinicity in a latitudinal band around 50° N during strong storm seasons over the UK. These factors are known to have a link with cyclones and windstorms, but the former is also influenced by the latter. Nonetheless, the investigated windstorm systems (max 2 % of days per grid cell) influence the seasonal average factors only marginally.
The Appendix includes the composites for more factors (Fig. A3), like EGR (700 hPa), MSLP meridional gradient and PV (350 K), which show similar results to the previous factors, with a strong and coherent increase in the factor during stronger storm seasons over the UK in ERA5 and a good representation of the pattern in GloSea5. Nevertheless, precipitation shows a north–south dipole in ERA5 upstream of the British Isles and Iberian Peninsula that is less dominant in GloSea5 but also less relevant for windstorm forecasts. As Scaife et al. (2017b) suggest, tropical precipitation is also important for European storm forecast skill. The model has a strong signal and clear dipole around the Equator, revealing shifted precipitation in the tropics in strong UK storm seasons.
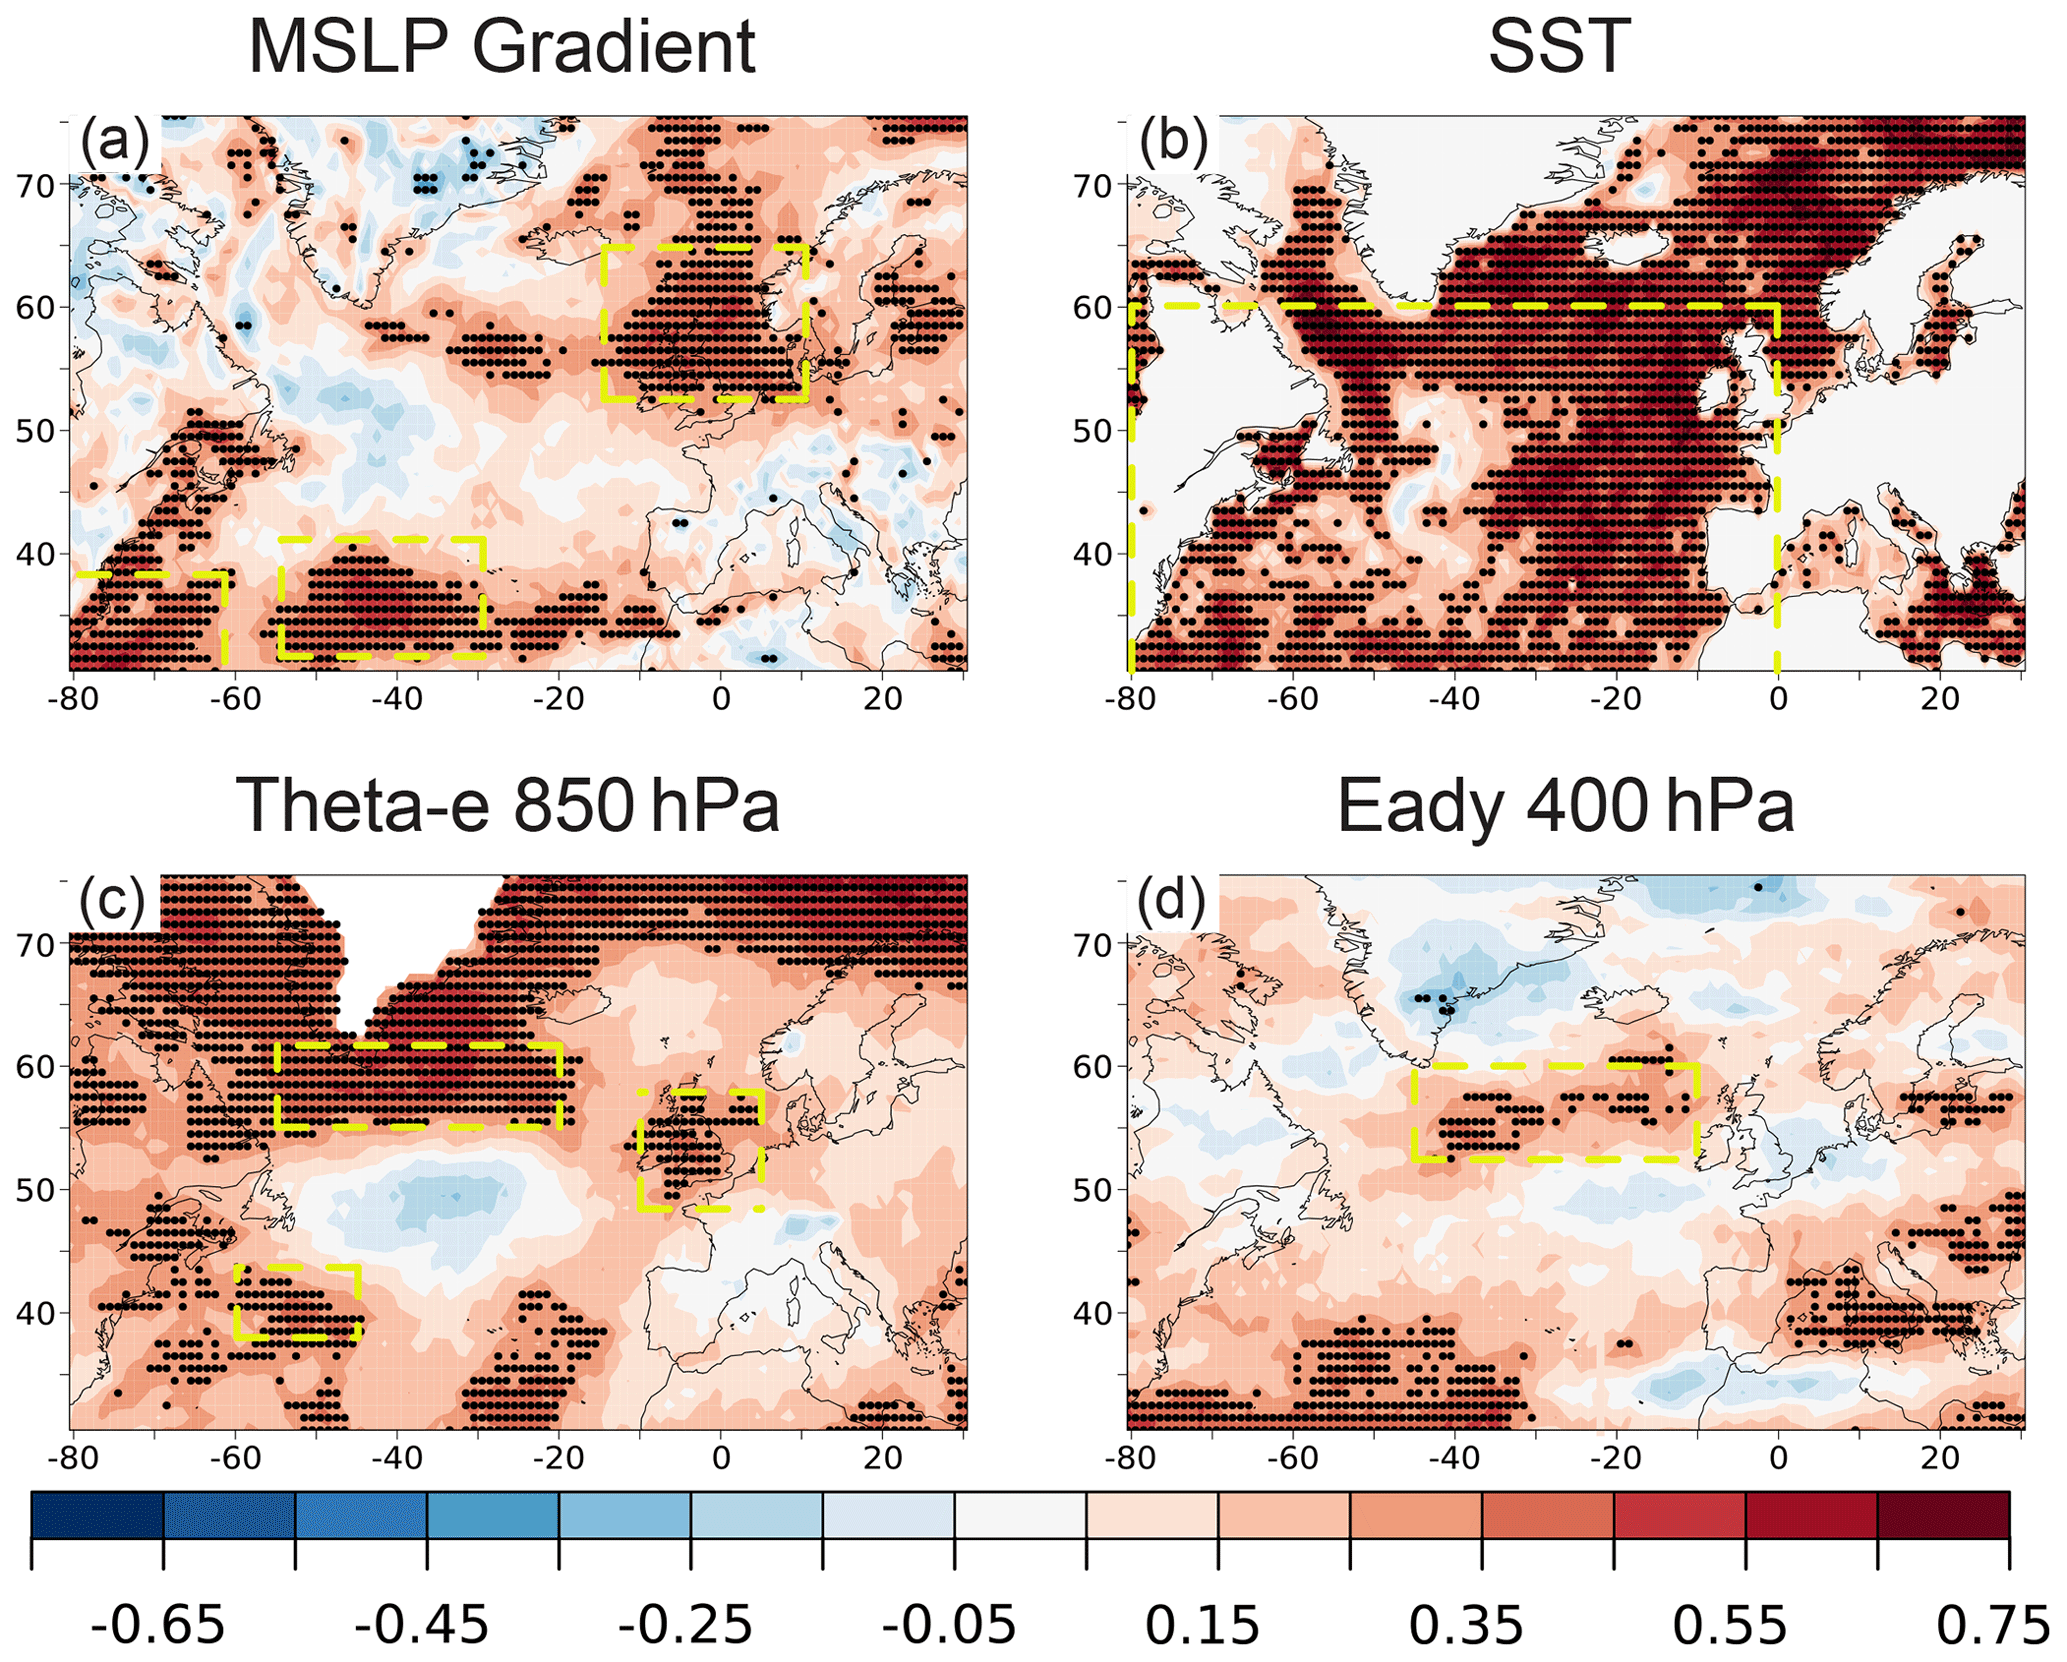
Figure 3Kendall correlation maps for the selected dynamical factors between ERA5 and GloSea5 per grid cell, with the significance on the 95 % level marked by a dot. The yellow boxes are the selected regions for investigation step 3 (see Fig. 4 left column, factor-skill view).
Composites are categorical separations of data sets that are useful for identifying the difference between two data sub-samples. A coherent link between storms and the factors is also of great interest. Hence, a correlation analysis between the factors' time series and windstorm frequency is used for additional validation (see Fig. 2). Maps are created to show the correlation link between the windstorm target region (the extended area of the British Isles) and systematic (10° × 10° boxes) regions over the North Atlantic. Figure 2 presents the four focused factors as examples, with the remainder in the Appendix (Fig. A4). These results show the regions where a factor is relevant for windstorms over the extended area of the British Isles (dotted red box in each panel) and how this connection is represented in the different ensemble members (histograms). The results can be separated into two parts. The first interpretation is comparing the ERA5 connection (first row of each box) to the GloSea5 member mean connection (second row of each box). All factors show that in each factor box the correlation results in the same sign in the ERA5 and GloSea5 member means. Factor regions which are further outside the storm-related area have some discrepancies, such as the MSLP gradient (Fig. 2a) and PV (Fig. A4e) region over Newfoundland and the eastern Mediterranean Sea. In these regions, GloSea5 members do not agree with the observed relation. This can be seen in the second part of this figure's interpretation, the percentile of ERA5 within the GloSea5 member distribution. For example, the region around Newfoundland of the EGR (400 hPa, Fig. 2d) in the ERA5 correlation is at the 100 % percentile of the GloSea5 member distribution, which means the correlation in ERA5 is outside the GloSea5 member correlation distribution and hence statistically different, as the percentile is greater than 95 %. In another example, the SST box over the North Sea (Fig. 2b) has an ERA5 percentile of 56 %, so the GloSea5 member distribution covers the ERA5 correlation.
4.2 Skill of factors – are the dynamical factors skilfully predicted?
The previous results suggest that relevant factors are well represented in their physical connection to windstorms. This was shown from an ensemble mean perspective (with composites, Fig. 1) but also within individual ensemble members (correlations per member, Fig. 2). Thus, the GloSea5 model represents a consistent physical development between respective factors and windstorms with a similar spatial pattern but weaker signals. The next step tests if these factors themselves are well predicted. Thus, this step evaluates how well the model suite can forecast the necessary ingredients for storm development. The storm-relevant regions (Sect. 4.1) should be well predicted to have a positive influence on the windstorm forecast performance. The Kendall correlation is used to assess the skill of the ensemble mean compared to ERA5. Figure 3 shows this correlation skill for the main four dynamical factors. The MSLP gradient has a skilful and coherent region of predictability over the North Atlantic and the British Isles. The SST is well predicted overall, with a small gap downstream of Newfoundland. The same gap but larger and with a stronger negative correlation is also identified for Θe. The EGR (400 hPa) correlates significantly in the region upstream of the British Isles, northeast of the Atlantic storm track. Beyond the four main factors discussed thus far, the EGR (700 hPa) reveals the same area of skill as in 400 hPa (see Fig. A5 in the Appendix). The MSLP meridional gradient shows an extended region of skill over the North Atlantic compared to the total gradient but no coherent skill over the British Isles. Precipitation, divergence and PV at 350 K show very little to no skilful prediction close to the target region, the British Isles and Europe. However, precipitation is skilfully predicted in the tropics (see Fig. A5 in the Appendix), which is the region Scaife et al. (2017b) suggested could be important for European predictability, as this convective precipitation would trigger Rossby waves which propagate towards Europe.
4.3 Relevance of factors for storm forecast skill – is the storm forecast skill (found by Degenhardt et al., 2022) related to the forecast skill of the factor or the regions that show a strong connection to windstorms?
The final step aims to find factors and individual regions influencing the seasonal forecast skill of windstorms. Therefore, the storm seasons have been split into two sub-samples to generate two storm forecast skills. These different storm season sub-samples are separated by two approaches, one by the individual forecast skill (factor-skill view, results from Sect. 4.2) and one by the centre of action from the composite analysis (process-based view, results from Sect. 4.1).
The factor-skill view and process-based view are explained in the following in more detail:
- a.
The factor-skill view answers the following question: “does the existing factor's forecast skill improve the windstorm forecast?” This first view focuses on the regions with already existing and significant factor skills, resulting from the forecast skill in step 2 (Sect. 4.2, Fig. 3). Therefore, regions that show coherent areas of skilful forecasts for the individual factors are selected. These regions are used to define the sub-samples in order to calculate the storm forecast skill. This would show whether the existing factor forecast skill is a source of the existing model's windstorm forecast and whether it might be a source of potential improvement. If this is the case, it would mean that the correct factor prediction leads to higher storm forecast skill. Thus, the storm seasons are split between well-predicted and poorly predicted factor seasons.
- b.
The process-based view focuses on the following question: “does an improved factor forecast in areas of a strong connection (centre of action) improve the windstorm forecast?” This second view uses the same method as the factor-skill view but with other selected regions to create the sub-samples. The regions used for this view are the ones that appeared to be the most relevant in the connection between the factor and windstorms (centre of action – Sect. 4.1, Fig. 1). This view aims to assess whether a better prediction of the factors in these storm-relevant regions would improve the seasonal windstorm forecast skill. These regions have not necessarily been selected because they are skilfully predicted in GloSea5 but because they show a physical link between storms and factors.
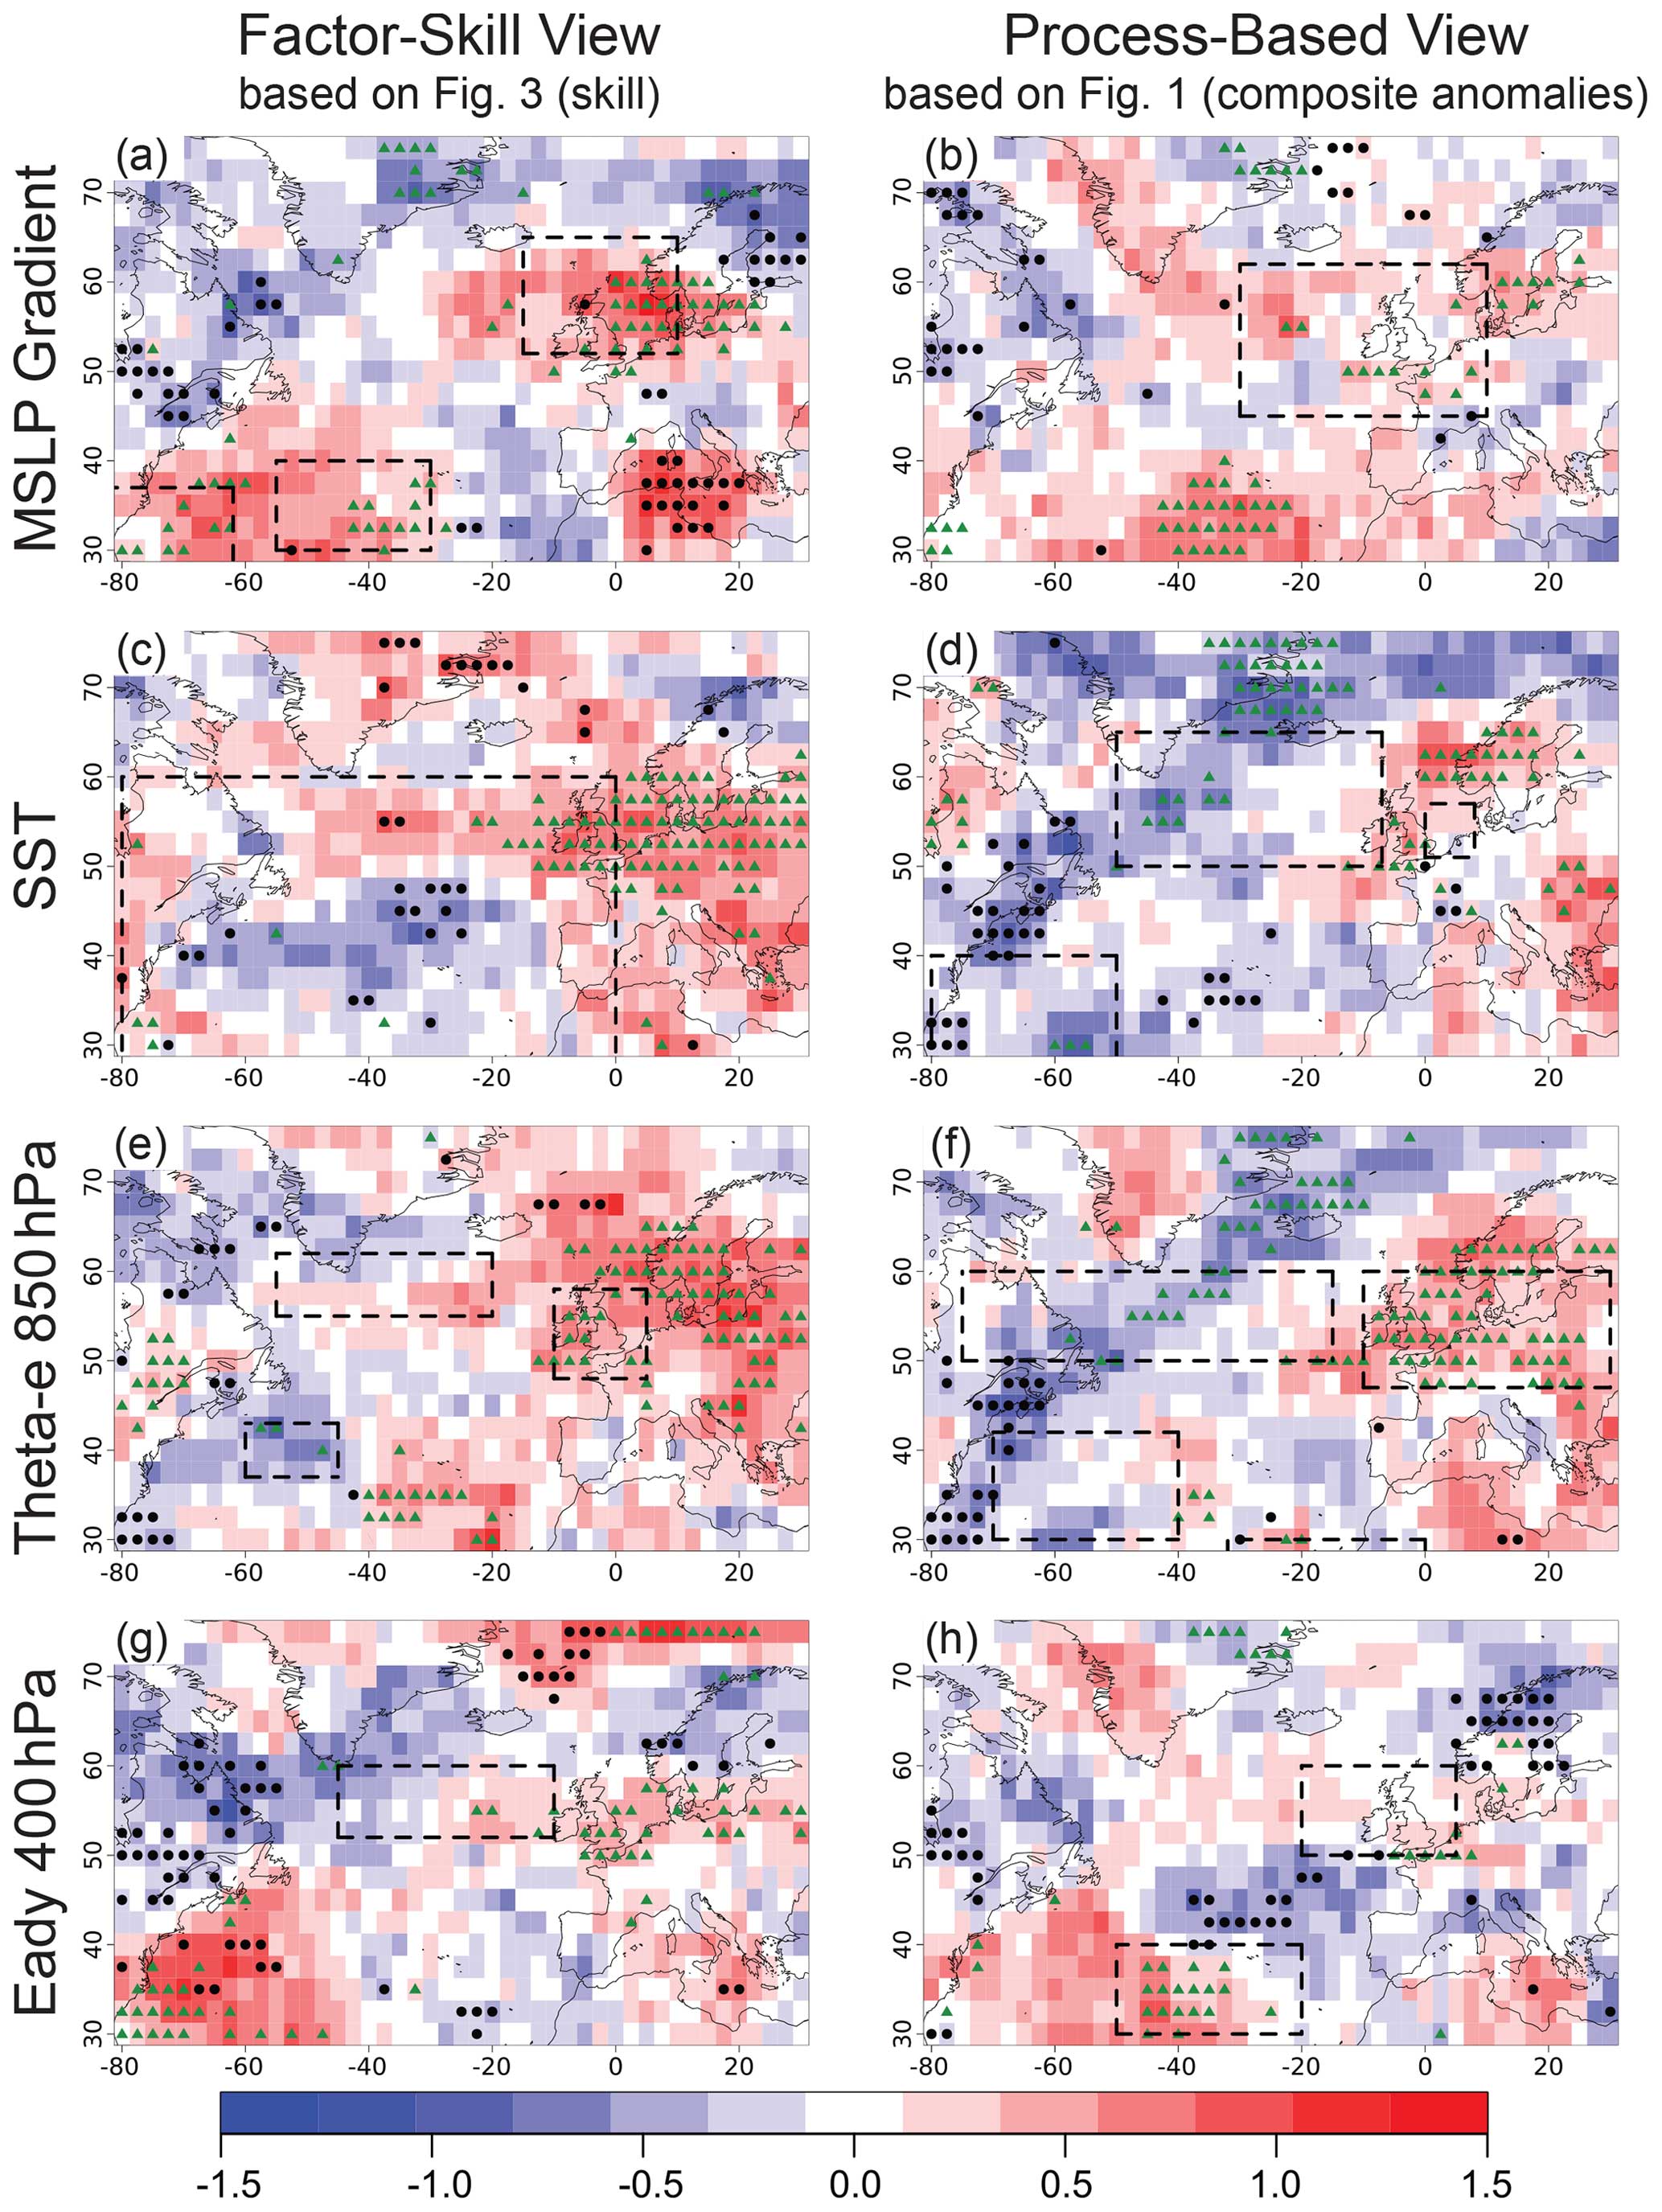
Figure 4Difference in windstorm forecast skill (as Kendall correlation between ERA5 and GloSea5 windstorm frequency) with seasonal separation by the factor-skill view (a, c, e and g, based on Fig. 3) and the process-based view (b, d, f and h, based on Fig. 1). The data set is separated individually per factor into well-predicted and badly predicted seasons, depending on the individually selected boxes. The Kendall correlation is calculated for each sub-sample, and shown here is the difference between them (well predicted minus badly predicted). The black dots indicate grid cells with significant storm forecast skill in the factor of badly predicted seasons, while the green triangles indicate significant forecast skill in the factor of well-predicted seasons.
The differences in the respective forecast skill of the storm frequency for these two approaches are shown in Fig. 4. The left column (Fig. 4a, c, e and g) provides the differences in skill for the factor-based view and the right column (Fig. 4b, d, f and h) the difference in forecast skill for the process-based view. The region used for separation is marked individually in each panel (see also Tables A2 and A3). For both views, the selected regions (which can be multiple) are spatially averaged, and well-predicted and poorly predicted seasons are detected by the absolute difference between the resulting ERA5 and GloSea5 factors in the regions used. The selected regions are those in which the respective factor is skilfully predicted for the factor-skill view. For the process-based view, this is not a criterion. In both approaches a red (blue) colour in the results (see Fig. 4) means that a well-predicted factor in the marked regions leads to an increase (decrease) in seasonal windstorm forecast skill at the respective area.
Three boxes with high skill were identified from the MSLP gradient forecast skill analysis (see Fig. 3a). The correlation difference in Fig. 4a shows the storm forecast skill for years which are overall well predicted minus storm forecast skill for poorly predicted years within these boxes. It can be concluded that the years in which the MSLP gradient in these three regions is well predicted show an increase in storm prediction skill over parts of the North Atlantic, British Isles and Scandinavia. The second view, separated by centres of action in the composite anomalies (Fig. 1a), shows a less strong increase in storm forecast skill for the selected region of the MSLP gradient but still a slight increase in skill over Scandinavia. As SST was overall well predicted (Fig. 3b), the whole North Atlantic region was used to identify well-predicted and badly predicted SST seasons for the factor-skill view (Fig. 4c). When SSTs over the North Atlantic are well predicted, the total storm prediction skill over Europe increases. The northern European part shows that well-predicted years have a significant value on these grid cells, but the badly predicted ones do not. The process-based view for SST uses the four centres of action defined from the composite analysis (Fig. 1c) in the North Atlantic. A good forecast in these four centres of action implies an increase in windstorm forecast skill over Europe as well but with a weaker change and mostly only with skill over Scandinavia. The Θe relevance for windstorms is tested by using three regions of skilful Θe forecasts (Fig. 3c). When all of these three regions are well predicted, the windstorm forecast skill over Europe, especially Scandinavia and eastern Europe, increased (Fig. 4e). SST and Θe show very similar centres of action, and the Θe process-based view (Fig. 4f) has four selected boxes that are similar to SST (Fig. 4d). A possible explanation might be that higher SSTs can result in more convection and hence more moisture in 850 hPa and a higher Θe. A good forecast of Θe in these four boxes implies an overall increase in seasonal windstorm forecast over Europe. This increase in Fig. 4f is higher and covers a bigger area than the increase in well-predicted SST regions (Fig. 4d), which might be because Θe influences cyclonic systems directly, and SST is a more global state surrounding the cyclonic systems. The relevant signal from the factor-skill view is not as strong for the EGR in 400 hPa (Fig. 4g and h) as for the previous three factors in the respective views but is still a well-predicted region related to an increase in storm forecast skill downstream of the box and over the British Isles. In addition to the factor-skill view, the process-based view shows less increase in windstorm forecast skill for the EGR compared to the previous three factors. The remaining factors can be found in Fig. A6 in the Appendix. The EGR in the lower troposphere (700 hPa) has two very similar boxes in both views and hence almost the same increase in windstorm forecast skill over Europe. Factors like MSLP meridional gradient, precipitation and divergence show that the skill-dependent selected regions increase the windstorm forecast skill over Europe. The process-based view shows increasing signals for factors like precipitation and PV 350 K.
For the last result step it can be summarised that both views, the factor-skill view and process-based view, show an increase in windstorm forecast skill when the respective dynamical factor is well predicted. But the factor-skill view, based on regions that already have skilful factor forecasts, shows higher increases in most dynamical factors than the process-based view, which is based on the physical connection of the factors to windstorms. This means that the model gains the most windstorm forecast skill from the good representation of the dynamical factors independent of their physical connection to windstorms. The latter has a weaker effect and potential for improvements.
This study investigates the connection between atmospheric dynamical factors and the forecast performance of seasonal winter windstorm predictions. As skilful seasonal prediction for tracked windstorms has recently been shown (Befort et al., 2019; Degenhardt et al., 2022; Lockwood et al., 2023), this study aimed to explain the forecast skill further. A dependency of windstorms and their forecast skill on large-scale patterns, like NAO, SCA and EA, has also previously been established (Degenhardt et al., 2022). Here, a more in-depth analysis of the mechanics of forecast skill generation is presented, and, consequently, 10 dynamically important factors were selected and tested in multiple settings concerning their impact on the seasonal forecast skill of windstorm frequency (see Table A1). To reflect on the main contribution of these individual processes to the complex development of extra-tropical cyclones and storms, a differentiation has been made between small- and short-scale and large- and long-scale factors. These factors are investigated in a three-step approach: first, the relevance of the factor to winter windstorms is validated; second, the forecast skill of the individual factor itself on a seasonal scale is assessed; and third, the relevance of the factor's forecast for the overall winter windstorm frequency forecast skill is evaluated.
The ERA5 composite anomalies of the four focus factors, MSLP gradient, SST, Θe and EGR (400 hPa), show a strong link between windstorms and factors. This agrees with the literature, as these four factors are known to be the strongest factors for storms and cyclones (e.g. Pinto et al., 2008). The relation to windstorms for all these important factors is well simulated in the seasonal forecast suite, GloSea5. The SST shows a known horseshoe anomaly pattern (Czaja and Frankignoul, 1999), and a clear connection is identified with a positive SST and Θe signal over Europe (Northern Sea and Baltic Sea) leading to stronger storm seasons as stronger SSTs may enhance Θe, leading to more baroclinic instability in the lower troposphere. The lower-tropospheric EGR (700 hPa) agrees with this concept in ERA5, as the stronger EGR (700 hPa) reaches over the North Atlantic to central Europe, although it is more limited in GloSea5. Similarly, the SST composites in GloSea5 show three centres of action (positive – east of America, negative – south of Iceland and positive – North Sea), but a more extended negative SST composite anomaly in GloSea5 further south over the North Atlantic is in line with the recently found SST bias south of Greenland in CMIP6 models causing a bias in cyclone tracks (Priestley et al., 2023). The Θe composite anomalies of GloSea5 show a slightly different pattern over the North Atlantic, with a more extended positive signal than in ERA5, reaching from southwest to northeast. This is in line with the results from the factor precipitation, where in GloSea5, the North Atlantic precipitation is simulated further west. Studies like Fink et al. (2009) and Pinto et al. (2008) investigated storms from a Lagrangian perspective, but some of their characteristics can also be seen in the Eulerian view presented here. The dry pole in the northwest Atlantic is in line with Fink et al. (2009) and shows the general atmospheric state around an extreme cyclone with dry air behind. The composites of EGR (400 hPa) in ERA5 and GloSea5 show a strong link to EGR just upstream of the target area (extended region of the British Isles). The pattern in GloSea5 is in line with the knowledge that the EGR affects strong cyclones in a west–east band through their centre (Pinto et al., 2008), and the cyclone centre is located north of the windstorm field (see Leckebusch et al., 2008), which explains the strong EGR influence north of the North Atlantic storm track.
The physical connections between windstorms and individual factors within the model data mostly agree with the observed connections. These connections may enhance model forecast performances when the individual factors are well forecasted in storm-relevant regions. The individual forecast skills of these factors show high and significant skill in windstorm-relevant regions over the North Atlantic but also have gaps. The forecast skill of the upper-tropospheric EGR is significant at the northeastern end of the Atlantic storm track, an important area for intensifying strong cyclones before landfall in Europe. Even the forecast skills of the MSLP gradient, SST and Θe show significant skill around the British Isles, but the area around 50° N and 40 to 50° W is a challenge for these factors. This reduction in forecast skill may link to previous studies, e.g. Scaife et al. (2011) and Athanasiadis et al. (2022), which have identified large SST biases in model data.
After the factors have been verified as having the same physical link in observations and models and the model shows forecast skill for important regions of the factor, the third step is connecting the factor performance to windstorm forecast skill. It has been found that all major factors increase the forecast skill of winter windstorms over the British Isles and the North Sea by increasing the forecast skill of relevant factors in storm-relevant regions. SST and Θe additionally improve the windstorm forecast skill over central Europe and southern Scandinavia. The process-based view, sub-sampling based on the centre of action from the composite analysis (step 1), is less conclusive. But the factors SST and Θe present four centres of action, helping to increase the windstorm prediction over Europe when these regions are well predicted.
The overall conclusion of this three-step approach leads to a well-represented connection between the four focused dynamical factors and winter windstorm forecast skill. All four factors (MSLP gradient, SST, Θe and EGR 400 hPa) show agreement in the physical link, via composite analysis and in the stricter correlation maps, suggesting the model does include the overall physical link correctly. The model provides positive forecast skill within relevant regions for all four factors, which means the model performance for the individual factor is positive. The final investigation step shows that well-predicted seasons of the factors in the relevant regions support skilful windstorm forecasts.
In addition, the further investigated factors (see Appendix) show similar results. Well-predicted regions of precipitation and divergence over the tropics and sub-tropics have a positive influence on storm predictability over Europe. For precipitation, this is in line with Scaife et al. (2017b), who found that tropical Atlantic precipitation is an influencing factor for European predictability of atmospheric patterns. Further crucial factors (not shown) in this study are e.g. the Rossby wave source (RWS), SST gradient (total and meridional component) and the North American–North Atlantic temperature gradient identified by Wild et al. (2015). The RWS factor did not show a clear pattern or relation. The ERA5 composite is very scattered, but the GloSea5 mean at least shows a pattern agreeing with the conceptional idea of the tropical North Atlantic precipitation triggering convective rising, which triggers the RWS further north (Scaife et al., 2017b). A similar scattered result is seen from all analysis steps for the SST gradients. The temperature dipole from Wild et al. (2015) has been tested, as a connection between North American surface temperature and North Atlantic sea surface temperature anomalies are linked to windstorms over Europe. But the results in this study are not conclusive, probably because the storm target region differs in both studies.
This study concludes that the existing windstorm forecast skill in GloSea5 can be explained by different dynamical atmospheric factors connected to cyclones and windstorms. Thus, the model predicts the winter storm season well for what appears to be the correct reasons, increasing forecast confidence. Large-scale factors like the MSLP gradient or SST strongly relate to windstorms in both the observational and the model data sets. Their seasonal forecast skill is high in storm-relevant regions, and seasons that are well predicted have a positive influence on windstorm forecasts. The same is found for factors like Θe in 850 hPa and EGR in the upper troposphere. This approach results in a new understanding of dynamical factors and covers multiple perspectives, which implies new knowledge about where the windstorm forecast skill might originate. This also reveals areas for additional effort needed to potentially improve windstorm forecast skill over the downstream end of the North Atlantic storm track and to tackle the signal-to-noise paradox, which is shown to affect storminess in Degenhardt et al. (2022). The signal-to-noise paradox is a known limitation for seasonal prediction skill, which may also limit windstorm forecast skill and its influencing factors.
This part of the Appendix includes additional information about the method and calculation for the dynamical factors, hence for Sect. 3.2.
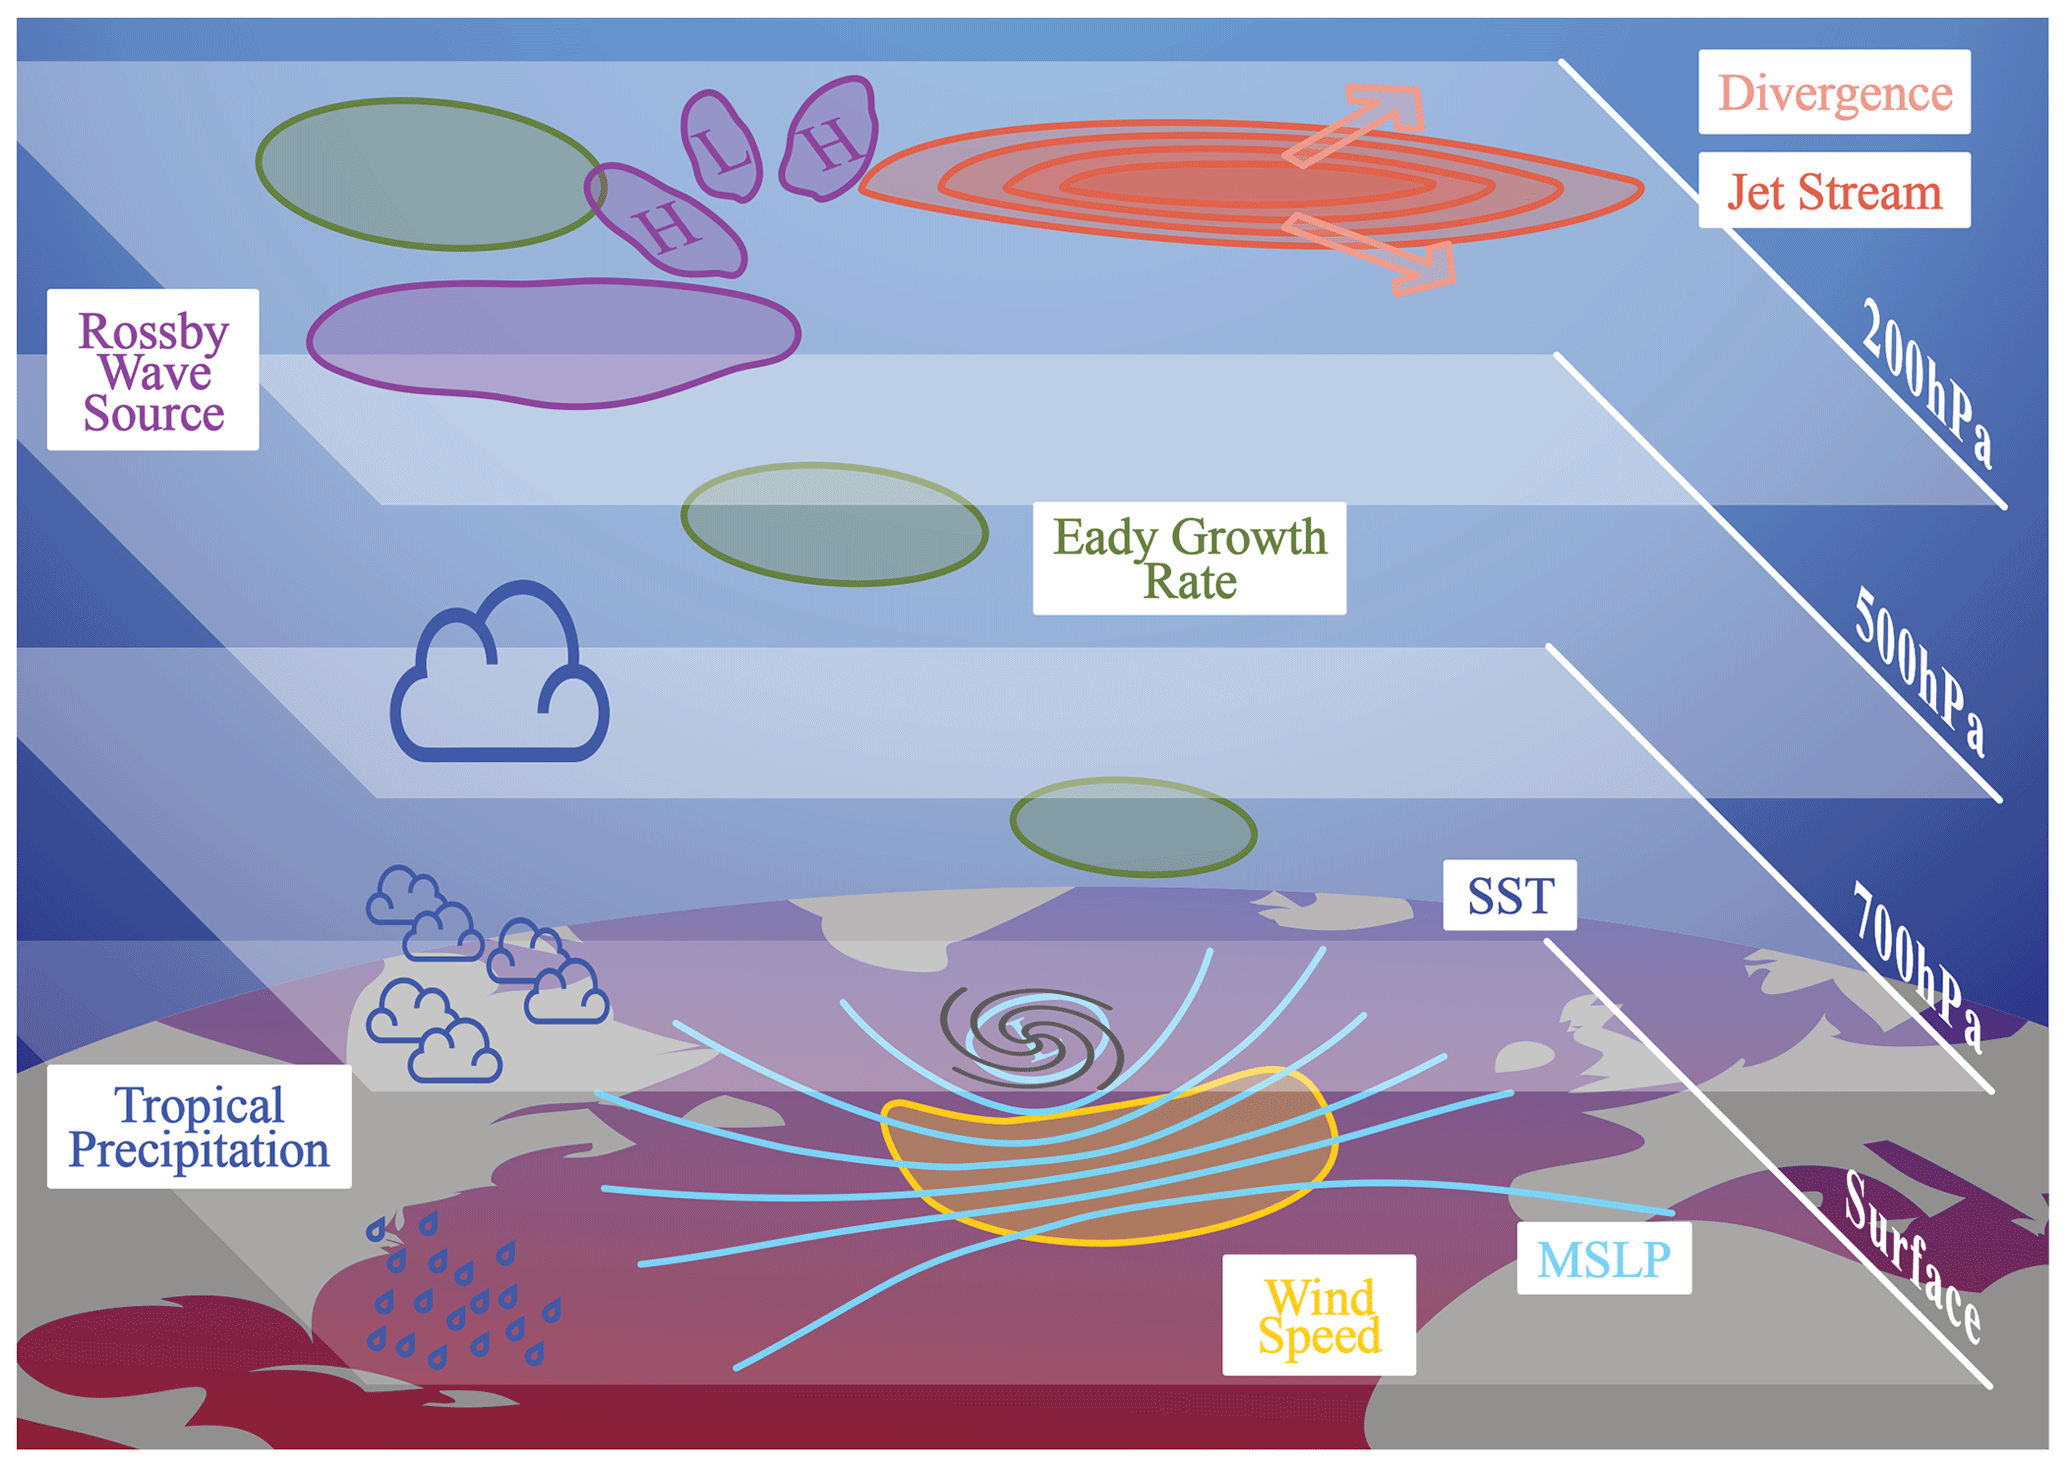
Figure A1Schematic of the spatial location of factors compared to an idealised storm system.
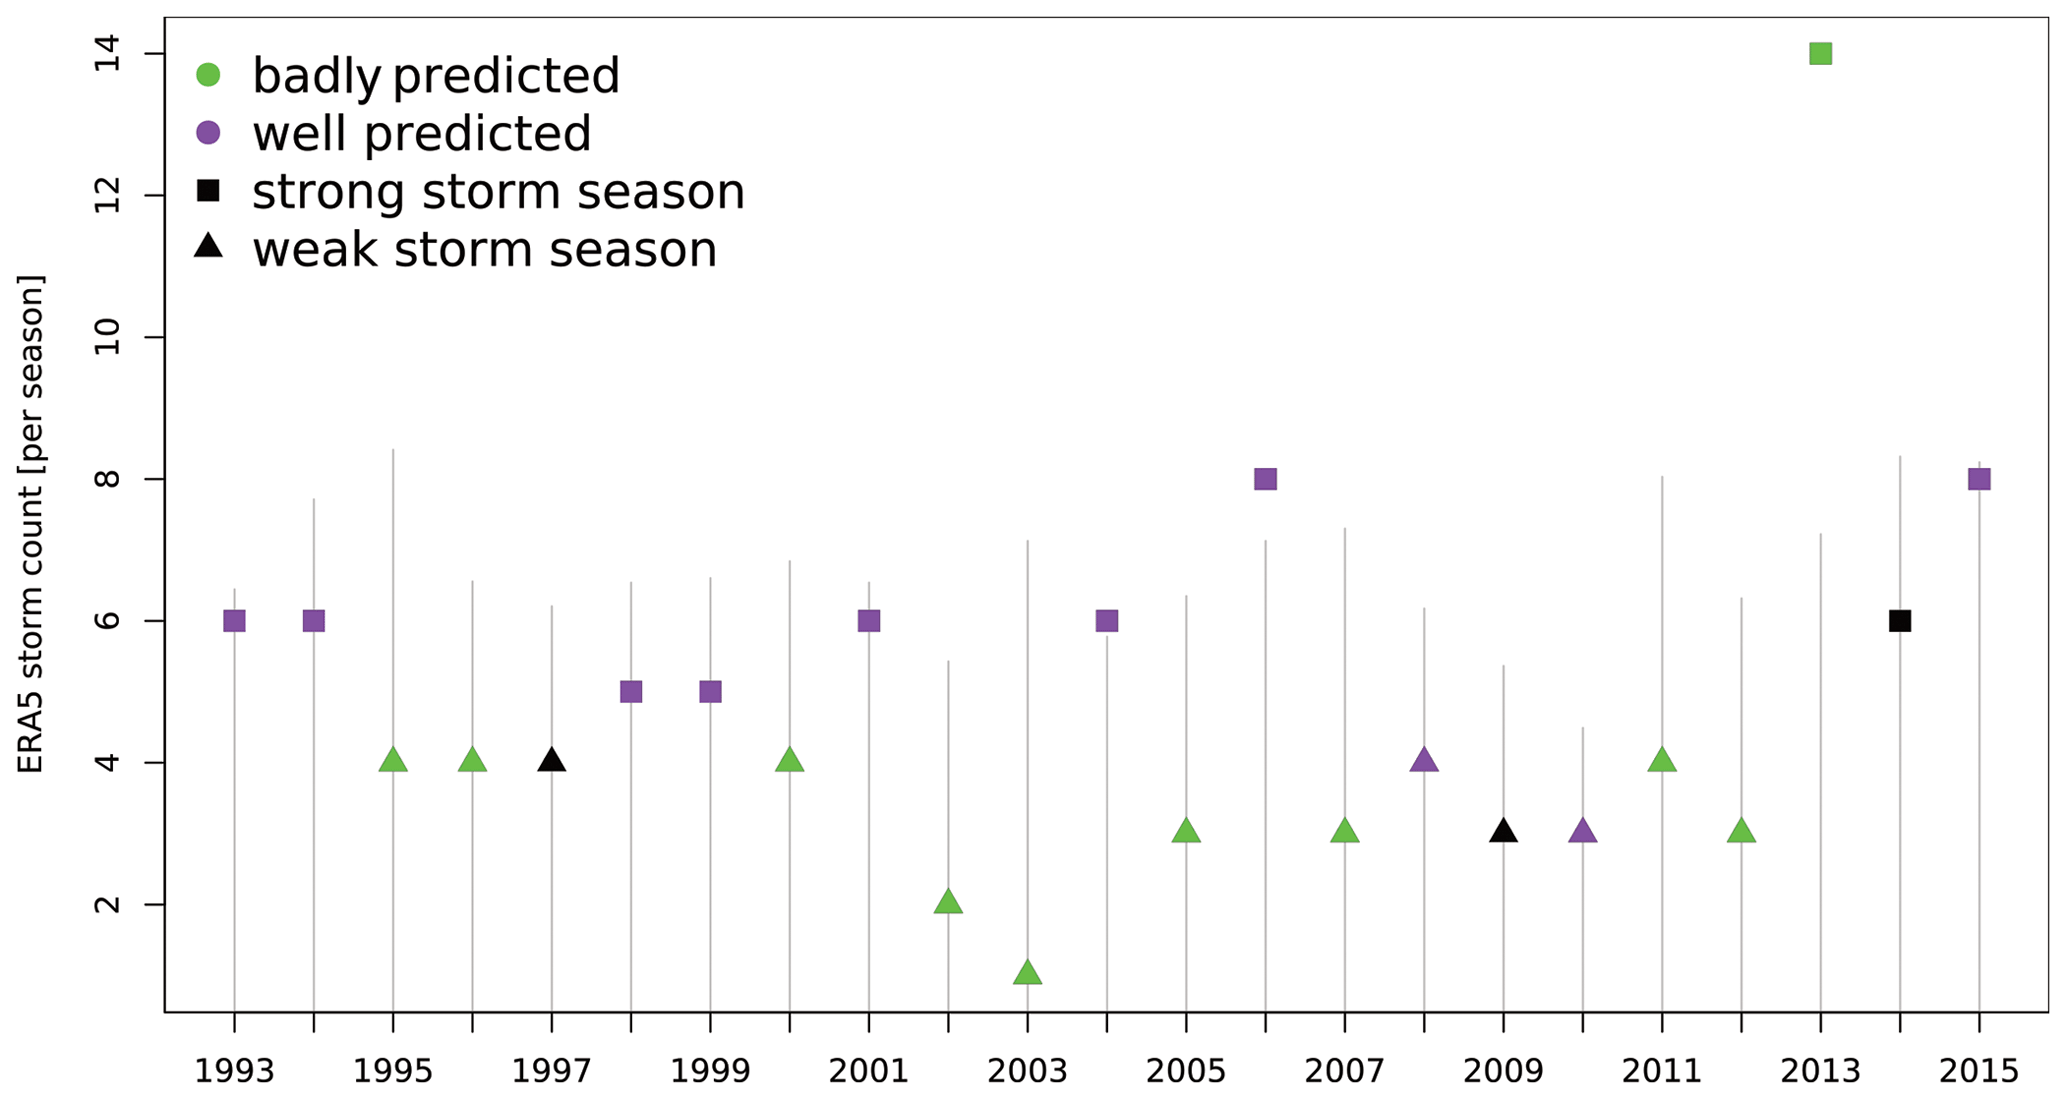
Figure A2ERA5 UK storm counts represented as dots and GloSea5 ensemble mean counts represented as bars. Badly predicted seasons (green), well-predicted seasons (purple), strong ERA5 seasons (squares) and weak ERA5 seasons (triangles).
Table A1Dynamical factors (all tested for this study) concerning storminess, cyclones or windstorms over Europe.
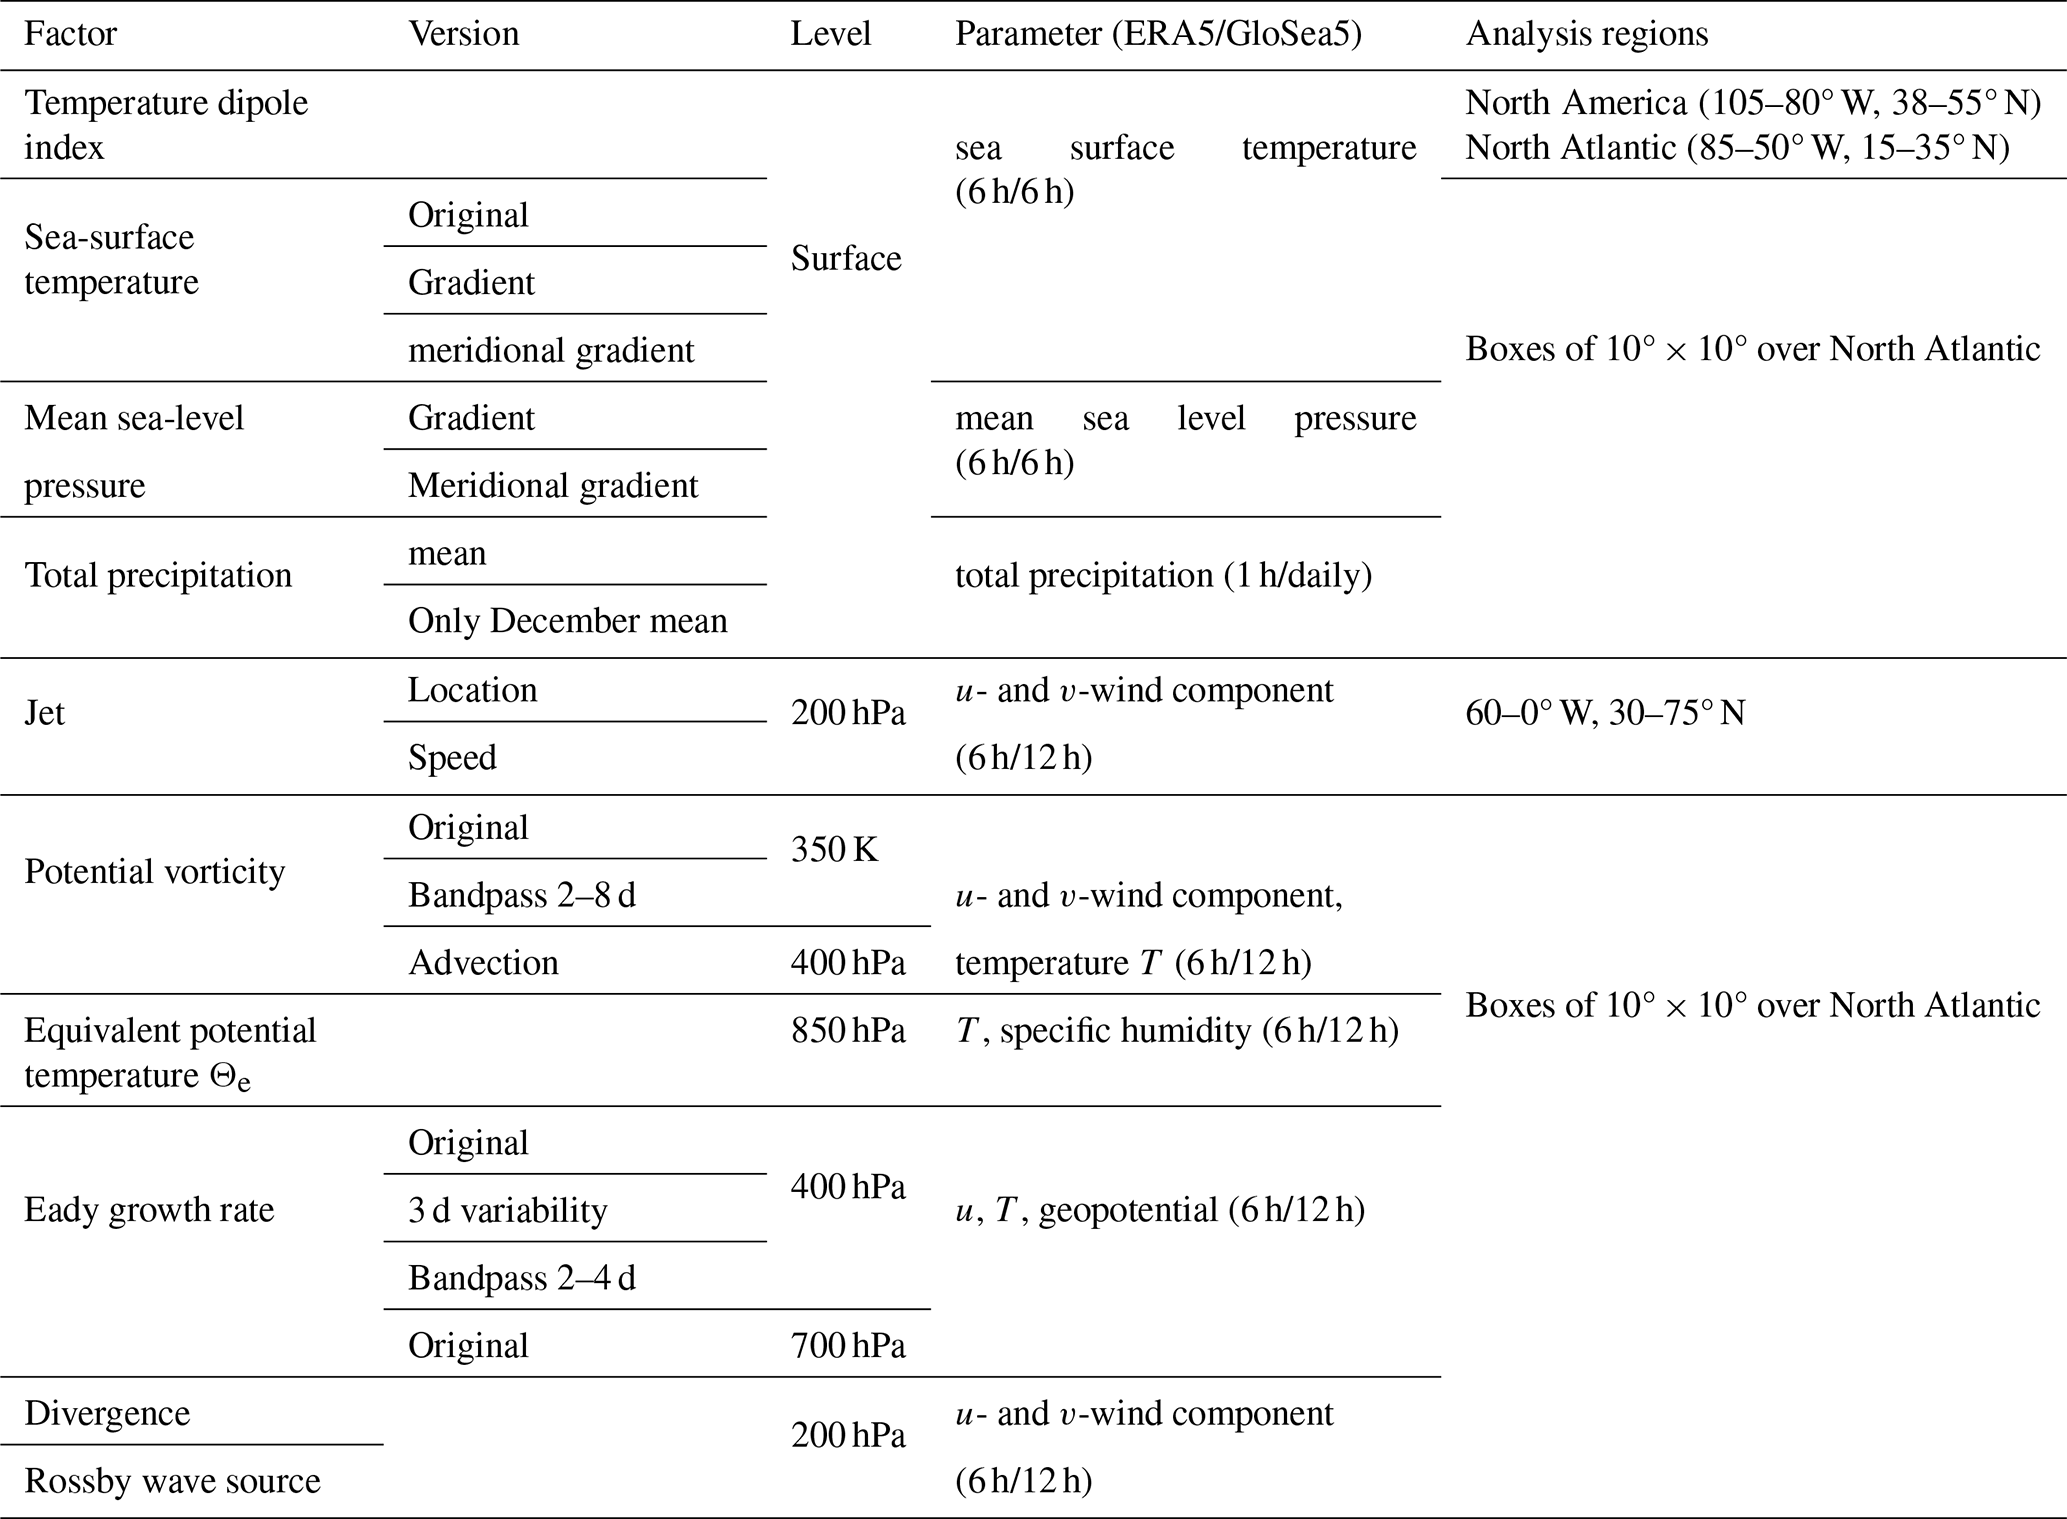
MSLP and SST represent more general information about environmental conditions. Their respective gradients are calculated using the NCAR Command Language (NCL) implemented function (grad_latlon_cfd), and the absolute value of the gradient vectors is computed. The Climate Data Operator (CDO; Schulzweida, 2019) has an implemented function (uv2dv) to calculate the respective wind divergence from both wind components (u and v). To calculate the Rossby wave source (RWS), the Python package windspharm (Dawson, 2016) was used as an example script from GitHub. This script is based on the RWS equation used, e.g. by Beverley et al. (2019) and Dunstone et al. (2018). Studies like Parker et al. (2019) have investigated the jet stream with respect to its seasonal predictability and connection to the NAO. This study follows their calculation of jet location and speed but for 200 hPa rather than 850 hPa. The jet is defined over a 9 d running mean of the zonal average of the wind; only the u component and the total wind were tested. The jet location is defined here as the latitude at which the maximum wind (u or total wind) is found, and with jet speed the respective wind is used. An investigation from Wild et al. (2015) analysed how temperature anomalies over North America and the North Atlantic can influence the winter windstorm season over Europe. They created a temperature dipole index which uses surface temperature at two regions, one over North America (38–55° N, 105–80° W) and one over the western North Atlantic (15–35° N, 85–50° W). The difference in the respective anomalies creates the so-called temperature index. The PV (Hoskins, 2015; Hoskins et al., 1985) is calculated using two implemented NCL functions (pot_vort_isobaric and int2p_n_Wrap). Therefore, first, the pressure level data are used to calculate PV on pressure levels, and second, these values are interpolated onto Θ levels. The 350 K level is used later in this study. The PV advection is calculated from the pressure level data and then advected by both (u and v) wind components. Θe as an individual factor on 850 hPa (Chang et al., 1984) is calculated with the NCL function, pot_temp_equiv. The Eady growth rate (EGR) is calculated with an implemented NCL function (eady_growth_rate) which uses the two-layer approach. This means whenever it is referred to with the EGR at 400 hPa, it is calculated using data from 300 hPa and 500 hPa, and for the EGR at ∼ 700 hPa, it is 500 and 850 hPa. PV and EGR are additionally analysed in this study after post-processing with a bandpass filter. This bandpass filter was run with an R-implemented function using the Butterworth filter (Butterworth, 1930), with filter characteristics of 2 to 8 d for PV and 2 to 4 d for EGR. The filter was performed for each GloSea5 member individually. Because of data storage and computational times, the filtering was only executed for a region from 30 to 75° N and −100 to 40° E. The total precipitation is used as in Scaife et al. (2017b) to investigate the link between tropical precipitation and the predictability of European climate conditions, like geopotential height. To not be restricted to the four tropical regions used in Scaife et al. (2017b) and for a better comparison to the other factors used, the seasonal precipitation mean is investigated on the grid cell level.
This part of the Appendix includes the results for the remaining tested dynamical factors. Therefore, it belongs to Sect. 4.
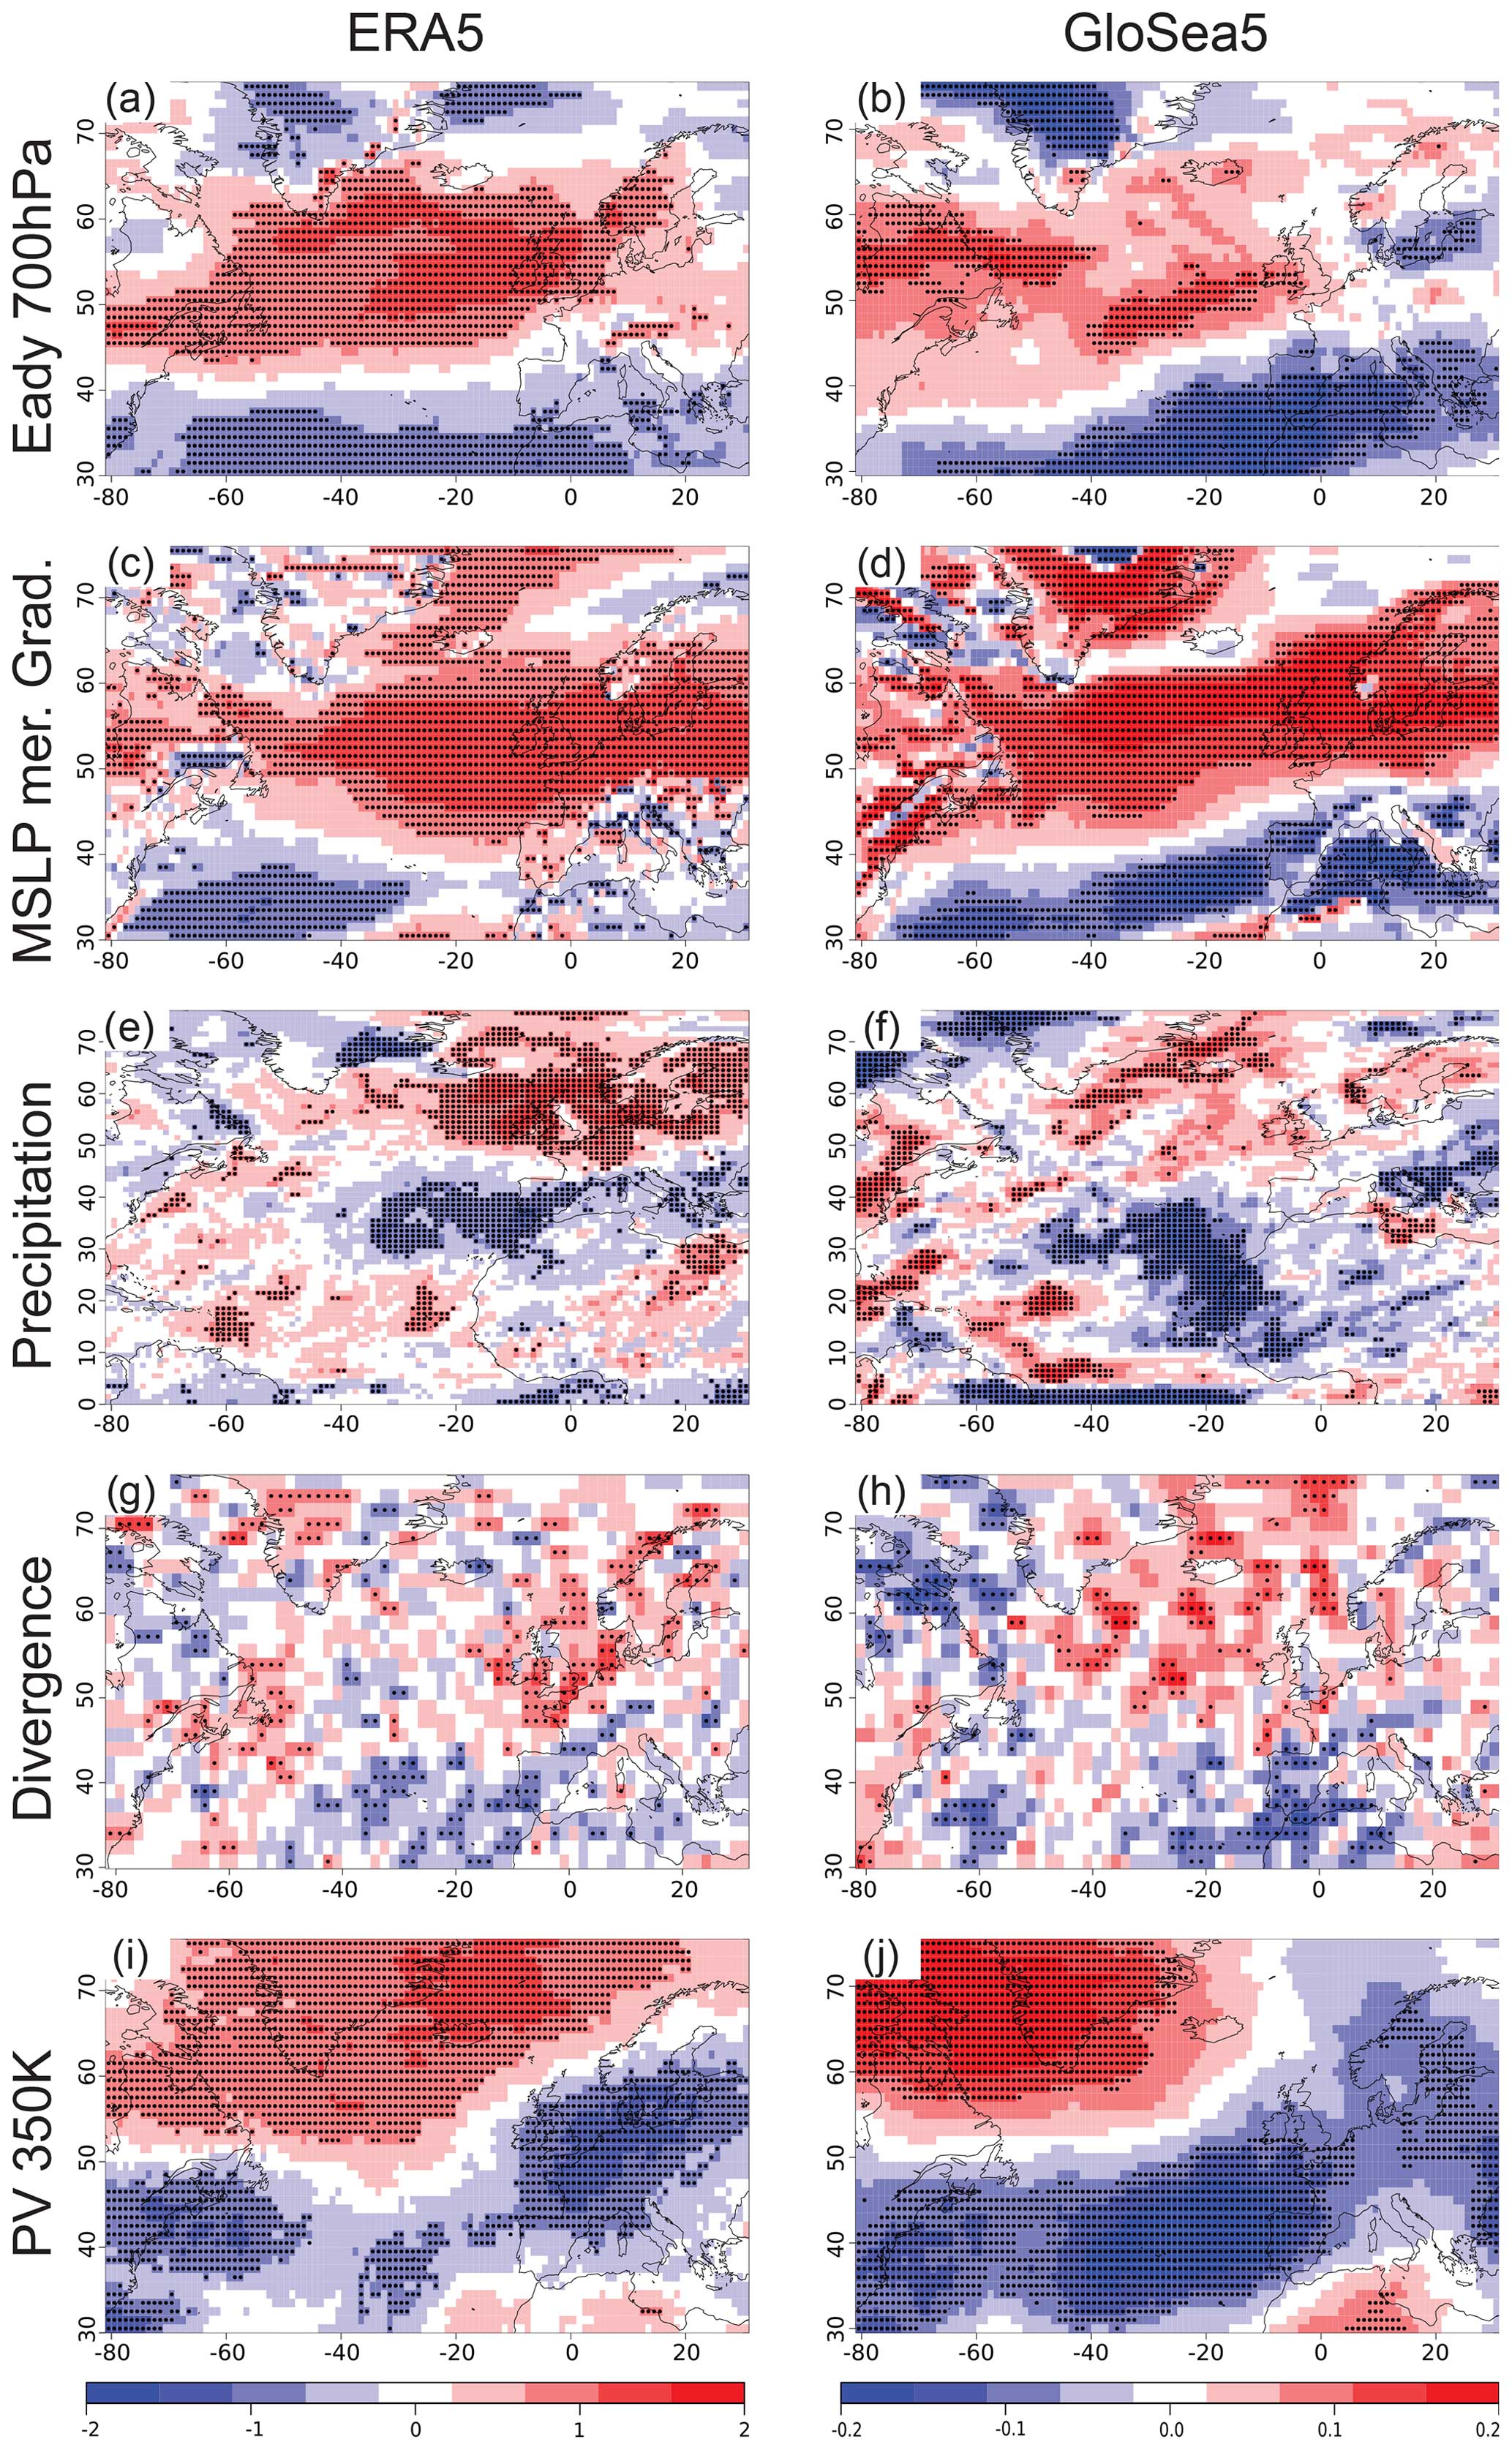
Figure A3As Fig. 1 but for the remaining factors.
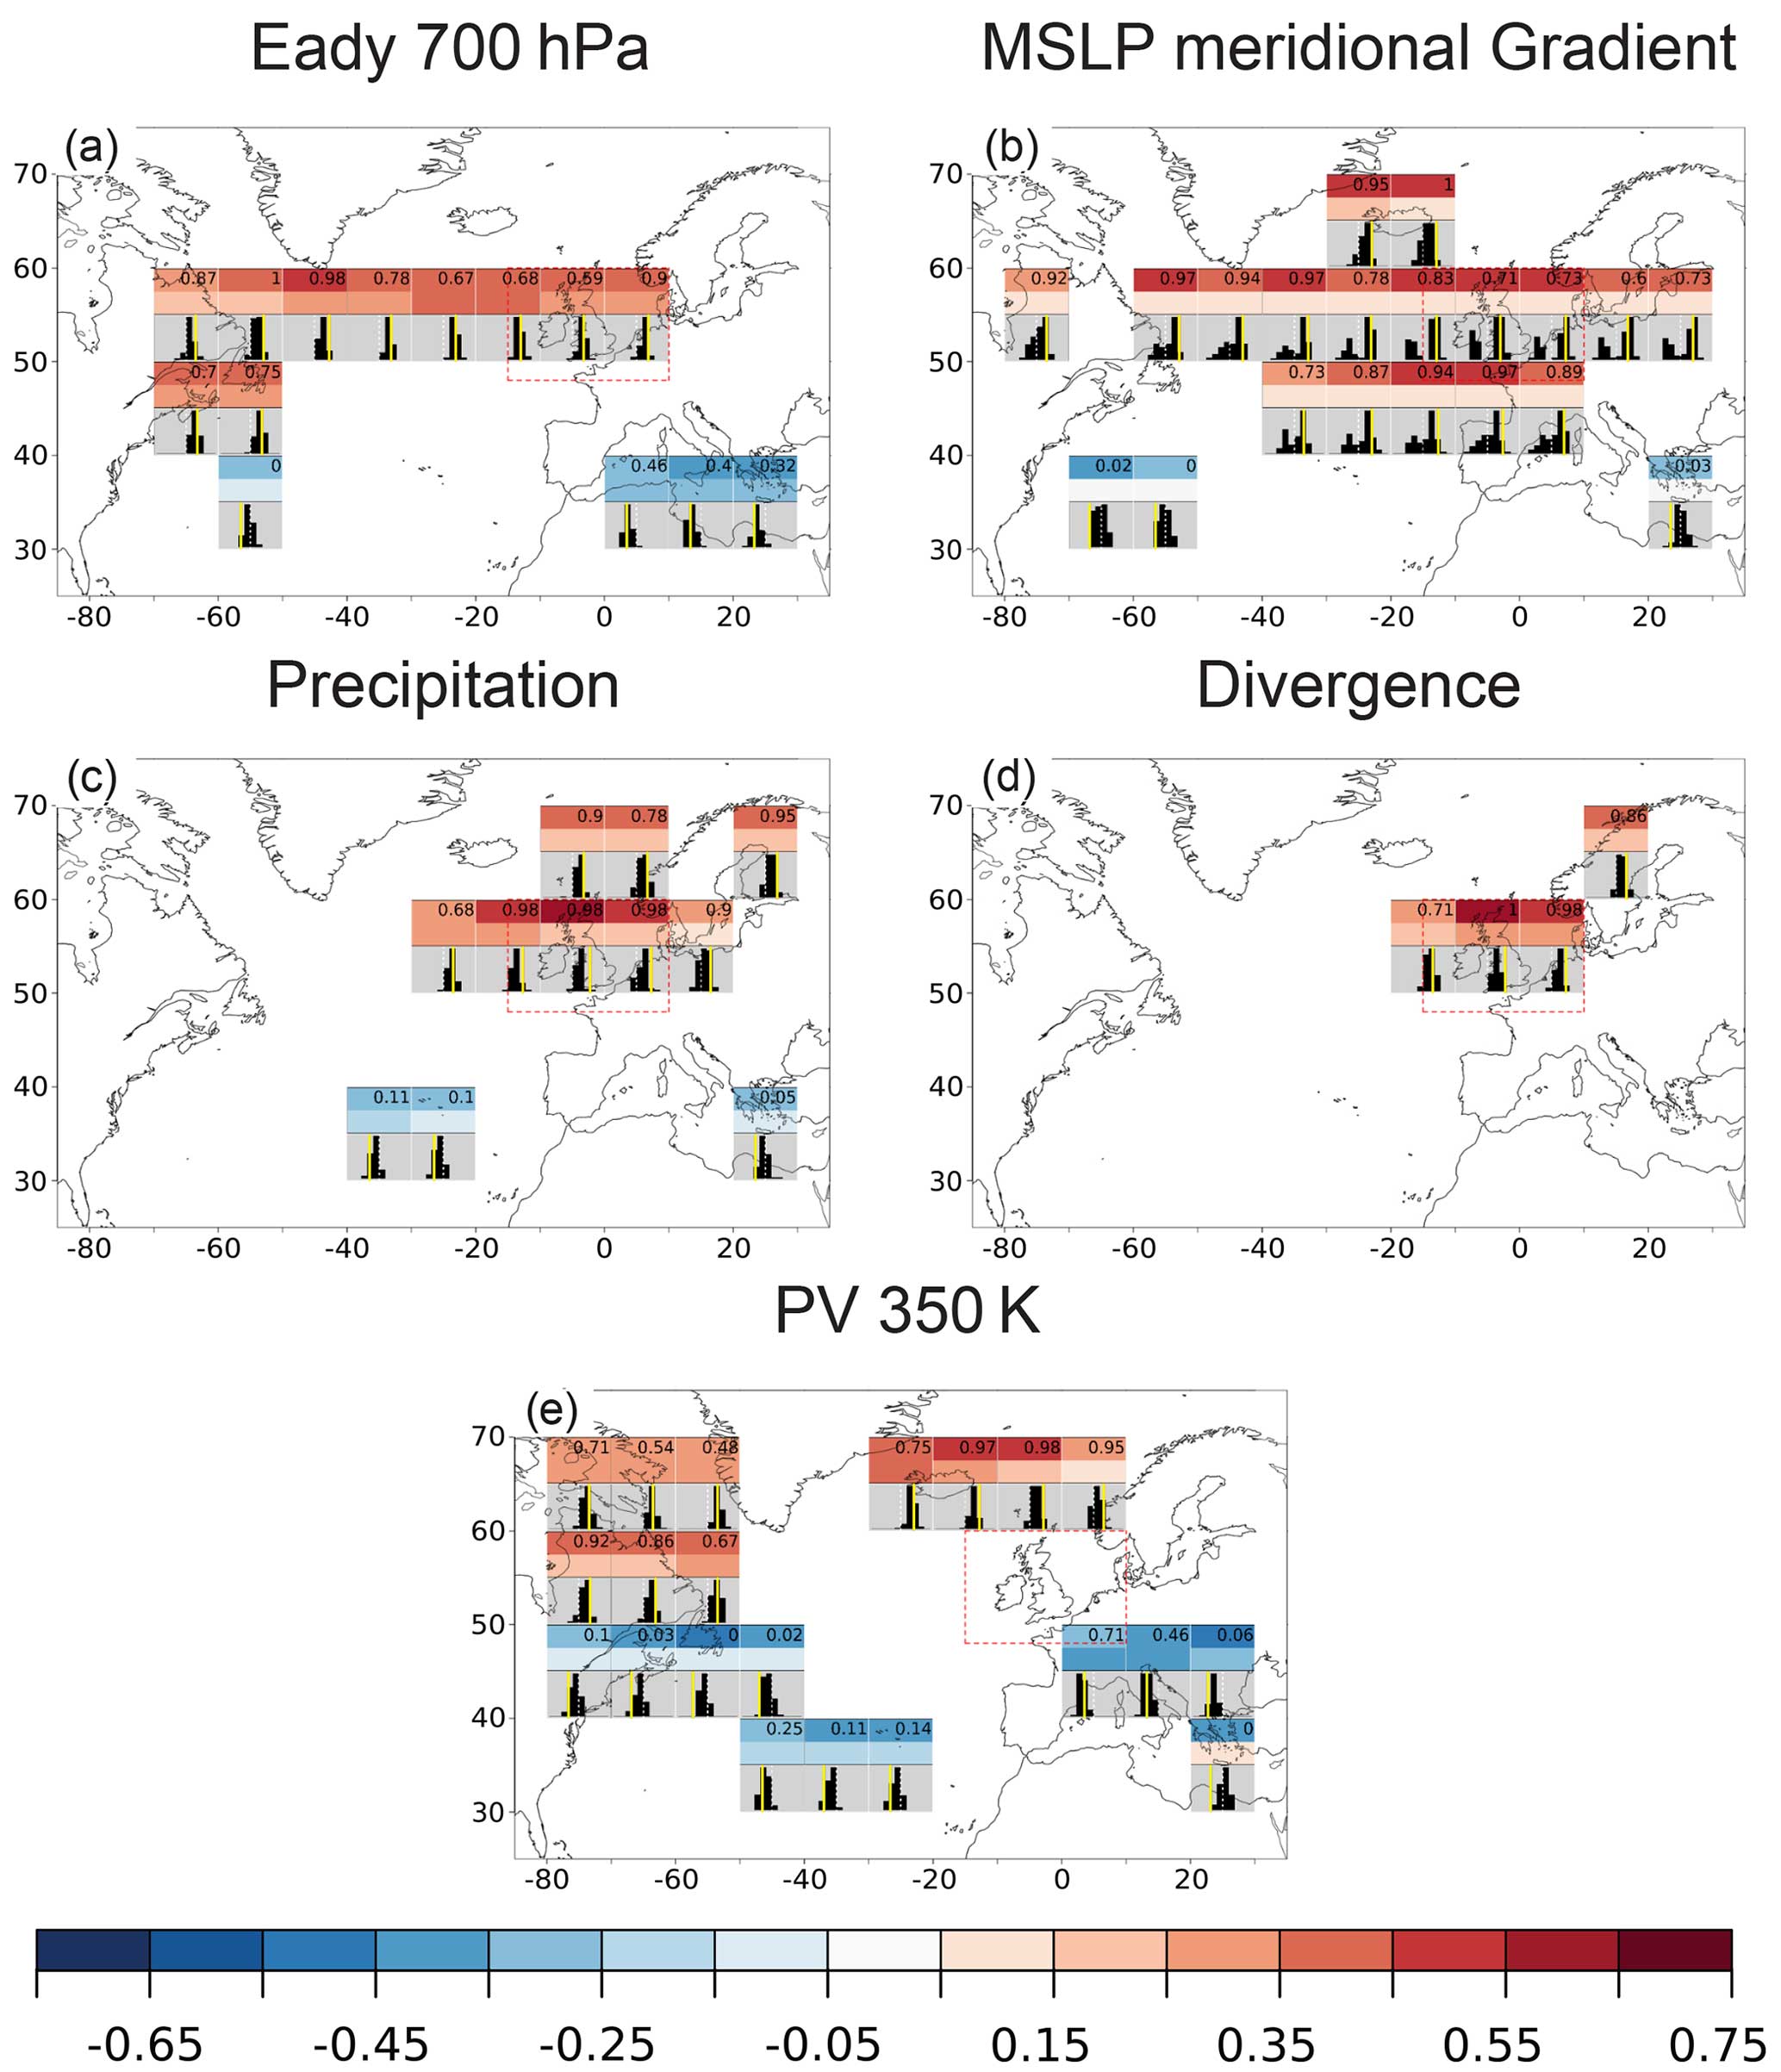
Figure A4As Fig. 2 but for the remaining factors.
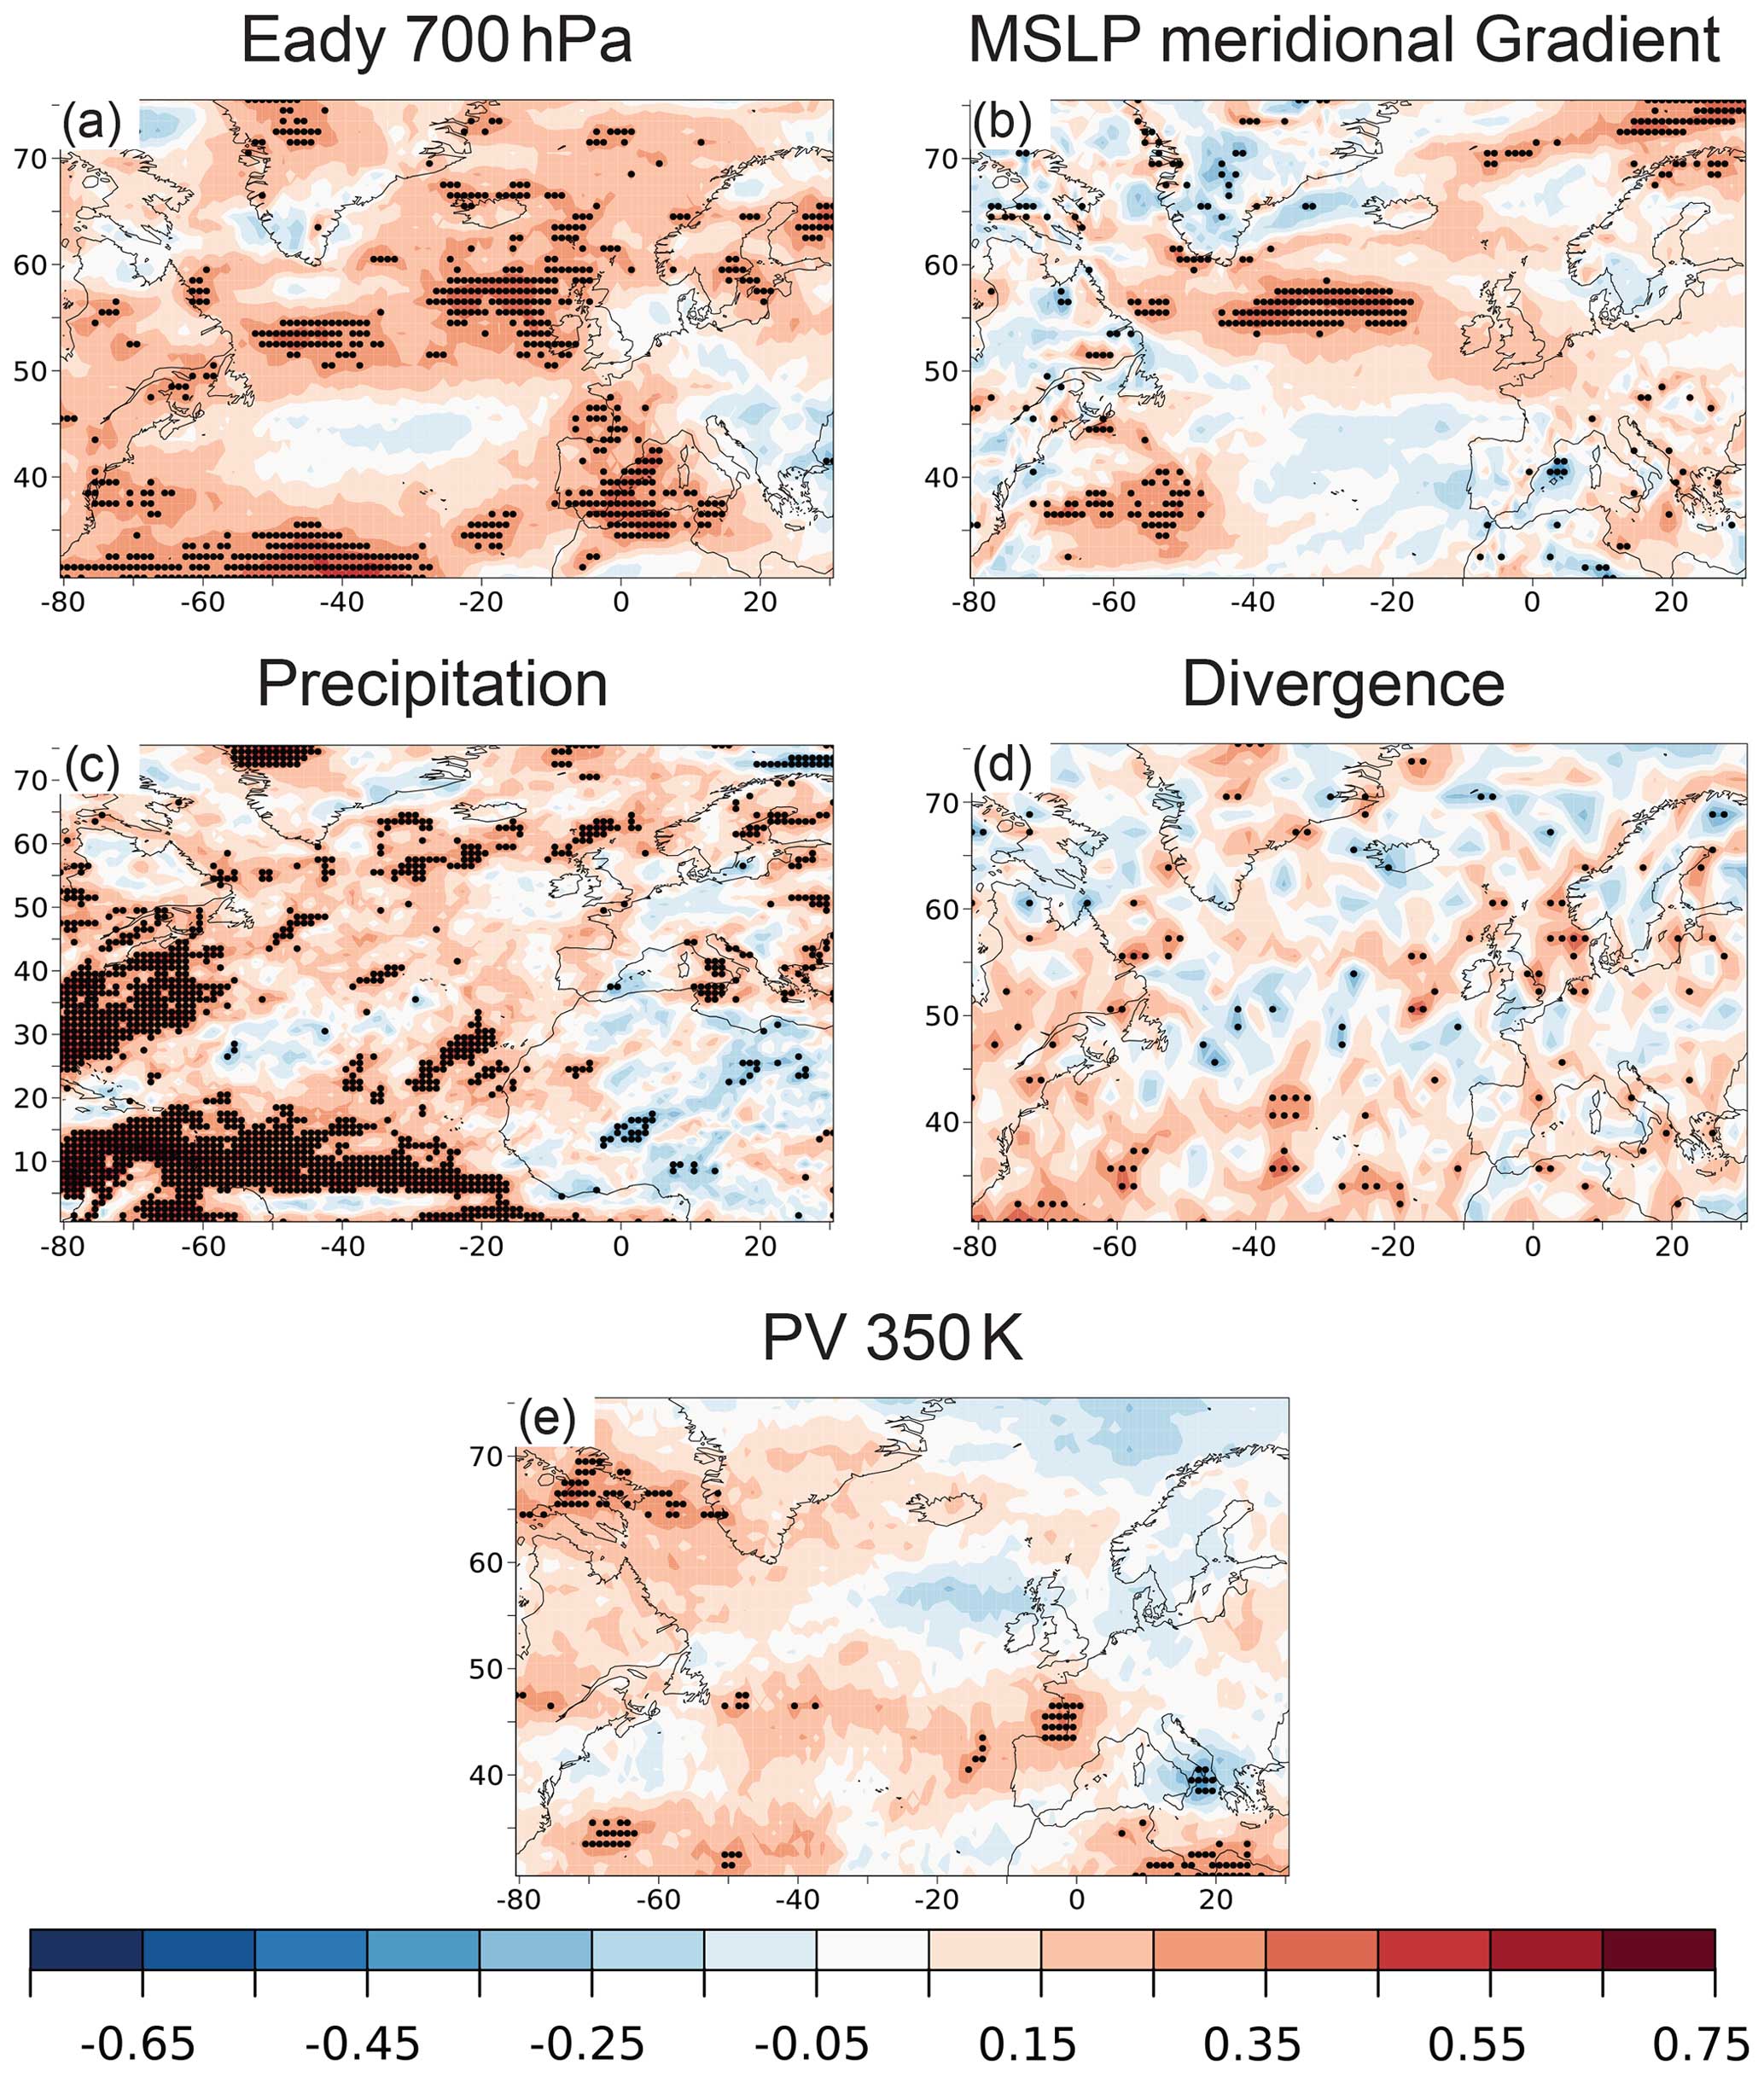
Figure A5As Fig. 3 but for the remaining factors.
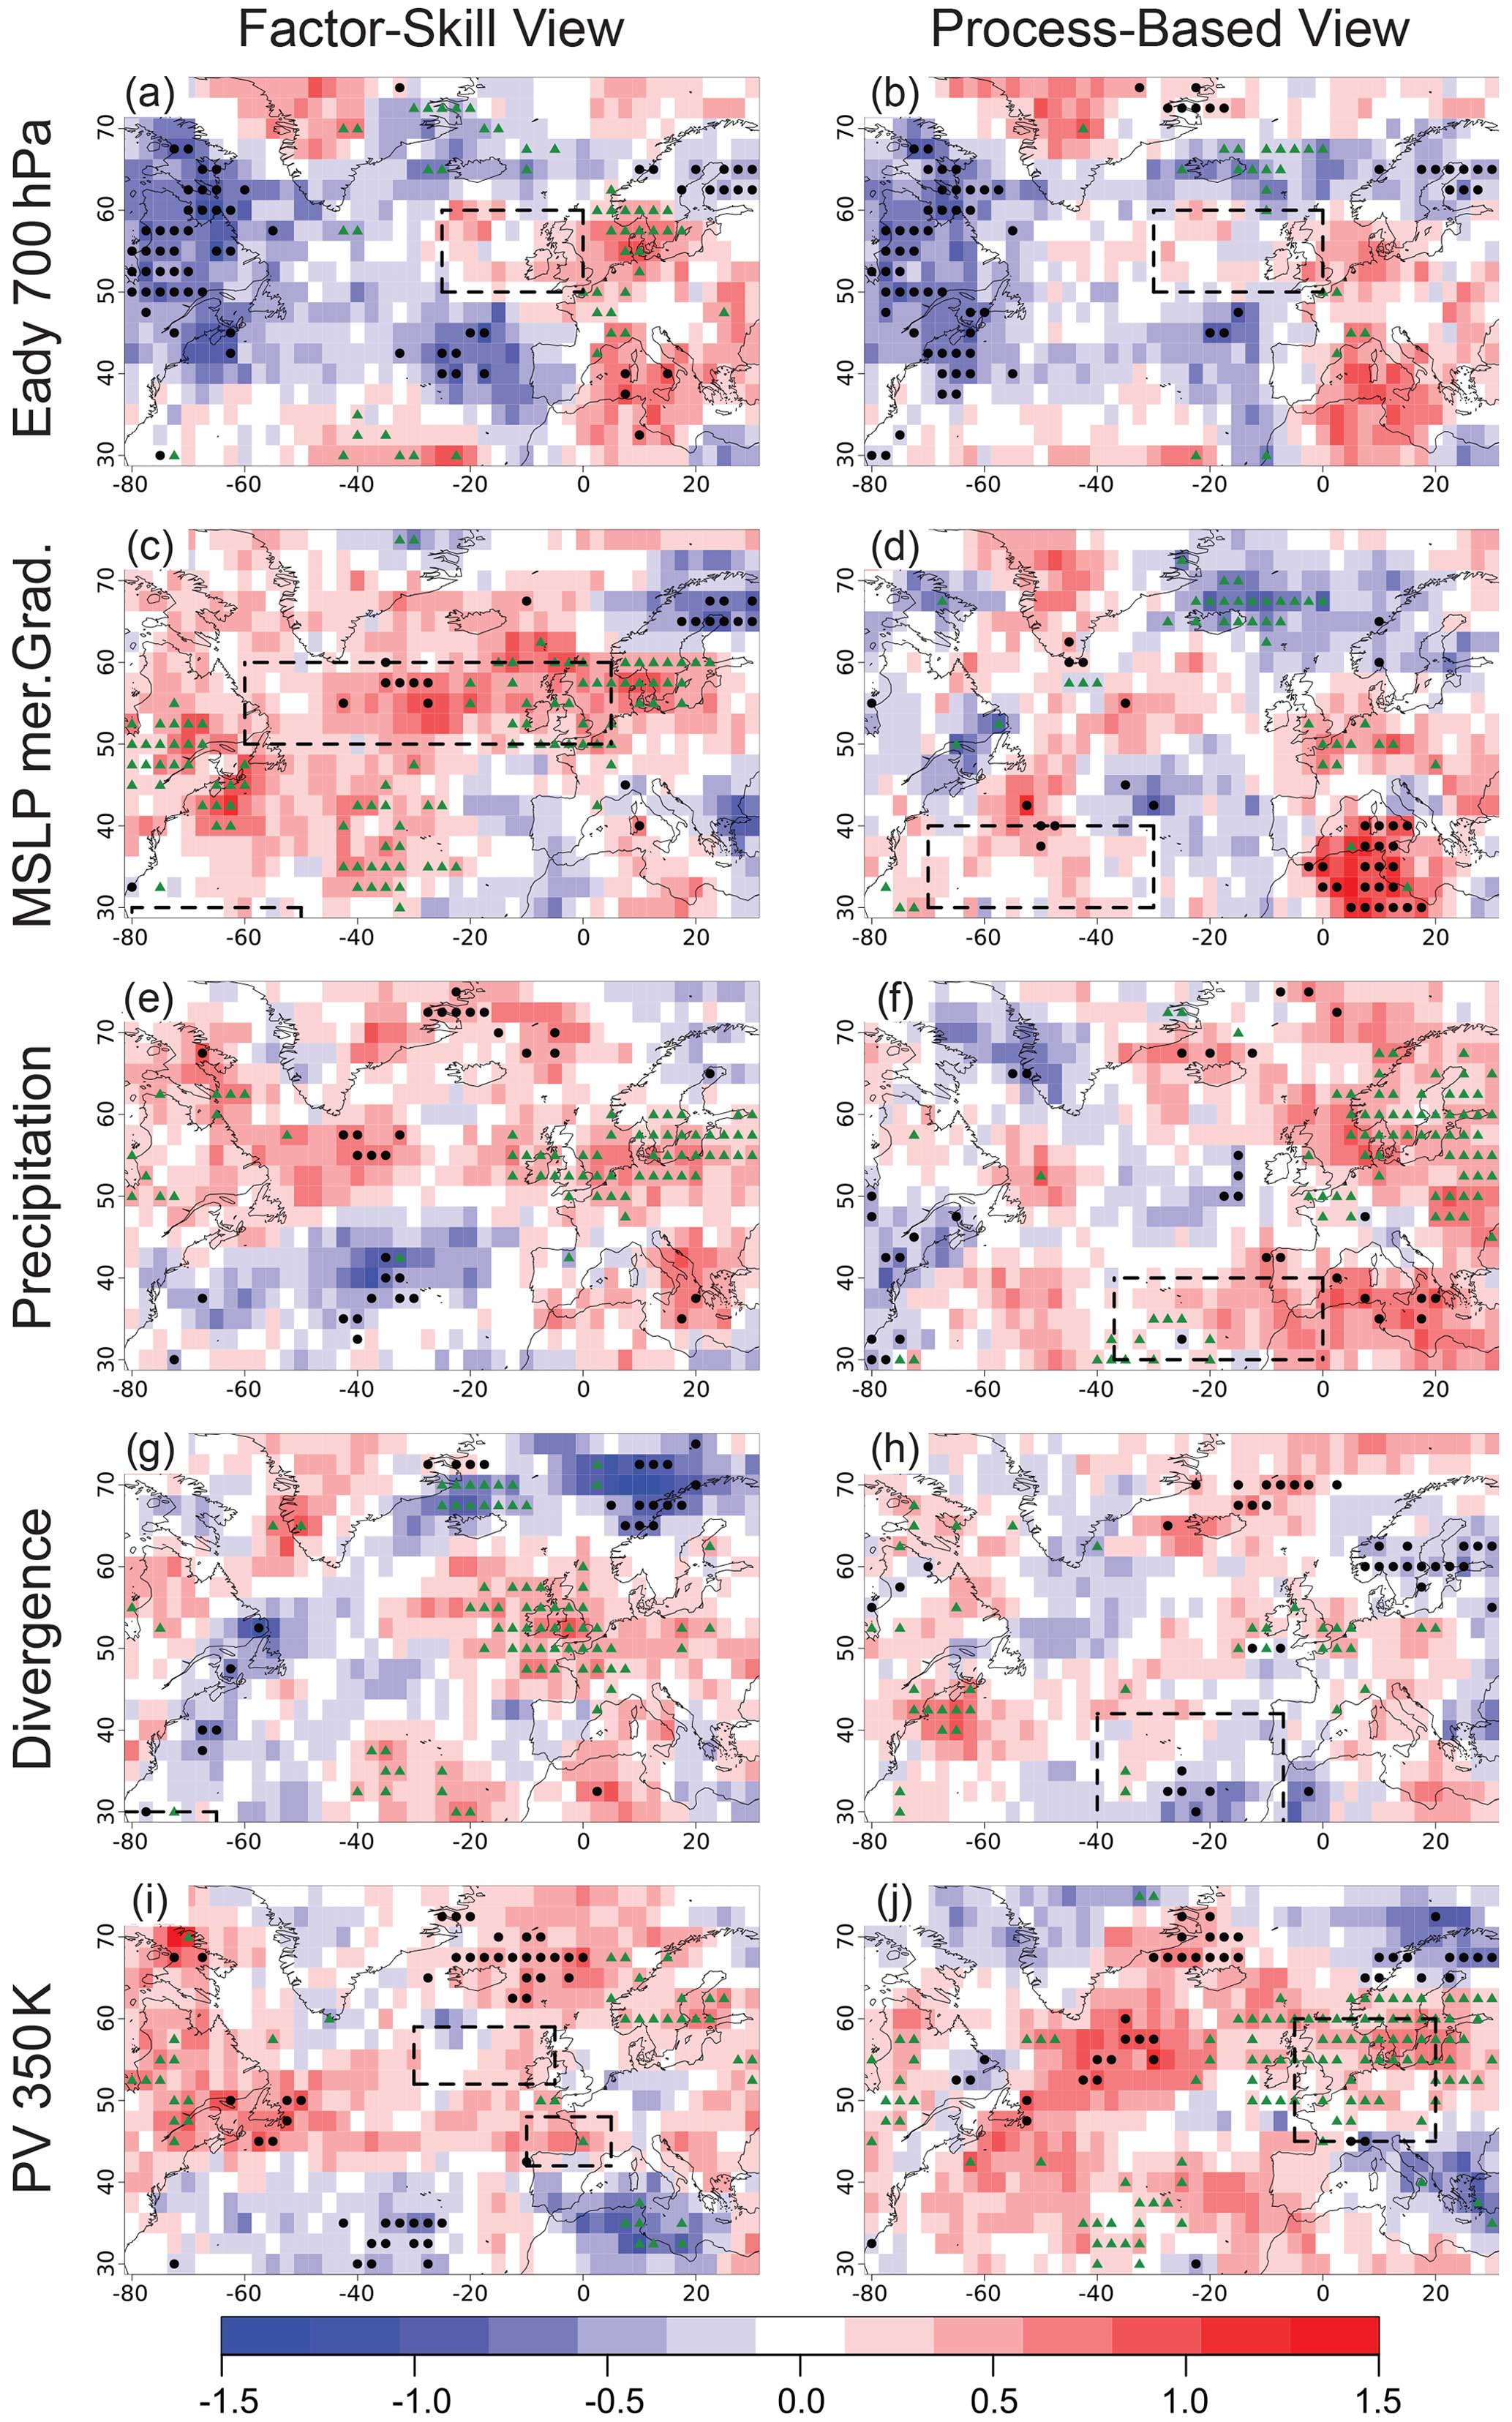
Figure A6As Fig. 4 but for remaining factors.
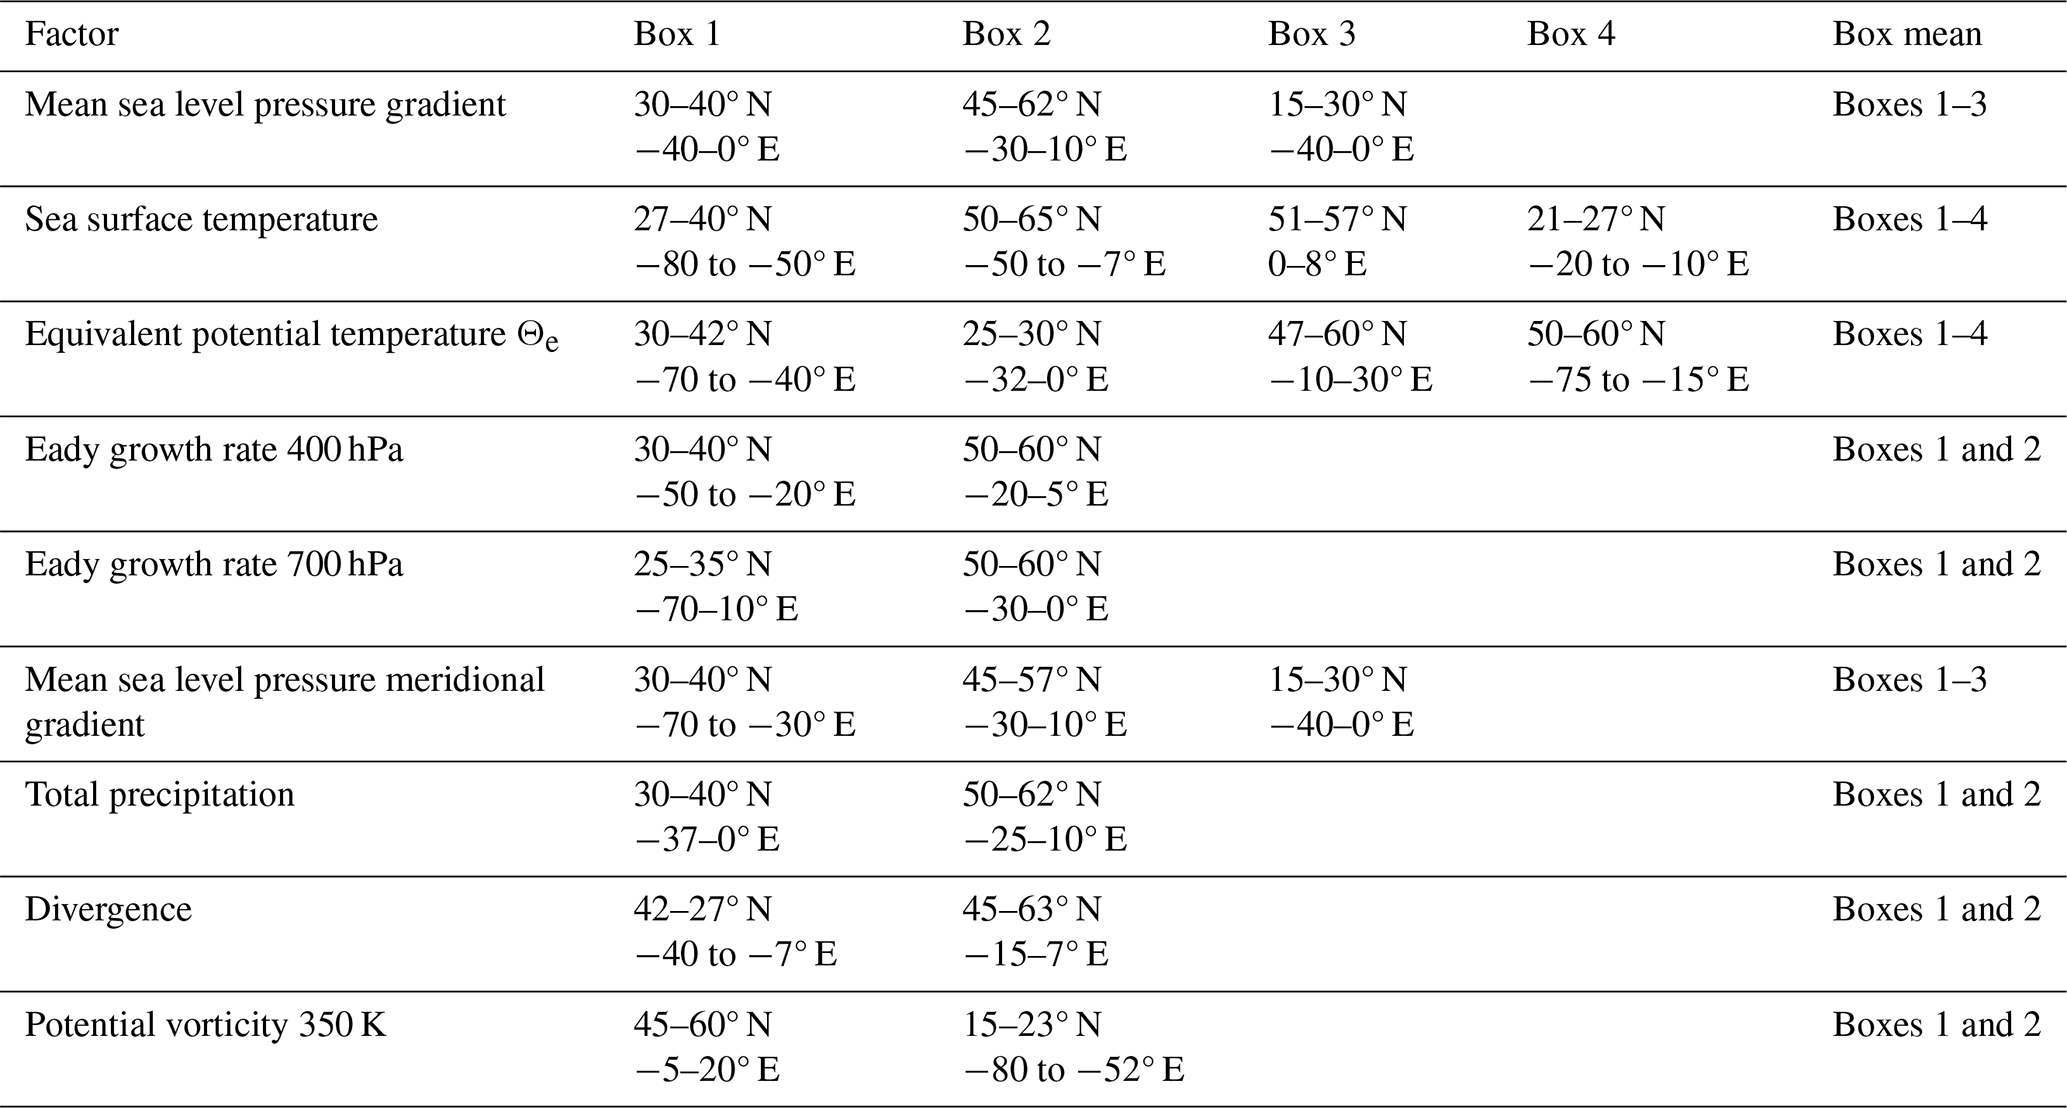
Table A2Skilful regions of the factor forecast skill used for the factor-skill view in Fig. 4.
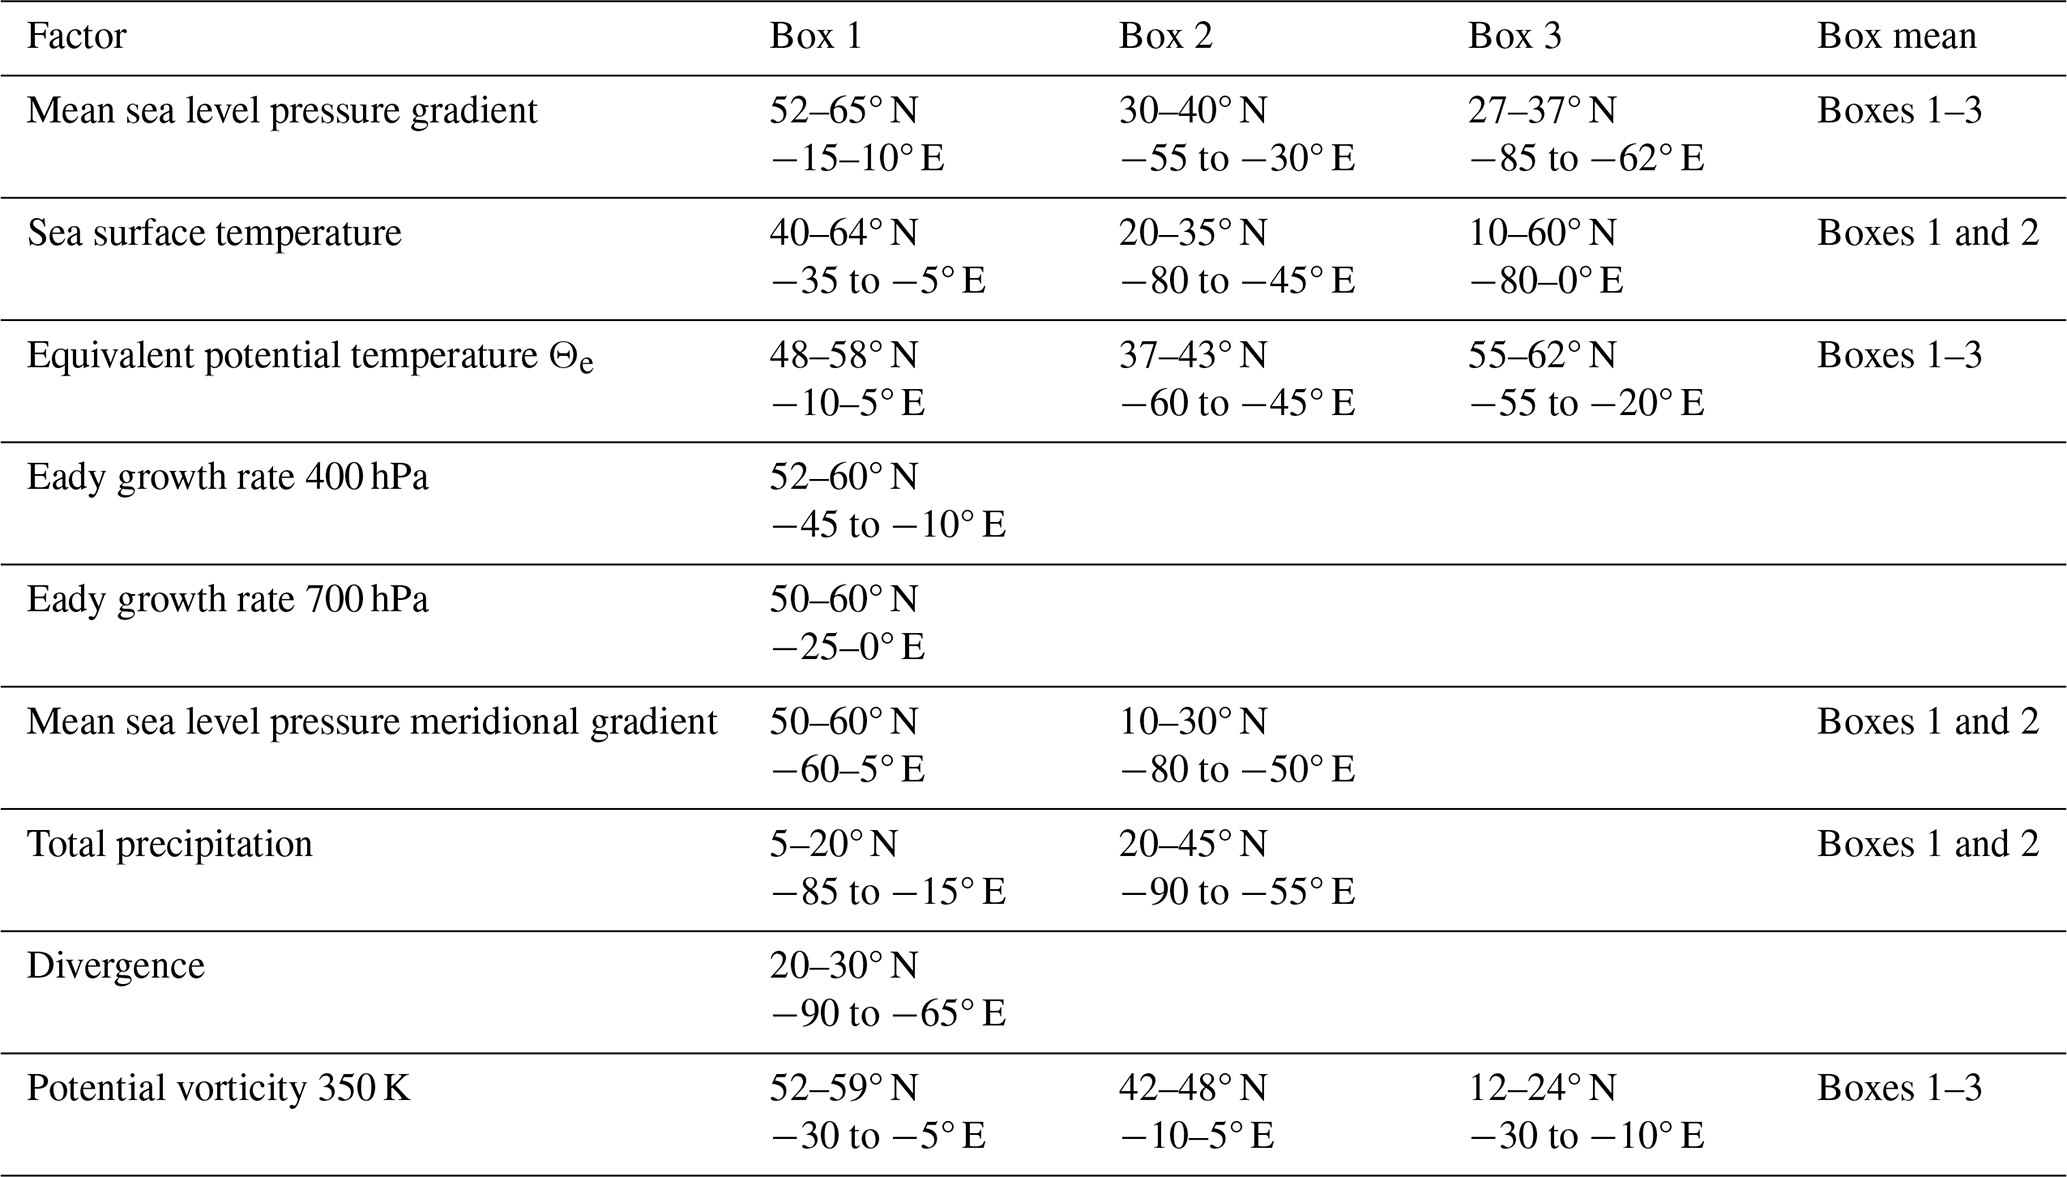
Table A3Relevant regions of ERA5 and GloSea5 for the process-based view in Fig. 4.
The data are freely available in the Copernicus Climate Change Service collection (https://cds.climate.copernicus.eu/cdsapp#!/home, CDS, 2024a) including the GloSea5 (https://doi.org/10.24381/cds.50ed0a73, Copernicus Climate Change Service, 2018a and https://doi.org/10.24381/cds.181d637e, Copernicus Climate Change Service, 2018b) forecast model and the ERA5 (https://doi.org/10.24381/cds.143582cf, Hersbach et al., 2017) reanalysis data.
The idea and concept of the study are from all authors. LD wrote the paper and did the calculations with the support of GCL and AAS.
The contact author has declared that none of the authors has any competing interests.
Publisher's note: Copernicus Publications remains neutral with regard to jurisdictional claims made in the text, published maps, institutional affiliations, or any other geographical representation in this paper. While Copernicus Publications makes every effort to include appropriate place names, the final responsibility lies with the authors.
Lisa Degenhardt has been supported by the UK's Natural Environment Research Council (NERC) DTP2 CENTA2 grant (NE/S007350/1). The authors thank the Copernicus Climate Change Service (https://cds.climate.copernicus.eu/cdsapp#!/home, last access: April 2024). This data collection includes the GloSea5 forecast model and the ERA5 reanalysis data and is available to use freely. This work was supported by the Met Office Hadley Centre Climate Programme (HCCP) funded by the UK Department for Science, Innovation and Technology (DSIT) and the UK Public Weather Service. The computations described in this paper were performed using the University of Birmingham's BlueBEAR HPC service, which provides a high-performance computing service to the university's research community (see http://www.birmingham.ac.uk/bear, last access: April 2024, for more details).
This research has been supported by the UK's Natural Environment Research Council (NERC) DTP2 CENTA2 grant (grant no. NE/S007350/1).
This paper was edited by Shira Raveh-Rubin and reviewed by Laura Baker and one anonymous referee.
Angus, M. and Leckebusch, G. C.: On the Dependency of Atlantic Hurricane and European Windstorm Hazards, Geophys. Res. Lett., 47, e2020GL090446, https://doi.org/10.1029/2020GL090446, 2020. a
Athanasiadis, P. J., Bellucci, A., Hermanson, L., Scaife, A. A., MacLachlan, C., Arribas, A., Materia, S., Borrelli, A., and Gualdi, S.: The Representation of Atmospheric Blocking and the Associated Low-Frequency Variability in Two Seasonal Prediction Systems, J. Climate, 27, 9082–9100, https://doi.org/10.1175/jcli-d-14-00291.1, 2014. a
Athanasiadis, P. J., Bellucci, A., Scaife, A. A., Hermanson, L., Materia, S., Sanna, A., Borrelli, A., MacLachlan, C., and Gualdi, S.: A Multisystem View of Wintertime NAO Seasonal Predictions, J. Climate, 30, 1461–1475, https://doi.org/10.1175/jcli-d-16-0153.1, 2017. a
Athanasiadis, P. J., Ogawa, F., Omrani, N.-E., Keenlyside, N., Schiemann, R., Baker, A. J., Vidale, P. L., Bellucci, A., Ruggieri, P., Haarsma, R., Roberts, M., Roberts, C., Novak, L., and Gualdi, S.: Mitigating Climate Biases in the Midlatitude North Atlantic by Increasing Model Resolution: SST Gradients and Their Relation to Blocking and the Jet, J. Climate, 35, 6985 – 7006, https://doi.org/10.1175/JCLI-D-21-0515.1, 2022. a
Befort, D. J., Wild, S., Knight, J. R., Lockwood, J. F., Thornton, H. E., Hermanson, L., Bett, P. E., Weisheimer, A., and Leckebusch, G. C.: Seasonal forecast skill for extratropical cyclones and windstorms, Q. J. Roy. Meteor. Soc., 145, 92–104, https://doi.org/10.1002/qj.3406, 2019. a, b, c, d
Beverley, J. D., Woolnough, S. J., Baker, L. H., Johnson, S. J., and Weisheimer, A.: The northern hemisphere circumglobal teleconnection in a seasonal forecast model and its relationship to European summer forecast skill, Clim. Dynam., 52, 3759–3771, 2019. a, b, c
Bolton, D.: The Computation of Equivalent Potential Temperature, Mon. Weather Rev., 108, 1046–1053, https://doi.org/10.1175/1520-0493(1980)108<1046:TCOEPT>2.0.CO;2, 1980. a
Büeler, D. and Pfahl, S.: Potential Vorticity Diagnostics to Quantify Effects of Latent Heating in Extratropical Cyclones. Part I: Methodology, J. Atmos. Sci., 74, 3567–3590, https://doi.org/10.1175/JAS-D-17-0041.1, 2017. a
Butterworth, S.: On the theory of filter amplifiers, Wireless Engineer, 7, 536–541, 1930. a
CDS: Welcome to the Climate Data Store, https://cds.climate.copernicus.eu/cdsapp#!/home (last access: April 2024), 2024. a
Chang, C., Pepkey, D., and Kreitzberg, C.: Latent heat induced energy transformations during cyclogenesis, Mon. Weather Rev., 112, 357–367, 1984. a, b
Copernicus Climate Change Service, Climate Data Store: Seasonal forecast subdaily data on pressure levels, Copernicus Climate Change Service (C3S) Climate Data Store (CDS) [data set], https://doi.org/10.24381/cds.50ed0a73, 2018a. a
Copernicus Climate Change Service, Climate Data Store: Seasonal forecast daily and subdaily data on single levels, Copernicus Climate Change Service (C3S) Climate Data Store (CDS) [data set], https://doi.org/10.24381/cds.181d637e, 2018b. a
Czaja, A. and Frankignoul, C.: Influence of the North Atlantic SST on the atmospheric circulation, Geophys. Res. Lett., 26, 2969–2972, https://doi.org/10.1029/1999GL900613, 1999. a
Dawson, A.: Windspharm: A high-level library for global wind field computations using spherical harmonics, J. Open Res. Softw., 4, e31, https://doi.org/10.5334/jors.129, 2016. a
Degenhardt, L., Leckebusch, G. C., and Scaife, A. A.: Large-scale circulation patterns and their influence on European winter windstorm predictions, Clim. Dynam., 60, 3597–3611, https://doi.org/10.1007/s00382-022-06455-2, 2022. a, b, c, d, e, f, g
Donat, M. G., Leckebusch, G. C., Wild, S., and Ulbrich, U.: Future changes in European winter storm losses and extreme wind speeds inferred from GCM and RCM multi-model simulations, Nat. Hazards Earth Syst. Sci., 11, 1351–1370, https://doi.org/10.5194/nhess-11-1351-2011, 2011a. a
Donat, M. G., Renggli, D., Wild, S., Alexander, L. V., Leckebusch, G. C., and Ulbrich, U.: Reanalysis suggests long-term upward trends in European storminess since 1871, Geophys. Res. Lett., 38, L14703, https://doi.org/10.1029/2011gl047995, 2011b. a
Dunstone, N., Smith, D., Scaife, A., Hermanson, L., Fereday, D., O'Reilly, C., Stirling, A., Eade, R., Gordon, M., and MacLachlan, C.: Skilful seasonal predictions of summer European rainfall, Geophys. Res. Lett., 45, 3246–3254, 2018. a, b, c
Eady, E. T.: Long waves and cyclone waves, Tellus, 1, 33–52, 1949. a, b
Fink, A. H., Brücher, T., Ermert, V., Krüger, A., and Pinto, J. G.: The European storm Kyrill in January 2007: synoptic evolution, meteorological impacts and some considerations with respect to climate change, Nat. Hazards Earth Syst. Sci., 9, 405–423, https://doi.org/10.5194/nhess-9-405-2009, 2009. a, b
Hersbach, H., Bell, B., Berrisford, P., Hirahara, S., Horányi, A., Muñoz-Sabater, J., Nicolas, J., Peubey, C., Radu, R., Schepers, D., Simmons, A., Soci, C., Abdalla, S., Abellan, X., Balsamo, G., Bechtold, P., Biavati, G., Bidlot, J., Bonavita, M., De Chiara, G., Dahlgren, P., Dee, D., Diamantakis, M., Dragani, R., Flemming, J., Forbes, R., Fuentes, M., Geer, A., Haimberger, L., Healy, S., Hogan, R. J., Hólm, E., Janisková, M., Keeley, S., Laloyaux, P., Lopez, P., Lupu, C., Radnoti, G., de Rosnay, P., Rozum, I., Vamborg, F., Villaume, S., and Thépaut, J.-N.: Complete ERA5 from 1940: Fifth generation of ECMWF atmospheric reanalyses of the global climate, Copernicus Climate Change Service (C3S) Data Store (CDS) [data set], https://doi.org/10.24381/cds.143582cf, 2017. a
Hersbach, H., Bell, B., Berrisford, P., Horányi, A., Muñoz Sabater, J., Nicolas, J., Radu, R., Schepers, D., Simmons, A., Soci, C., and Dee, D.: Global reanalysis: goodbye ERA-Interim, hello ERA5, ECMWF Newsletter, 159, 17–24, https://doi.org/10.21957/vf291hehd7, 2019. a, b
Hoskins, B.: Potential vorticity and the PV perspective, Adv. Atmos. Sci., 32, 2–9, 2015. a, b
Hoskins, B. J. and Hodges, K. I.: New perspectives on the Northern Hemisphere winter storm tracks, J. Atmos. Sci., 59, 1041–1061, 2002. a
Hoskins, B. J. and Valdes, P. J.: On the existence of storm-tracks, J. Atmos. Sci., 47, 1854–1864, 1990. a
Hoskins, B. J., James, I. N., and White, G. H.: The Shape, Propagation and Mean-Flow Interaction of Large-Scale Weather Systems, J. Atmos. Sci., 40, 1595–1612, https://doi.org/10.1175/1520-0469(1983)040<1595:TSPAMF>2.0.CO;2, 1983. a
Hoskins, B. J., McIntyre, M. E., and Robertson, A. W.: On the use and significance of isentropic potential vorticity maps, Q. J. Roy. Meteor. Soc., 111, 877–946, 1985. a, b, c, d, e
Kendall, M. G.: The Treatment of Ties in Ranking Problems, Biometrika, 33, 239–251, https://doi.org/10.2307/2332303, 1945. a
Klawa, M. and Ulbrich, U.: A model for the estimation of storm losses and the identification of severe winter storms in Germany, Nat. Hazards Earth Syst. Sci., 3, 725–732, https://doi.org/10.5194/nhess-3-725-2003, 2003. a
Kruschke, T.: Winter wind storms: identifcation, verification of decadal predictions, and regionalization, Thesis, Freie Universität Berlin, Berlin, https://doi.org/10.17169/refubium-16111, 2015. a
Kurz, M.: Synoptische Meteorologie; Mit 189 häufig mehrteiligen Abb. im Text, Selbstverl. des Dt. Wetterdienstes, 1990. a
Leckebusch, G. C., Renggli, D., and Ulbrich, U.: Development and application of an objective storm severity measure for the Northeast Atlantic region, Meteorol. Z., 17, 575–587, https://doi.org/10.1127/0941-2948/2008/0323, 2008. a, b, c, d
Lockwood, J. F., Stringer, N., Hodge, K. R., Bett, P. E., Knight, J., Smith, D., Scaife, A. A., Patterson, M., Dunstone, N., and Thornton, H. E.: Seasonal prediction of UK mean and extreme winds, Q. J. Roy. Meteor. Soc., https://doi.org/10.1002/qj.4568, 2023. a
MacLachlan, C., Arribas, A., Peterson, K. A., Maidens, A., Fereday, D., Scaife, A. A., Gordon, M., Vellinga, M., Williams, A., Comer, R. E., Camp, J., Xavier, P., and Madec, G.: Global Seasonal forecast system version 5 (GloSea5): a high-resolution seasonal forecast system, Q. J. Roy. Meteor. Soc., 141, 1072–1084, https://doi.org/10.1002/qj.2396, 2015. a, b
Munich RE: Topics Geo: Natural Catastrophes 2013: Analyses, assessments, positions, https://www.munichre.com/content/dam/munichre/contentlounge/website-pieces/documents/delete-natcat/302-08121_en.pdf/_jcr_content/renditions/original./302-08121_en.pdf (last access: April 2024), 2014. a
Ng, K. S. and Leckebusch, G. C.: A new view on the risk of typhoon occurrence in the western North Pacific, Nat. Hazards Earth Syst. Sci., 21, 663–682, https://doi.org/10.5194/nhess-21-663-2021, 2021. a
Nie, Y., Scaife, A. A., Ren, H.-L., Comer, R. E., Andrews, M. B., Davis, P., and Martin, N.: Stratospheric initial conditions provide seasonal predictability of the North Atlantic and Arctic Oscillations, Environ. Res. Lett., 14, 034006, https://doi.org/10.1088/1748-9326/ab0385, 2019. a
Nissen, K. M., Leckebusch, G. C., Pinto, J. G., and Ulbrich, U.: Mediterranean cyclones and windstorms in a changing climate, Reg. Environ. Change, 14, 1873–1890, https://doi.org/10.1007/s10113-012-0400-8, 2013. a
Palmer, T. N., Alessandri, A., Andersen, U., Cantelaube, P., Davey, M., Delécluse, P., Déqué, M., Diez, E., Doblas-Reyes, F. J., and Feddersen, H.: Development of a European multimodel ensemble system for seasonal-to-interannual prediction (DEMETER), B. Am. Meteorol. Soc., 85, 853–872, 2004. a
Parker, T., Woollings, T., Weisheimer, A., O'Reilly, C., Baker, L., and Shaffrey, L.: Seasonal predictability of the winter North Atlantic Oscillation from a jet stream perspective, Geophys. Res. Lett., 46, 10159–10167, 2019. a, b, c, d
Pinto, J. G., Zacharias, S., Fink, A. H., Leckebusch, G. C., and Ulbrich, U.: Factors contributing to the development of extreme North Atlantic cyclones and their relationship with the NAO, Clim. Dynam., 32, 711–737, https://doi.org/10.1007/s00382-008-0396-4, 2008. a, b, c, d, e
Priestley, M. D., Ackerley, D., Catto, J. L., and Hodges, K. I.: Drivers of biases in the CMIP6 extratropical storm tracks. Part I: Northern Hemisphere, J. Climate, 36, 1451–1467, 2023. a, b
Raymond, D.: Nonlinear balance and PV thinking at large Rossby number, Q. J. Roy. Meteor. Soc, 118, 1041–1081, 1992. a
Renggli, D., Leckebusch, G. C., Ulbrich, U., Gleixner, S. N., and Faust, E.: The Skill of Seasonal Ensemble Prediction Systems to Forecast Wintertime Windstorm Frequency over the North Atlantic and Europe, Mon. Weather Rev., 139, 3052–3068, https://doi.org/10.1175/2011mwr3518.1, 2011. a, b
Scaife, A. A., Copsey, D., Gordon, C., Harris, C., Hinton, T., Keeley, S., O'Neill, A., Roberts, M., and Williams, K.: Improved Atlantic winter blocking in a climate model, Geophys. Res. Lett., 38, L23703, https://doi.org/10.1029/2011GL049573, 2011. a
Scaife, A. A., Arribas, A., Blockley, E., Brookshaw, A., Clark, R. T., Dunstone, N., Eade, R., Fereday, D., Folland, C. K., Gordon, M., Hermanson, L., Knight, J. R., Lea, D. J., MacLachlan, C., Maidens, A., Martin, M., Peterson, A. K., Smith, D., Vellinga, M., Wallace, E., Waters, J., and Williams, A.: Skillful long-range prediction of European and North American winters, Geophys. Res. Lett., 41, 2514–2519, https://doi.org/10.1002/2014gl059637, 2014. a, b
Scaife, A. A., Comer, R., Dunstone, N., Fereday, D., Folland, C., Good, E., Gordon, M., Hermanson, L., Ineson, S., Karpechko, A., Knight, J., MacLachlan, C., Maidens, A., Peterson, K. A., Smith, D., Slingo, J., and Walker, B.: Predictability of European winter 2015/2016, Atmos. Sci. Lett., 18, 38–44, https://doi.org/10.1002/asl.721, 2017a. a
Scaife, A. A., Comer, R. E., Dunstone, N. J., Knight, J. R., Smith, D. M., MacLachlan, C., Martin, N., Peterson, K. A., Rowlands, D., Carroll, E. B., Belcher, S., and Slingo, J.: Tropical rainfall, Rossby waves and regional winter climate predictions, Q. J. Roy. Meteor. Soc., 143, 1–11, https://doi.org/10.1002/qj.2910, 2017b. a, b, c, d, e, f, g, h
Scaife, A. A., Camp, J., Comer, R., Davis, P., Dunstone, N., Gordon, M., MacLachlan, C., Martin, N., Nie, Y., Ren, H., Roberts, M., Robinson, W., Smith, D., and Vidale, P. L.: Does increased atmospheric resolution improve seasonal climate predictions?, Atmos. Sci. Lett., 20, e922, https://doi.org/10.1002/asl.922, 2019. a
Schulzweida, U.: CDO User Guide (Version 1.9.6), Max Planck Institute for Meteorology, Hamburg, Germany, 2019. a, b
Schuster, M., Grieger, J., Richling, A., Schartner, T., Illing, S., Kadow, C., Müller, W. A., Pohlmann, H., Pfahl, S., and Ulbrich, U.: Improvement in the decadal prediction skill of the North Atlantic extratropical winter circulation through increased model resolution, Earth Syst. Dynam., 10, 901–917, https://doi.org/10.5194/esd-10-901-2019, 2019. a
Shaw, T. A., Baldwin, M., Barnes, E. A., Caballero, R., Garfinkel, C. I., Hwang, Y. T., Li, C., O'Gorman, P. A., Rivière, G., Simpson, I. R., and Voigt, A.: Storm track processes and the opposing influences of climate change, Nat. Geosci., 9, 656–664, https://doi.org/10.1038/ngeo2783, 2016. a, b
Ulbrich, U., Fink, A., Klawa, M., and Pinto, J. G.: Three extreme storms over Europe in December 1999, Weather, 56, 70–80, 2001. a
Walz, M. A., Befort, D. J., Kirchner-Bossi, N. O., Ulbrich, U., and Leckebusch, G. C.: Modelling serial clustering and inter-annual variability of European winter windstorms based on large-scale drivers, Int. J. Climatol., 38, 3044–3057, https://doi.org/10.1002/joc.5481, 2018. a, b
Weisheimer, A., Doblas-Reyes, F., Palmer, T., Alessandri, A., Arribas, A., Déqué, M., Keenlyside, N., MacVean, M., Navarra, A., and Rogel, P.: ENSEMBLES: A new multi-model ensemble for seasonal-to-annual predictions–Skill and progress beyond DEMETER in forecasting tropical Pacific SSTs, Geophys. Res. Lett., 36, 2009. a
Wild, S., Befort, D. J., and Leckebusch, G. C.: Was the extreme storm season in winter 2013/14 over the North Atlantic and the United Kingdom triggered by changes in the West Pacific warm pool?, B. Am. Meteorol. Soc., 96, S29–S34, 2015. a, b, c, d, e