the Creative Commons Attribution 4.0 License.
the Creative Commons Attribution 4.0 License.
 | 18 Dec 2025
Physical drivers of the November 2023 heatwave in Rio de Janeiro
Catherine C. Ivanovich
Adam H. Sobel
Radley M. Horton
Ana M. B. Nunes
Rosmeri Porfírio da Rocha
Suzana J. Camargo
Because extreme heat has not historically been a major hazard for the city of Rio de Janeiro, the November 2023 Heatwave magnitude and timing were staggering. Here we conduct a case study of reanalysis data and high-resolution projections to explore the event drivers and characterize the evolving extreme heat risk in the city of Rio de Janeiro. We find that the heatwave was associated with atmospheric blocking, potentially linked to the 2023–24 El Niño event. Soil moisture declines increased surface sensible heat flux, and elevated sea surface temperatures reduced coastal cooling. The heatwave was preceded by weeks of suppressed precipitation and terminated by the onset of rain. We also find a significant historical increase in the frequency of high heat days throughout Brazil and a lengthening of the heat season in the city of Rio de Janeiro. The frequency of the city's austral spring heat extremes is expected to increase further in the future, highly dependent upon our future emissions pathway. These results emphasize the rapidly emerging risk for extreme heat in the city of Rio de Janeiro.
- Article
(11355 KB) - Full-text XML
-
Supplement
(4386 KB) - BibTeX
- EndNote


In the spring of 2023, the city of Rio de Janeiro experienced a high impact heatwave that caught the world's attention. Media sources ranging from local reporting to international news companies centered stories on the event's record-breaking temperature magnitudes and unseasonal timing, arriving earlier in the warm season than typical heatwaves (Correio Braziliense, 2023; Hughs and Jeantet, 2023). The impacts of the extreme heat were widely publicized in part due to the tragic death of a concertgoer hospitalized during a Taylor Swift performance in Rio de Janeiro on 17 November, with news articles reporting heat-induced cardiovascular distress as the cause of death (Nguyen, 2023). Sources also report that the stadium in which the concert took place experienced higher temperatures than those measured in the open air, as well as a lack of cooling equipment and insufficient water for attendees (Nguyen, 2023; Jornal Nacional, 2023). Such complexities highlight that extreme heat experienced by individuals on the ground can far exceed temperatures measured at local weather stations, depending on infrastructure and the capacity for cooling interventions (Wilby et al., 2021; Nahlik et al., 2017). However, the meteorological event itself is of course one of the preconditions for societal impacts. We therefore explore the physical mechanisms behind the heatwave as one key step towards improving preparation for the impact of future extreme heat events.
Throughout Brazil, the highest temperatures occur climatologically in low latitude and low altitude regions in the interior of the country, such as the cities of Teresina (Piauí, in the Northeast region of Brazil) and Palmas (Tocantins, in the Central-West region of Brazil; Alvares et al., 2013), both of which are far from Rio de Janeiro. Extreme temperatures tend to be intensified by land-atmosphere interactions, as dry soils partition more energy into sensible heat (Geirinhas et al., 2018). These relationships between the atmosphere and land surface processes increase the likelihood of compound extreme heat and drought events and intensify impacts on agriculture (Cirino et al., 2015), worker productivity for outdoor laborers (Bitencourt et al., 2021), wildfire risk (Libonati et al., 2022), and direct impacts on human health (Zhao et al., 2019). As the frequency and intensity of extreme heat throughout Brazil has increased significantly in the past decades and is projected to continue in the future (Feron et al., 2019; Regoto et al., 2021; Bitencourt et al., 2020), the widespread socio-economic impacts of these events are likely to grow.
While Rio de Janeiro is the second most populous city in Brazil (Sistema IBGE de Recuperação Automática, 2022) and the third most populous city in South America (United Nations Department of Economic and Social Affairs Population Division, 2022), few studies have focused on extreme heat in the city. On one hand, Rio de Janeiro has not historically been a major hotspot of extreme heat in Brazil and has experienced fewer heatwaves relative to other major cities in the country (Geirinhas et al., 2018). Further, the numerous microclimates within the city, influenced by its coastal setting and complex topography, complicate the study of local heatwave dynamics. Indeed, there is large spatial variability in temperature extremes across the Rio de Janeiro metropolitan area compared to other Brazilian cities (Alvares et al., 2013). However, impactful heatwaves in recent decades have increasingly drawn attention from public health officials and scientific communities alike. Recent literature has explored the dynamics and mortality impacts of extreme temperatures during heatwaves in 2010 (Geirinhas et al., 2019) and 2013/2014 (Geirinhas et al., 2022) and has begun to investigate compound heatwave and drought events throughout Southeast Brazil (Geirinhas et al., 2021). There is also building evidence that temperature extremes are increasing in intensity and frequency throughout Brazil, including the city of Rio de Janeiro (Regoto et al., 2021; Bitencourt et al., 2020). Climate variability also plays an important role in modulating temperatures over this area, including large scale modes of climate variability such as the El Niño-Southern Oscillation (Rehbein and Ambrizzi, 2023; Cai et al., 2020; Shimizu and Ambrizzi, 2016), the Pacific Decadal Oscillation, and the Atlantic Multidecadal Oscillation (He et al., 2021). Should more intense, frequent, and unseasonably early extreme heat events take place in the future in the city of Rio de Janeiro, these heatwaves may have increased impacts on human health due to potential exceedance of unprecedented temperature thresholds and individuals' lack of preparation for these events. In a tropical city where baseline temperatures are already relatively high, small shifts in the temperature distribution can have large impacts on the frequency of extremes (Cheng et al., 2019), particularly at thresholds relevant to human health outcomes (Vecellio et al., 2022). These health risks are compounded by the humidity in Rio de Janeiro, a coastal city with ample moisture sources from the ocean and surrounding vegetation, priming the region for humid heat extremes which are physiologically more dangerous to human health than dry heat (Mora et al., 2017).
In this study, we explore the meteorological conditions that led to the extreme heat event in November 2023 in the city of Rio de Janeiro. We identify drivers of the exceptional magnitude and persistence of the extreme temperatures, as well as their early arrival in the calendar year. We compare these conditions to those associated with typical heatwaves in the region, and particularly events taking place in the spring season. We then consider how extreme spring temperature events have shifted throughout the historical period, and how we might expect them to change in the future with ongoing anthropogenic climate change.
2.1 Data
This analysis employs both station-based observations and reanalysis data. Initial analyses are conducted on subdaily station data from the city of Rio de Janeiro, accessed via the Met Office Hadley Center's HadISD station-based dataset (Dunn, 2016) and the Rio Alert System produced by the Rio de Janeiro City Hall (Sistema Alerta Rio da Prefeitura do Rio de Janeiro, 2024). Three airport weather stations are available from HadISD for the city of Rio de Janeiro, namely the Galeão/Antonio Carlos Jobim International Airport (located on the island Ilha do Governador within the Guanabara Bay), the Campo Délio Jardim De Mattos Airport (an Air Force base located in the city's North Zone), and the Santos Dumont Airport (a waterfront airport located near the city center). Six additional stations from the Rio Alert System dataset record measurements from the tops of various community and commercial buildings, including hotels, schools, and warehouses. These stations are located in distinct areas of the city, whose topographical and coastal complexities contribute to various microclimates. These stations thus record distinct values, both instantaneously and on average (see Fig. S1 in the Supplement), a challenge that has been previously identified in the literature (Lyra et al., 2018; Dereczynski et al., 2013). We therefore base the majority of our analysis on reanalysis data and compare the identified patterns with station data when possible. This comparison is particularly important for extreme events, as the magnitude of extreme heat has been shown to be biased in reanalysis products due to their spatial and temporal smoothing of observations (Rogers et al., 2021; Raymond et al., 2020). Further, the human experience of heat stress is inherently hyperlocal, meaning that the distinct microclimates existing throughout the city can control heat stress exposure and the efficiency of adaptation strategies. However, the present study is primarily concerned with the regional drivers of the extreme event rather than its absolute magnitude. Reanalysis provides continuous spatial coverage and a wide array of internally consistent meteorological variables, which warrants its use for the application here.
Hourly meteorological data are retrieved from the fifth major global reanalysis of the European Centre for Medium-Range Weather Forecasts (ERA5), including 2 m temperature, 2 m dewpoint temperature, volumetric soil water for layer 1 (0–7 cm, where the surface is at 0 cm), surface pressure, geopotential height at 500 and 200 hPa, precipitation, evaporation, 2 m horizontal winds, and vertical velocity at 500 hPa (Hersbach et al., 2020). From this hourly data, daily maximum temperature, daily total precipitation, and daily means of all other variables are calculated from 1979–2023. Daily mean sea surface temperature (SST) data from 1979–2023 is also retrieved from the NOAA 1/4° Daily Optimum Interpolation Sea Surface Temperature (OISST) dataset (Huang et al., 2021).
We also explore the future evolution of temperature extremes over the city of Rio de Janeiro using the NEXGDDP dataset (Thrasher et al., 2022). This data product is statistically downscaled from the Coupled Model Intercomparison Project Phase 6 (CMIP6) models, with a spatial resolution of 0.25° and outputs variables on a daily temporal scale. We directly retrieve daily maximum temperature data through the end of the century under the Shared Socioeconomic Pathways (SSPs) SSP2-4.5 and SSP5-8.5 for the 23 models which output this variable and pair of scenarios for each day in the calendar year through 2100.
Because of Rio de Janeiro's complex coastal and mountainous terrain, projections may not accurately capture fine scale differences in the city's climate. For example, recent literature has shown that the coastal cooling relative to inland areas experienced in regions such as the eastern United States may be underestimated by global climate models (Raymond and Mankin, 2019). These biases are greatest in regions with large land-ocean surface temperature contrasts, however, and Rio de Janeiro's location in the tropics, as well as the fact that the extreme events analyzed in this study take place in the spring when this temperature gradient should be relatively small, may mute these biases compared to other regions and seasons. In order to address these potential sources of error, we generate a set of synthetic time series based on NEXGDDP projections which retain the seasonality and variability recorded in the historical reanalysis data from ERA5. We use a percentile matching technique in which we first bin all data for the grid cell which includes the city of Rio de Janeiro during a historical base period (1981–2013) into one-percentile bins for both the NEXGDDP and ERA5 datasets. We additionally bin all NEXGDDP data from this grid cell into one-percentile bins during one midcentury period (2041–2060) and one end-of-century period (2081–2100). We then calculate the temperature delta for each percentile bin between the base period and both the midcentury and the end-of-century periods in the NEXGDDP data. Finally, we add these percentile-specific change factors to every data point in each associated bin in the historical ERA5 base period.
2.2 Methodology
We first create time series for the historical day-of-year climatologies of variables in the city of Rio de Janeiro and compare them to the evolution throughout 2023. All anomalies are calculated relative to historical mean calendar date values (i.e., the daily maximum temperature anomaly on 18 November 2023 is calculated by subtracting the mean daily maximum temperatures on 18 November in all previous years in the historical record from the recorded absolute magnitude of the event). We also generate maps of concurrent meteorological variables relevant to the extreme heat event for the greater region outside of Rio de Janeiro. We compare these spatial patterns to those experienced during previous extreme heat events in Rio de Janeiro, calculated as 99th percentile daily maximum temperature days across all seasons for the grid cell which includes the Galeão International Airport weather station. We then select for events that occur in the September–November (SON) austral spring season.
We also quantify how extreme heat in the city of Rio de Janeiro is shifting using a variety of methods. We first calculate the trend in the frequency of extreme temperatures over the historical record in Brazil, defining these extreme temperatures using both absolute and relative thresholds. We select these thresholds as 30 °C and the locally defined 90th percentile daily maximum temperature at each grid cell. These thresholds are chosen in order to investigate impactful temperature magnitudes while ensuring sufficient sample size for the trend analysis.
We also visualize the broadening of the extreme heat season, calculated based on the number of days between the start of the first heatwave and end of the last heatwave of the season. A heatwave is defined here as a 3 d period with consecutive daily maximum temperatures above the 50th percentile of daily maximum temperatures across the two hottest months of the year in the city of Rio de Janeiro (January and February); this 50th percentile threshold is equal to about 31.4 °C. This heat season definition is informed by a definition used by the United States Environmental Protection Agency (US EPA, 2021), adapted to better reflect Rio de Janeiro's lower temporal variability in temperature due to its tropical location.
Finally, we calculate how spring temperature distributions have already changed in Rio de Janeiro by comparing early and late historical periods in ERA5 for the grid cell which includes the Galeão International Airport weather station. Distributions are calculated from annual spring maximum temperatures in the city of Rio de Janeiro and fit using GEV distributions, which have been shown to well capture extreme temperature distributions (Powis et al., 2023; Van Oldenborgh et al., 2022). For comparison, we also plot GEV distributions for early and late historical periods in the NEXGDDP model data before applying our bias-correction technique. The location parameter and spread of the model data distributions during these periods is much lower than that of ERA5 (Fig. S2), further motivating our use of synthetic time series to explore how these distributions may change in the future.
We then use the bias-corrected NEXGDDP data for the 23 models which report daily maximum temperature for each day in the calendar year under the aforementioned SSP2-4.5 and SSP5-8.5 scenarios during a midcentury and end-of-century time period. We additionally evaluate the impact of only using models which most accurately reproduce the historical observed daily maximum temperature record in the city of Rio de Janeiro. We calculate the Perkins skill score to evaluate the similarity between probability density functions of daily maximum temperature in the reanalysis dataset (ERA5) and each of the 23 global climate models during the historical period. These skill scores are calculated as the cumulative minimum between the observed and modeled distributions of each binned value (Perkins et al., 2007). We finally select the 6 climate models which exhibit skill scores greater than 0.8, indicating that these models capture over 80 % of the observed probability density functions. The result of this analysis is shown in Fig. S3, but the interpretation of the results as shown in the main text using all 23 models does not change.
3.1 Rio de Janeiro's spring 2023 heatwave
The city of Rio de Janeiro experienced exceptionally high temperatures in both the austral winter and spring of 2023, peaking on 18 November (Fig. 1). This record-breaking event became the highest daily maximum temperature on record at the Galeão International Airport weather station, reaching 41.3 °C. The extreme heat event was also notable for its accompanying high specific humidity, which rose alongside temperature in the days leading up to 18 November (Fig. 1B). The combination of elevated temperature and humidity rendered the event a humid heat extreme, as measured by wet bulb temperature, which peaked at 28.2 °C on 18 November (Fig. 1C). The coincidence of extreme dry and wet bulb temperatures is typical for extreme heat events in Rio de Janeiro, where there is a statistically significant positive correlation between daily maximum temperature and daily mean specific humidity (Fig. S4). This relationship is facilitated by the city's abundant access to moisture from the coast and surrounding vegetation.
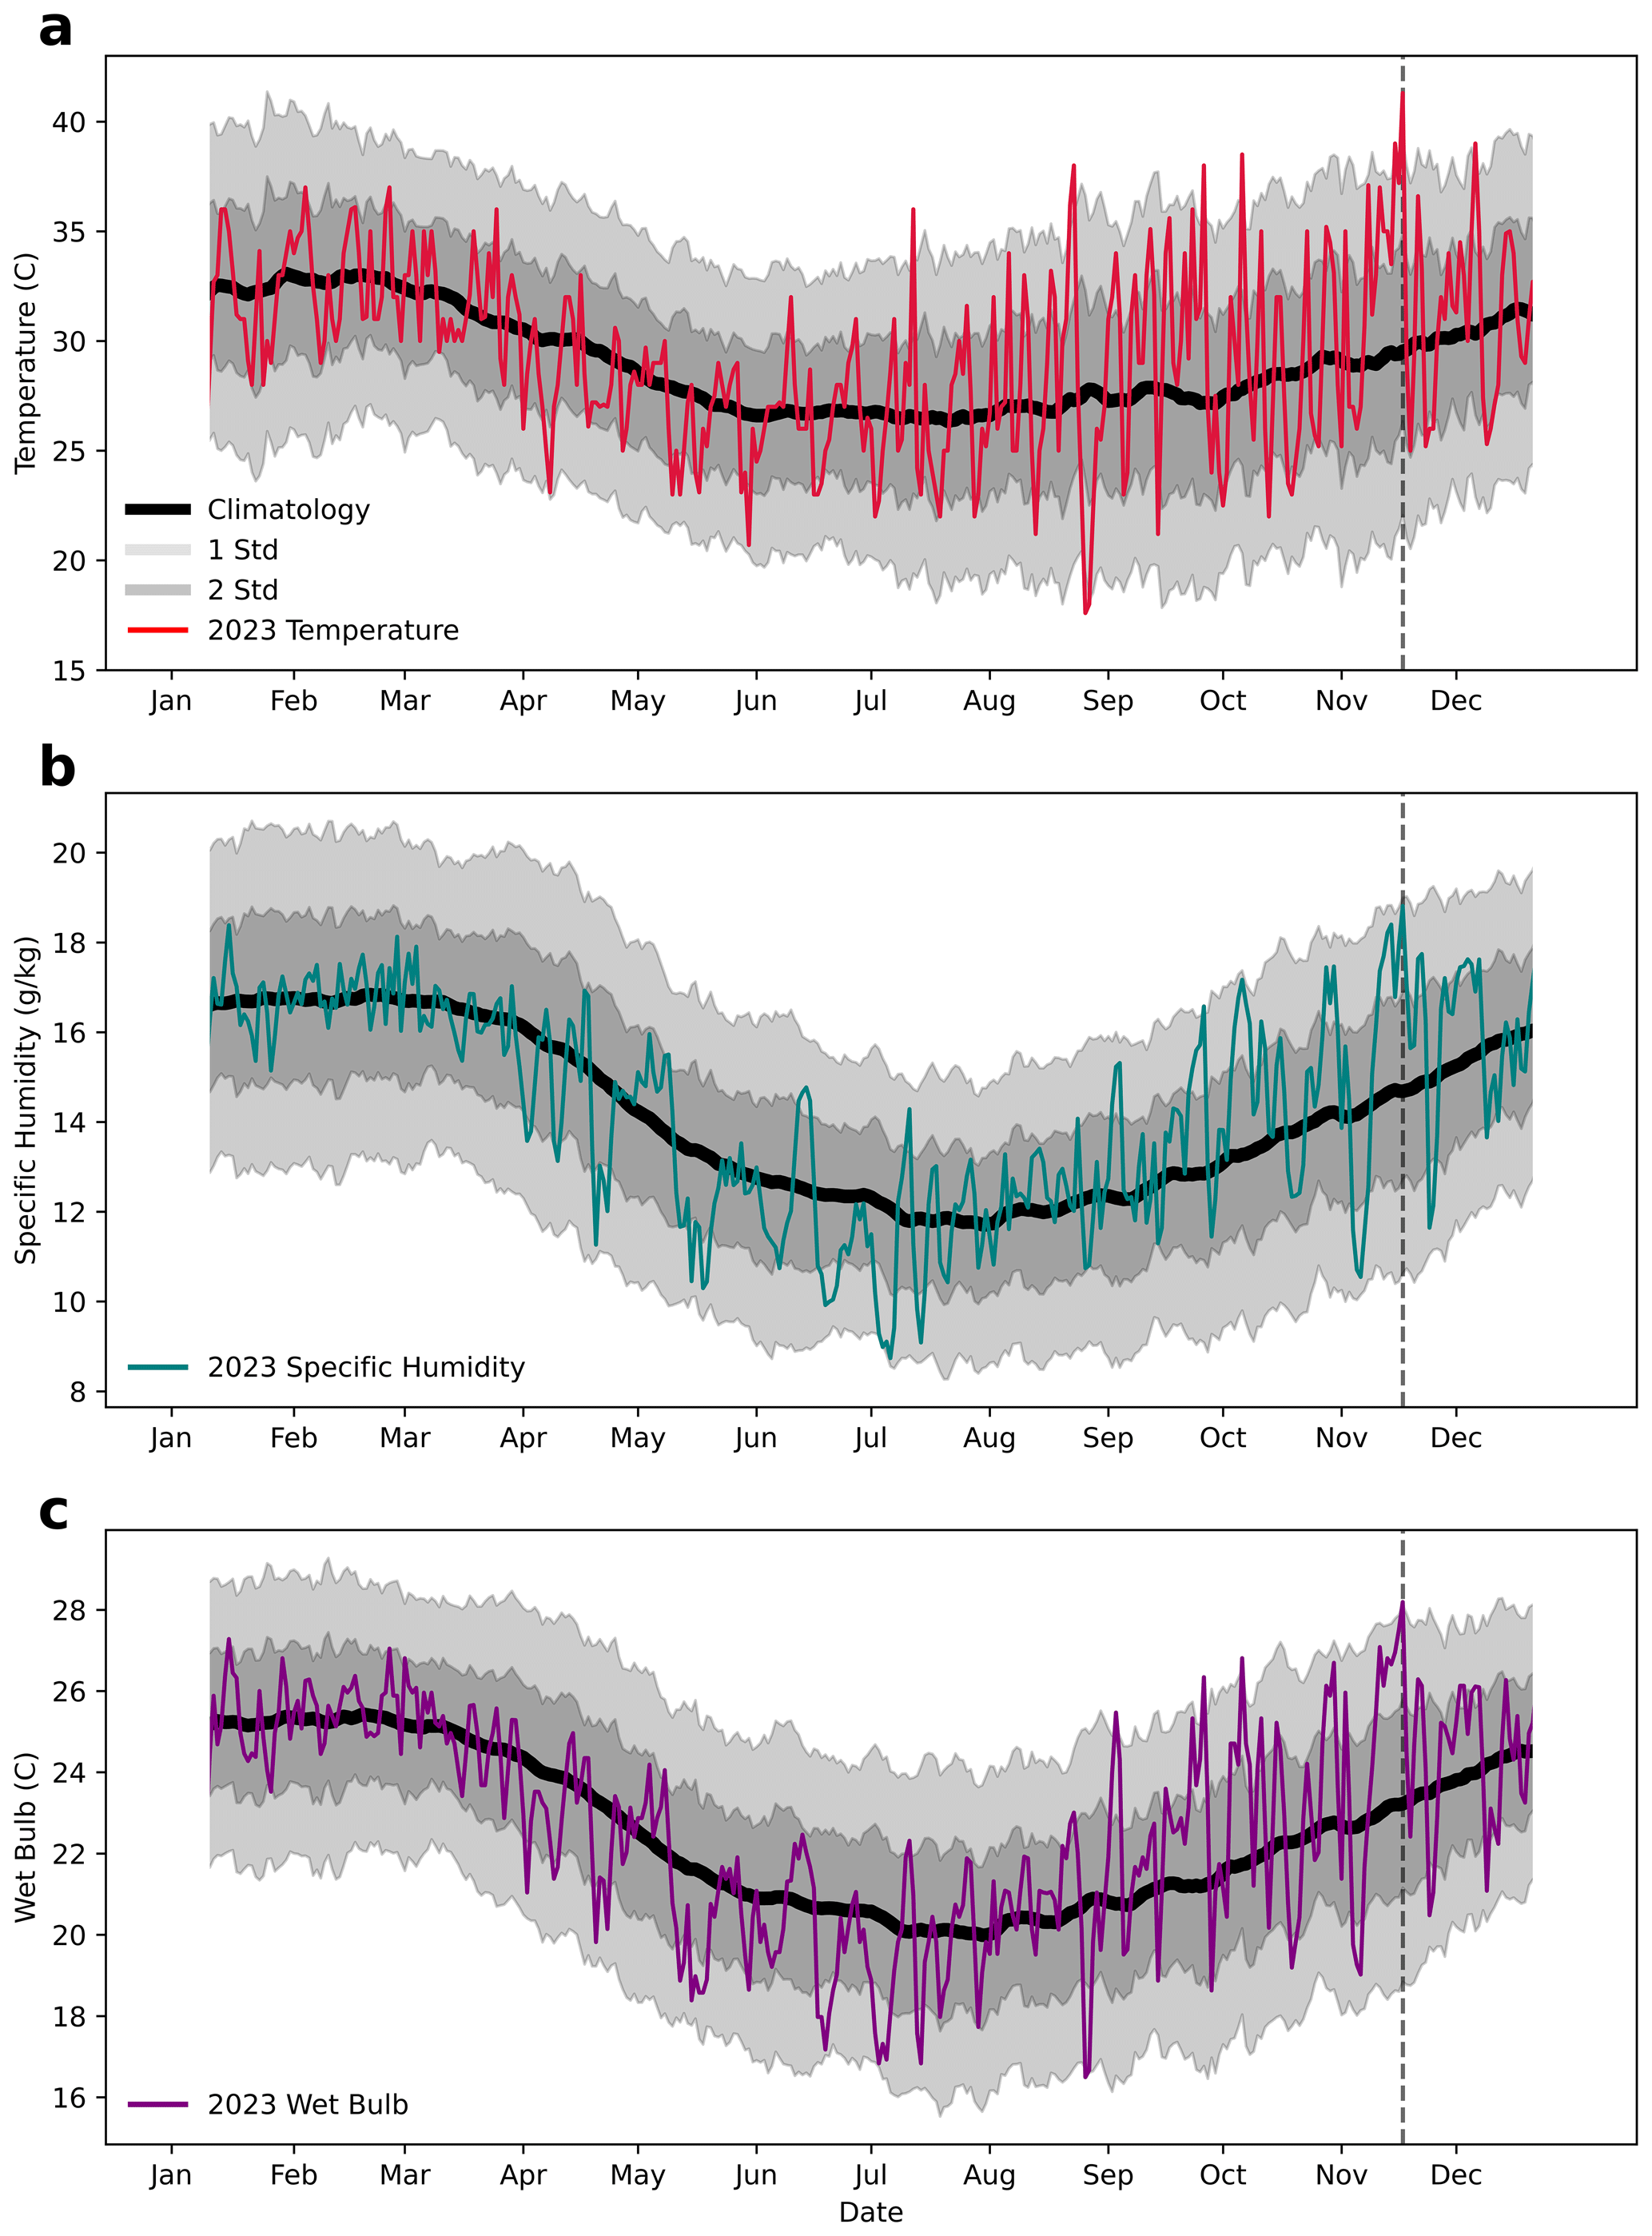
Figure 1Historical climatology and 2023 recorded (A) daily maximum temperature, (B) daily mean specific humidity, and (C) daily maximum wet bulb temperature in the city of Rio de Janeiro. Data from the Galeão International Airport weather station as reported by the HadISD dataset. Vertical dashed line identifies record-breaking temperature event on 18 November 2023.
Elevated temperatures occurred over an area greater than the city of Rio de Janeiro, but were spatially constrained by orography (Fig. 2). We explore the spatial patterns of the heatwave in data from the European Centre for Medium-Range Weather Forecasts (ERA5) reanalysis during the period of 1979–2023 (Hersbach et al., 2020). We see that hotspots in elevated temperatures were located throughout the coastal region surrounding Rio de Janeiro, with sharp declines across the mountainous terrain moving inland. These positive coastal temperature anomalies coincide with northerly surface wind anomalies. ERA5 estimates the daily maximum temperature on 18 November in the grid cell containing the Galeão International Airport weather station as 40.6 °C, within the range of temperatures recorded throughout weather stations in the city (Fig. 2c; Fig. S1). This extreme event was also remarkable in length as measured by ERA5, as daily maximum temperatures were above the locally defined 90th percentile for 8 consecutive days, and above the 99th percentile for the final three days of this period (percentiles calculated from ERA5 across the period from 1979–2023). This multi-day interval of exceptional temperatures rendered it difficult for residents to find relief.
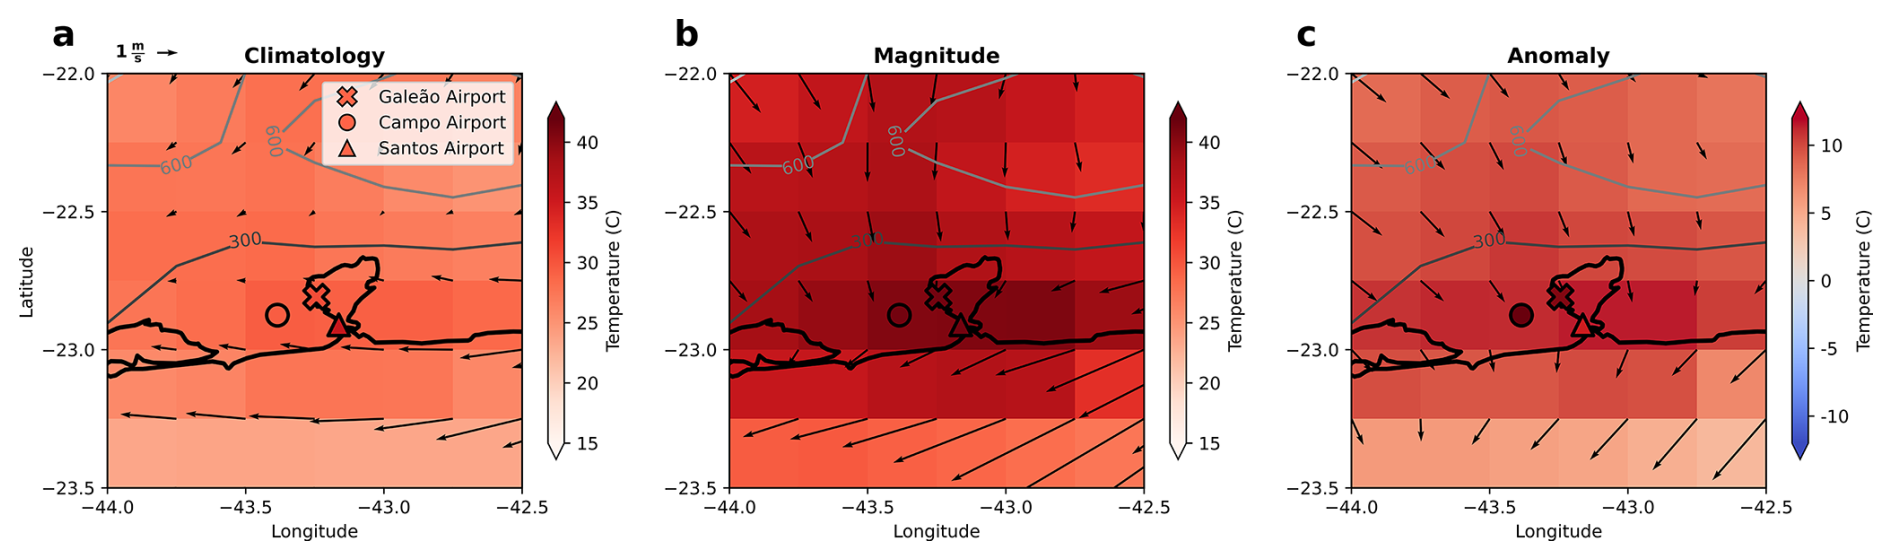
Figure 2Spatial maps of daily maximum temperatures during the date of peak extreme heat intensity in the city of Rio de Janeiro using ERA5 data (shading) and three city weather stations with long-term temperature records (markers). Vectors represent surface winds; contours represent elevation in meters. (a) Climatology during 18 November throughout the historical record. (b) Magnitudes on 18 November 2023. (c) Anomalies on 18 November 2023.
The maximum temperature during the event on 18 November coincided in time with other anomalous meteorological conditions (Fig. 3; for climatological values, see Fig. S5). Positive geopotential height anomalies centered over Rio de Janeiro were consistent with an intensification of the South American Subtropical High, a semi-permanent anticyclonic circulation system off the Southeast coast of Brazil. The edge of this positive high pressure anomaly was collocated with the region of positive temperature anomalies that includes the city of Rio de Janeiro (Fig. 3b). Surface winds off the coast of Rio de Janeiro were anomalously northerly. Anomalously northerly flow in this mountainous area can exacerbate high temperatures directly through downslope winds (Stefanello et al., 2022). Previous literature has also shown that anomalously northerly winds over the coast can increase local sea surface temperatures through reductions in wind-driven upwelling, reducing the capacity for coastal cooling (Castelao and Barth, 2006; Palma and Matano, 2009). Indeed, positive SST anomalies of up to 2 °C occurred along Rio de Janeiro's coast on the day of the peak in air temperature (Fig. 3j). Anomalous winds over the interior of South America also enhanced the northerly South American Low Level Jet (Marengo et al., 2004; Montini et al., 2019). Positive specific humidity anomalies were present throughout Southeast and South Brazil (Fig. 3f), intersecting with an area of precipitation along the edge of the low pressure system to the south (Fig. 3g). The northern portion of the positive specific humidity anomaly was aligned with the positive geopotential height anomaly off the coast of Southeast Brazil. Widespread negative soil moisture anomalies occurred throughout most of Brazil, and the interior of South America more broadly, during this event (Fig. 3d). The large spatial coverage of these negative soil moisture anomalies was concurrent with Amazonian drought recorded during this time, inherited from the prior season (Espinoza et al., 2024). These spatial patterns are typical of extreme heat events during the spring season in the city of Rio de Janeiro, though the magnitudes of the anomalies in all of these variables are dramatically higher on 18 November 2023 than during other spring extreme heat events (Fig. 4). The most unique features of the 18 November event were the intensified northerly winds and the degree of inland penetration of positive specific humidity anomalies (Fig. 4e–f). Further, the positive local SST anomalies off the coast of Rio de Janeiro were particularly exceptional in intensity and spatial scale during this event, weakening the sea-air temperature contrast and sea-breeze (Fig. 4i–j). Outside of these specific distinctions, the event on 18 November 2023 was an intense example of a typical spring extreme heat event in the region.
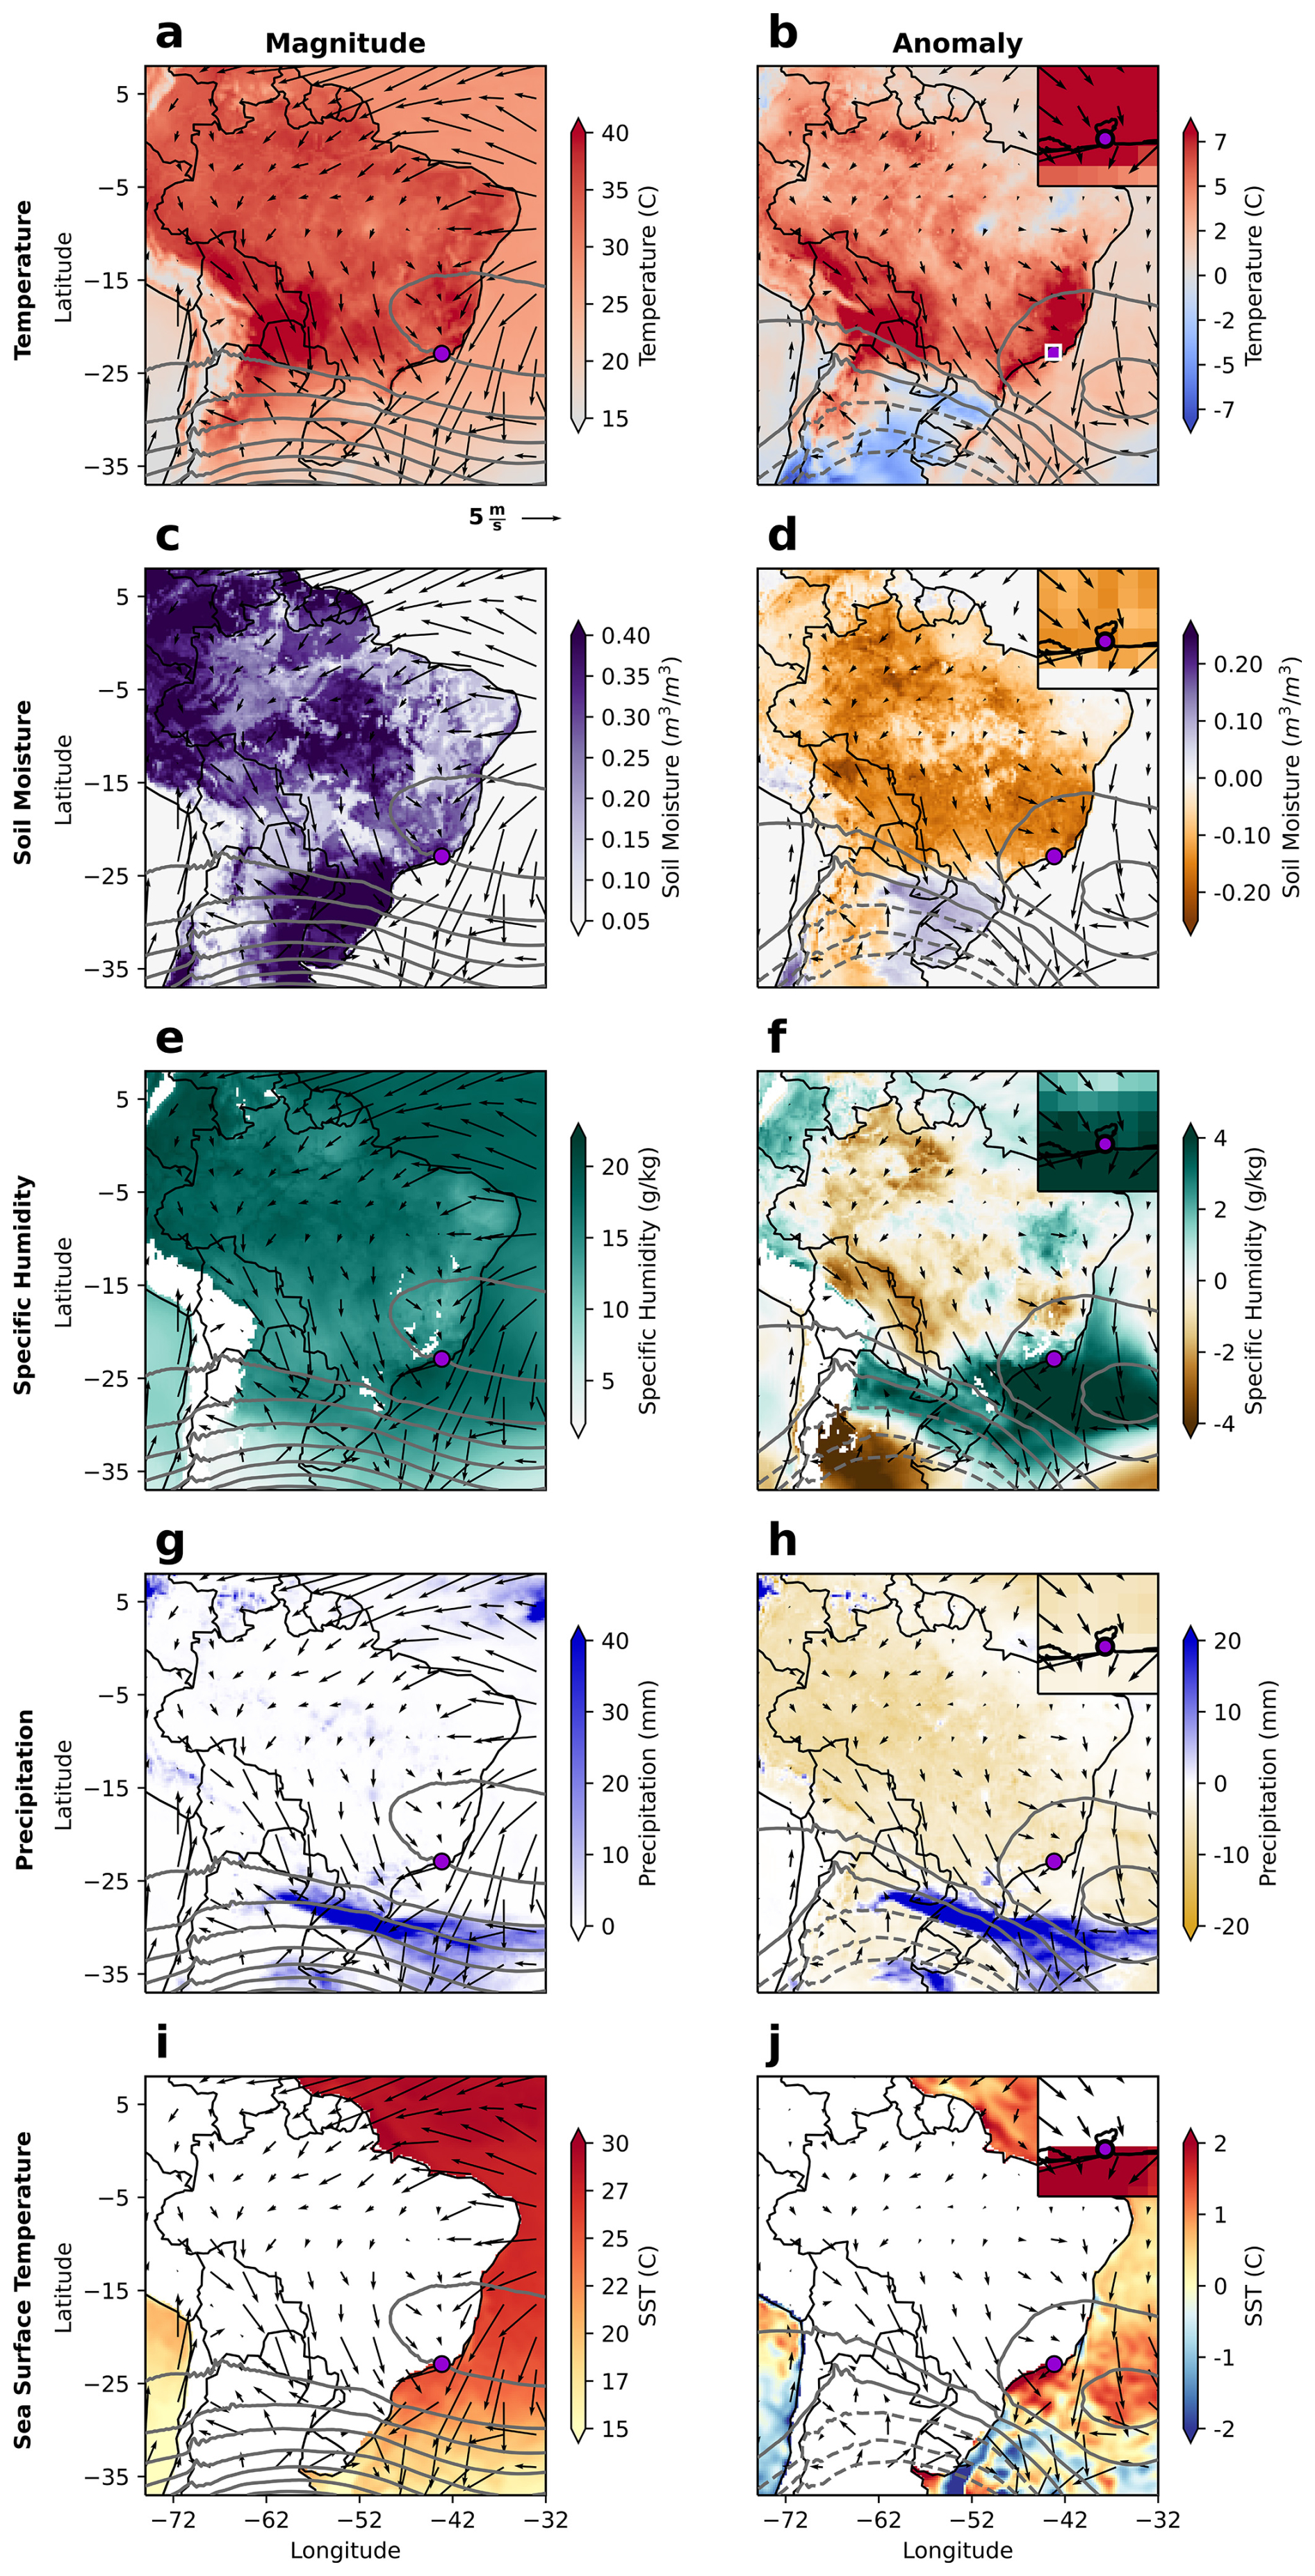
Figure 3Magnitude (a, c, e, g, i) and anomalies (b, d, f, h, j) of daily maximum temperature, mean soil moisture, mean specific humidity, total precipitation, and mean SST on day of peak temperature in the city of Rio de Janeiro (18 November 2023). Overlying wind vectors and 500 hPa geopotential height contours (50 and 25 m contour levels for magnitude and anomaly plots, respectively). Anomalies calculated relative to historical calendar date mean values across the period from 1979–2023. Inset in the upper right corner of each anomaly plot zooms in on the white box surrounding the city of Rio de Janeiro (purple marker) in the top right subplot.
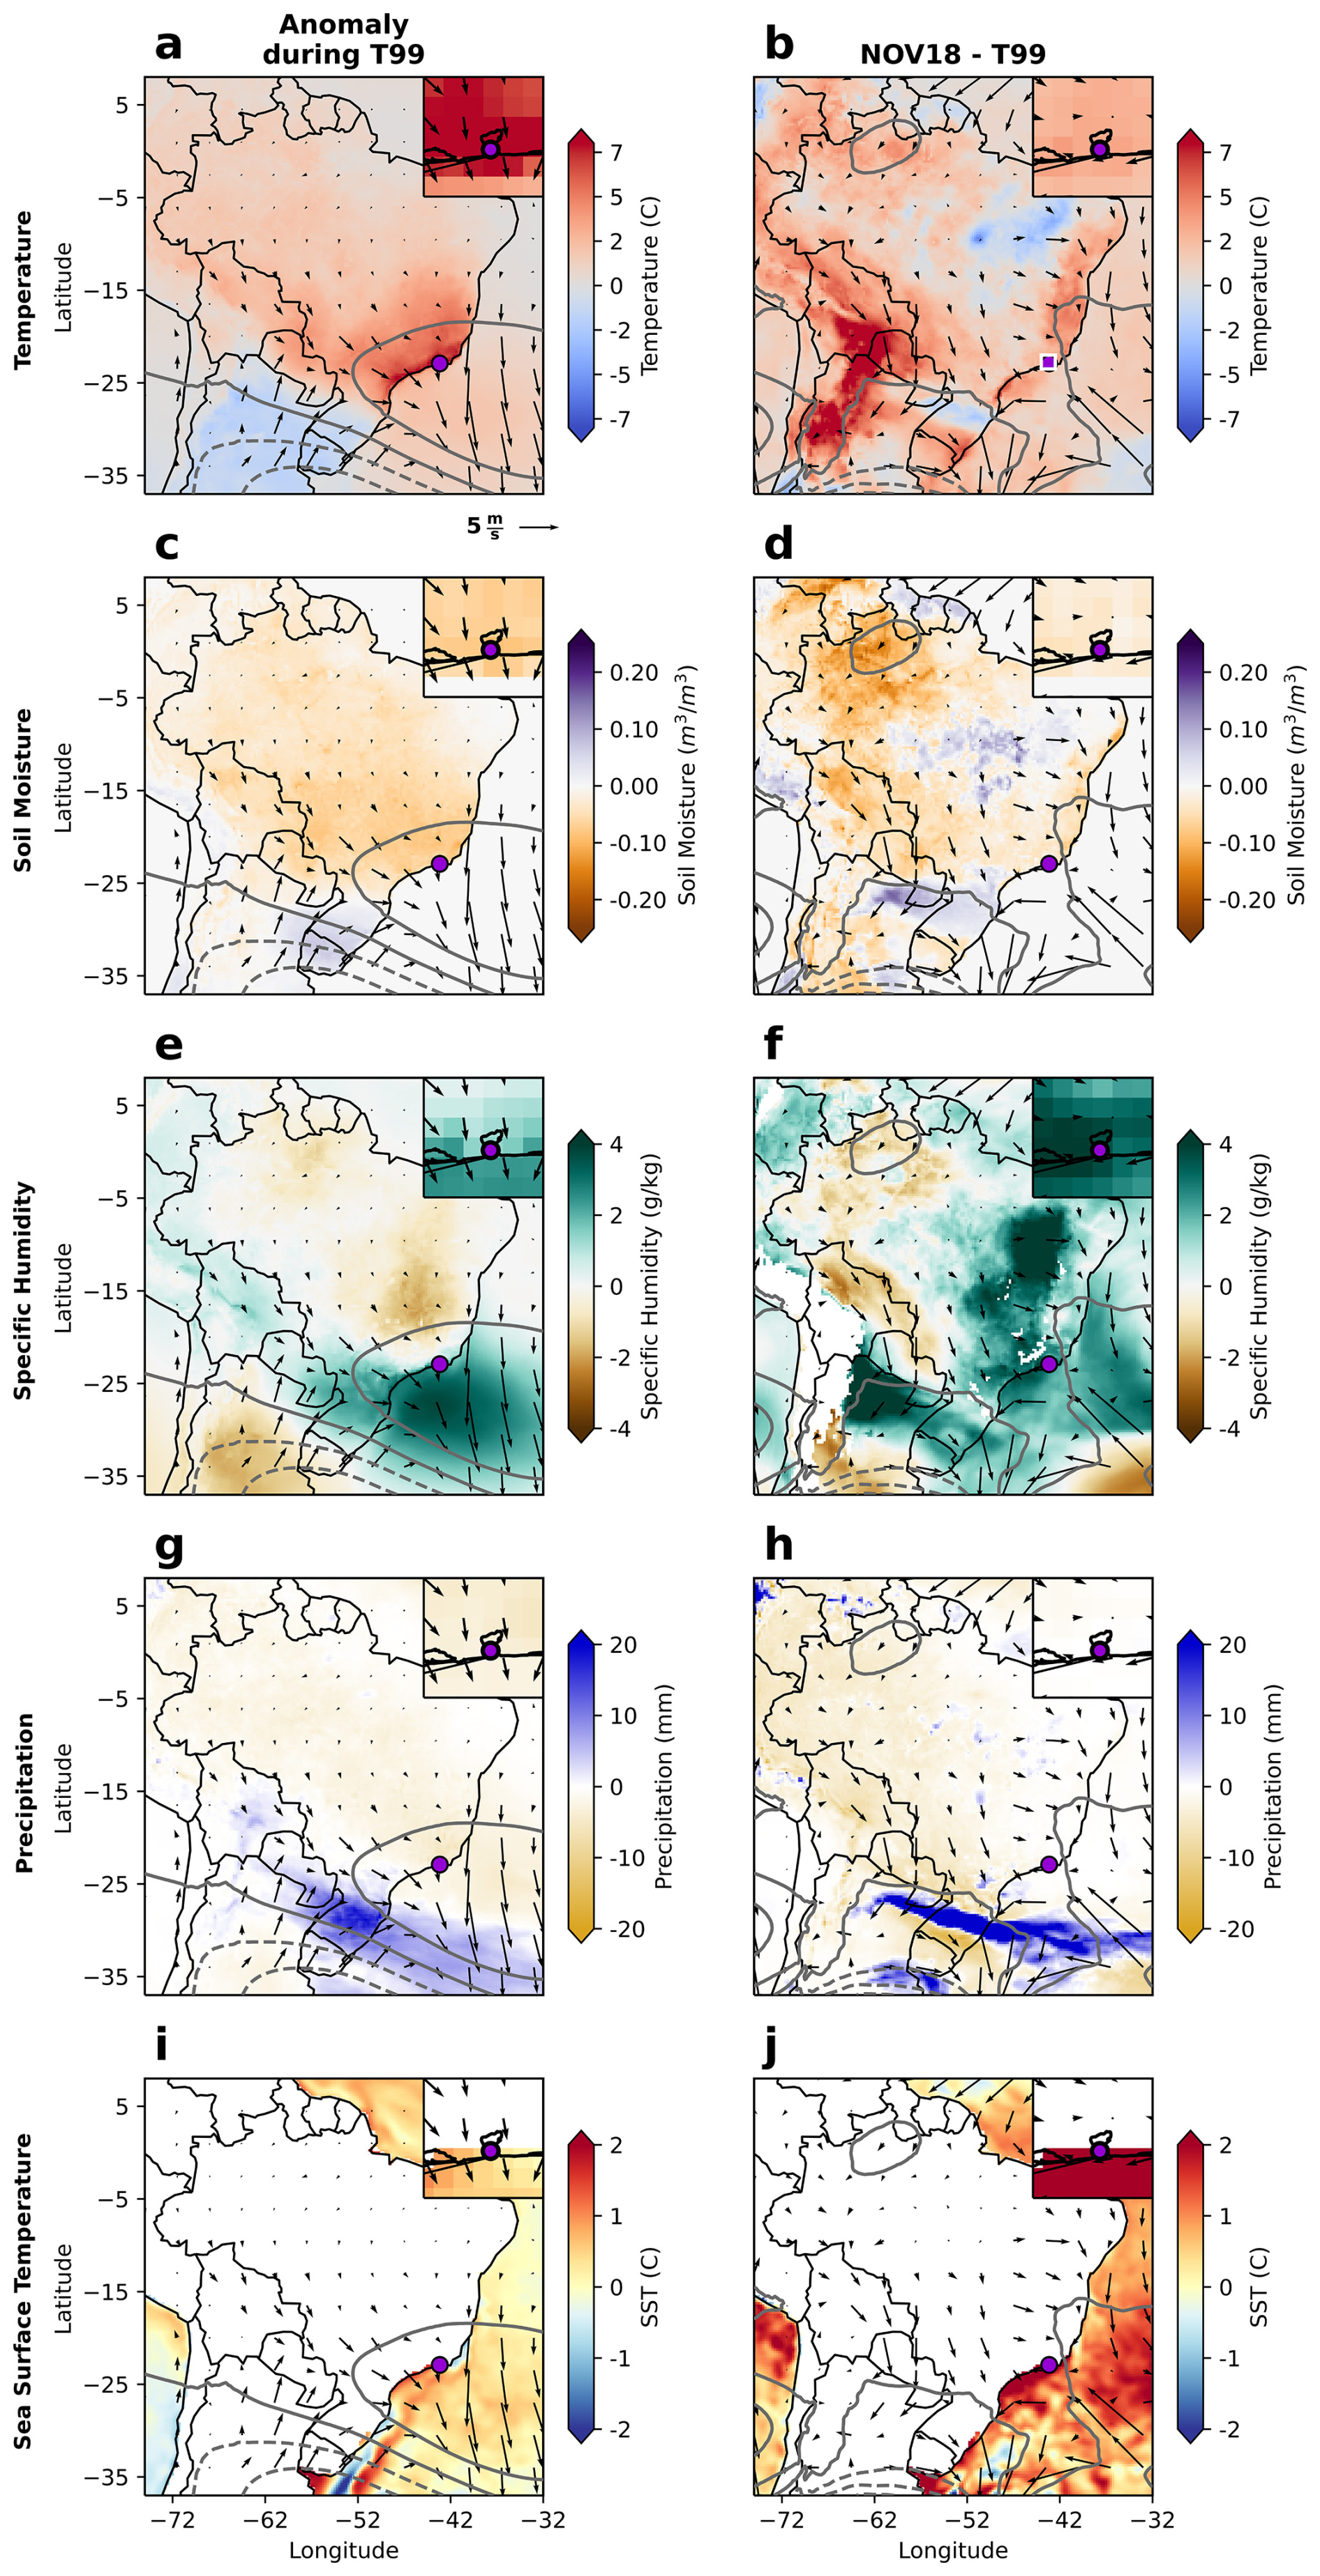
Figure 4Anomalies in daily maximum temperature, mean soil moisture, mean specific humidity, total precipitation, and mean SST during 99th percentile extreme temperature days in the September–November (SON) season for the ERA5 grid cell which includes the Galeão International Airport weather station (a, c, e, g, i). Difference in conditions on 18 November compared to mean conditions during these 99th percentile extreme temperature days (b, d, f, h, j).
The time evolution of the meteorological variables described above throughout the month of November 2023 uncovers the temporal development of the extreme heat event (Fig. 5). Rising temperatures throughout the weeks leading up to 18 November were preceded by elevated geopotential heights at 500 hPa and associated atmospheric subsidence. This was accompanied by a rapid decline in soil moisture which was likely facilitated by the increased solar insolation associated with the persistent high pressure system and resulting extremely low precipitation from 2–18 November. Given that the rainy season in Southeast Brazil typically begins in late-October to mid-November (Coelho et al., 2022; Latinović et al., 2019; Marengo et al., 2012; Liebmann and Mechoso, 2011; Raia and Cavalcanti, 2008), this period of consecutive dry days was unusual. Indeed, this period totals 17 d in a row with less than 5 mm of rain per day, and this only happened during the month of November in 1 other year in the historical record from ERA5 between 1979 and 2023 (2012). These changes in geopotential height, soil moisture, and suppressed precipitation preceded changes in other variables, evidenced by the grey lines in the background of each subplot. Wind direction was highly variable on a daily scale, but became increasingly northerly during this same period. These changes were accompanied by a gradual increase in SST off the coast of Rio de Janeiro, though delayed compared to that of the local air temperature. These changes in wind direction and SSTs are likely linked, as upwelling in this region can be significantly reduced through northerly wind anomalies, increasing coastal sea surface temperatures (Castelao and Barth, 2006; Palma and Matano, 2009). Secondary pathways to SST increases could include increased solar radiation to the ocean, added heat flux to the ocean, and a thinning of the oceanic mixed layer. These features are common around many coastlines during atmospheric heatwaves that are associated with warming coastal waters, though further research would be needed to quantify their relative importance during the November 2023 heatwave in Rio de Janeiro. As air temperatures rose, specific humidity increased over the city. This was likely related to both local evaporation from the soil (co-occurring with declining soil moisture) and moisture advected from the anomalously warm coastal waters and surrounding vegetation. The circulation specifically on 18 November directed wind in the larger region surrounding Rio de Janeiro to intensify the South American Low Level Jet, which can additionally increase moisture transport from the Amazon Basin to Southeast Brazil (Marengo et al., 2004; Vera et al., 2006; Montini et al., 2019). However, convergence of the horizontal moisture flux at the level nearest the surface was only stronger than its climatological values in some grid cells within the northern and western areas of the city (Fig. S6). More generally, specific humidity was also able to build without reaching saturation due to the increasing temperatures (via the Clausius–Clapeyron relation). Finally, the heatwave was terminated when a 2 d precipitation event occurred from 19–20 November. This precipitation induced a small decline in specific humidity and SST, as well as a rapid increase in soil moisture.
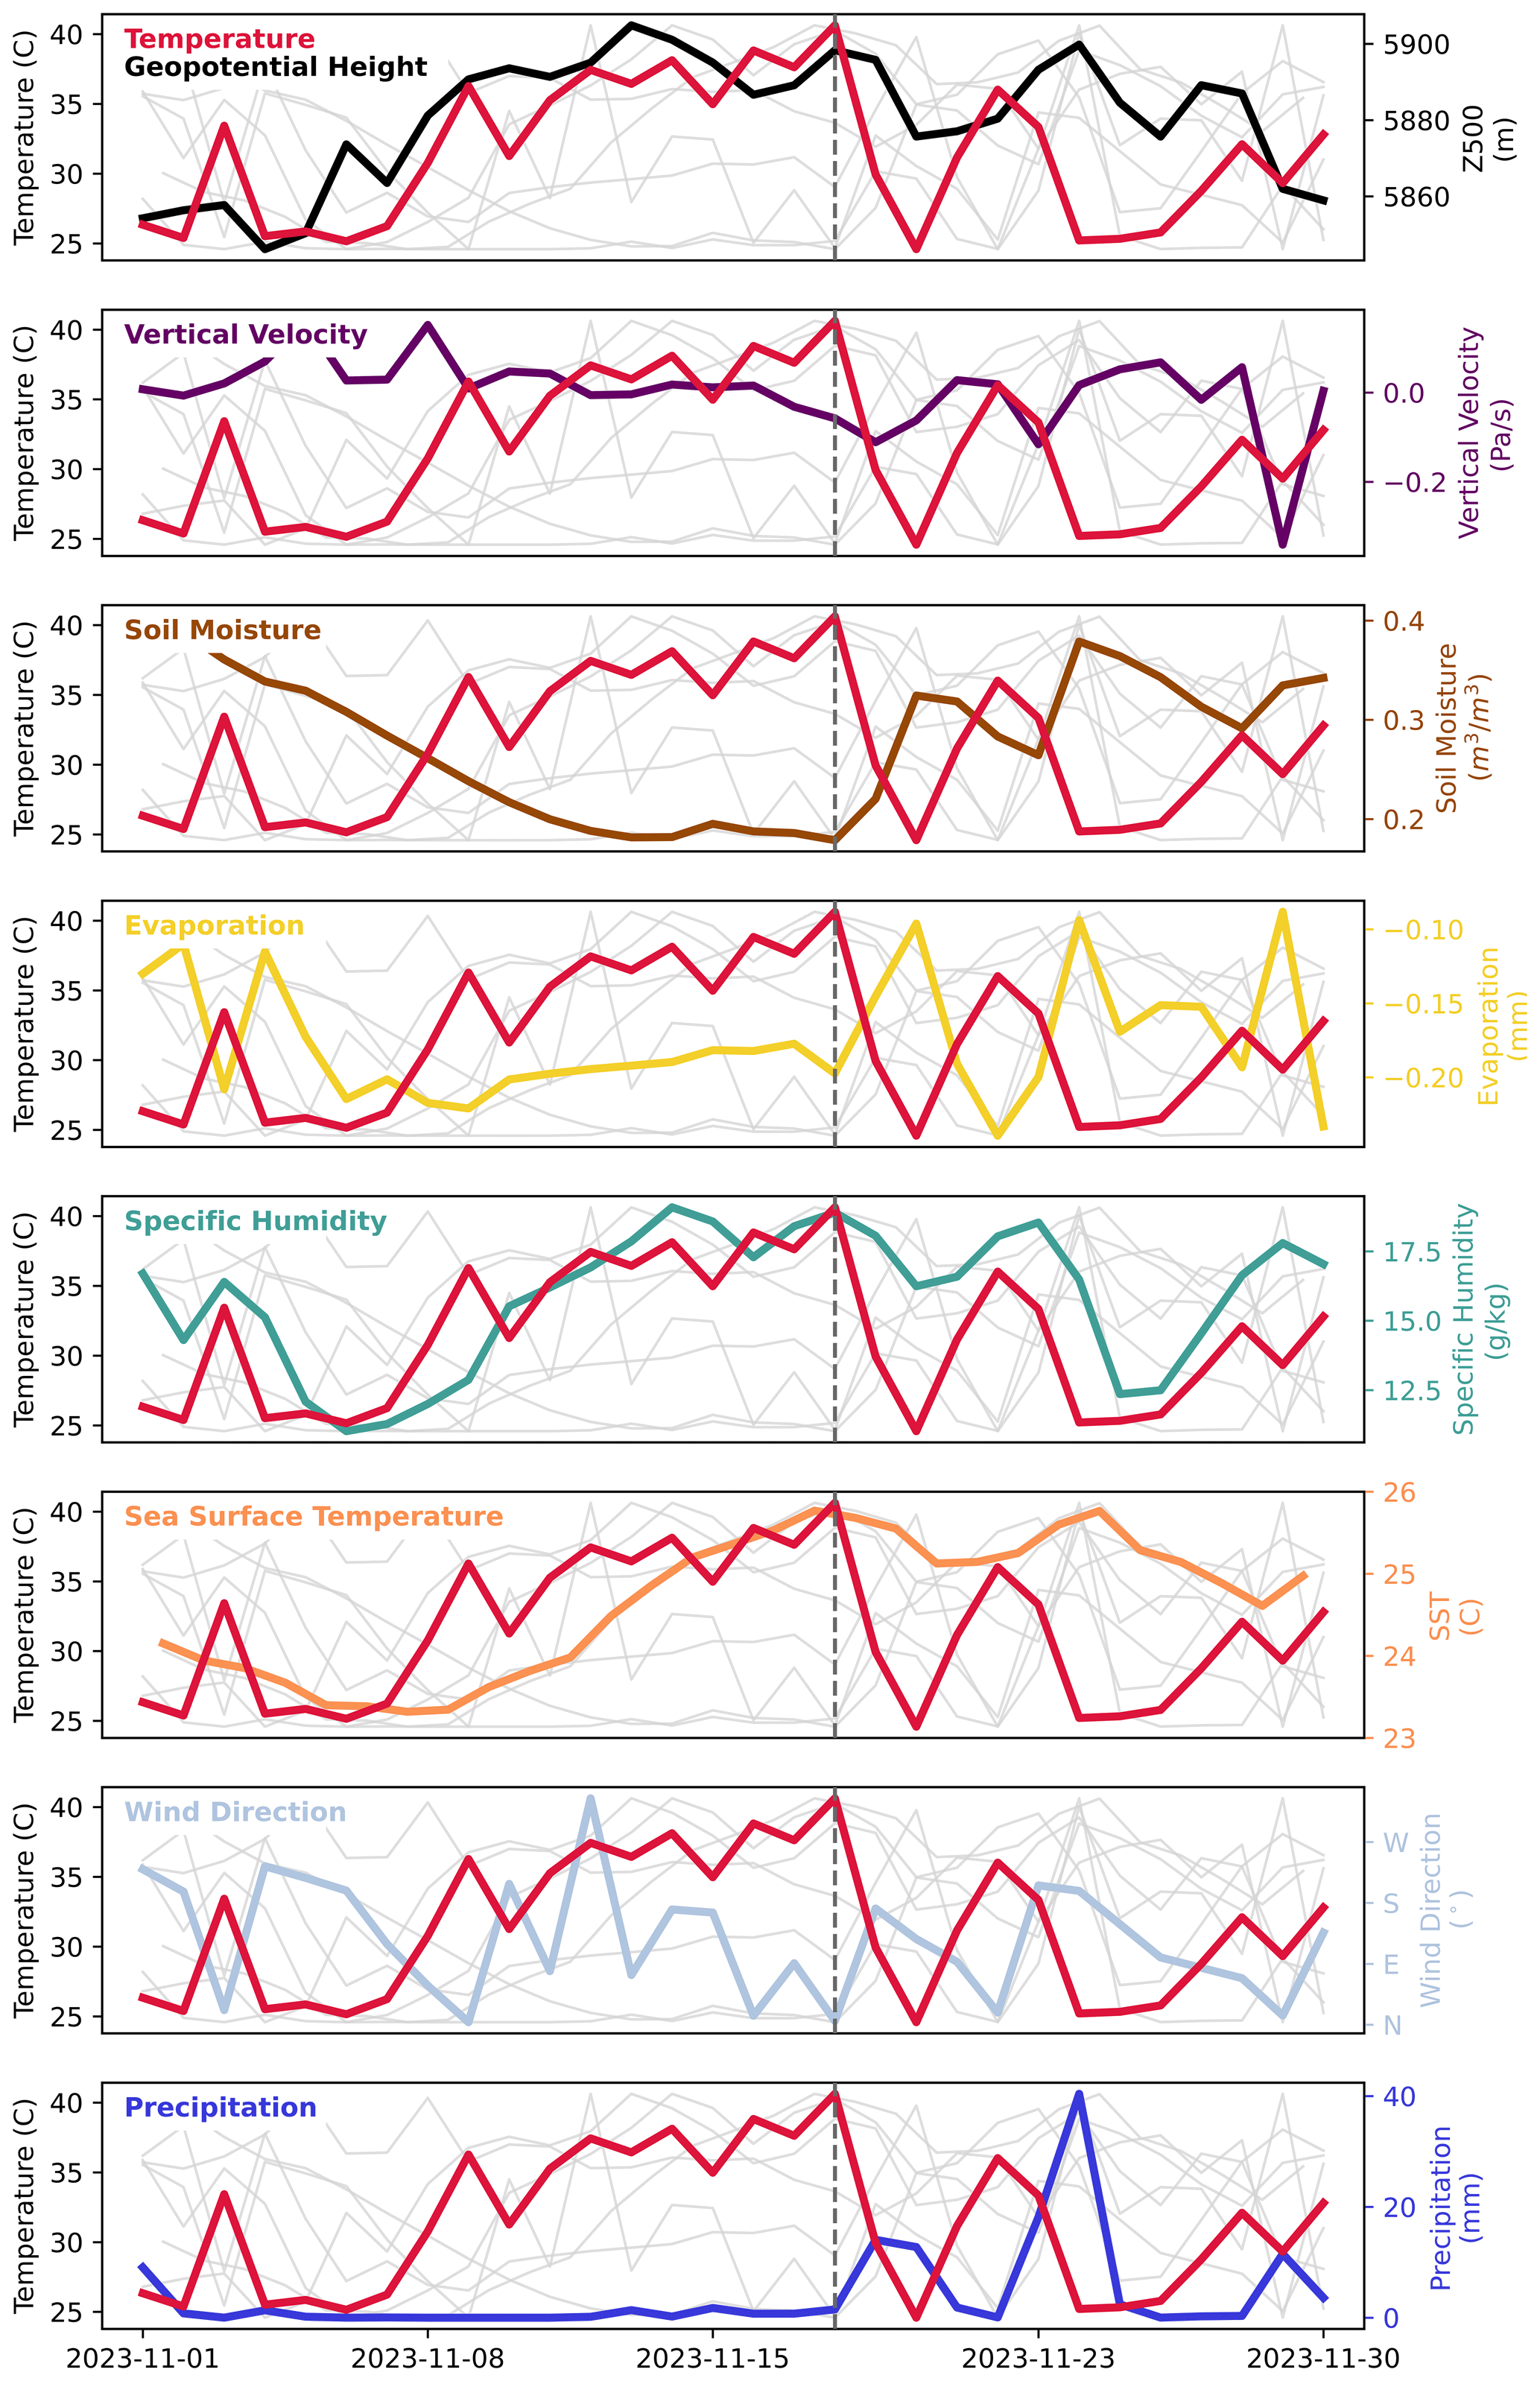
Figure 5Evolution of meteorological conditions during the month of November 2023 in Rio de Janeiro. Grey lines in the background of each subplot show the evolution of all variables, with individual variables compared in colors to dry bulb temperature in red. Vertical dashed line identifies record-breaking temperature event on 18 November 2023. All variables are calculated for the grid cell which includes the Galeão International Airport weather station except SST, which is averaged over the box 21–24° S and 42° W–45° E.
The evolution of the 2023 heatwave as shown above is reminiscent of that during the 2010 heatwave analyzed by Geirinhas et al. (2019). Those authors explain that the extreme heat event in the summer of 2010 was initiated by a positive SST anomaly over the eastern Pacific that triggered a Rossby wave train that in turn intensified the South Atlantic Subtropical High. Modulation of this climatological high pressure system has been shown to be central to influencing weather in the city of Rio de Janeiro, and particularly temperatures there (Geirinhas et al., 2018). Here we also observe a positive SST anomaly over the equatorial Pacific throughout the month of November and a resulting anomalous wave pattern ending over the South Atlantic High that became increasingly organized and strengthened during the two weeks before 18 November (Fig. 6; see Fig. S7 for maps of the climatologies and absolute magnitudes of these variables). This mechanism is similar to how El Niño generally influences temperatures in Southeast Brazil on longer timescales (Cai et al., 2020), and we confirm that there is a positive correlation between the ENSO state as quantified by the Niño3.4 index and the frequency of high heat days in the city of Rio de Janeiro in the austral spring season (Fig. S8). Further, the mean spatial SST and Z200 patterns during the spring of typical El Niño years look very similar to those observed during November 2023, though the anomalies in both SST and geopotential height are much larger during November 2023 (Fig. S9). 2023 was characterized by a transition from La Niña to El Niño, with the El Niño emerging in April–June 2023 and strengthening to a strong El Niño in the second half of 2023 (Becker et al., 2024). The SST anomalies associated with the El Niño could have been responsible for initiating the wave train which set off the geopotential height anomalies over Rio de Janeiro, consistent with the results of a recent analysis exploring spring and winter heatwaves throughout South America during 2023 (Marengo et al., 2025). More broadly, it has been suggested that multi-month elevations in temperature over Brazil throughout 2023 could be driven in part by El Niño (Pampuch et al., 2025). Further, the second half of 2023 was exceedingly warm globally (Cattiaux et al., 2024; Perkins-Kirkpatrick et al., 2024), due in large part to anthropogenic warming, indicating that climate variability and climate change both likely preconditioned the November 2023 extreme heat event. We note that similar wave trains driven by Pacific SST anomalies have been shown to influence weather in Southeast Brazil even during neutral ENSO states (Seth et al., 2015). Additionally, the instantaneous extreme temperature event and the preceding persistent dry conditions must also be linked to the synoptic weather in the area. Decreases in soil moisture and horizontal moisture fluxes by intensification of the South American Low Level Jet were central features of the heatwave in 2010, as they were in November 2023. These overlaps in the apparent drivers of the 2010 and 2023 heatwaves underscore that while the 2023 spring event was unprecedented in its magnitude and unusual in its spring timing, it was not unique in its overall dynamics.
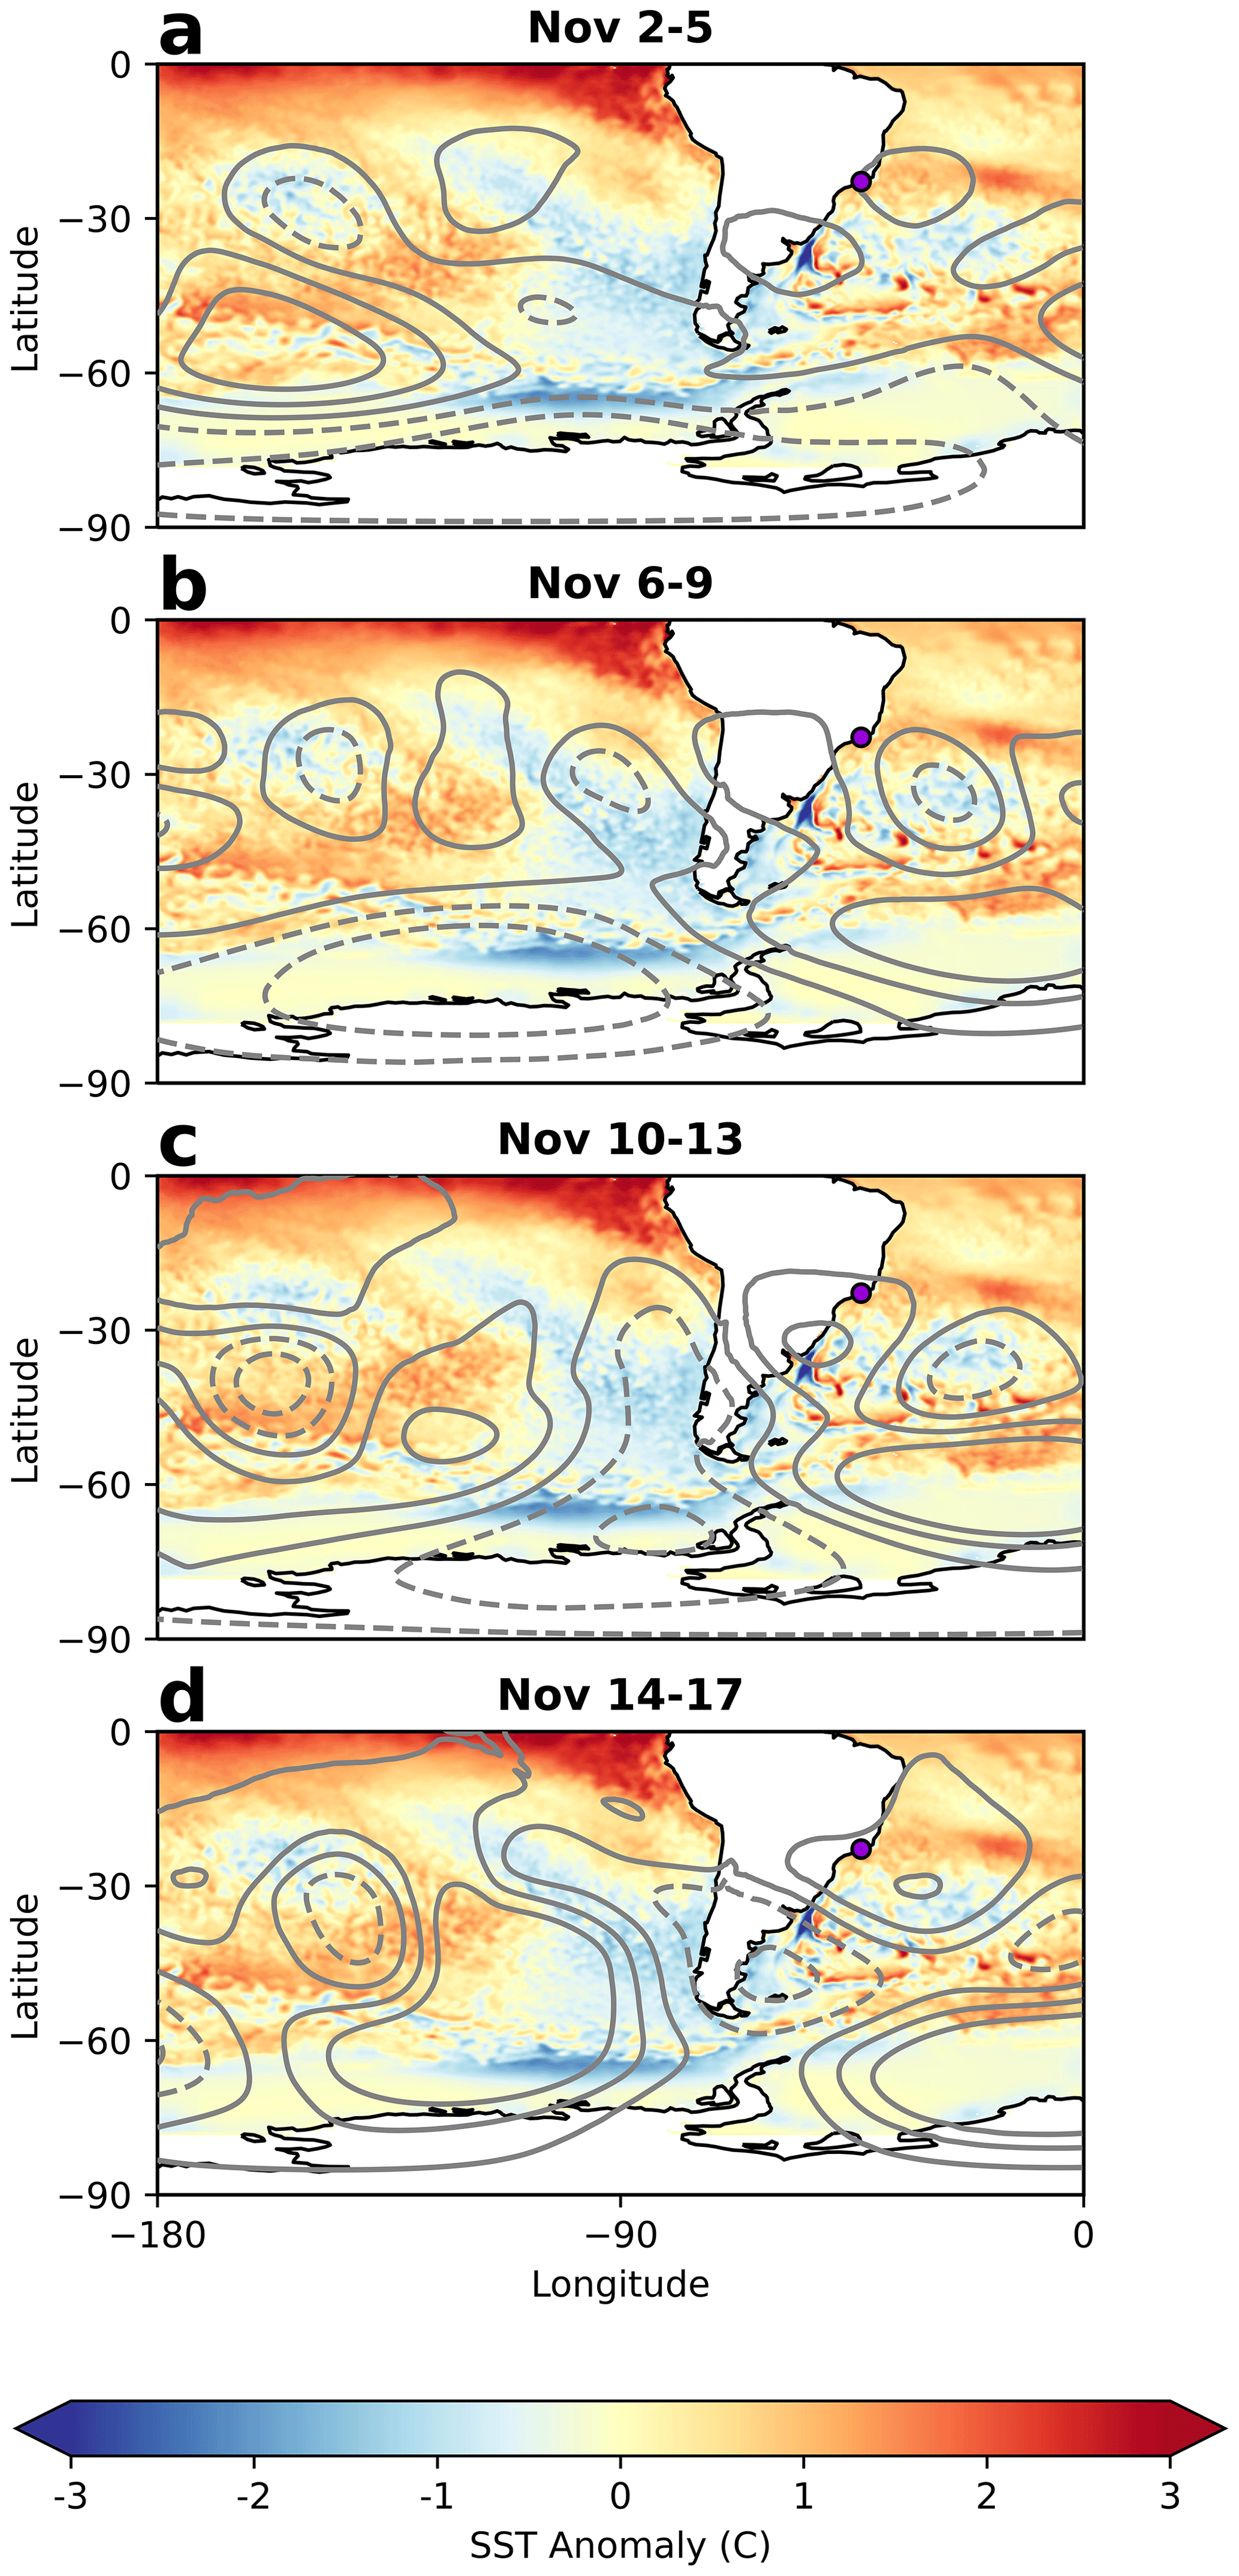
Figure 6Evolution of the geopotential height at 200 hPa (contours) in the weeks of suppressed precipitation leading up to the extreme heat event on 18 November in the city of Rio de Janeiro. Geopotential height anomaly contour levels are at 100 m, with positive (negative) anomalies in solid (dashed) contours. Across all subplots, shading indicates November 2023 mean SST anomalies.
3.2 Historical and future changes in extreme heat
Extreme heat events have become more frequent in the city of Rio de Janeiro and the timing of these events has shifted earlier in the calendar year. There has been a significant increase in the number of days above 30 °C each year over the past 44 years throughout almost all of South America (Fig. 7a). Further, the number of 90th percentile days locally defined at each grid cell has also increased significantly throughout most of the region (Fig. 7b). In the city of Rio de Janeiro specifically, the number of days per year above 30 °C during the austral spring is increasing at a rate of 0.27 d yr−1 (Fig. 7c). Relative to 1979, the city now experiences almost 12 additional days per year above 30 °C during the spring season alone. Overall, the extreme heat season in Rio de Janeiro is broadening. As measured by the number of days between the first and last heatwave day of the season (a period of 3 or more consecutive days with daily maximum temperatures above 31.4 °C), the extreme heat season has lengthened from 156 d in the 1979–1980 season to 176 d in the 2022–2023 season (Fig. 8). The broadening of the heat season is due primarily to more early season heatwave days, while the end date of the heat season has not changed significantly.
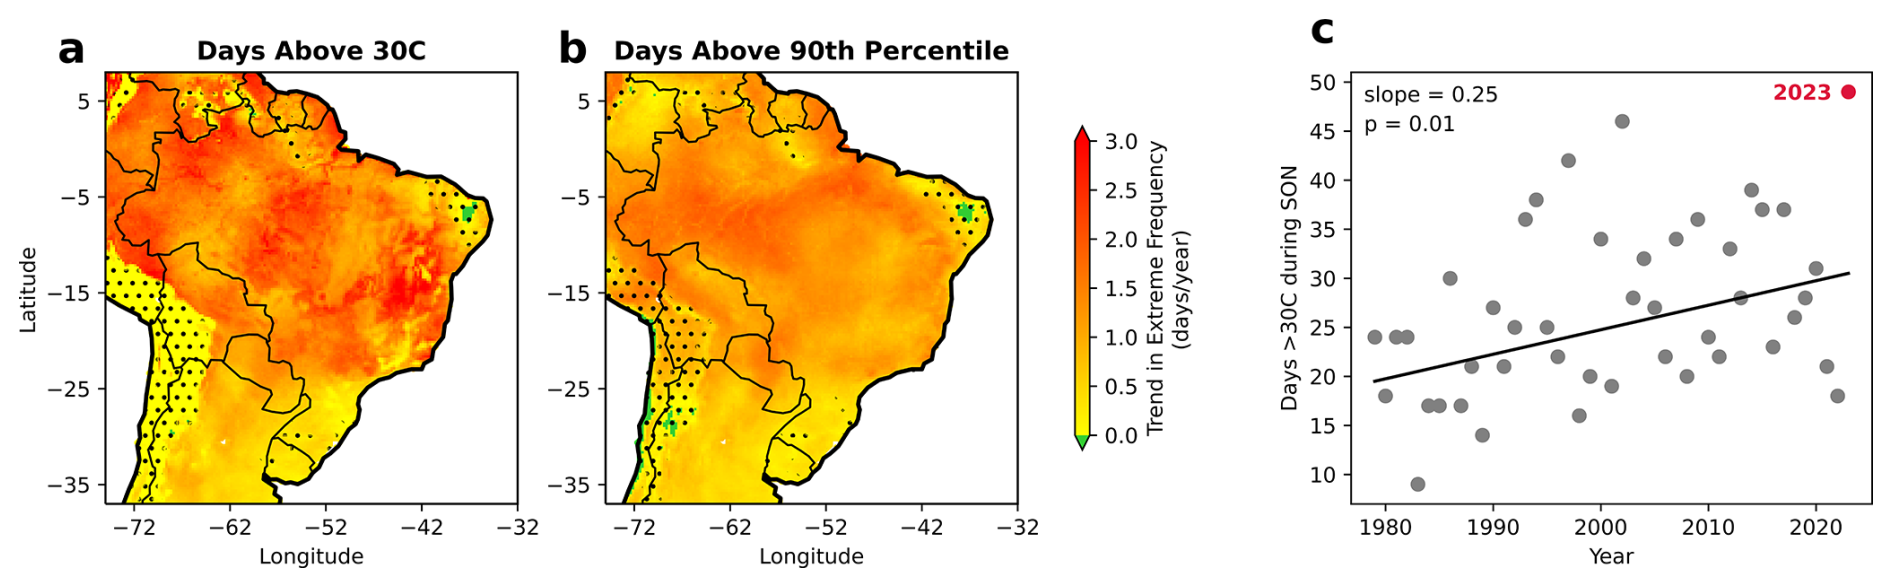
Figure 7Historical trend from 1979–2023 in the number of days per year above (a) 30 °C and (b) locally defined 90th percentile. Stippling shows areas which are not significant at a p = 0.05 level assessed using a Wald Test. (c) Trend in number of days per year above 30 °C taking place in the SON season in ERA5 for the grid cell which includes the Galeão International Airport weather station.
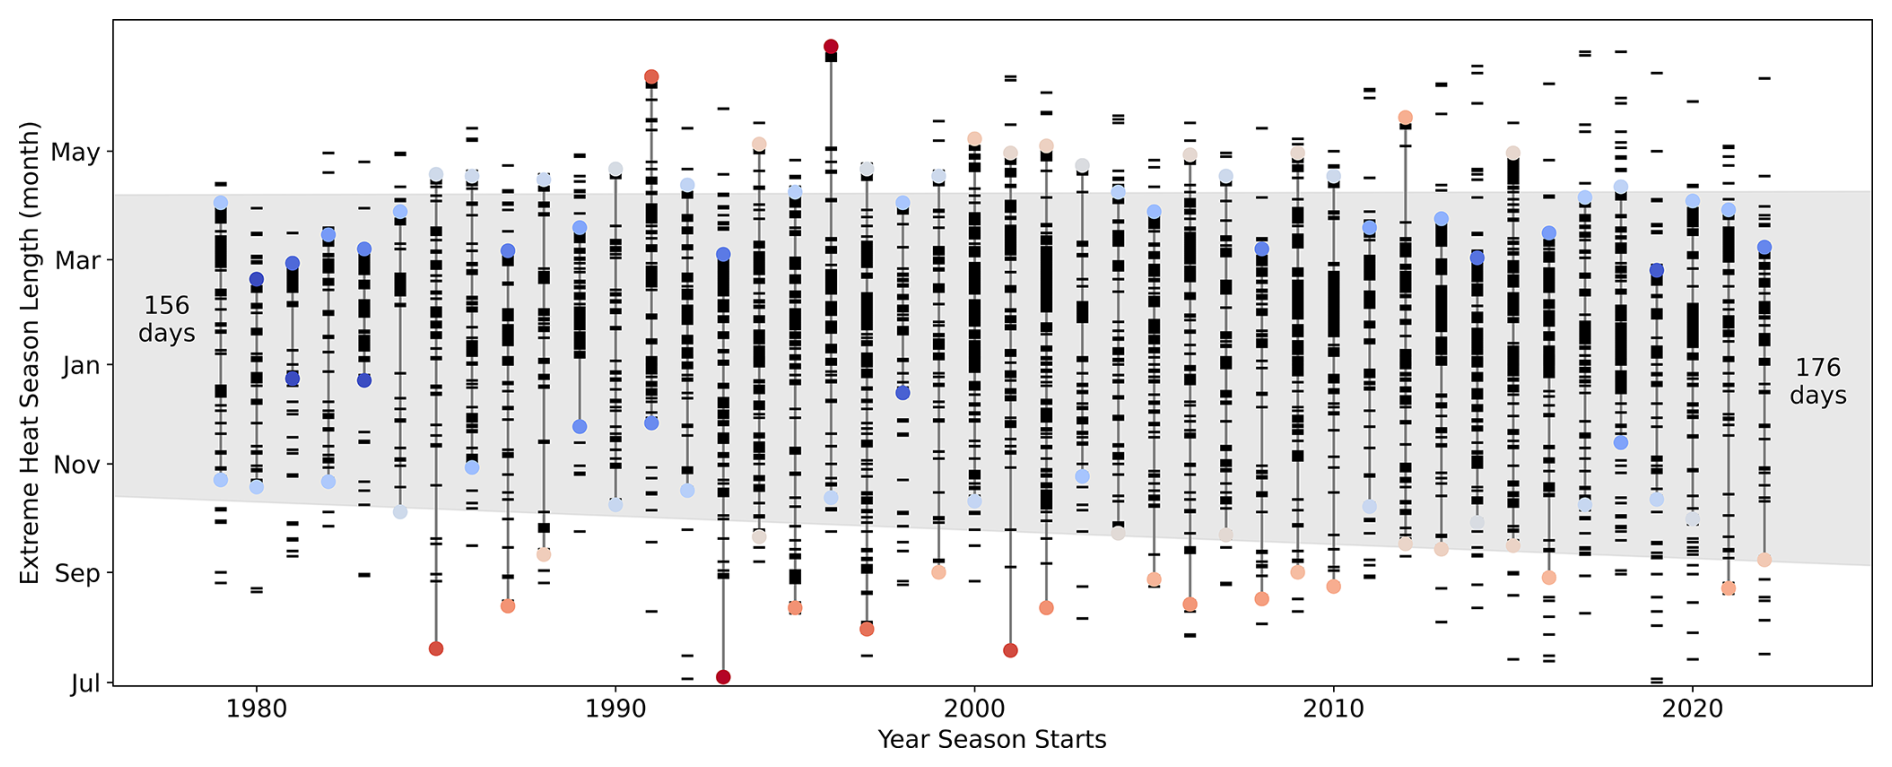
Figure 8Shifting timing of the city of Rio de Janeiro's extreme heat season. Horizontal axis indicates the year in which winter begins (“January” marking denotes the start of the following calendar year). Colored markers indicate the first and last days of the extreme heat season each year. Marker color indicates whether the start/end date is lengthening (red) or shortening (blue) the heat season compared to historical mean start/end dates. Dashes indicate individual additional days with daily maximum temperatures surpassing 31.4 °C (no persistence required). Grey shading indicates area between trend lines in the shifting seasonality.
The distribution of maximum spring temperatures in the city of Rio de Janeiro has shifted higher over the last four decades and this pattern is projected to continue in the future. In order to evaluate whether the observed historical increase in extreme heat frequency identified in Figs. 7 and 8 may continue in the future, we fit annual maximum spring temperatures from historical ERA5 reanalysis data and future projections from bias-corrected NEXGDDP data (Thrasher et al., 2022) to a GEV distribution. When comparing early and late historical periods from 1979–1988 and 2014–2023, respectively, the location parameter of the two GEV distributions has increased by 1.7 °C (Fig. 9). The distribution of maximum austral spring temperatures in the city of Rio de Janeiro is also projected to continue shifting to higher values in the future, but the magnitude of this change is strongly dependent upon the future emissions pathway. The temperature distributions associated with mid-century periods (2041–2060) under SSP2-4.5 and SSP5-8.5 future scenarios are similar to that of the last 10 years of observational data, with shifts in the location parameters of 0.1 and 0.9 °C for the two emissions trajectories, respectively. A larger change is projected by the end of the century (2081–2100) under each emissions scenario. However, the end-of-century SSP5-8.5 scenario is distinctly separate from the other distributions, with the distribution location parameter 2.8 °C higher than during the last 10 years of the historical record.
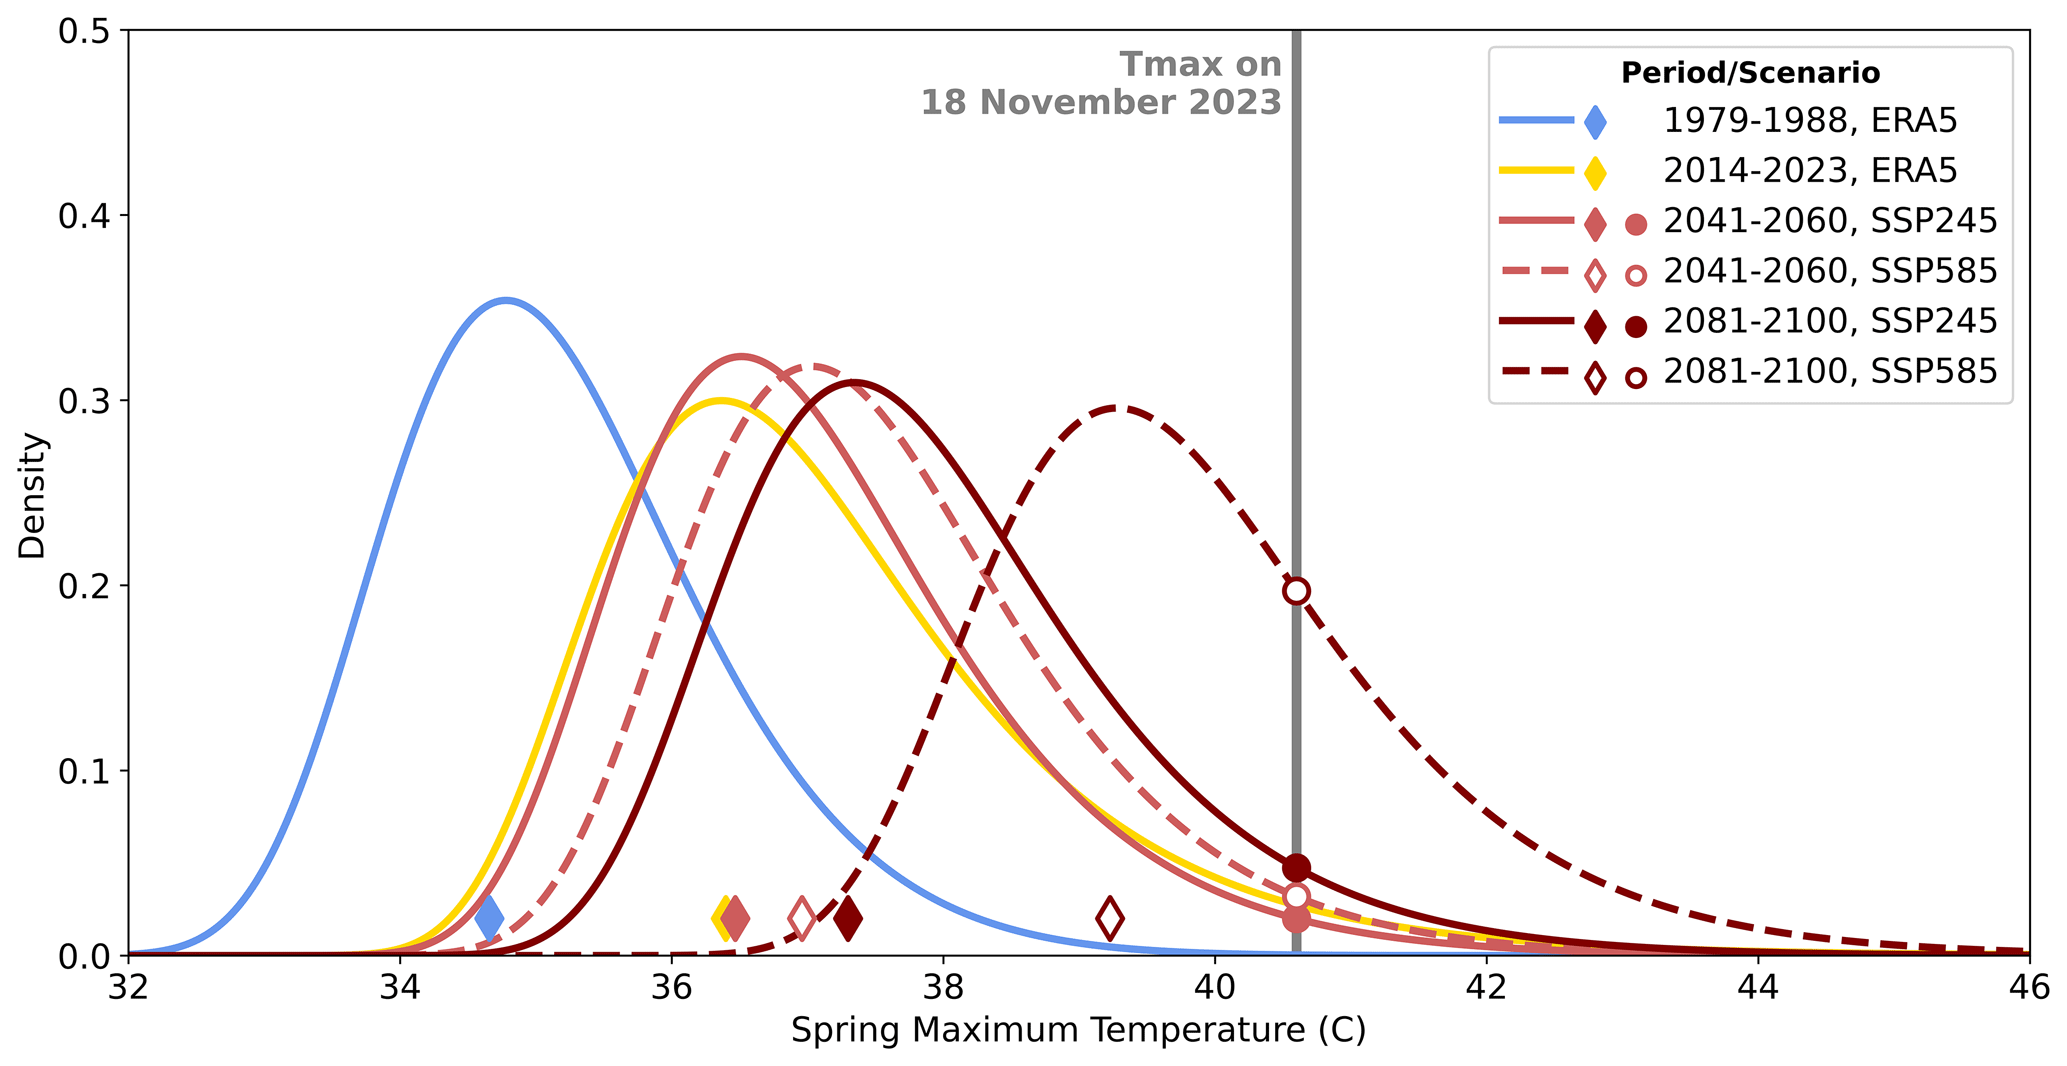
Figure 9Generalized Extreme Value distributions for SON maximum temperatures during early and late historical periods (observed in ERA5), mid-century periods, and end-of-century periods under SSP2-4.5 and SSP5-8.5 (projections from bias-corrected NEXGDDP data). Diamonds indicate the value of the location parameter for each distribution. Vertical grey line shows the magnitude of the extreme temperature event on 18 November 2023, and circles indicate intersections of future distributions with this spring maximum temperature magnitude.
These changes to the distributions strongly influence the probability of an event with the intensity of the maximum spring temperature recorded on 18 November 2023. The probability density function fit to the projected annual maximum spring temperatures under each mid-century period using a GEV distribution yields a return period for an extreme temperature event with the daily maximum temperature at least 40.6 °C in the city of Rio de Janeiro (analogous to the event on 18 November 2023 as measured by ERA5) of 51 years under SSP2-4.5 and 33 years under SSP5-8.5. By the end of the century under either emissions scenario, an event of this magnitude becomes much more likely, with return periods of 19 years or just 4 years under SSP2-4.5 and SSP5-8.5, respectively. These return periods align well with estimates for station-level projections from Collazo et al. (2025), which estimates a return period of 4 to 9 years for heatwaves analogous to that of November 2023 for a future climate with global mean surface temperatures 2 °C warmer than preindustrial levels. Recent literature has suggested that the SSP5-8.5 scenario may not be realistic given our current socioeconomic, political, and physical landscape (Hausfather and Peters, 2020; Burgess et al., 2020; Ritchie and Dowlatabadi, 2017). However, these results indicate that an austral spring heatwave of the magnitude experienced in the city of Rio de Janeiro on 18 November is projected to become much more frequent in the future, even under the more stringent SSP2-4.5 emission pathway. As temperatures rise and the city of Rio de Janeiro maintains its ample moisture sources from the nearby ocean and vegetation, we expect that humid heat extremes will also become more frequent and intense, though at a slower rate than dry bulb temperature extremes as dictated by tropical atmospheric dynamics (Coffel et al., 2018; Zhang et al., 2021; Matthews et al., 2025). We must also note that it is difficult to evaluate whether the models are missing emerging factors that could increase the frequency and intensity of these extreme heat events – such as Amazonian deforestation or declines in sea ice – reducing their ability to capture the possible future spring temperature distributions in Rio de Janeiro.
The November 2023 heatwave in the city of Rio de Janeiro was a record-breaking event characterized by meteorological conditions largely typical of spring extreme temperature events, but exceptional in their magnitudes. Rising temperatures were associated with positive geopotential height anomalies and corresponding atmospheric subsidence which facilitated clear sky conditions and increased sensible heat flux at the surface. These high pressure anomalies centered over the South Atlantic Subtropical High were likely related to the strong 2023–24 El Niño event. The subsidence near Rio de Janeiro associated with the geopotential height anomalies also suppressed precipitation and facilitated evaporation from the land surface, leading to decreased soil moisture and increased specific humidity. Moisture was available from multiple sources to facilitate these humidity increases, as Rio de Janeiro is a coastal city and downwind of both the Amazon and more local vegetation. SSTs off the coast of Rio de Janeiro were also highly elevated in the days before the heatwave peak, reducing the potential for coastal cooling. Finally, the event was terminated on 19 November due to the evaporative cooling, shading, and mixing associated with the onset of precipitation. The combination of changes in circulation, land surface feedbacks, and atmosphere–ocean interactions generated the conditions for an exceptionally intense and persistent extreme heat event in the city of Rio de Janeiro.
The risk of extreme heat in austral spring is increasing significantly in Rio de Janeiro. We find that extreme spring temperature events are becoming more frequent and that the extreme heat season is starting earlier and lasting longer than in previous decades. Further, spring extreme heat of the magnitude on 18 November 2023 may become much more likely by mid- and end-of-century periods. However, the absolute increase in the frequency of similar heatwaves is largely dependent upon our future emissions pathway.
The November 2023 heatwave had devastating impacts, including loss of life. As our climate continues to change and extreme heat in the city of Rio de Janeiro continues to increase in intensity and frequency, we can expect more strain on human health and cascading socioeconomic impacts. This extreme heat event was exceptional not only in its intensity, but also in its persistence. Consecutive extreme heat days have been shown to have nonlinear impacts on human health, in Brazil and in other countries, as they prevent individuals, buildings, and critical electrical equipment from cooling down between heat events (Geirinhas et al., 2020; Baldwin et al., 2019). More broadly, the direct impacts of heatwaves on hospitalizations throughout Brazil have been documented, with the largest effects occurring in long duration events (Zhao et al., 2019). These impacts of heatwaves on mortality are projected to increase, with particular consequences for elderly populations, especially if targeted adaptation measures are not put in place (Diniz et al., 2020). Continuing to improve our understanding of how and when extreme heat occurs is thus essential as our climate continues to change. This is particularly true for locations such as Rio de Janeiro, which historically has not been a hotspot of extreme heat – especially in the shoulder seasons – and thus individuals may not be well acclimated to extreme temperatures then (Périard et al., 2015; Horowitz, 2016). The human health impacts of unusually intense events may be exacerbated by the shifting timing of extreme heat, as record-breaking exceptional heat events are now occurring outside of the traditional extreme heat season when individuals may not be prepared to utilize heat mitigation strategies (De Freitas and Grigorieva, 2015). Because Rio de Janeiro is an area of emerging risk for extreme heat, further research on models' ability to capture the historical drivers and timing of heatwaves in this region and evaluations of how these characteristics might shift in the future should be pursued.
The meteorological conditions surrounding the extreme heat event analyzed here demonstrate the potential for compound hazards throughout Brazil. The identified circulation pattern that establishes the atmospheric blocking associated with heatwaves in Rio de Janeiro is also likely linked to heavy precipitation events in South Brazil. Such an extreme precipitation event occurred in May 2024 in the center-north of Rio Grande do Sul, including the metropolitan area of Porto Alegre, displacing hundreds of thousands and killing at least 155 people (Rogero, 2024). The temporal compounding of these extreme temperature and flooding events within Brazil has the potential to strain the country's disaster management systems more than events occurring in isolation. Furthermore, the exceptional spatial area within Brazil that experienced anomalous heat in the November 2023 event, relative to 99th percentile heat events in the city of Rio de Janeiro, underscores the potential for spatially compounding heat that could lead to outsized impacts. Exploring how unprecedented global surface ocean and surface temperatures, along with regional features like the broader heat and drought across much of Brazil, may contribute to extreme heat in the city of Rio de Janeiro will be an important component to improving our understanding of these compound events' drivers, prediction capacity, and potential to change in the future.
The evolving meteorological conditions associated with this heatwave were strongly impacted by the lack of precipitation in the first 2 weeks of November. This is particularly unexpected due to the fact that the active phase of the South American Monsoon System typically begins in late October or early November in this region (Marengo et al., 2012; Liebmann and Mechoso, 2011; Raia and Cavalcanti, 2008), which is linked to an increase in convective activity in tropical South America in the warm season (Jones and Carvalho, 2013). Observational and modeling studies suggest that the South American Monsoon System dry season is lengthening (Arias et al., 2015; Fu et al., 2013) and that the onset of the active phase is delaying (Gomes et al., 2022; Pascale et al., 2019). These trends are projected to continue to some degree in the future with further climate change, particularly in light of ongoing deforestation which contributes to regional drying trends in the Amazon and other areas of Brazil (Boisier et al., 2015; Swann et al., 2015). Given Rio de Janeiro is a city with abundant access to moisture due to its proximity to the coast and vegetation, the increasingly constrained active monsoon phase could lead to increased frequency and intensity of extreme humid heat in the spring season (Ivanovich et al., 2024). These changes could be responsible for the evident asymmetrical historical increase in heat season length during the spring versus fall as demonstrated here, and extensions of this work should be devoted to an exploration of these potential relationships.
This work highlights the challenge of analyzing the drivers of weather extremes in such a climatically diverse city as Rio de Janeiro and emphasizes the need for future research to explore high resolution comparisons of mechanisms controlling the city's microclimates. Differences between conditions recorded at individual weather stations within the city's boundaries demonstrate the degree to which the dynamics of events in each neighborhood depend on the station's location relative to the coast versus interior (Raymond and Mankin 2019), elevation (Raymond et al., 2022; Pepin et al., 2015), and degree of urbanization (Krüger et al., 2024; Chakraborty et al., 2022; Tan et al., 2010). Higher temporal resolution analysis would also better capture sub-daily processes such as sea breeze and their effect on extreme heat throughout the city. Further, many of these mechanisms influencing the intracity variability of heat stress exposure only focus on the effect of differences in dry bulb temperature. Factoring in the spatial variation in humidity, solar insolation, and windspeed complicate understanding, but are essential for capturing humans' exposure to heat stress conditions. These intracity differences also meaningfully impact compound events with non-heat environmental hazards, such as floods, landslides, droughts, and air pollution, as well as how exposure to these hazards intersects with areas of social vulnerability. Future work should be devoted to investigating the different magnitudes of extreme heat and controlling mechanisms throughout Rio de Janeiro in order to inform targeted extreme heat adaptation plans for individual neighborhoods within the city.
All code used for the derivations, calculations, and data visualization are publicly available via a GitHub repository the following link: https://github.com/ccivanovich/November2023_Rio_Heatwave/ (last access: 5 December 2025).
The publicly available datasets used in this analysis are accessible via the following websites: HadISD, https://doi.org/10.5194/gi-5-473-2016; ERA5, https://doi.org/10.24381/cds.adbb2d47 (Hersbach et al., 2023) and https://doi.org/10.24381/cds.bd0915c6 (last access: 1 August 2025); OISST, https://doi.org/10.1175/JCLI-D-20-0166.1; and NEXGDDP, https://doi.org/10.1038/s41597-022-01393-4. Station data from the Rio Alert System are uploaded and accessible via a Zenodo repository at the following link: https://doi.org/10.5281/zenodo.17882802 (Sistema Alerta Rio da Prefeitura do Rio de Janeiro, 2025).
The supplement related to this article is available online at https://doi.org/10.5194/wcd-6-1857-2025-supplement.
SJC conceived of the initial project concept. All co-authors contributed to study design, and CI performed the analysis. CI wrote the initial manuscript draft with the feedback and interpretation of all co-authors. All co-authors read and edited the manuscript.
The contact author has declared that none of the authors has any competing interests.
Publisher’s note: Copernicus Publications remains neutral with regard to jurisdictional claims made in the text, published maps, institutional affiliations, or any other geographical representation in this paper. While Copernicus Publications makes every effort to include appropriate place names, the final responsibility lies with the authors. Views expressed in the text are those of the authors and do not necessarily reflect the views of the publisher.
This paper was greatly improved by conversations with Samuel Bartusek and comments from two anonymous reviewers.
This work was partially supported and funded by Columbia Global at Columbia University, “Simulation of Extreme Weather Events in Brazilian Megacities”, a Climate Hub | Rio Project. Climate Hub | Rio is a knowledge, research, and innovation hub that brings together experts from Brazil, Columbia University, and around the world to advance climate-related knowledge and action in Rio and Brazil. Direct funding for Catherine C. Ivanovich and Radley M. Horton was provided by National Oceanic and Atmospheric Administration's Regional Integrated Sciences and Assessments program, Grant NA15OAR4310147. Adam H. Sobel acknowledges support from NSF Grant AGS-1933523. Suzana J. Camargo is partially supported by the NOAA grant NA23OAR43201600.
This paper was edited by Roberto Rondanelli and reviewed by two anonymous referees.
Alvares, C. A., Stape, J. L., Sentelhas, P. C., and De Moraes Gonçalves, J. L.: Modeling monthly mean air temperature for Brazil, Theor. Appl. Climatol., 113, 407–427, https://doi.org/10.1007/s00704-012-0796-6, 2013.
Arias, P. A., Fu, R., Vera, C., and Rojas, M.: A correlated shortening of the North and South American monsoon seasons in the past few decades, Clim. Dynam., 45, 3183–3203, https://doi.org/10.1007/s00382-015-2533-1, 2015
Baldwin, J. W., Dessy, J. B., Vecchi, G. A., and Oppenheimer, M.: Temporally Compound Heat Wave Events and Global Warming: An Emerging Hazard, Earth's Future, 7, 411–427, https://doi.org/10.1029/2018EF000989, 2019.
Becker, E., L'Heureux, M., Hu, Z.-Z., and Kumar, A.: ENSO and the tropical Pacific, in: State of the Climate in 2023, B. Am. Meteorol. Soc., 105, S221–S224, https://doi.org/10.1175/BAMS-D-24-0098.1, 2024.
Bitencourt, D. P., Fuentes, M. V., Franke, A. E., Silveira, R. B., and Alves, M. P. A.: The climatology of cold and heat waves in Brazil from 1961 to 2016, Int. J. Climatol., 40, 2464–2478, https://doi.org/10.1002/joc.6345, 2020.
Bitencourt, D. P., Muniz Alves, L., Shibuya, E. K., De Ângelo Da Cunha, I., and Estevam De Souza, J. P.: Climate change impacts on heat stress in Brazil – Past, present, and future implications for occupational heat exposure, Int. J. Climatol., 41, S1, https://doi.org/10.1002/joc.6877, 2021.
Boisier, J. P., Ciais, P., Ducharne, A., and Guimberteau, M.: Projected strengthening of Amazonian dry season by constrained climate model simulations, Nat. Clim. Change, 5, 656–660, https://doi.org/10.1038/nclimate2658, 2015.
Burgess, M. G., Ritchie, J., Shapland, J., and Pielke, R.: IPCC baseline scenarios have over-projected CO2 emissions and economic growth, Environ. Res. Lett., 16, 014016, https://doi.org/10.1088/1748-9326/abcdd2, 2020.
Cai, W., McPhaden, M. J., Grimm, A. M., Rodrigues, R. R., Taschetto, A. S., Garreaud, R. D., Dewitte, B., Poveda, G., Ham, Y., Santoso, A., Ng, B., Anderson, W., Wang, G., Geng, T., Jo, H., Marengo, J. A., Alves, L. M., Osman, M., Li, S., Wu, L., Karamperidou, C., Takahashi, K., and Vera, C.: Climate impacts of the El Niño–Southern Oscillation on South America, Nature Reviews Earth & Environment, 1, 215–231, https://doi.org/10.1038/s43017-020-0040-3, 2020.
Castelao, R. M. and Barth, J. A.: Upwelling around Cabo Frio, Brazil: The importance of wind stress curl, Geophys. Res. Lett., 33, 2005GL025182, https://doi.org/10.1029/2005GL025182, 2006.
Cattiaux, J., Ribes, A., and Cariou, E.: How Extreme Were Daily Global Temperatures in 2023 and Early 2024?, Geophys. Res. Lett., 51, e2024GL110531, https://doi.org/10.1029/2024GL110531, 2024.
Chakraborty, T., Venter, Z. S., Qian, Y., and Lee, X.: Lower Urban Humidity Moderates Outdoor Heat Stress, AGU Advances, 3, e2022AV000729, https://doi.org/10.1029/2022AV000729, 2022.
Cheng, Y.-T., Lung, S.-C. C., and Hwang, J.-S.: New approach to identifying proper thresholds for a heat warning system using health risk increments, Environ. Res., 170, 282–292, https://doi.org/10.1016/j.envres.2018.12.059, 2019.
Cirino, P. H., Féres, J. G., Braga, M. J., and Reis, E.: Assessing the Impacts of ENSO-related Weather Effects on the Brazilian Agriculture, Proc. Econ. Financ., 24, 146–155, https://doi.org/10.1016/S2212-5671(15)00635-8, 2015.
Coelho, C. A. S., De Souza, D. C., Kubota, P. Y., Cavalcanti, I. F. A., Baker, J. C. A., Figueroa, S. N., Firpo, M. A. F., Guimarães, B. S., Costa, S. M. S., Gonçalves, L. J. M., Bonatti, J. P., Sampaio, G., Klingaman, N. P., Chevuturi, A., and Andrews, M. B.: Assessing the representation of South American monsoon features in Brazil and U.K. climate model simulations, Climate Resilience and Sustainability, 1, e27, https://doi.org/10.1002/cli2.27, 2022.
Coffel, E. D., Horton, R. M., and de Sherbinin, A.: Temperature and humidity based projections of a rapid rise in global heat stress exposure during the 21st century, Environ. Res. Lett., 13, 014001, https://doi.org/10.1088/1748-9326/aaa00e, 2018.
Collazo, S., Barriopedro, D., García-Herrera, R., and Beguería, S.: Extreme heat and mortality in the state of Rio de Janeiro in November 2023: attribution to climate change and ENSO, Nat. Hazards Earth Syst. Sci., 25, 3221–3238, https://doi.org/10.5194/nhess-25-3221-2025, 2025.
Correio Braziliense: Rio bate recorde de calor do ano neste sábado (18/11) com 42,5 °C, https://www.correiobraziliense. com.br/brasil/2023/11/6657444-rio-bate-recorde-de-calor-do-ano-neste-sabado-18-11-com-425-c.html (last access: 14 May 2024), 18 November 2023.
De Freitas, C. and Grigorieva, E.: Role of Acclimatization in Weather-Related Human Mortality During the Transition Seasons of Autumn and Spring in a Thermally Extreme Mid-Latitude Continental Climate, Int. J. Env. Res. Pub. He., 12, 14974–14987, https://doi.org/10.3390/ijerph121214962, 2015.
Dereczynski, C., Silva, W. L., and Marengo, J.: Detection and Projections of Climate Change in Rio de Janeiro, Brazil, American Journal of Climate Change, 2, 25–33, https://doi.org/10.4236/ajcc.2013.21003, 2013.
Diniz, F. R., Gonçalves, F. L. T., and Sheridan, S.: Heat Wave and Elderly Mortality: Historical Analysis and Future Projection for Metropolitan Region of São Paulo, Brazil, Atmosphere, 11, 933, https://doi.org/10.3390/atmos11090933, 2020.
Dunn, R. J. H., Willett, K. M., Parker, D. E., and Mitchell, L.: Expanding HadISD: quality-controlled, sub-daily station data from 1931, Geosci. Instrum. Method. Data Syst., 5, 473–491, [data set], https://doi.org/10.5194/gi-5-473-2016, 2016.
Espinoza, J.-C., Jimenez, J. C., Marengo, J. A., Schongart, J., Ronchail, J., Lavado-Casimiro, W., and Ribeiro, J. V. M.: The new record of drought and warmth in the Amazon in 2023 related to regional and global climatic features, Scientific Reports, 14, 8107, https://doi.org/10.1038/s41598-024-58782-5, 2024.
Feron, S., Cordero, R. R., Damiani, A., Llanillo, P. J., Jorquera, J., Sepulveda, E., Asencio, V., Laroze, D., Labbe, F., Carrasco, J., and Torres, G.: Observations and Projections of Heat Waves in South America, Scientific Reports, 9, 8173, https://doi.org/10.1038/s41598-019-44614-4, 2019.
Fu, R., Yin, L., Li, W., Arias, P. A., Dickinson, R. E., Huang, L., Chakraborty, S., Fernandes, K., Liebmann, B., Fisher, R., Myneni, R. B.: Increased dry-season length over southern Amazonia in recent decades and its implication for future climate projection, P. Natl. Acad. Sci. USA, 110, 18110–18115, https://doi.org/10.1073/pnas.1302584110, 2013.
Geirinhas, J. L., Russo, A. C., Libonati, R., Miralles, D. G., Sousa, P. M., Wouters, H., and Trigo, R. M.: The influence of soil dry-out on the record-breaking hot 2013/2014 summer in Southeast Brazil, Scientific Reports, 12, 5836, https://doi.org/10.1038/s41598-022-09515-z, 2022.
Geirinhas, J. L., Trigo, R. M., Libonati, R., Coelho, C. A. S., and Palmeira, A. C.: Climatic and synoptic characterization of heat waves in Brazil, Int. J. Climatol., 38, 1760–1776, https://doi.org/10.1002/joc.5294, 2018.
Geirinhas, J. L., Trigo, R. M., Libonati, R., Castro, L. C. O., Sousa, P. M., Coelho, C. A. S., Peres, L. F., and Magalhães, M. A. F. M.: Characterizing the atmospheric conditions during the 2010 heatwave in Rio de Janeiro marked by excessive mortality rates, Sci. Total Environ., 650, 796–808, https://doi.org/10.1016/j.scitotenv.2018.09.060, 2019.
Geirinhas, J. L., Russo, A., Libonati, R., Trigo, R. M., Castro, L. C. O., Peres, L. F., Magalhães, M. A. F. M, and Nunes, B.: Heat-related mortality at the beginning of the twenty-first century in Rio de Janeiro, Brazil, Int. J. Biometeorol., 64, 1319–1332, https://doi.org/10.1007/s00484-020-01908-x, 2020.
Geirinhas, J. L., Russo, A., Libonati, R., Sousa, P. M., Miralles, D. G., and Trigo, R. M.: Recent increasing frequency of compound summer drought and heatwaves in Southeast Brazil, Environ. Res. Lett., 16, 034036, https://doi.org/10.1088/1748-9326/abe0eb, 2021.
Gomes, G. D., Nunes, A. M. B., Libonati, R., and Ambrizzi, T.: Projections of subcontinental changes in seasonal precipitation over the two major river basins in South America under an extreme climate scenario, Clim. Dynam., 58, 1147–1169, https://doi.org/10.1007/s00382-021-05955-x, 2022.
Hausfather, Z. and Peters, G. P.: Emissions – the “business as usual” story is misleading, Nature, 577, 618–620, https://doi.org/10.1038/d41586-020-00177-3, 2020.
He, Z., Dai, A., and Vuille, M.: The Joint Impacts of Atlantic and Pacific Multidecadal Variability on South American Precipitation and Temperature, J. Climate, 34, 7959–7981, https://doi.org/10.1175/JCLI-D-21-0081.1, 2021.
Hersbach, H., Bell, B., Berrisford, P., Hirahara, S., Horányi, A., Muñoz-Sabater, J., Nicolas, J., Peubey, C., Radu, R., Schepers, D., Simmons, A., Soci, C., Abdalla, S., Abellan, X., Balsamo, G., Bechtold, P., Biavati, G., Bidlot, J., Bonavita, M., De Chiara, G., Dahlgren, P., Dee, D., Diamantakis, M., Dragani, R., Flemming, J., Forbes, R., Fuentes, M., Geer, A., Haimberger, L., Healy, S., Hogan, R. J., Hólm, E., Janisková, M., Keeley, S., Laloyaux, P., Lopez, P., Lupu, C., Radnoti, G., de Rosnay, P., Rozum, I., Vamborg, F., Villaume, S., and Thépaut, J.-N.: The ERA5 global reanalysis, Q. J. Roy. Meteor. Soc. [data set], 146, 1999–2049, https://doi.org/10.1002/qj.3803, 2020.
Hersbach, H., Bell, B., Berrisford, P., Biavati, G., Horányi, A., Muñoz Sabater, J., Nicolas, J., Peubey, C., Radu, R., Rozum, I., Schepers, D., Simmons, A., Soci, C., Dee, D., and Thépaut, J.-N.: ERA5 hourly data on single levels from 1940 to present. Copernicus Climate Change Service (C3S) Climate Data Store (CDS) [data set], https://doi.org/10.24381/cds.adbb2d47, 2023.
Horowitz, M.: Epigenetics and cytoprotection with heat acclimation, J. Appl. Physiol., 120, 702–710, https://doi.org/10.1152/japplphysiol.00552.2015, 2016.
Huang, B., Liu, C., Banzon, V., Freeman, E., Graham, G., Hankins, B., Smith, B., and Zhang, H.: Improvements of the Daily Optimum Interpolation Sea Surface Temperature (DOISST) Version 2.1, J. Climate [data set], 34, 2923–2939, https://doi.org/10.1175/JCLI-D-20-0166.1, 2021.
Hughs, E. and Jeantet, D.: It's not yet summer in Brazil, but a dangerous heat wave is sweeping the country, https://apnews.com/article/brazil-heat-wave-climate- environment-wildfires-1e4714fb2c6566120c13cf4e2b657f7d (last access: 14 May 2024), 15 November 2023.
Ivanovich, C. C., Horton, R. M., Sobel, A. H., and Singh, D.: Subseasonal Variability of Humid Heat During the South Asian Summer Monsoon, Geophys. Res. Lett., 51, e2023GL107382, https://doi.org/10.1029/2023GL107382, 2024.
Jones, C. and Carvalho, L. M. V.: Climate change in the South American Monsoon System: Present climate and CMIP5 projections, J. Climate, 26, 6660–6678, https://doi.org/10.1175/JCLI-D-12-00412.1, 2013.
Jornal Nacional: Taylor Swift: segundo show é adiado, por causa do calor extremo no Rio, https://g1.globo.com/jornal- nacional/noticia/2023/11/18/taylor-swift-show-e-adiado-apos-morte-de-fa.ghtml (last access: 16 April, 2024), 18 November 2023.
Krüger, E., Gobo, J. P. A., Tejas, G. T., da Silva de Souza, R. M., Neto, J. B. F., Pereira, G., Mendes, D., and Di Napoli, C.: The impact of urbanization on heat stress in Brazil: A multi-city study, Urban Climate, 53, 101827, https://doi.org/10.1016/j.uclim.2024.101827, 2024.
Latinović, D., Chou, S. C., Rančić, M., Medeiros, G. S., and Lyra, A. D. A.: Seasonal climate and the onset of the rainy season in western-central Brazil simulated by Global Eta Framework model, Int. J. Climatol., 39, 1429–1445, https://doi.org/10.1002/joc.5892, 2019.
Libonati, R., Geirinhas, J. L., Silva, P. S., Monteiro Dos Santos, D., Rodrigues, J. A., Russo, A., Peres, L. F., Narcizo, L., Gomes, M. E. R., Rodrigues, A. P., DaCamara, C. C., Pereira, J. M. C., and Trigo, R. M.: Drought–heatwave nexus in Brazil and related impacts on health and fires: A comprehensive review, Annals of the New York Academy of Sciences, 1517, 44–62, https://doi.org/10.1111/nyas.14887, 2022.
Liebmann, B. and Mechoso, C. R.: The South American Monsoon System, in: World Scientific Series on Asia-Pacific Weather and Climate, 2nd edn., edited by: Chang, C.-P., Ding, Y., Lau, N.-C., Johnson, R. H., Wang, B., and Yasunari, T., World Scientific, 5, 137–157, https://doi.org/10.1142/9789814343411_0009, 2011.
Lyra, G. B., Correia, T. P., de Oliveira-Júnior, J. F., and Zeri, M.: Evaluation of methods of spatial interpolation for monthly rainfall data over the state of Rio de Janeiro, Brazil, Theor. Appl. Climatol., 134, 955–965, https://doi.org/10.1007/s00704-017-2322-3, 2018.
Marengo, J. A., Costa, M. C., Cunha, A. P., Espinoza, J.-C., Jimenez, J. C., Libonati, R., Miranda, V., Trigo, I. F., Sierra, J. P., Geirinhas, J. L., Ramos, A. M., Skansi, M., Molina-Carpio, J., and Salinas, R.: Climatological patterns of heatwaves during winter and spring 2023 and trends for the period 1979–2023 in central South America, Frontiers in Climate, 7, 1529082, https://doi.org/10.3389/fclim.2025.1529082, 2025.
Marengo, J. A., Liebmann, B., Grimm, A. M., Misra, V., Silva Dias, P. L., Cavalcanti, I. F. A.,Carvalho, L. M. V., Berbery, E. H., Ambrizzi, T., Saulo, A. C., Nogues-Paegle, J., Zipser, E., Seth, A., and Alves, L. M.: Recent developments on the South American monsoon system, Int. J. Climatol., 32, 1–21, https://doi.org/10.1002/joc.2254, 2012.
Marengo, J. A., Soares, W. R., Saulo, C., and Nicolini, M.: Climatology of the Low-Level Jet East of the Andes as Derived from the NCEP–NCAR Reanalyses: Characteristics and Temporal Variability, J. Climate, 17, 2261–2280, https://doi.org/10.1175/1520-0442(2004)017<2261:COTLJE>2.0.CO;2, 2004.
Matthews, T., Raymond, C., Foster, J., Baldwin, J. W., Ivanovich, C., Kong, Q., Kinney, P., and Horton, R.: Mortality impacts of the most extreme heat events, Nature Reviews Earth and Environment, 1–18, https://doi.org/10.1038/s43017-024-00635-w, 2025.
Montini, T. L., Jones, C., and Carvalho, L. M. V.: The South American Low-Level Jet: A New Climatology, Variability, and Changes, J. Geophys. Res.-Atmos., 124, 1200–1218, https://doi.org/10.1029/2018JD029634, 2019.
Mora, C., Dousset, B., Caldwell, I. R., Powell, F. E., Geronimo, R. C., Bielecki, C. R., Counsell, C. W. W., Dietrich, B. S., Johnston, E. T., Louis, L. V., Lucas, M. P., McKenzie, M. M., Shea, A. G., Tseng, H., Giambelluca, T. W., Leon, L. R., Hawkins, E., and Trauernicht, C.: Global risk of deadly heat, Nat. Clim. Change, 7, 501–506, https://doi.org/10.1038/nclimate3322, 2017.
Nahlik, M. J., Chester, M. V., Pincetl, S. S., Eisenman, D., Sivaraman, D., and English, P.: Building Thermal Performance, Extreme Heat, and Climate Change, J. Infrastruct. Syst., 23, 04016043, https://doi.org/10.1061/(asce)is.1943-555x.0000349, 2017.
Nguyen, B.: Brazilian Taylor Swift Fan Died of Heat Exhaustion At Rio Concert, https://www.forbes.com/sites/ britneynguyen/2023/12/27/brazilian-taylor-swift-fan-died-of-heat-exhaustion-at-rio-concert/ (last access: 16 April 2024), 27 December 2023.
Palma, E. D. and Matano, R. P.: Disentangling the upwelling mechanisms of the South Brazil Bight, Cont. Shelf Res., 29, 1525–1534, https://doi.org/10.1016/j.csr.2009.04.002, 2009.
Pampuch, L. A., Bueno, P. G., Reboita, M. S., Tomaziello, A. C. N., Nunes, A. M. P., Cardoso, A. A., Coelho, C. A. S., Carpenedo, C. B., das Chagas Vasconcelos Jr, F., Gomes, H. B., Pinheiro, H. R., Braga, H. A., Borges, I. V. G., de Souza Custodio, M., da Silva, M. L., Llopart, M., da Rocha, R. P., Ambrizzi, T., and da Silva, G. A. M.: Brazil climate highlights 2023, Annals of the New York Academy of Sciences, 1549, 120–138, https://doi.org/10.1111/nyas.15394, 2025.
Pascale, S., Carvalho, L. M. V., Adams, D. K., Castro, C. L., and Cavalcanti, I. F. A.: Current and Future Variations of the Monsoons of the Americas in a Warming Climate, Current Climate Change Reports, 5, 125–144, https://doi.org/10.1007/s40641-019-00135-w, 2019.
Pepin, N., Bradley, R. S., Diaz, H. F., Baraer, M., Caceres, E. B., Forsythe, N., Fowler, H., Greenwood, G., Hashmi, M. Z., Liu, X. D., Miller, J. R., Ning, L., Ohmura, A., Palazzi, E., Rangwala, I., Schöner, W., Severskiy, I., Shahgedanova, M., Wang, M. B., Williamson, S., N., and Yang, D. Q.: Elevation-dependent warming in mountain regions of the world, Nat. Clim. Change, 5, 424–430, https://doi.org/10.1038/nclimate2563, 2015.
Périard, J. D., Racinais, S., and Sawka, M. N.: Adaptations and mechanisms of human heat acclimation: Applications for competitive athletes and sports, Scand. J. Med. Sci. Spor., 25, 20–38, https://doi.org/10.1111/sms.12408, 2015.
Powis, C. M., Byrne, D., Zobel, Z., Gassert, K. N., Lute, A. C., and Schwalm, C. R.: Observational and model evidence together support wide-spread exposure to noncompensable heat under continued global warming, Science Advances, 9, 36, eadg9297, https://doi.org/10.1126/sciadv.adg9297, 2023.
Perkins-Kirkpatrick, S., Barriopedro, D., Jha, R., Wang, L., Mondal, A., Libonati, R., and Kornhuber, K.: Extreme terrestrial heat in 2023, Nature Reviews Earth & Environment, 5, 244–246, https://doi.org/10.1038/s43017-024-00536-y, 2024.
Perkins, S. E., Pitman, A. J., Holbrook, N. J., and McAneney, J.: Evaluation of the AR4 Climate Models' Simulated Daily Maximum Temperature, Minimum Temperature, and Precipitation over Australia Using Probability Density Functions, J. Climate, 20, 17, 4356–4376, https://doi.org/10.1175/JCLI4253.1, 2007.
Raia, A. and Cavalcanti, I. F. A.: The Life Cycle of the South American Monsoon System, J. Climate, 21, 6227–6246, https://doi.org/10.1175/2008JCLI2249.1, 2008.
Raymond, C. and Mankin, J. S.: Assessing present and future coastal moderation of extreme heat in the Eastern United States, Environ. Res. Lett., 14, 114002, https://doi.org/10.1088/1748-9326/ab495d, 2019.
Raymond, C., Matthews, T., and Horton, R. M.: The emergence of heat and humidity too severe for human tolerance, Science Advances, 6, eaaw1838, https://doi.org/10.1126/sciadv.aaw1838, 2020.
Raymond, C., Waliser, D., Guan, B., Lee, H., Loikith, P., Massoud, E., Sengupta, A., Singh, D., and Wootten, A.: Regional and Elevational Patterns of Extreme Heat Stress Change in the US, Environ. Res. Lett., 17, 064046, https://doi.org/10.1088/1748-9326/ac7343, 2022.
Regoto, P., Dereczynski, C., Chou, S. C., and Bazzanela, A. C.: Observed changes in air temperature and precipitation extremes over Brazil, Int. J. Climatol., 41, 5125–5142, https://doi.org/10.1002/joc.7119, 2021.
Rehbein, A. and Ambrizzi, T.: ENSO teleconnections pathways in South America, Clim. Dynam., 61, 1277–1292, https://doi.org/10.1007/s00382-022-06624-3, 2023.
Ritchie, J. and Dowlatabadi, H.: Why do climate change scenarios return to coal?, Energy, 140, 1276–1291, https://doi.org/10.1016/j.energy.2017.08.083, 2017.
Rogero, T.: Brazil counts cost of worst-ever floods with little hope of waters receding soon, The Guardian, https://www.theguardian.com/world/article/2024/may/19/brazil-floods-toll (last access: 5 December 2025), 19 May 2024.
Rogers, C. D. W., Ting, M., Li, C., Kornhuber, K., Coffel, E. D., Horton, R. M., Raymond, C., and Singh, D.: Recent Increases in Exposure to Extreme Humid-Heat Events Disproportionately Affect Populated Regions, Geophys. Res. Lett., 48, e2021GL094183, https://doi.org/10.1029/2021GL094183, 2021.
Seth, A., Fernandes, K., and Camargo, S. J.: Two summers of São Paulo drought: Origins in the western tropical Pacific, Geophysical Research Letters, 42, 24, https://doi.org/10.1002/2015GL066314, 2015.
Shimizu, M. H. and Ambrizzi, T.: MJO influence on ENSO effects in precipitation and temperature over South America, Theor. Appl. Climatol., 124, 291–301, https://doi.org/10.1007/s00704-015-1421-2, 2016.
Sistema Alerta Rio da Prefeitura do Rio de Janeiro: Meteorological Data [data set], https://github.com/ccivanovich/November2023_Rio_Heatwave/ (last access: 1 June 2024), 2024.
Sistema Alerta Rio da Prefeitura do Rio de Janeiro: Rio Alert System Station Data – November 2023, Zenodo [data set], https://doi.org/10.5281/zenodo.17882803, 2025.
Sistema IBGE de Recuperação Automática – SIDRA [data set], https://sidra.ibge.gov.br/pesquisa/censo-demografico/demografico-2022/primeiros-resultados-populacao-e-domicilios (last access: 21 April 2024), 2022.
Stefanello, M., Ewerling da Rosa, C., Bresciani, C., Cordero Simões dos Reis, N., Stefanello Facco, D., Teleginski Ferraz, S. E., Boiaski, N. T., Herdies, D. L., Acevedo, O., Tirabassi, T., Roberti, D. R., and Degrazia, G. A.: Spatial–temporal analysis of a summer heat wave associated with downslope flows in southern Brazil: implications in the atmospheric boundary layer, Atmosphere, 14, 64, https://doi.org/10.3390/atmos14010064, 2022.
Swann, A. L. S., Longo, M., Knox, R. G., Lee, E., and Moorcroft, P. R.: Future deforestation in the Amazon and consequences for South American climate, Agr. Forest Meteorol., 214–215, 12–24, https://doi.org/10.1016/j.agrformet.2015.07.006, 2015.
Tan, J., Zheng, Y., Tang, X., Guo, C., Li, L., Song, G., Zhen, X., Yuan, D., Kalkstein, A. J., Li, F., and Chen, H.: The urban heat island and its impact on heat waves and human health in Shanghai, Int. J. Biometeorol., 54, 75–84, https://doi.org/10.1007/s00484-009-0256-x, 2010.
Thrasher, B., Wang, W., Michaelis, A., Melton, F., Lee, T., and Nemani, R.: NASA Global Daily Downscaled Projections, CMIP6, Scientific Data [data set], 9, 262, https://doi.org/10.1038/s41597-022-01393-4, 2022.
United Nations Department of Economic and Social Affairs Population Division: World Urbanization Prospects – The 2018 Revision, https://population.un.org/wup/assets/WUP2018-Report.pdf (last access: 1 May 2025), 2022.
US EPA: Climate Change Indicators: Heat Waves [Reports and Assessments], https://archive.ph/rZZ4z (last access: 23 April 2024), 4 February 2021.
Van Oldenborgh, G. J., Wehner, M. F., Vautard, R., Otto, F. E. L., Seneviratne, S. I., Stott, P. A., Hegerl, G. C., Philip, S. Y., and Kew, S. F.: Attributing and Projecting Heatwaves Is Hard: We Can Do Better, Earth’s Future, 10, 6, e2021EF00227, https://doi.org/10.1029/2021EF002271, 2022.
Vecellio, D. J., Wolf, S. T., Cottle, R. M., and Kenney, W. L.: Evaluating the 35 °C wet-bulb temperature adaptability threshold for young, healthy subjects (PSU HEAT Project), J. Appl. Physiol., 132, 340–345, https://doi.org/10.1152/japplphysiol.00738.2021, 2022.
Vera, C., Baez, J., Douglas, M., Emmanuel, C. B., Marengo, J., Meitin, J.,Nicolini, M., Nogues-Paegle, J., Penalba, O., Salio, P., Saulo, C., Silva Dias, M. A., Silva Dias, P., and Zipser, E.: The South American Low-Level Jet Experiment, B. Am. Meteorol. Soc., 87, 63–78, https://doi.org/10.1175/BAMS-87-1-63, 2006.
Wilby, R. L., Kasei, R., Gough, K. V., Amankwaa, E. F., Abarike, M., Anderson, N. J., Codjoe, S. N. A., Griffiths, P., Kaba, C., Abdullah, K., Kayaga, S., Matthews, T., Mensah, P., Murphy, C., and Yankson, P. W. K.: Monitoring and moderating extreme indoor temperatures in low-income urban communities, Environ. Res. Lett., 16, 024033, https://doi.org/10.1088/1748-9326/abdbf2, 2021.
Zhang, Y., Held, I., and Fueglistaler, S.: Projections of tropical heat stress constrained by atmospheric dynamics, Nature Geoscience, 14(3), 133–137, https://doi.org/10.1038/s41561-021-00695-3, 2021.
Zhao, Q., Li, S., Coelho, M. S. Z. S., Saldiva, P. H. N., Hu, K., Huxley, R. R., Abramson, M. J., and Guo, Y.: The association between heatwaves and risk of hospitalization in Brazil: A nationwide time series study between 2000 and 2015, PLoS Med., 16, e1002753, https://doi.org/10.1371/journal.pmed.1002753, 2019.