
the Creative Commons Attribution 4.0 License.
the Creative Commons Attribution 4.0 License.
 | 28 Jul 2026
Revisiting the historical wintertime drying of the Mediterranean in the LESFMIP simulations
David Avisar
Chaim I. Garfinkel
Simulations from the Large Ensemble Single Forcing Model Intercomparison Project are used to isolate the impact of greenhouse gases (GHGs) and anthropogenic aerosols for historical (1850–2014) wintertime drying in the Mediterranean region. Increasing GHGs have already led to a clear ridging signal across the Mediterranean and a precipitation reduction of up to 15 %. Anthropogenic aerosols, on the other hand, led to Mediterranean troughing in most models and hence cancelled out part of the GHG induced signal. The net effect when all forcings are present is a weak drying, and this weak drying and subtle ridging is consistent with and might explain recent observational evidence that the anthropogenically forced wintertime drying in the Mediterranean region has not yet robustly emerged. There is pronounced intermodel spread in both the sea level pressure and precipitation responses to both GHGs and aerosols, however, with a few models showing no ridging in response to GHGs. The relation between this spread and the spread in 9 different climatic metrics is explored to help clarify dynamical mechanisms and the causes of intermodel spread. A stronger tendency towards Mediterranean ridging is found in models and ensemble members with a more pronounced North Atlantic warming hole, a stronger stratospheric polar vortex, and to a lesser degree with a larger poleward shift of the eddy-driven jet. While these three sensitivities are as expected, others are not. Namely, a larger increase of global mean temperature is associated with troughing over the Mediterranean, opposite to naive expectations. Moreover, the single-forcing experiments indicate that a warmer land relative to the ocean (over the Mediterranean) is associated with troughing, rather than the previously proposed ridging. Other sensitivities are weak: the spread in the historical response cannot be explained by spread in shifts of the Hadley cell edge or the zonal-mean subtropical jet. Overall, the results of this work highlight that aerosols have influenced Mediterranean climate in the historical climate and partially mitigated the GHGs-induced drying.
- Article
(11433 KB) - Full-text XML
-
Supplement
(55047 KB) - BibTeX
- EndNote


Anthropogenic activity has led to a continual increase in greenhouse gases (GHGs) concentrations in the atmosphere over the past century. The impact of this increase on surface climate has been documented in successive IPCC reports and is expected to strongly affect human societies over the upcoming decades. In addition to warming, increased GHGs are expected to cause a drying of subtropical dry regions and a wetting of tropical and mid-to-high-latitude wet regions, as the atmospheric moisture holding capacity increases (Held and Soden, 2006) and moisture transport intensifies (Seager et al., 2010). This projected drying of the subtropics is particularly pronounced in the Mediterranean basin, and indeed the Mediterranean region has been called a “hot spot” of climate change (Giorgi, 2006; Cos et al., 2022). While this expected drying has not yet emerged in most of the basin (Seager et al., 2024; Vicente-Serrano et al., 2025), it is expected to in the coming decades (Shaw et al., 2024).
The wintertime Mediterranean precipitation response to global warming forced by increasing GHGs concentrations has been associated with several distinct but likely complementary dynamical pathways. Seager et al. (2014) explain the projected drying over the Mediterranean based on a low level high anomaly and subsidence over the eastern Mediterranean that is responsible for a mean flow mass and moisture divergence anomaly. Kushnir (2015) associates the poleward expansion of the sinking branch of the Hadley cell under greenhouse warming (Lu et al., 2007) with weakening of the Mediterranean trough, suppression of cyclone activity, and reduction of precipitation. In addition, under climate change, the projected wintertime precipitation reduction in the eastern Mediterranean is associated with a decrease in the number of cyclones and in the precipitation per individual cyclone (Zappa et al., 2015a). Tang et al. (2018) suggest that the wintertime precipitation reduction in the Mediterranean in response to GHGs is due to a northward shift of the jet stream and storm track, caused by an enhanced sea level pressure in the North Atlantic (NA) and Mediterranean, local heating, and lower sea level pressure pattern in northern Europe. Tuel and Eltahir (2020) argue that slower-paced warming over the Mediterranean relative to adjacent land regions (i.e., relative Mediterranean cooling) will lead to a local ridge centered over the Mediterranean and, as a result, a precipitation decline. An additional mechanism involves regional SST changes in the North Atlantic: Delworth et al. (2022) find that a weakened AMOC and the subsequent atmospheric response to the North Atlantic warming hole drive reduced precipitation over the Mediterranean (Keller et al., 2025). Overall, the dynamical mechanisms that underlie the Mediterranean drying, as well as the drying across the subtropics in general (Seager et al., 2019; He and Soden, 2017), are not yet fully understood and are still under active research, even as the uncertainty in future hydroclimate in these regions is driven almost exclusively by uncertainty in dynamical changes (Elbaum et al., 2022).
In other regions, climate drivers other than GHGs have been shown to play a large, and in some cases dominant, role in historical and future trends (e.g., Kang et al., 2024). An increase of the wintertime Mediterranean precipitation was found by Westervelt et al. (2018) in two out of three models in response to local reduction of aerosol emissions. Similarly, Tang et al. (2018) find that adding global aerosols leads to reduced precipitation in this region. Such findings motivate the examination of the role of aerosols (among other drivers) on the large-scale atmospheric circulation and on decadal to centennial changes across the Mediterranean.
An additional source of uncertainty is that different models can often simulate very different responses to the same forcing (Smith et al., 2025). Studies focusing on future projections of the precipitation in the Mediterranean region find a statistically robust decline in nearly all models, but with large variability in magnitude across models (Zappa et al., 2015b; Cos et al., 2022; Garfinkel et al., 2020; Seager et al., 2024). These previous studies generally examined small ensembles for each model and thus were unable to isolate the structural differences in each model from internal variability inherent in the chaotic climate system (Garfinkel et al., 2020). These structural differences can arise from differences in parameterizations or insufficient resolution: for example, Garfinkel et al. (2024) find that the intensity of subtropical drying is sensitive to poorly constrained convective parameterizations. This spread in the Mediterranean region can also be associated with spread in remote regions, such as the polar stratosphere (Simpson et al., 2018) or the Arctic (Zappa et al., 2018). Large ensembles must therefore be used in order to average out chaotic variability and quantify intermodel differences in the forced response to GHGs or aerosols, and also allow for detecting whether the Mediterranean drying signal has emerged from the noise caused by internal variability.
This previous work highlights two key uncertainties that this paper aims to address: what are the relative roles of GHGs and aerosols for historical Mediterranean drying? And, is some of the intermodel spread in the simulated drying due to differences in how the aforementioned dynamical mechanisms manifest in each model? To address the gaps mentioned above, we use model output from the Large Ensemble Single Forcing Model Intercomparison Project (LESFMIP) (Smith et al., 2022). LESFMIP is a component of the implementation plan of the World Climate Research Programs's lighthouse activity on Explaining and Predicting Earth System Change (Findell et al., 2023). It is composed of a coordinated series of historical model experiments in which large ensembles of global climate simulations are applied under a single-forcing configuration. The external forcings that can influence climate on multi-annual and decadal scales that are considered within the LESFMIP are: GHGs, anthropogenic aerosols, solar irradiance, volcanic aerosols, ozone, and land use. Moreover, the LESFMIP is designed as large ensemble experiments in order to distinguish forced signals from the internal variability of the atmosphere. This combination of large ensembles and single forcings allows for the isolation of the impacts of each external driver on the changing climate. At this stage, however, since the available LESFMIP data covers only the historical period, conclusions regarding future projections cannot be drawn.
In this work we present a first analysis of the historical LESFMIP simulations, based on data from large ensembles of 10 different climate models. The data used for this study and the methodology we adopt are introduced in Sect. 2. Motivated by the interest in the Mediterranean region wintertime – December, January, February (DJF) – historical drying, in Sect. 3 we address the impact that GHGs and anthropogenic aerosols have on precipitation and sea-level pressure in the LESFMIP models: in the multi-model mean, single-model means, and when considering each individual ensemble member of each model. In particular, we demonstrate that anthropogenic aerosols have a sizable impact across the Mediterranean region and even beyond, and furthermore, we explore the possibility that several climate phenomena and/or mechanisms that were previously linked with the Mediterranean drying (Garfinkel et al., 2020) might be related to and have a role in the intermodel spread in the single forcing experiments of changing GHGs and anthropogenic aerosols. As will be shown below, these are the two forcings with the strongest impact on climate change in this region on multi-decadal timescales. We discuss the results and conclude in Sect. 4.
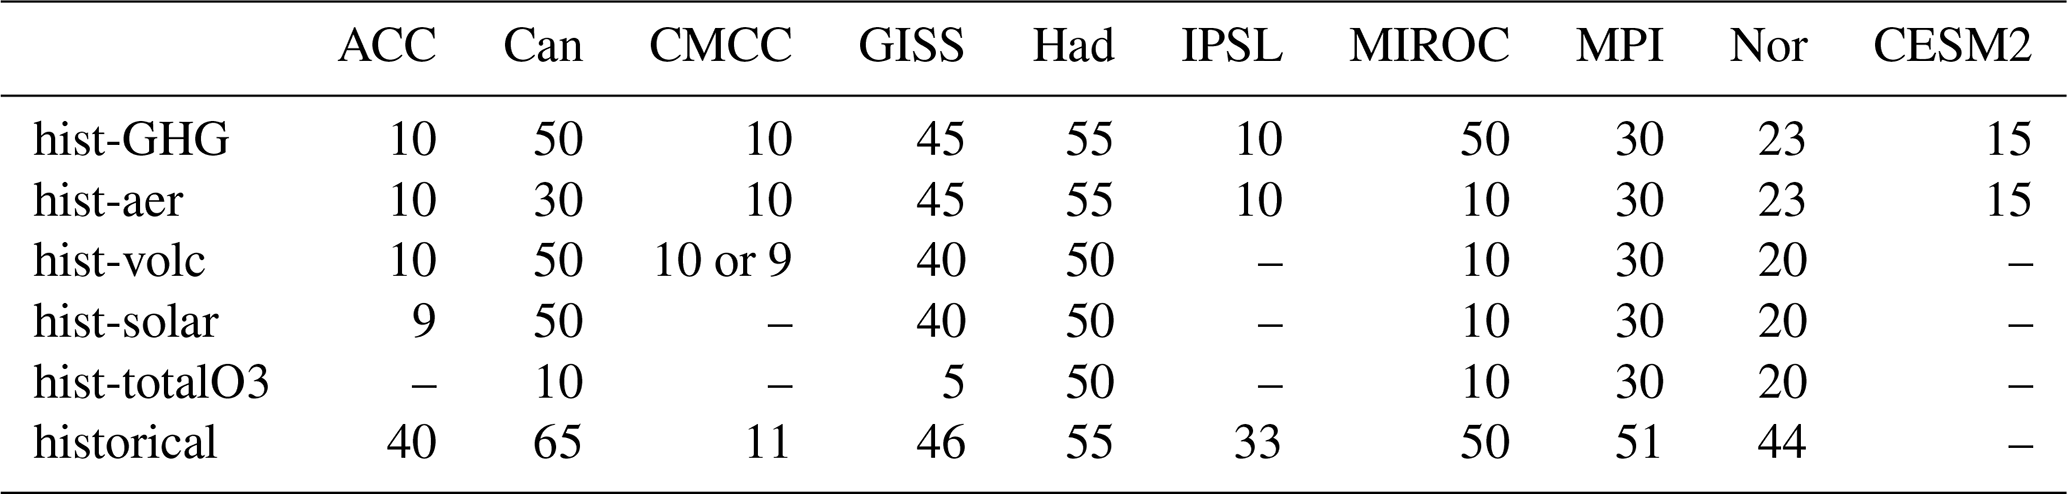
We use the monthly data of the historical LESFMIP experiments forced by time-varying greenhouse gases (hist-GHG), anthropogenic aerosols (hist-aer), solar irradiance (hist-sol), volcanic aerosols (hist-volc), and ozone (hist-totalO3). In addition, we use the “historical” experiment that includes all of the forcings (hereafter referred to as “all-forcings”). The LESFMIP simulations span the period 1850–2020 (though we also use some of the DAMIP simulations from CMIP6 which end in 2014). The monthly data for the fields pr, psl, tas, and ua (precipitation flux, air pressure at sea-level, near-surface air temperature, and 3-D eastward wind, respectively) was downloaded from the ESGF for the available ensemble members of 9 climate models. The models' names and the number of available ensemble members for each single forcing experiment are specified in Table 1. For a 10th model, CESM2, the data was downloaded from https://gdex.ucar.edu/ (last access: February 2024). This model has a hist-GHG experiment analogous to that of the LESFMIP. CESM2 did not perform the hist-aer experiment, however the influence of anthropogenic aerosols can be deduced by adding matching ensemble members of its hist-AAER and hist-BMB experiments (historical anthropogenic aerosols and historical biomass burning aerosols, respectively) followed by subtraction of a pre-industrial control run. Note that for CESM2 the meteorological fields are archived at somewhat different pressure levels than in the LESFMIP models, though very similar. These differences are noted below when relevant. In all, ∼300 ensemble members are available for hist-GHG, close to 240 for hist-aer, and almost 400 for the all-forcings. In the data analysis we focus on the boreal winter average (DJF) and on the centennial-scale response that is defined as the difference between the average during 1990–2014 and that during 1851–1920. We choose long epochs to reduce as much as possible the noise and extract the forced signals. Figures for other periods are included in the supplemental material to test the sensitivity to this choice, and they show similar results.
Table 1Number of model ensemble members for the various single-forcing experiments. ACC=ACCESS-ESM1-5, Can=CanESM5, CMCC=CMCC-CM2-SR5, GISS=GISS-E2-1-G, Had=HadGEM3-GC31-LL, IPSL=IPSL-CM6A-LR, MIROC=MIROC6, MPI=MPI-ESM1-2-LR, and Nor=NorESM2-LM.
The all-forcings simulated pressure at sea-level (PSL) is compared to the monthly HadSLPv2 sea-level pressure gridded observations (Allan and Ansell, 2006). These observations have 5° spatial resolution and cover the years 1850–2014.
Given the extensive amount of simulated data, the LESFMIP data is analyzed, and the corresponding results are presented, in a hierarchical manner. First, we analyze the multi-model mean to get a coarse picture: for each single-forcing experiment, and for the all-forcings run, we calculate the seasonal (winter: December, January, February (DJF), spring: March, April, May (MAM), summer: June, July, August (JJA), and fall: September, October, November (SON)) multi-model means of the responses (1990–2014 vs. 1851–1920) for the precipitation and sea-level pressure fields. The multi-model mean is the average of the single-model ensemble means. The multi-model mean responses allow to asses the relative contribution of each of the single forcings for the response over the NA, Europe and the Mediterranean. The multi-model mean is complemented with a model-agreement measure and the intermodel standard deviation. Second, for each model separately, we calculate the wintertime (DJF) ensemble mean responses for the eastward component of the wind at 700 hPa (691 hPa for the CESM2 model; hereafter U700), sea-level pressure, near-surface temperature (temperature at 992 hPa for CESM2), and precipitation (PRECC+PRECL fields for CESM2) for the hist-GHG, hist-aer, and the all-forcings experiments, focusing on the above-mentioned regions. As shown below, the individual-models reveal a substantial intermodel spread in the forced responses in these regions. This intermodel spread motivates the third and last step of the analysis, where the individual ensemble members of each individual model provide the most detailed view. Namely, we regress the wintertime response of the Mediterranean region PSL with the wintertime responses of 9 large-scale climatic measures/metrics that previous literature has linked to Mediterranean drying (Garfinkel et al., 2020). The regression is calculated across all available ensemble members from all models. In addition, we calculate the corresponding correlation coefficients, and the correlation coefficients based on the models' ensemble means. Based on these regressions, we analyze the possibility that the considered climatic measures contribute or are linked to the intermodel spread in the Mediterranean PSL and precipitation change in the LESFMIP simulations. We note that this study, which is based on such a large monthly dataset (and not daily or higher resolution), is not designed to disentangle mechanisms for the precipitation response. The definitions of the Mediterranean region PSL and the climatic measures considered are as follows.
-
Mediterranean region mean PSL and precipitation: Unless noted otherwise, the Mediterranean region is defined hereafter within 0–30° E and 32–48° N; see red rectangle in Figs. 1 and 4. For the PSL we calculate an area-weighted (by the cosine of latitude) mean across the region, and for the precipitation a simple spatial mean.
-
Mediterranean region land-ocean near-surface temperature contrast: Tuel and Eltahir (2020) argue that slower-paced warming over the Mediterranean relative to adjacent land regions (i.e., Mediterranean cooling) will lead to a local ridge centered over the Mediterranean and, as a result, a precipitation decline. The circulation response was shown to be triggered by the wintertime low static stability over the basin, allowing the local cooling to propagate from the surface into the troposphere (Tuel et al., 2021). Following Tuel and Eltahir (2020), we compute the land-sea temperature contrast in the Mediterranean region defined within 5° W–38° E and 28–48° N. Land (ocean) grid cells are chosen where the land fraction is ≥0.8 (≤0.2). The temperature difference is obtained by subtracting the ocean mean temperature from the land mean temperature (area-weighted means). As will be apparent below, land generally warms more than ocean in hist-GHG but cools more than ocean in hist-aer. Therefore, this index is positive for hist-GHG and negative for hist-aer.
-
North Atlantic warming-hole surface temperature: The warming hole influences the Atlantic storm track and has been mechanistically linked to the ridge over Europe (Gervais et al., 2019; Keller et al., 2025). Specifically, based on the thermodynamic budget, Keller et al. (2025) conclude that the warming-hole cools the lower troposphere downstream of its location which, in turn, weakens the low-level winter zonal temperature gradient between the Atlantic Ocean and Europe; this altered zonal gradient and the accompanying dipole in zonal temperature advection must be balanced by a local ridge over Europe and the Mediterranean. We consider ocean grid cells in the NA region where the multi-model mean temperature response indicates a warming hole, within 50–10° W, 45–65° N (Vacca et al., 2025). Mean temperature is calculated following area-weighting by the cosine of latitude.
-
Global mean near-surface temperature is calculated as an area-weighted average. A larger increase in global mean temperature will be associated with a stronger thermodynamic response to climate change (Held and Soden, 2006). However, in many regions climate change arises not via a thermodynamic mechanism but rather through a change in the circulation that is not proportional to the global mean temperature rise (Grise and Polvani, 2016; Elbaum et al., 2022; Garfinkel et al., 2024).
-
Stratospheric polar vortex: is expected to influence precipitation in the Mediterranean region, with a weak vortex enhancing precipitation in the western and central Mediterranean (Dai et al., 2025) and intermodel uncertainty in the vortex response driving uncertainty in projections in this region (Simpson et al., 2018). Zhang et al. (2024) showed that a weak stratospheric polar vortex is accompanied by an enhanced eastward moisture transport from the North Atlantic Ocean to the Mediterranean, and that an increase in large scale ascending motion associated with vorticity advection has a dominant role in the precipitation increase in the Mediterranean. Furthermore, these conditions are accompanied by enhanced frontogenesis and cyclone activity over most of the Mediterranean region. For our purpose, the polar vortex strength is quantified as the zonal-mean eastward component wind at 10 hPa averaged between latitudes 60 and 75° N. For the CESM2 model, we use the 14 hPa level of the U field.
-
Polar amplification of near surface temperature: Polar amplification is expected to lead to an equatorward jet shift and troughing over the Mediterranean (Zappa et al., 2018), which in turn could lead to enhanced precipitation in the Mediterranean region (Garfinkel et al., 2020). Following Garfinkel et al. (2020), the polar amplification is defined as the ratio of the temperature response averaged between latitudes 60 to 87.5° N (denoted “pole”) and that between latitudes 30° S to 30° N (denoted “trop”), hence
Note that as long as both the “pole” and “trop” temperature responses are either positive or negative (as will turn out to be the case for hist-GHG and hist-aer, respectively), the polar amplification ratio will be positive. Here, as well, temperature means are calculated as area-weighted averages.
-
An equatorward shift of the eddy-driven jet or a contraction of the tropical circulation is expected to lead to more precipitation in the Mediterranean (Kushnir, 2015; Zappa et al., 2015b; Schmidt and Grise, 2017a). Three different metrics of the edge of the tropical belt in the northern hemisphere are used. They are all calculated using the PyTropD python package that is based on Adam et al. (2018):
-
Latitude of the Hadley-cell edge: is calculated by the pyTropD “PSI” function (with the “Psi_500” method), which computes the zero-crossing latitude of the meridional mass stream function (ψ) at 500 hPa poleward of the tropical stream function extrema. This function is based on the zonal-mean meridional wind.
-
Latitude of the subtropical jet: is calculated by the pyTropD “STJ” function (with the “adjusted_max” method) as the latitude of the maximum of the zonal-mean zonal wind averaged between the 100 and 400 hPa levels minus that at 850 hPa.
-
Latitude of the midlatitude Eddy-driven jet: is calculated by the “EDJ” function in pyTropD as the latitude of the maximum of the midlatitude zonal-mean zonal wind at 850 hPa.
-
-
Averaged zonal-wind at 700 hPa in the Northern North Atlantic: the individual models' ensemble means show high intermodel spread in the response of U700 in the North Atlantic region bounded by 50° W–5° E, 50–65° N (green rectangle in Figs. 5 and 6), motivating us to examine the possibility of downstream impacts from U700 in this region on the Mediterranean. In particular, a stronger U700 between Iceland and the British Isles corresponds to a poleward shift of the jet and is expected to be highly correlated with Mediterranean ridging and drying (Tang et al., 2018).
3.1 Comparison of the historical response with observations and evaluation of the contribution of each single-forcings
We begin with the DJF multi-model mean PSL responses for each single-forcing experiment and the all-forcings experiment; these are shown in Fig. 1. (The responses during the other seasons are presented in Fig. S1 in the Supplement.) Grid-points where at least 80 % of the models agree on the response sign are not stippled. Gray contours represent the standard deviation of the intermodel responses (scaled by in-line values and by the line-thickness). A robust anomalous ridge over the Mediterranean develops in hist-GHG and to a lesser degree in the all-forcings (historical) in DJF. More broadly, a positive North Atlantic Oscillation (NAO) response is also seen in both experiments in DJF. The effect of aerosols over Europe and the Mediterranean is somewhat weaker than that of GHGs and there is less agreement across models as to the sign of the response, however aerosols show an opposite signed response to GHGs nearly everywhere. These effects are similar if we average over different centennial-scale periods (Fig. S2).
Figure 2 shows the observed DJF PSL response between the same periods (the observed responses for the other seasons are shown in Fig. S3). A meridional dipole response is evident in DJF, generally resembling the multi-model mean all-forcings and GHG-induced responses in the LESFMIP models (the pattern in the observations in DJF is similar if the latter epoch starts in 1980 or 1970 instead of 1990; not shown). However, the signals differ in magnitude (note the different colorbars for Figs. 1 and 2), which is not surprising since the observed anomalies include both the forced response and also internal variability. In order to assess whether the modeled response is discrepant with the observed PSL response, we contrast in Fig. 3 the distribution of the DJF PSL response as obtained in the all-forcings LESFMIP experiment for all of the models' ensemble members (color-coded bars) with the observed DJF response (vertical thick black line), for two regions. For the Mediterranean region (Fig. 3a, solid red box on Fig. 2) the observed response lies well within the LESFMIP historical distribution, and 36 % () of the ensemble members exceed the observed PSL response. If we instead focus on the region to the west of France in which the observed response is stronger (Fig. 3b, dashed red box on Fig. 2), the LESFMIP multi-model mean shows a weaker response than observed, however 8 % () of the ensemble members nonetheless exceed the observed PSL response. Hence, there is no evidence for a model vs. observations discrepancy over this period.
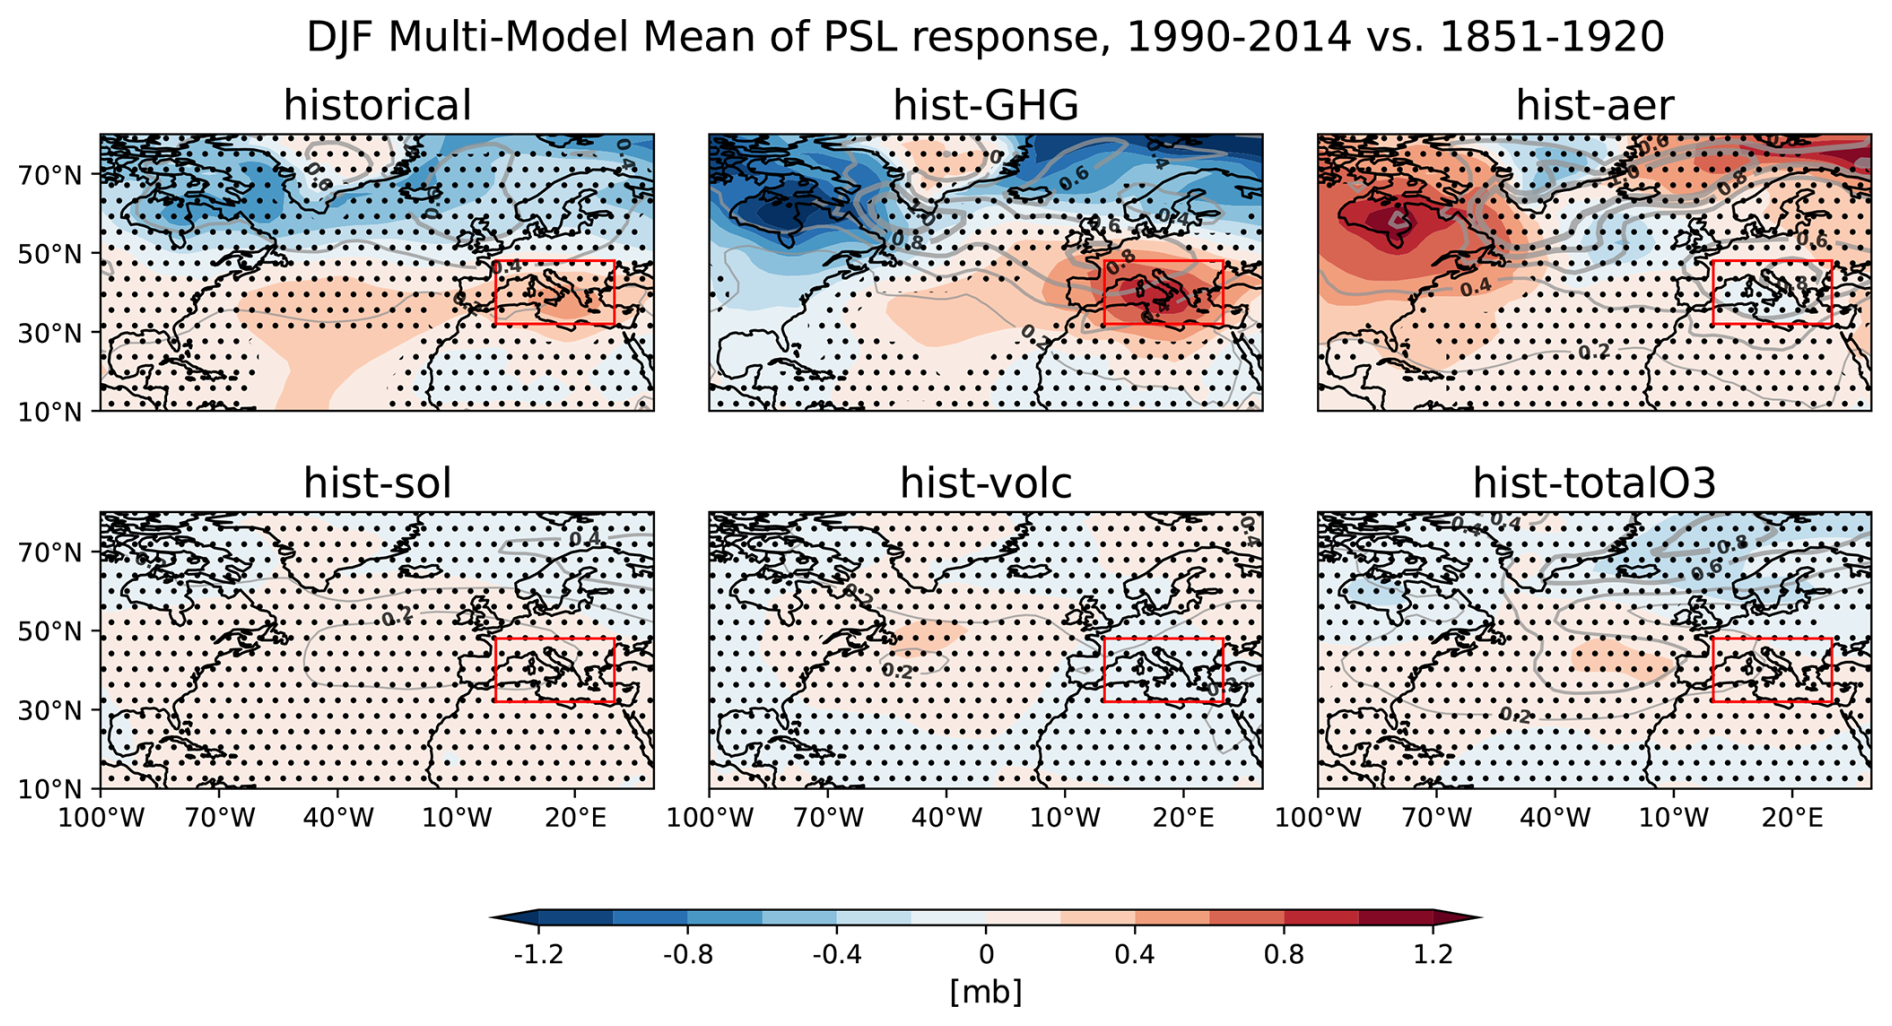
Figure 1Multi-model means of the DJF PSL responses (1990–2014 vs. 1851–1920) in the single-forcing and all-forcings experiments. The red rectangle marks the Mediterranean region as defined in the main text. Regions without stippling indicate where at least 80 % of the models agree on the sign of the response. Gray contours quantify the multi-model standard deviation and indicate the intermodel spread. A similar figure including the other seasons is shown in Fig. S1.
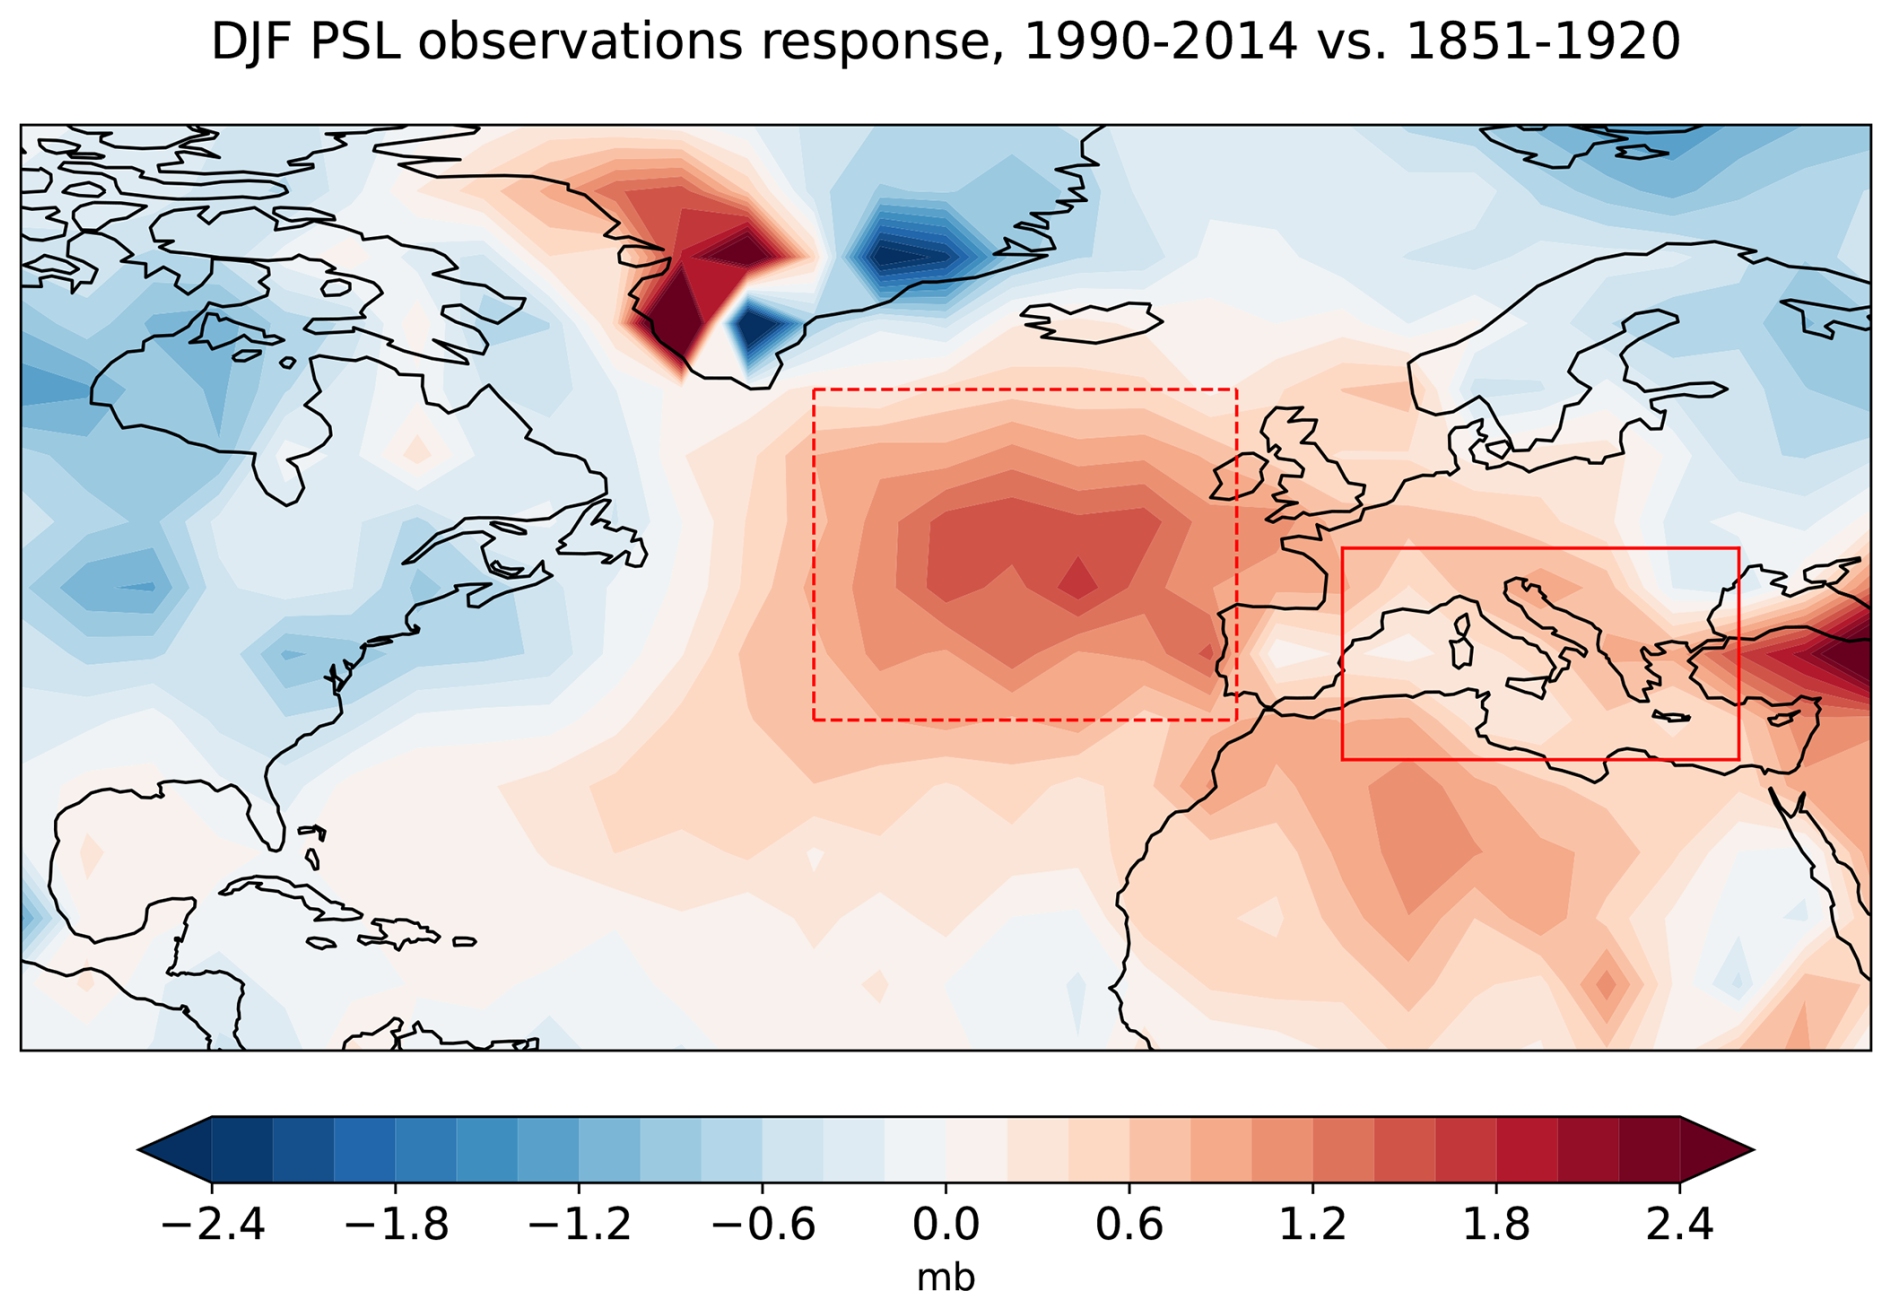
Figure 2DJF PSL responses (1990–2014 vs. 1851–1920) in the HadSLPv2 observations.
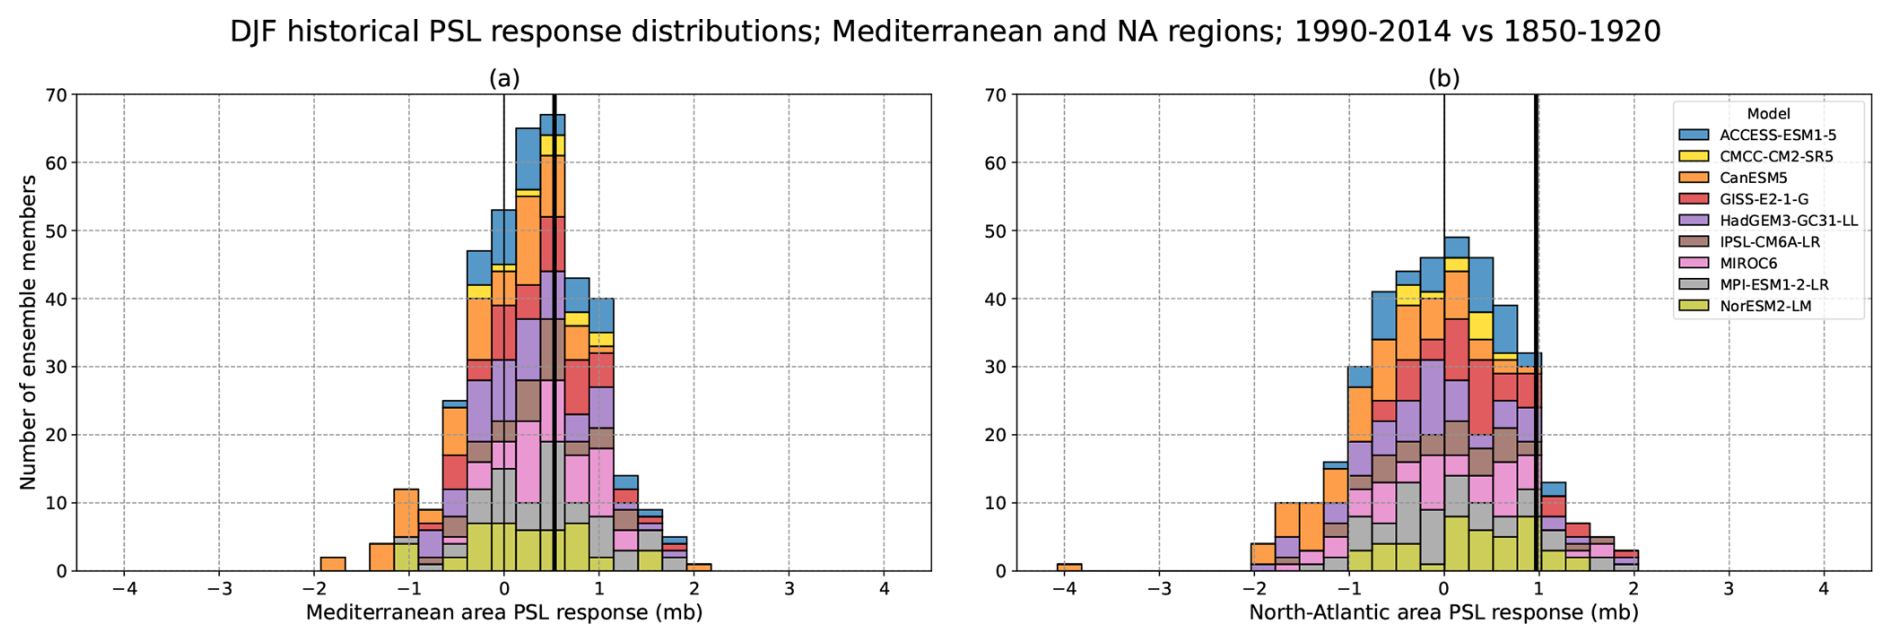
Figure 3DJF PSL response distribution in the historical experiment by the models' (color-coded) ensemble members in the Mediterranean (a; solid red box on Fig. 2) and in the North Atlantic (b; dashed red box on Fig. 2). The vertical thick black line refers to the observed response based on the HadSLPv2.
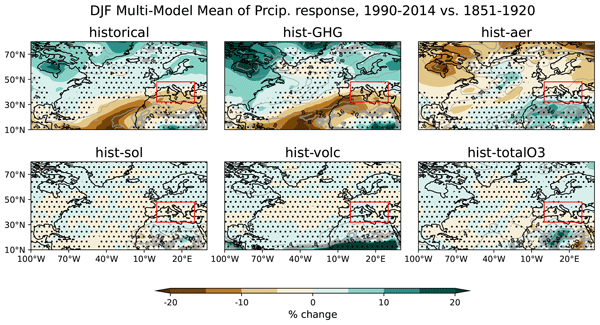
The DJF multi-model mean precipitation response is shown in Fig. 4, the responses during the other seasons are presented in Fig. S4. Consistent with the hist-GHG and all-forcings PSL meridional dipole in Fig. 1, precipitation decreases in the Mediterranean region and increases in Northern Europe in response to GHGs, and to a lesser degree in all-forcings. Note that the overall structure of the precipitation responses are very similar in the all-forcings and hist-GHG experiments. The precipitation signals in the European sector extend westward towards North America, and include increased precipitation in Canada and reduced precipitation in the Caribbean. Aerosols, on the other hand, have an opposite signed response with increased precipitation over North Africa and reduced precipitation over Northern Europe, but there is generally less intermodel agreement than for GHGs, and in the Mediterranean itself the precipitation response is weak. These patterns are similar if we average over different centennial-scale periods (Fig. S5).
The responses in hist-GHG and hist-aer are larger than in any of the other single forcing experiments for both precipitation and PSL. In most regions aerosols and GHGs have opposite signed responses for both PSL and precipitation, and hence the historical all-forcings changes are relatively muted and are less robust across models than for GHG alone. The spread across the different models' means is quantified with the multi-model standard deviation gray contours. This spread is higher across the NA, Europe and the Mediterranean, relative to that across other regions. Intermodel spread in winter precipitation is particularly large near the coastline of North Africa than in other regions for both hist-GHG and hist-aer.
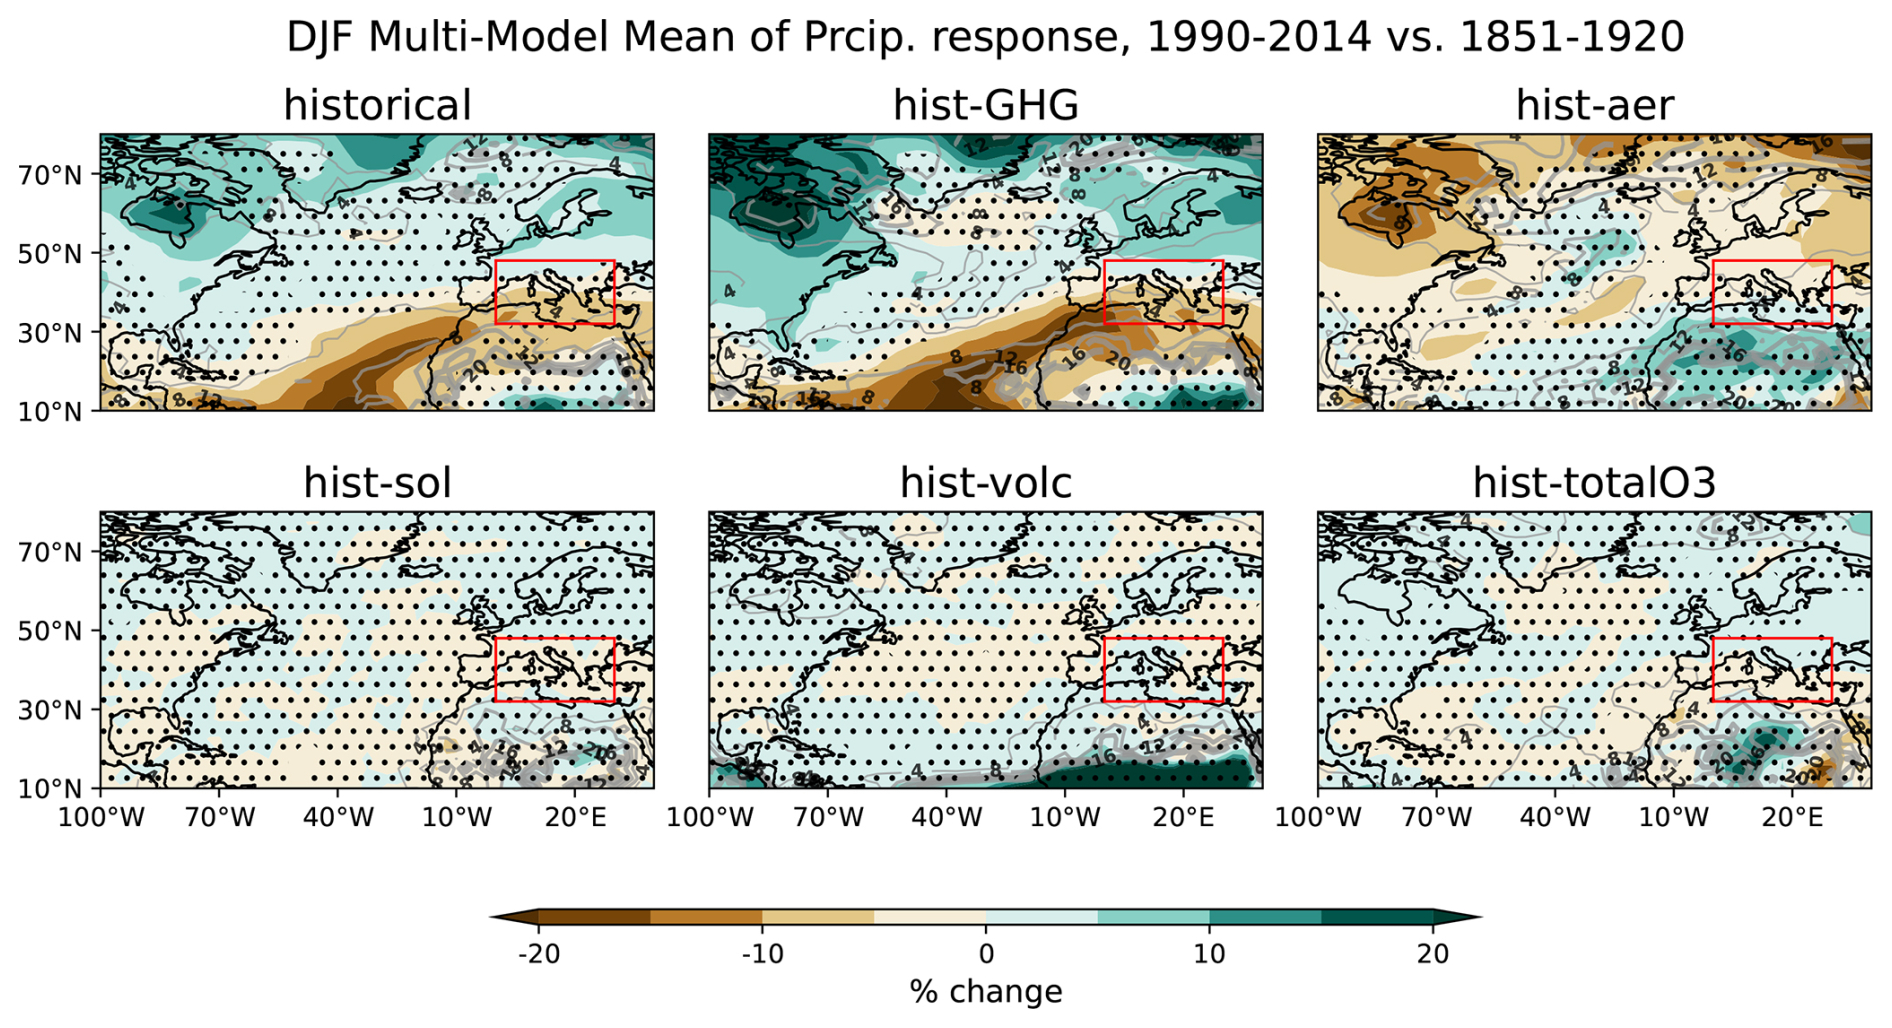
Figure 4Multi-model means of the DJF precipitation responses (1990–2014 vs. 1851–1920) in the single-forcing experiments. The red rectangle marks the Mediterranean region as defined in the main text. Regions without stippling indicates where at least 80 % of the models agree on the sign of the response. Gray contours quantify the multi-model standard deviation and indicate the intermodel spread. A similar figure including the other seasons is shown in Fig. S4.
Comparing the simulated precipitation to observations is challenging due to the unreliability and limited nature of observed precipitation data in the early parts of the historical simulation. Nevertheless, more recent precipitation data is more reliable and extensive, and we therefore show in Fig. S6 trends in precipitation for each all-forcings LESFMIP model ensemble mean in the periods considered by Vicente-Serrano et al. (2025). In agreement with Vicente-Serrano et al. (2025), recent trends in precipitation (i.e., 1981–2014) indicate wettening in most of the Mediterranean (and not only there) with the majority of the models indicating a positive precipitation trend. Drying trends in most of Mediterranean in the historical simulations only emerge for start-dates of 1931 or earlier, however many individual models simulate wettening trends over Southern Europe (especially Southern France, Italy, and the Balkans) even for a start date in 1871.
Based on the above comparison of the LESFMIP response to external forcings and the observed PSL centennial difference, it may be suggested that the emergence of the ridging (and drying) signal across the Mediterranean out of the system's internal variability has been delayed by aerosols, which have canceled out a substantial portion of the GHGs-induced drying. That is, GHGs and aerosols have had a strong but opposite impact on historical wintertime climate in the Mediterranean, potentially explaining the lack of emergence in observations (Seager et al., 2024; Vicente-Serrano et al., 2025).
3.2 Single-model ensemble means historical responses
We now consider differences across the models in the response to forcings. In Table 2 we specify for each model, for each single-forcing experiment and for the all-forcings experiment, the ensemble-mean precipitation response (in percent; values are rounded to the closest integer) averaged over the Mediterranean region. For each grid-cell within this region the response in calculated by subtracting and dividing wintertime precipitation averaged over the time periods . In parenthesis are the averaged precipitation responses within that region but southward of 40° N. Bold values mark that at least 80 % of the ensemble members agree on the sign of the area-averaged precipitation response. Italicized values mark that at least half of the ensemble members agree on the sign (but less than 80 %).
Table 2Averaged precipitation responses (in %) across the Mediterranean region (1990–2014 vs. 1851–1920; extracted from the fields presented in Figs. 5 and 6). The values in parenthesis refer to the Mediterranean region southward of 40° N. Bold values mark that at least 80 % of the ensemble members agree on the sign of the area-averaged precipitation response. Italicized values mark that at least half of the ensemble members agree on the sign (but less than 80 %).

∗ For CESM2, the hist-aer stands for the combination of the hist-AAER and hist-BMB experiments (see main text for details).
Under the GHG forcing, the ensemble means of all models show a reduction in precipitation within the Mediterranean region between the historical periods, which vary in the range −3 % to −10 % between the models but with a large agreement in the overall trend. The drying is more pronounced south of 40° N (within the Mediterranean region) and reaches −15 %. Under hist-aer, some models indicate drying while others indicate wetting or negligible change; the responses vary in the range −8 % to 5 %. Southward of 40° N (within the Mediterranean), the responses tend to be more positive. Notably, the precipitation responses under the other single-forcings are smaller than the responses under GHG and aerosols, and indicate less agreement among models. Overall, the all-forcings (historical) experiment show a trend similar to that indicated by hist-GHG. In addition, it is evident that the single-forcings responses are not linearly additive compared to the all-forcings response.
As evident by the multi-model means (Sect. 3.1), the responses to GHGs and aerosols are more significant than the responses to any of the other three forcings on these centennial timescales. Similarly, based on Table 2, the most pronounced precipitation responses in the single-model means are evident in the hist-GHG and hist-aer experiments. Therefore, we focus on these two in the rest of our paper.
There is a large intermodel spread in both the PSL and precipitation responses to GHGs and aerosols. This is demonstrated in Figs. 5 and 6, which show the DJF ensemble mean responses for each model separately in the hist-GHG and hist-aer experiments. We also show the zonal wind at 700 hPa (U700) and 2-meter temperature (T2m) fields due to their relevance to the indices discussed in Sect. 2. The comparable figure for all-forcings is in Fig. S7.
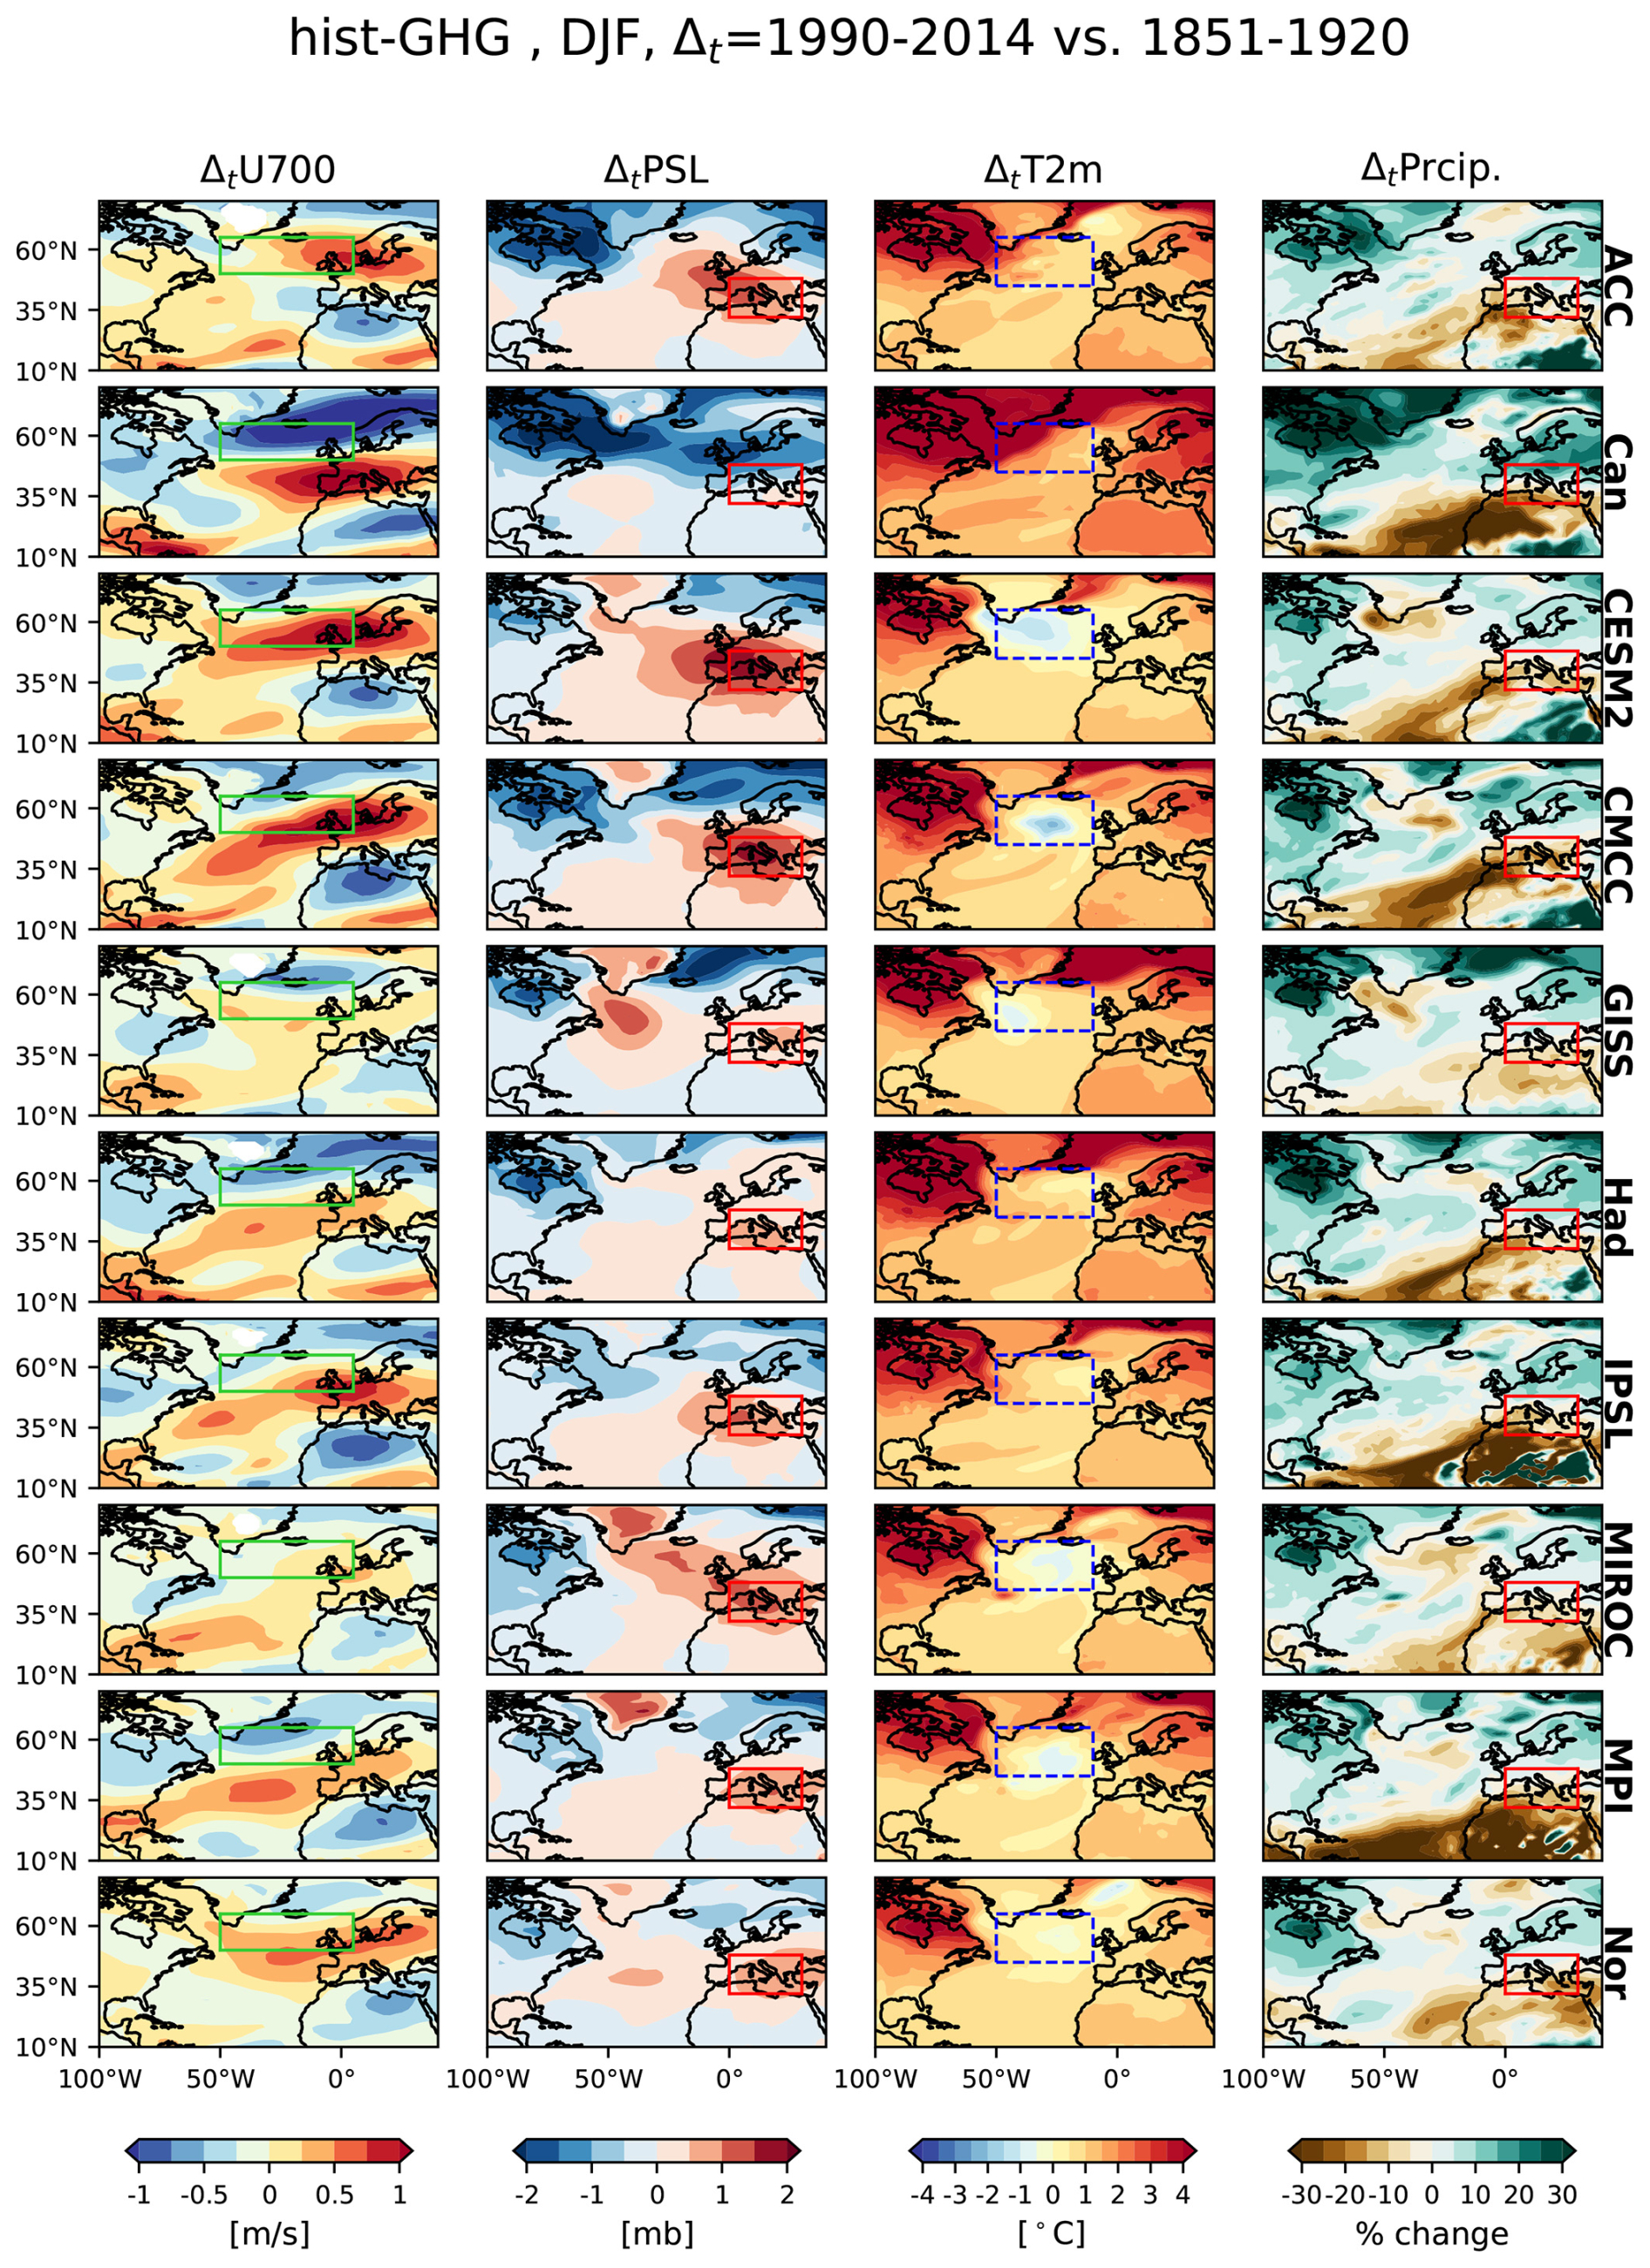
Figure 5Ensemble means of the DJF responses for the eastward wind component at 700 hPa, pressure at sea-level, near-surface temperature, and precipitation (denoted U700, PSL, T2m, and Prcip., respectively) (column-wise), obtained for each model in the hist-GHG experiment. The green, red, and blue rectangles mark region of high intermodel variability of U700, the Mediterranean region, and region of the NA warming-hole, respectively. Similar figures but for a different averaging period are shown in Fig. S8.
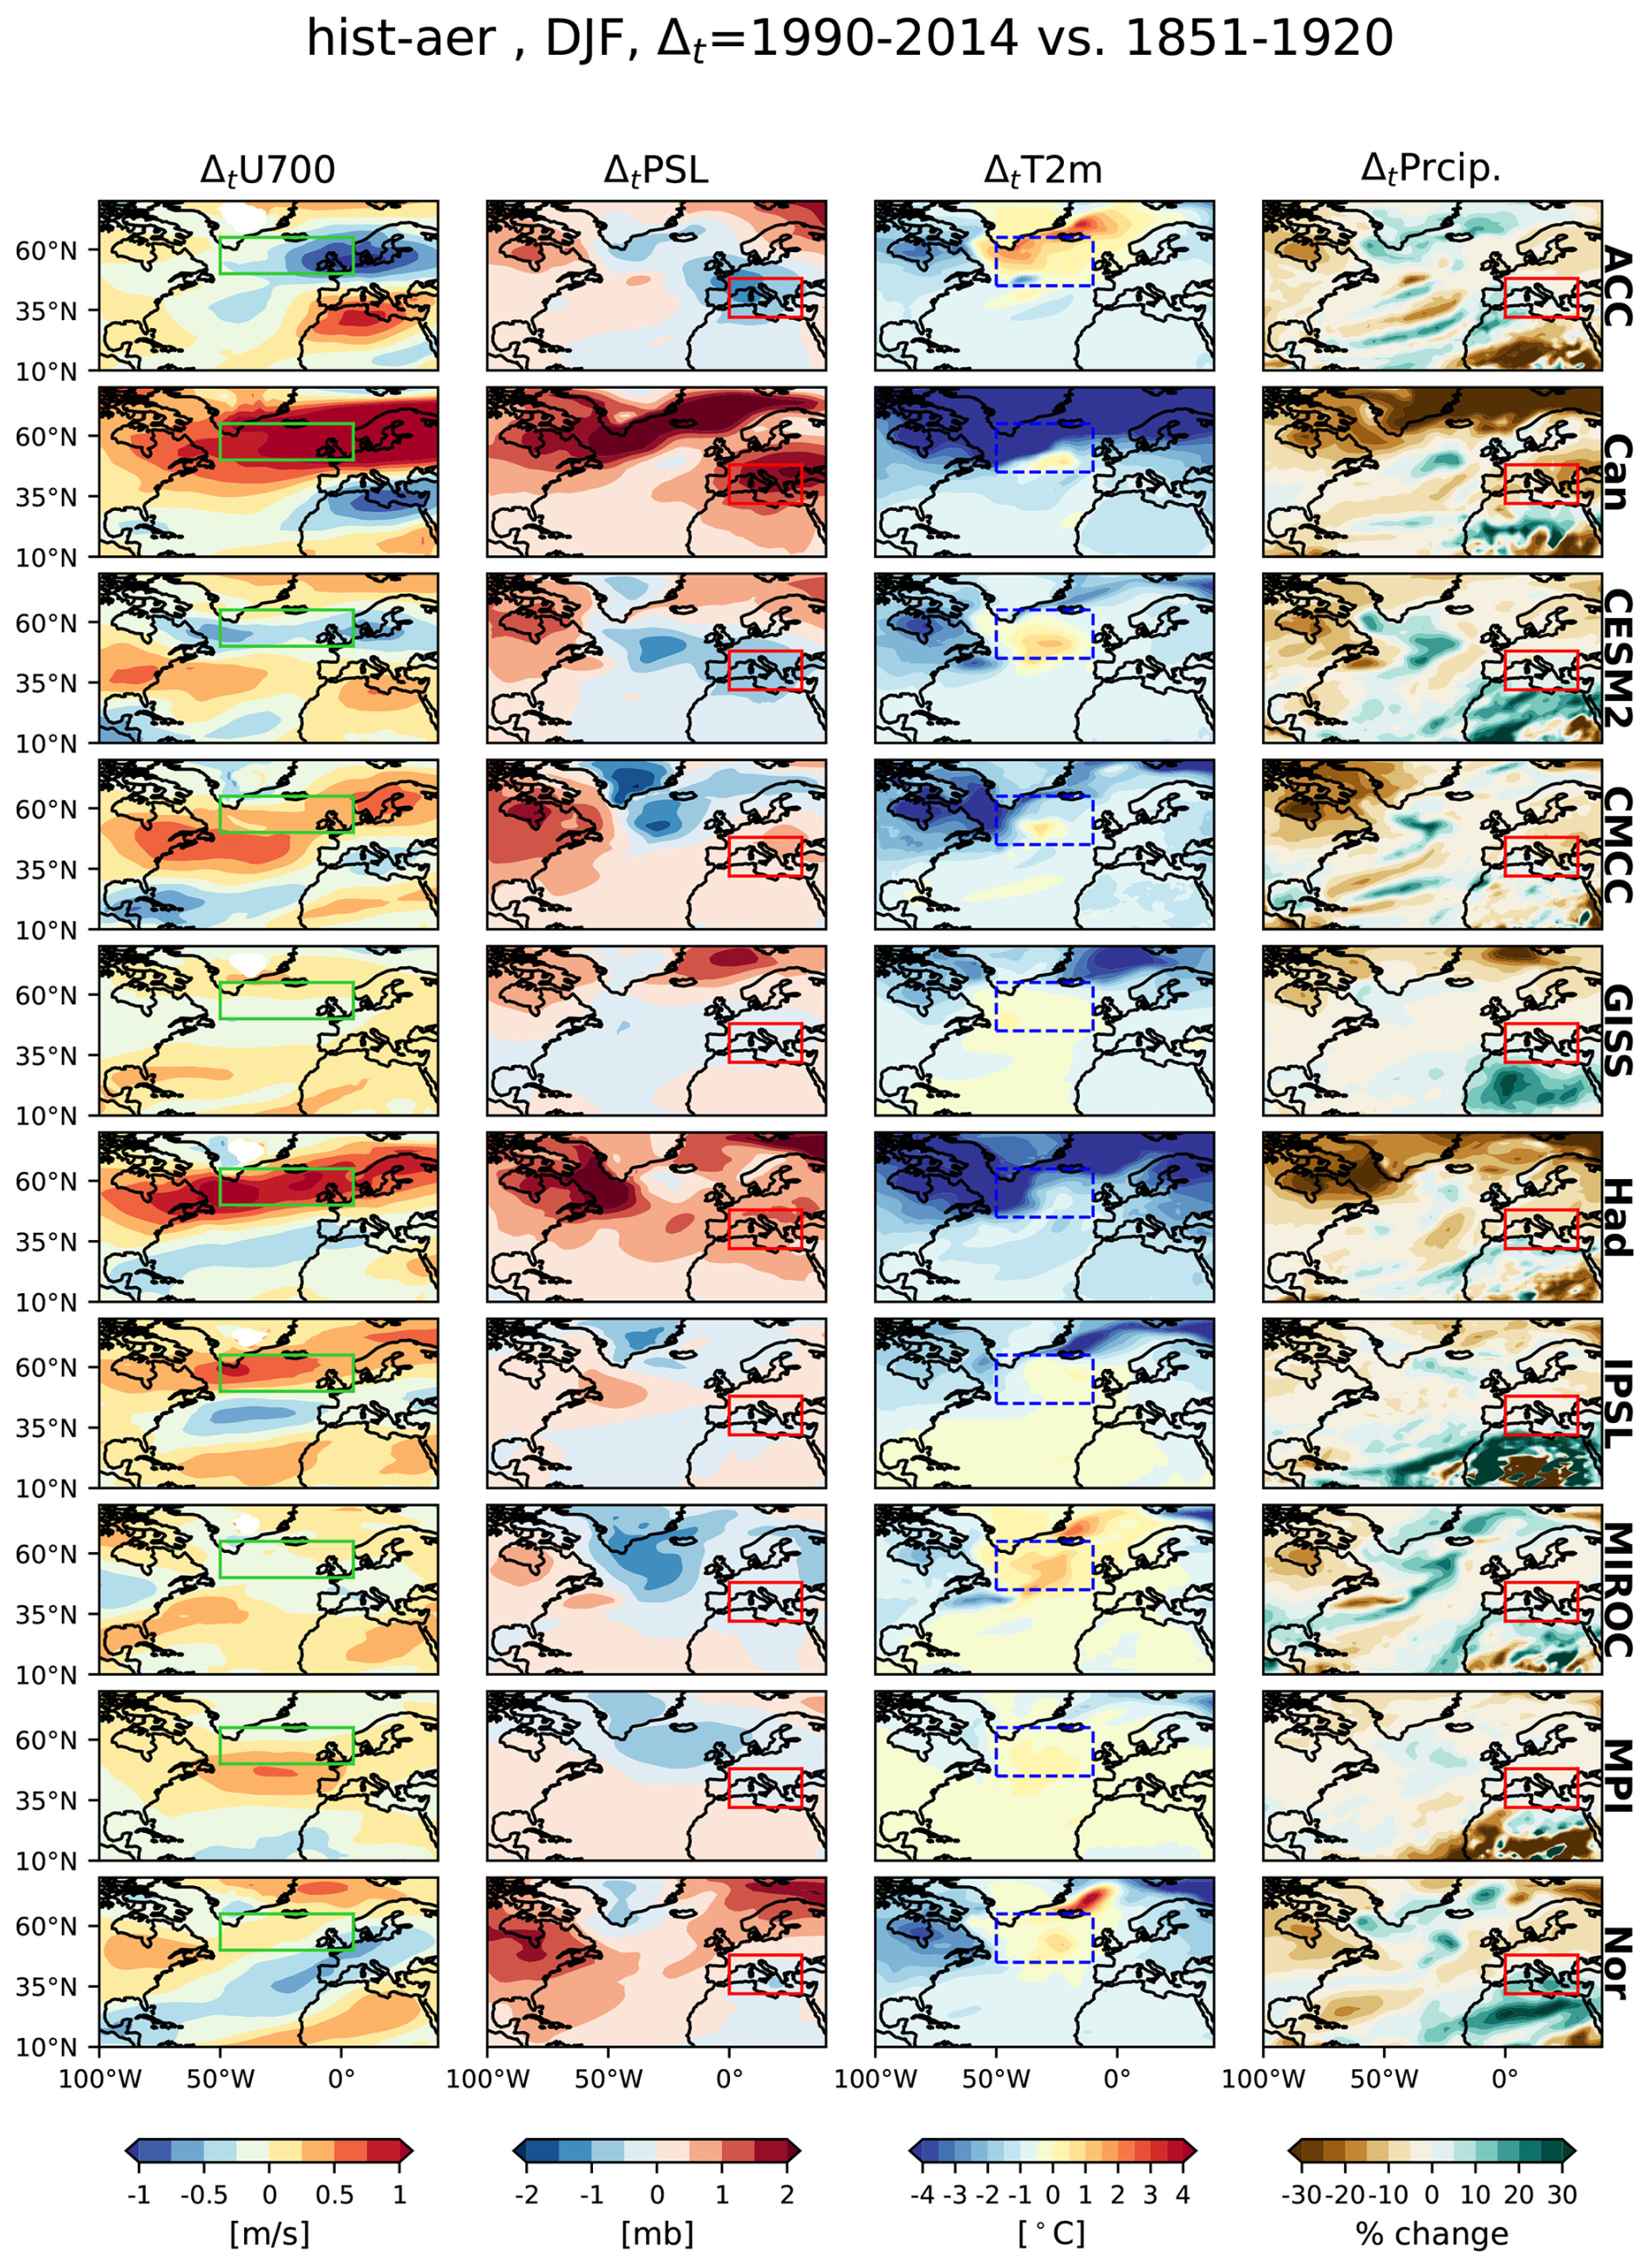
Figure 6Ensemble means of the DJF responses for the U700, PSL, T2m, and Prcip. (column-wise) fields, obtained for each model (row-wise) in the hist-aer experiment. The green, red, and blue rectangles mark region of high intermodel variability of U700, the Mediterranean region, and region of the NA warming-hole, respectively. Similar figures but for a different averaging period are shown in Fig. S9.
The response of U700 to GHGs in the North Atlantic differs qualitatively across the models. About half show an intensification of U700 across the UK and southern Scandinavia, but others show an opposite response. The ensemble means of all of the models, except that of CanESM5, show an increase in PSL across the Mediterranean region, but with variable intensity. About half of the models show a positive PSL response also across Europe and the NA. All of the models show a positive near-surface temperature response, except over the NA south of Greenland, hereafter referred to as the “warming hole” region (Rahmstorf et al., 2015). Four of the models show a cooling in this region of the NA (CESM2, CMCC-CM2-SR5, MIROC6, and MPI-ESM1-2-LR), and several more show a local minimum in warming (GISS-E2-1-G, NorESM2-LM). It is worth noting that the ensemble mean of the CanESM5 model shows the most significant warming response, in particular across the Atlantic, Africa, and Eurasia; this model is known for its particularly high climate sensitivity (Zelinka et al., 2020). Over most of the region presented in Figs. 5 and 6, the responses in hist-aer are opposite in sign relative to these in hist-GHG. The main exception is seen for HadGEM3-GC31-LL which shows a positive PSL response across almost the entire field shown, that is even larger than that in hist-GHG. Similar patterns are seen if we average over different centennial-scale periods (Figs. S8 and S9).
3.3 Towards Understanding the Intermodel Spread
In this section we examine what large-scale climate or circulation response might explain the spread in the regional wintertime response of PSL and precipitation to identical forcing over the historical period. The first possible explanation is that each model's response is influenced by its time-mean bias, and we therefore show the time-mean PSL biases for each model's ensemble mean for the historical experiment in Fig. S10. The biases range between −10 and 10 mb across the NA, Europe and Mediterranean and are very similar, in each model, across the three temporal periods. This indicates that the models responses are substantially smaller then their bias. Most of the models show a meridional dipole bias pattern: negative across northern Europe and positive southward and across the NA. A somewhat different pattern is observed for GISS-E2-1-G, HadGEM3-GC31-LL, MIROC6, and MPI-ESM1-2-LR. Crucially, there does not appear to be a clear relationship between each model's bias and its PSL response. For example, although the PSL biases in the top 4 rows of Fig. S10 are very similar, their PSL responses (in particular for CanESM5) differ substantially (Fig. 5). Our various attempts to use mean-state biases to “predict” the forced response in a given model were not successful (details excluded for brevity), which suggests that differences across the models in processes unrelated to the large-scale time-mean dynamical state are more important factors in explaining intermodel spread in the response.
So what factors can explain the spread in the responses? We answer this by analyzing the multi-model correlations of the Mediterranean region PSL responses and the responses of a group of climatic or circulation measures. Note that this analysis in not designed to determine mechanisms for the Mediterranean drying, rather to assess whether differences in the manifestation of these mechanisms across models might account for intermodel spread in the drying. The left (right) columns in the following figures refer to results for the hist-GHG (hist-aer) experiment.
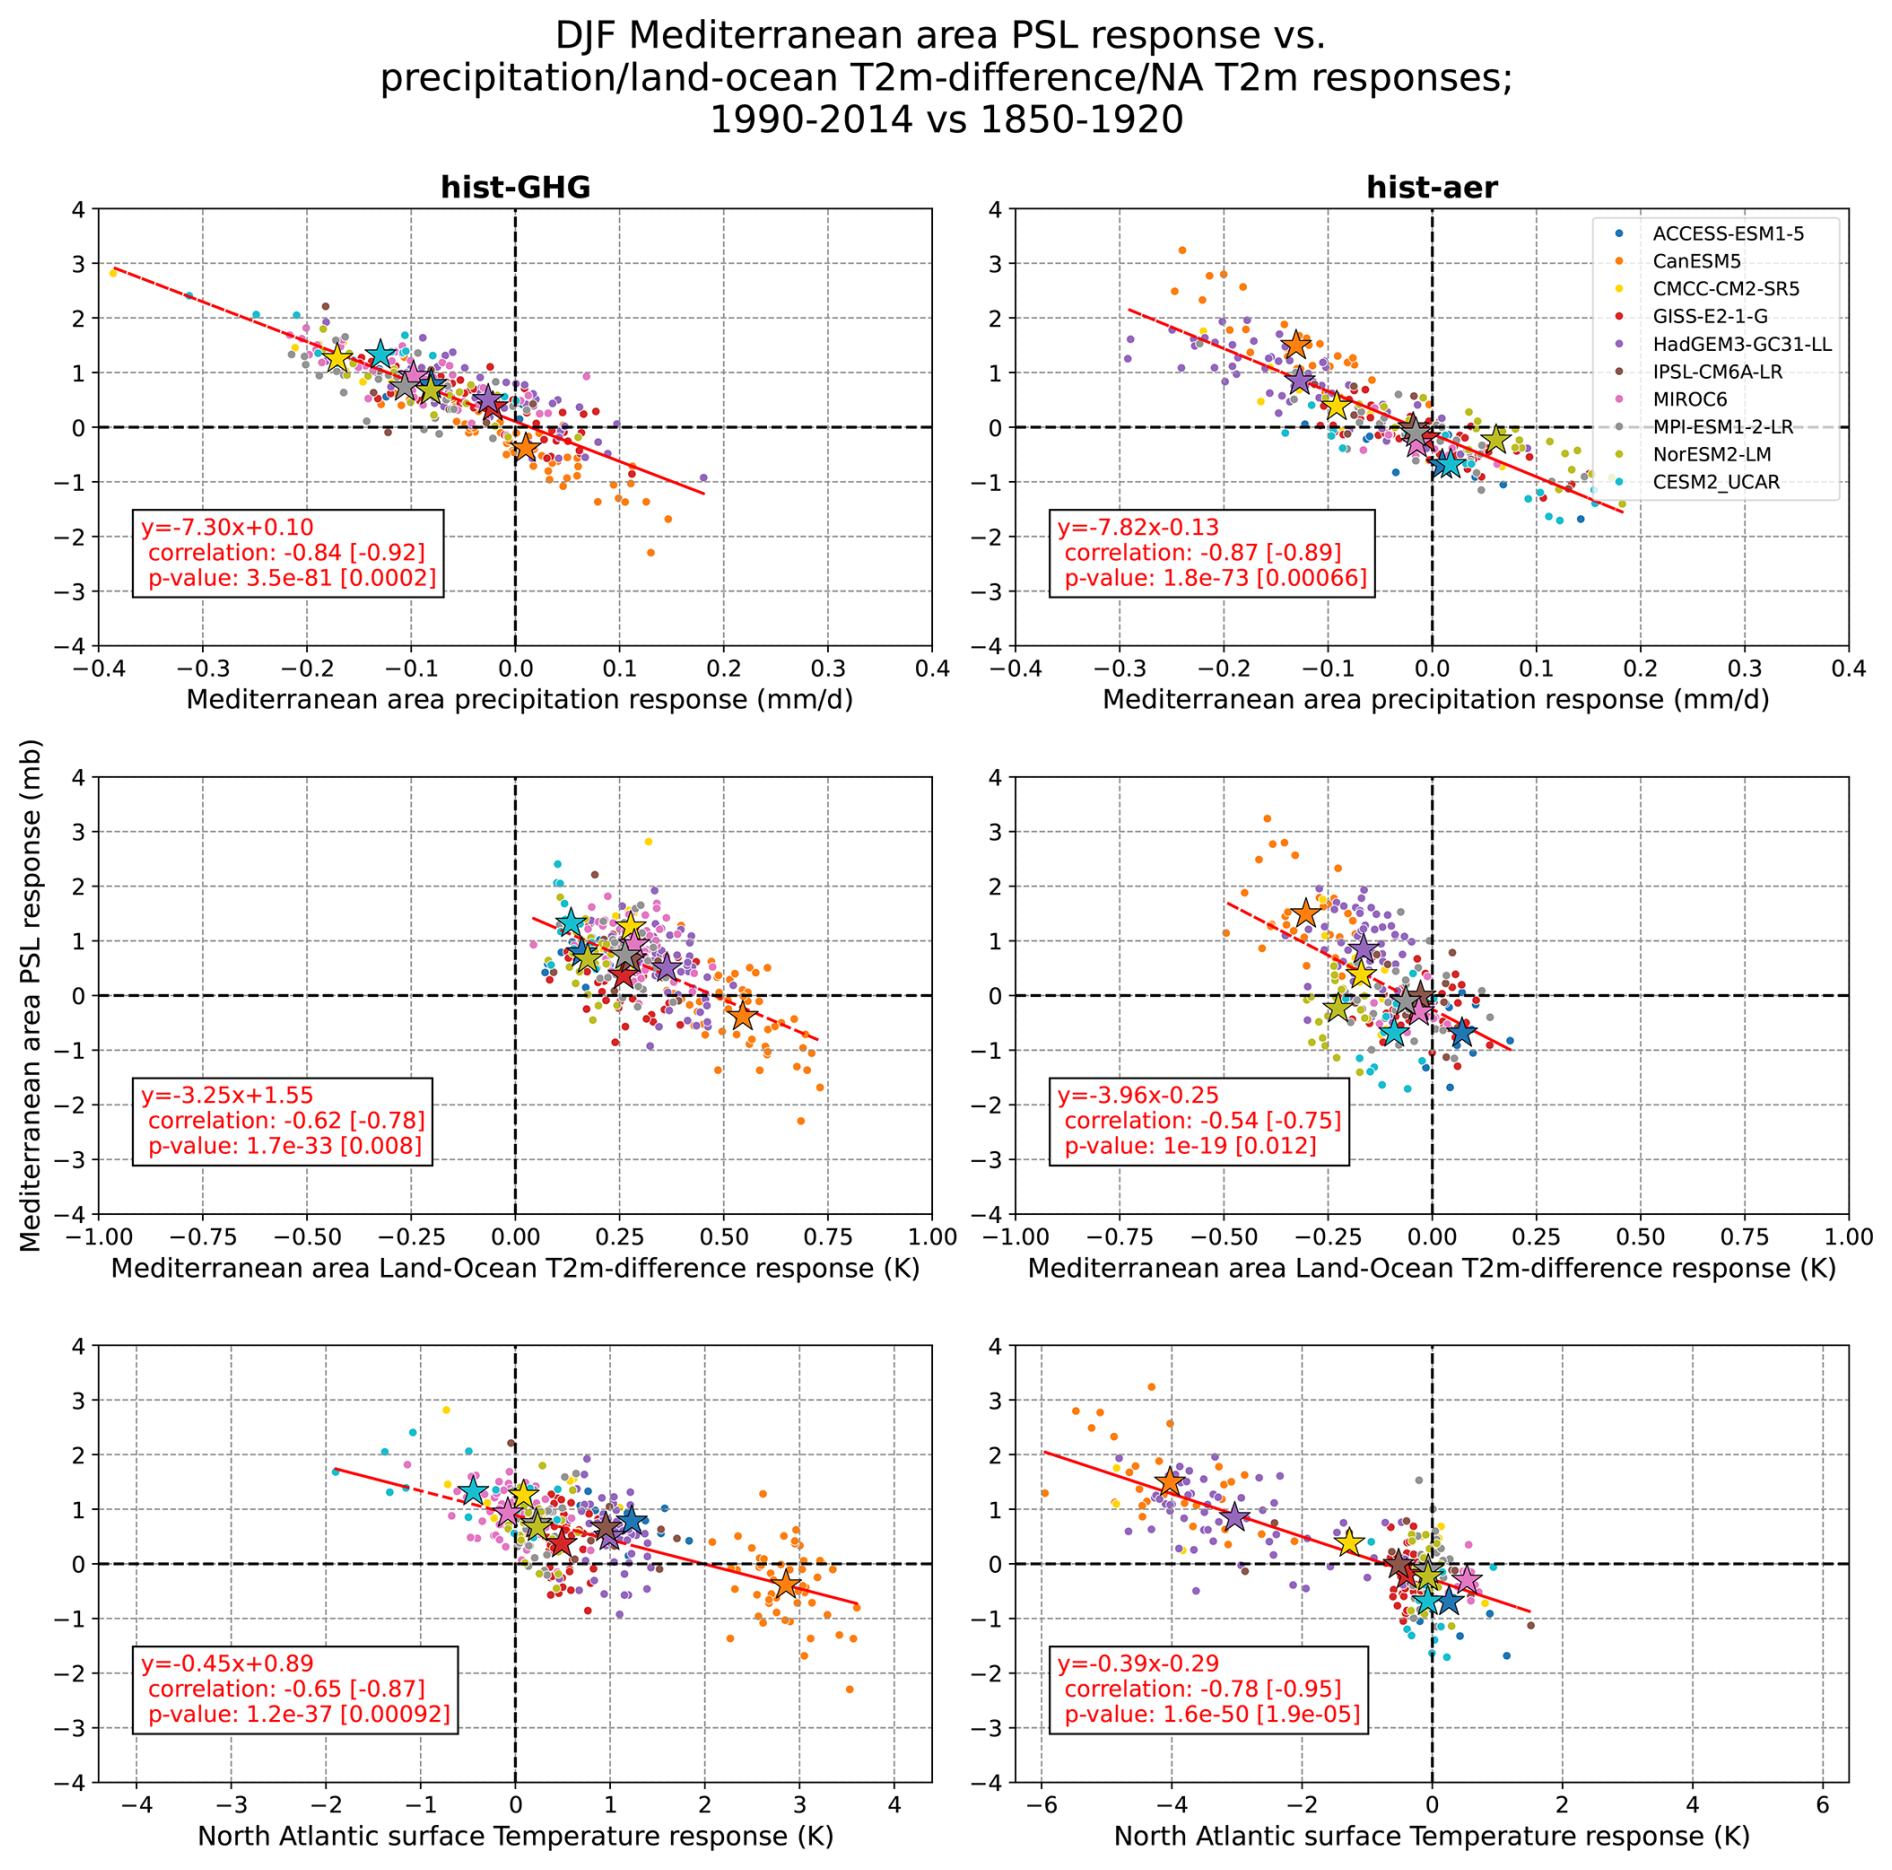
Figure 7Mediterranean PSL response vs. responses of Mediterranean precipitation (top panels), Mediterranean land-ocean near-surface temperature difference (middle panels), and near-surface temperature within the NA warming-hole region (blue rectangle in Figs. 5 and 6; bottom panels) obtained for each ensemble member of the LESFMIP models (color coded dots) for the hist-GHG and hist-aer experiments (left and right panels, respectively). Stars refer to the individual models' ensemble-means. The correlation coefficient and its p-value when using the individual ensemble-members (-means) are indicated outside (inside) the square brackets.
The upper panels of Fig. 7 show scatter plots of the DJF PSL response versus the precipitation response. Each data point (color-coded dots) corresponds to an ensemble member of a specific model. The corresponding linear regression equation, the correlation coefficient, and its p-value, calculated based on all >240 individual ensemble members, are indicated in red text outside the red brackets. Stars mark the ensemble-mean responses of each model, and the correlation and p-value when using these ensemble-mean responses only are indicated in the square brackets.
Figure 7 demonstrates the expected strong relationship between PSL and precipitation under both GHG and aer forcings, with a correlation coefficient of about −0.85 and a reduction of precipitation by about 7.5 mm d−1 for every 1hPa increase in PSL. The fit is similar if we use the ensemble-mean response in each model only. However, there is large inter- and intra-model spread in the Mediterranean precipitation and PSL responses to the single forcings. The spread in the PSL response covers the range to 3 mb under the GHG forcing and to 3.5 mb under aer. Still, ∼ 78 % of the hist-GHG simulations show a positive PSL response and ∼ 74 % show a reduction of precipitation. Similar spread is indicated in the hist-aer experiment with ∼ 52 % of the simulations showing a negative PSL response and ∼ 32 % a precipitation increase. The dominant role of uncertainty in circulation responses for uncertainty in precipitation changes in this region is consistent with previous work (Zappa et al., 2015b; Elbaum et al., 2022). The rest of this section is devoted to understanding this intermodel and across-ensemble spread.
The middle row in Fig. 7 shows the PSL response vs. that of the land-ocean near-surface temperature difference (see Sect. 2 for definition). In both the hist-GHG and hist-aer experiments, a more pronounced relative land warming is associated with troughing over the Mediterranean. This is in contrast with the results of Tuel and Eltahir (2020) who found that a relative Mediterranean cooling (that is, a relative land warming) is associated with ridging and drying. It is worth noting that the CanESM5 model contributes substantially to this relationship: if excluded, the correlation coefficients reduce to −0.34 and −0.35 for hist-GHG and hist-aer, respectively, but these are nonetheless opposite to the relationship predicted by Tuel and Eltahir (2020). Thus, under both single forcings experiments there seems to be a relationship between the PSL response and the response of the land-ocean temperature contrast, but it appears to be opposite to that suggested by previous work. We return to this in the discussion.
Next, we consider the relationship between the responses of Mediterranean PSL and of the NA Ocean temperature in the “warming hole” region defined in Sect. 2; the corresponding scatter plots are shown in the bottom row of Fig. 7. For both single forcing experiments, a stronger NA warming hole is associated with a stronger Mediterranean ridge, which is consistent with results of previous studies (Delworth et al., 2022; Keller et al., 2025). The correlation between the two responses is higher under the hist-aer experiment than under hist-GHG. In this case, excluding the CanESM5 model reduces the correlation coefficients to −0.43 and −0.71 for hist-GHG and hist-aer, respectively, but this is nonetheless highly statistically significant (p-values of 10−12 and 10−33 for hist-GHG and hist-aer, respectively).
In Fig. 8 we show the correlations between the PSL response and the responses of three large-scale climatic measures: global-mean near-surface temperature (top), stratospheric polar vortex (middle), and polar amplification of near-surface temperature (bottom). In both hist-GHG and hist-aer, a larger global mean warming is associated with troughing (and wettening, r=0.52) over the Mediterranean. This result is opposite to naive expectations: if the thermodynamic response was dominant, enhanced global warming should be associated with more sub-tropical drying (Held and Soden, 2006). It is worth mentioning in this context that for the northern hemisphere the global-mean surface temperature response was found to be correlated only with the DJF Hadley cell edge response (but not with the DJF responses of the midlatitude jet or the subtropical dry zone edge) (Grise and Polvani, 2016). Moreover, Zappa et al. (2015b) reported an absence of significant correlation between the global-mean surface warming and the mean Mediterranean precipitation response across the CMIP5 models. The negative correlation between the global-mean surface temperature response and that of PSL reported here is even larger if we focus on the trend dictated by the ensemble mean responses of the models, however, in most of the cases, the correlation is near-zero if we focus on the spread across each individual model's ensemble (not shown). The net effect is that intermodel spread in the precipitation response in the Mediterranean is not dictated by spread in thermodynamic processes (in agreement with Elbaum et al., 2022, who used individual members from individual CMIP models).
According to the middle row of Fig. 8, a stronger stratospheric polar vortex is associated with ridging over the Mediterranean. This effect is consistent with previous work which associate weak stratospheric polar vortex events with negative NAO periods and a corresponding increase in Mediterranean precipitation (Domeisen, 2019; Zhang et al., 2023, 2024; Baldwin et al., 2021; Dai et al., 2025). According to Figure 8, this relation is even stronger based on the ensemble-means than based on the individual ensemble members, and is stronger in hist-aer than in hist-GHG.
Next, we turn to the polar amplification of near-surface temperature (bottom row of Fig. 8). Before discussing its relationship with the PSL response, we first clarify the sign of this metric for the two single forcing experiments. Under GHG (aer) forcing, both the pole and tropics warm (cool), but with a larger temperature change in the pole than the tropics. Hence, since the metric is defined as the ratio of the temperature changes, its sign is generally positive in both experiments. However, the slope of the relationship between the PSL response and polar amplification differ in sign between the hist-GHG and hist-aer. This sign difference originates from opposite dynamical responses in the two experiments. For hist-aer, as the pole cools more than the tropics (i.e., as the polar amplification index gets more positive; not shown here), a poleward shift of the jet might be expected and, as a result, a stronger ridge over the Mediterranean. Similar reasoning for the more pronounced polar warming in hist-GHG would explain the troughing trend: polar amplification leads to an equatorward jet shift and a trough over the Mediterranean. Hence, it is to be expected that the signs of the slope in the bottom row should be opposite, as indeed is evident in the bottom row of Fig. 8. Still, there is a substantial difference between the magnitude of the correlation coefficients for the two experiments, with a more profound relation for the hist-aer. Moreover, in this case too, the correlation between polar amplification and Mediterranean PSL is much more pronounced in the multi-model data and is much less evident in each individual model's large ensemble.
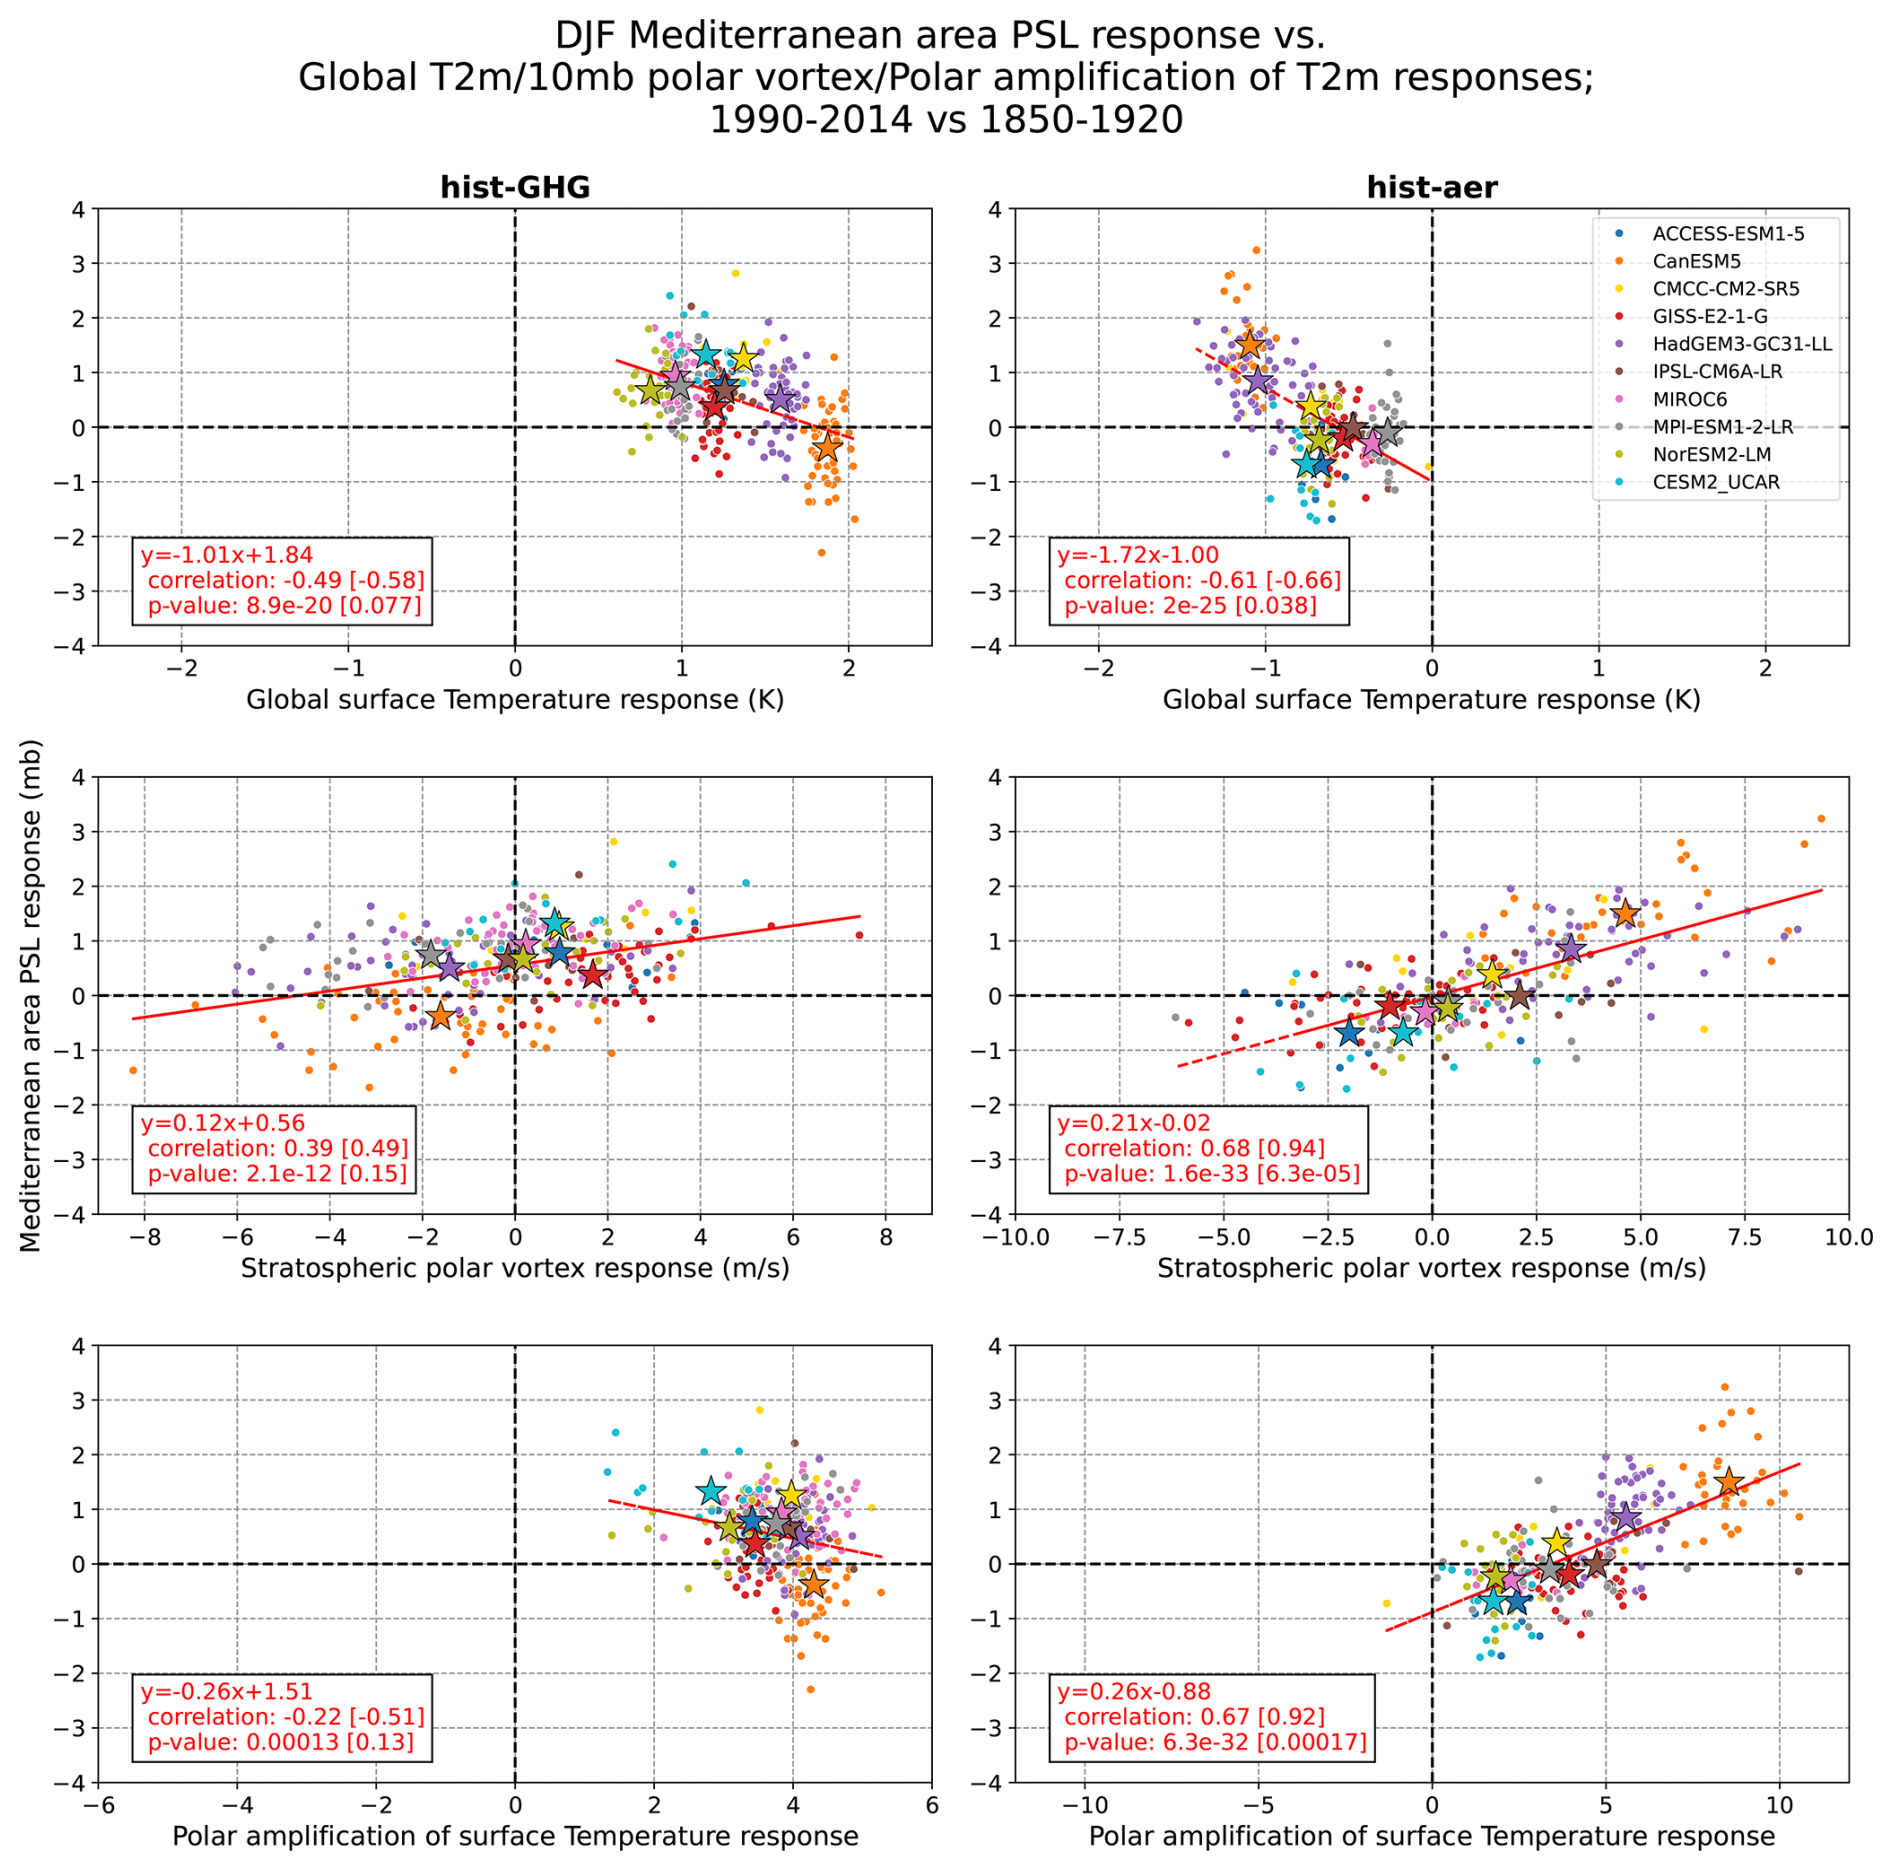
Figure 8Mediterranean PSL response vs. responses of global near-surface temperature (top panels), stratospheric polar vortex (middle panels), and polar temperature amplification (bottom panels) obtained for each ensemble member of the LESFMIP models (color coded dots) for the hist-GHG and hist-aer experiments (left and right panels, respectively). Stars refer to the ensemble-mean of each model. The correlation coefficient and its p-value when using the individual ensemble-members (-means) are indicated outside (inside) the square brackets.
In Fig. 9 we analyze the relationship between the PSL response and that of the northern edge of the tropical belt using three metrics: zero-crossing latitude of the meridional stream function at 500 hPa, latitude of the subtropical jet, and latitude of the eddy-driven jet (first three rows from the top, respectively). For the hist-GHG (hist-aer) experiment, about 92 % (72 %) of the ensemble members show a poleward (equatorward) shift of the tropical belt edge according to the zero-crossing of the stream function metric. However, the correlation between this zonally averaged shift and the Mediterranean PSL response does not exceed |0.20|. Even more striking is that the relationship in hist-GHG is opposite to naive expectations: members with a stronger poleward shift of the zero-crossing of ψ at 500 hPa, which corresponds to a stronger Hadley cell expansion, actually tend to have more of a trough in the Mediterranean (Schmidt and Grise, 2017b). However, when considering each model ensemble separately (not shown), eight of the ten individual models indicate an opposite relation (with correlations between 0.26 and 0.67) which is more in line with expectations (a negative correlation is only found for two models, CESM2 and CMCC-CM2-SR5). For hist-aer, three of the ten models show a negative correlation.
According to the subtropical jet metric, ∼ 52 % of the hist-GHG and hist-aer ensemble members show a poleward and equatorward shift, respectively. There is a lack of a relationship between the PSL response and the latitude of the subtropical jet response, which is also supported by the responses of the individual models. In contrast to the two latter metrics, there is a strong relationship between the PSL response and that of the latitude of the eddy-driven jet (third row of Fig. 9), both in hist-GHG and hist-aer: members with a stronger poleward jet shift in the zonal mean tend to have a stronger ridge. All of the individual models' ensembles support a positive correlation (although a single model in each of the hist-GHG and hist-aer experiments has a correlation that is smaller than 0.25).
In the bottom row of Fig. 9, we show the correlation between the PSL response with that of the averaged U700 in the Northern NA region where there is a high intermodel spread (region marked by green rectangle in Figs. 5 and 6). The relationship between the Mediterranean ridge and the near-surface jet is even stronger than that indicated for the zonal mean eddy-driven jet latitude response. Specifically, a stronger U700 between Iceland and the British Isles, which corresponds to a poleward shift of the Atlantic jet, is highly correlated with Mediterranean ridging both in hist-GHG and hist-aer. This indicates that intermodel spread in the Mediterranean and in the Atlantic are linked. It is worth noting that this relation is somewhat reminiscent to that documented by Zappa et al. (2015b) between the 850 hPa wind over northern Africa and the Mediterranean precipitation, presumably through the Mediterranean ridge. And indeed, the highest U700 anomalies over the North Atlantic in Figs. 5 and 6 are accompanied by the lowest U700 anomalies over northern parts of Africa.
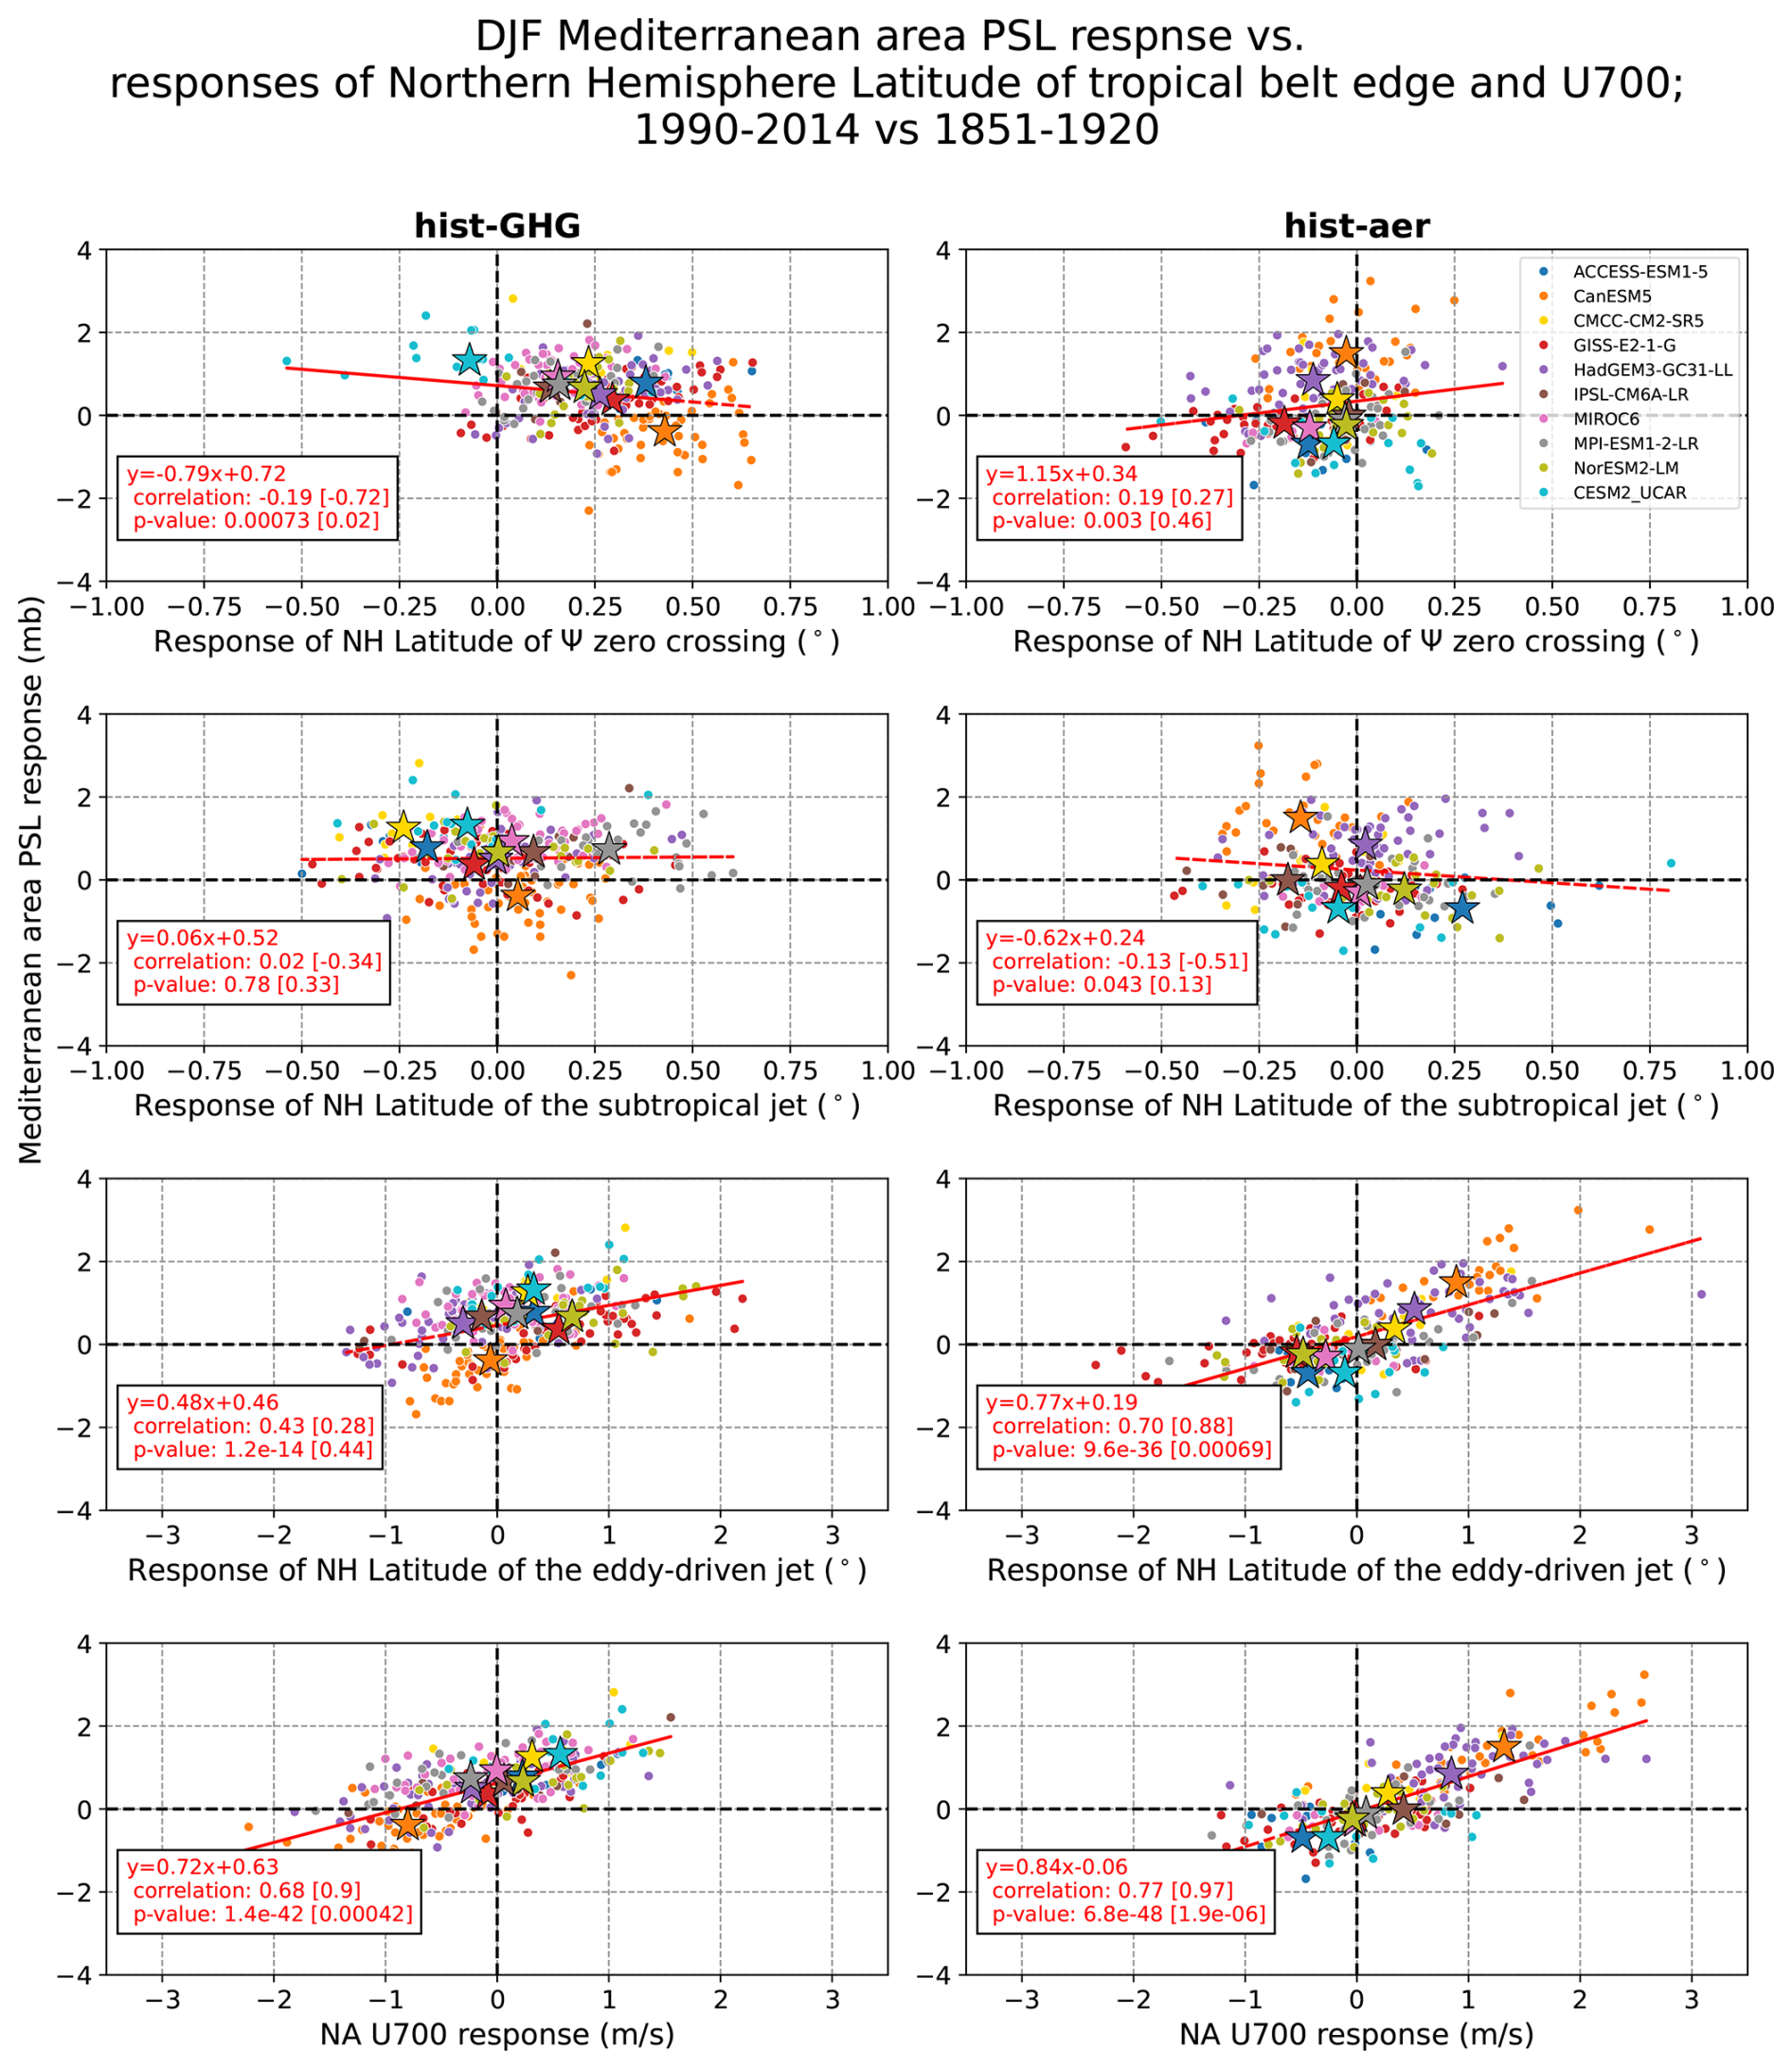
Figure 9Mediterranean PSL response vs. responses of the subtropical latitude of ψ zero-crossing (top row), latitude of the subtropical jet (second row), and of the latitude of the midlatitude eddy-driven jet in the zonal mean (third row) and in the North Atlantic (bottom row) obtained for each ensemble member of the LESFMIP models (color coded dots) for the hist-GHG and hist-aer experiments (left and right panels, respectively). Stars refer to the ensemble-mean of each model. The correlation coefficient and its p-value when using the individual ensemble-members (-means) are indicated outside (inside) the square brackets.
Climate models consistently predict a reduction in precipitation during winter in the Mediterranean region in response to climate change. While this reduction has not yet emerged in observations in most of the basin (Seager et al., 2024; Vicente-Serrano et al., 2025), it is expected to have serious negative impacts on society and is expected to emerge in the next decade or two (Shaw et al., 2024). It is not clear to what extent the lack of emergence is due to a weak GHG induced response in this region, to a low signal-to-noise ratio, or due to cancellation between the GHG induced drying and other climate forcings. Furthermore, there is substantial intermodel spread in projected drying which is only partially understood (Elbaum et al., 2022; Garfinkel et al., 2020).
In this study we use the Large Ensemble Single Forcing Model Intercomparison Project (LESFMIP) simulations from 10 models and address part of the above needs. The single forcing configuration of these simulations allows for distinguishing the separate contributions of the different forcings to changes in climate, in parallel with a comparison of the all-forcing historical simulation to observations. Because there is substantial intermodel spread in the sea-level pressure (PSL) and precipitation responses, we also test whether this spread can be explained by the spread in the historical change in several climatic measures: Mediterranean land-sea temperature contrast, near-surface temperatures over the NA, global mean temperature, stratospheric polar vortex, polar amplification, tropical belt width, and averaged U700 in the northern North Atlantic.
We first inspect the multi-model mean centennial changes (1990–2014 vs. 1850–1920) of precipitation and PSL in each of the five single forcing experiments: GHGs, anthropogenic aerosols, solar irradiance, volcanic aerosols, and ozone (hist-GHG, hist-aer, hist-sol, hist-volc, and hist-totalO3, respectively). Across North America, North Atlantic, Europe, and the Mediterranean region, the responses under hist-GHG and hist-aer are stronger in absolute value than the response to the three other forcings (ozone, volcanoes, solar). Under hist-GHG, the wintertime precipitation response across the Mediterranean is negative and robust and that of PSL is positive (i.e., ridging) and robust, which resemble the historical responses in Tang et al. (2018). The decline in precipitation across the Mediterranean approaches 15 % in some models in hist-GHG (Fig. 5). The multi-model mean responses under hist-aer are opposite in sign and slightly weaker in magnitude to those under the GHG forcing, but are less robust across the Mediterranean region. Because of this cancellation by aerosols of part of the GHG induced drying, the net changes in the historical simulation are weaker than in response to GHG only, and there is no indication of a model vs. observations discrepancy in historical changes (Fig. 3).
There is substantial intermodel spread in the PSL response across the NA, Europe, and the Mediterranean, both under hist-GHG and hist-aer. Furthermore, around half of the models ensemble means indicate a warming-hole in the NA Ocean during DJF under hist-GHG, and there is also a large intermodel spread in e.g., polar amplification, the stratospheric polar vortex, land vs. ocean temperature gradients in the Mediterranean region, and globally averaged temperature increase (Figs. 5 and 6). Section 3.3 quantifies whether these intermodel spreads are related to intermodel spread in the Mediterranean PSL response. The wintertime PSL response is moderately to highly correlated with the responses of the Mediterranean land-ocean temperature contrast, the NA near-surface temperature within the warming-hole region, the stratospheric polar vortex, the latitude of the eddy-driven jet in the zonal mean and especially in the NA. Namely, a stronger NA warming hole, a stronger stratospheric polar vortex, poleward shift of the eddy-driven jet and U700 are correlated with a Mediterranean ridging. A high correlation is also obtained between the PSL response and that of the polar amplification, but only under hist-aer. These relationships are all consistent with previous work.
On the other hand, some of the other previously proposed mechanisms cannot explain the intermodel spread. We find no evidence for the mechanism proposed by Tuel and Eltahir (2020): a warmer land relative to the ocean (over the Mediterranean) is associated with troughing rather than ridging. In addition, the LESFMIP simulations indicate that a larger increase of global mean temperature is associated with troughing and wettening over the Mediterranean, which indicates that a pure thermodynamic mechanism (Held and Soden, 2006) cannot describe intermodel spread in drying. Last, the multi-model spread in the historical PSL response cannot be explained on the basis of response of either a shift of the Hadley cell edge (Kushnir, 2015) or shift of the zonal-mean subtropical jet. The importance of the NA warming hole, and the lack of importance of land-sea warming in the Mediterranean basin, is in agreement with the mechanistic experiments of Keller et al. (2025).
Many of these relationships are similar if we focus on the ensemble spread within each individual model. Specifically, the stratospheric polar vortex, the edge of the eddy-driven jet, and averaged U700 responses in each individual member within a given model is correlated with the PSL response within that model in a manner similar to the grand multi-model ensemble or the models' ensemble-means. But this is not true for all effects. Namely, for the climatic metrics responses that are based on temperature, i.e., the Mediterranean land-ocean temperature contrast, NA warming-hole temperature, and in particular the global-mean surface temperature, the individual model ensemble members show much smaller correlations than that of the multi-model with the PSL response. This implies that internal variability driven by dynamical processes within a given model ensemble can overwhelm these large-scale thermodynamic forcings. These differences between the multi-model correlations and the individual models' intra-ensemble correlation imply that single-model large ensembles may not be sufficient for capturing relations between, e.g., dynamical and climate sensitivities.
Our focus on understanding intermodel spread in historical climate has implications for attempts to build storylines of future climate change that explicitly consider intermodel spread in underlying processes (Shepherd et al., 2018). In Europe and the Mediterranean, these storyline approaches couch future projections in terms of how each model simulates, e.g., changes in the polar vortex or changes in polar amplification while normalizing per degree of global warming (e.g. Zappa and Shepherd, 2017). We find no evidence that a stronger global mean warming leads to more pronounced drying in this region, which implies that dynamical effects overwhelm thermodynamic mechanisms (in agreement with Seager et al., 2019; Elbaum et al., 2022). Furthermore, our results imply that the rate of warming of SSTs in the North Atlantic warming hole region has a stronger impact than either the polar vortex or Arctic amplification on Mediterranean drying, and should be included when building storylines of European and Mediterranean climate. Finally, the regression coefficients derived from hist-aer and hist-GHG are not, in general, quantitatively similar. That is, the correlations and regression coefficients of the majority of the large-scale metrics with the Mediterranean PSL response are higher under the anthropogenic aerosols forcing than under the GHGs forcing. This could arise if European sector aerosols have an impact on the local atmospheric circulation. Confirming this requires a more detailed analysis of the historical and hist-aer simulations, including analyzing the potential for reversals of trends since the 1980s when European aerosols peaked. Ongoing work is aimed at clarifying this effect.
Future analysis will focus on drivers of summertime changes in this region. Future work that compares the sum of the responses in the various single forcing simulations to the historical simulation is also ongoing, as additivity is a prerequisite for a quantitative attribution statement. Finally, ongoing work is aimed at model vs. observations discrepancies since 1951.
The LESFMIP data that is used in this work can be downloaded from the ESGF portal https://esgf-ui.ceda.ac.uk/cog/search/cmip6-ceda/ (last access: May 2025). The HadSLP observations can be downloaded from https://www.metoffice.gov.uk/hadobs/hadslp2/ (last access: March 2024).
The supplement related to this article is available online at https://doi.org/10.5194/wcd-7-1331-2026-supplement.
DA: data analysis and manuscript writing. CIG: methodology conceptualization, manuscript writing, providing feedback, and procuring funding.
The contact author has declared that neither of the authors has any competing interests.
Publisher's note: Copernicus Publications remains neutral with regard to jurisdictional claims made in the text, published maps, institutional affiliations, or any other geographical representation in this paper. The authors bear the ultimate responsibility for providing appropriate place names. Views expressed in the text are those of the authors and do not necessarily reflect the views of the publisher.
This article is part of the special issue “Advances in annual to decadal prediction, projection, and attribution (WCD/ESD/ESSD/GMD inter-journal SI)”. It is not associated with a conference.
This research has been supported by the Israel Science Foundation (grant no. 1727/21) and the United States-Israel Binational Science Foundation (grant no. 2020316).
This paper was edited by Yen-Ting Hwang and reviewed by Osamu Miyawaki and two anonymous referees.
Adam, O., Grise, K. M., Staten, P., Simpson, I. R., Davis, S. M., Davis, N. A., Waugh, D. W., Birner, T., and Ming, A.: The TropD software package (v1): standardized methods for calculating tropical-width diagnostics, Geosci. Model Dev., 11, 4339–4357, https://doi.org/10.5194/gmd-11-4339-2018, 2018. a
Allan, R. and Ansell, T.: A New Globally Complete Monthly Historical Gridded Mean Sea Level Pressure Dataset (HadSLP2): 1850–2004, J. Climate, 19, 5816–5842, https://doi.org/10.1175/JCLI3937.1, 2006. a
Baldwin, M. P., Ayarzagüena, B., Birner, T., Butchart, N., Butler, A. H., Charlton-Perez, A. J., Domeisen, D. I. V., Garfinkel, C. I., Garny, H., Gerber, E. P., Hegglin, M. I., Langematz, U., and Pedatella, N. M.: Sudden stratospheric warmings, Rev. Geophys., 59, e2020RG000708, https://doi.org/10.1029/2020RG000708, 2021. a
Cos, J., Doblas-Reyes, F., Jury, M., Marcos, R., Bretonnière, P.-A., and Samsó, M.: The Mediterranean climate change hotspot in the CMIP5 and CMIP6 projections, Earth Syst. Dynam., 13, 321–340, https://doi.org/10.5194/esd-13-321-2022, 2022. a, b
Dai, Y., Hitchcock, P., Butler, A. H., Garfinkel, C. I., and Seviour, W. J. M.: Assessing stratospheric contributions to subseasonal predictions of precipitation after the 2018 SSW from SNAPSI, EGUsphere [preprint], https://doi.org/10.5194/egusphere-2025-484, 2025. a, b
Delworth, T. L., Cooke, W. F., V. Naik, D. P., and Zhang, L.: A weakened AMOC may prolong greenhouse gas-induced Mediterranean drying even with significant and rapid climate change mitigation, Proc. Natl. Acad. Sci. USA, 119, e2116655119, https://doi.org/10.1073/pnas.2116655119, 2022. a, b
Domeisen, D. I. V.: Estimating the Frequency of Sudden Stratospheric Warming Events From Surface Observations of the North Atlantic Oscillation, J. Geophys. Res.-Atmos., 124, 3180–3194, https://doi.org/10.1029/2018JD030077, 2019. a
Elbaum, E., Garfinkel, C. I., Adam, O., Morin, E., Rostkier-Edelstein, D., and Dayan, U.: Uncertainty inprojected changes in precipitation minusevaporation: Dominant role of dynamiccirculation changes and weak role forthermodynamic changes, Geophys. Res. Lett., 49, e2022GL097725, https://doi.org/10.1029/2022GL097725, 2022. a, b, c, d, e, f
Findell, K. L., Sutton, R., Caltabiano, N., Brookshaw, A., Heimbach, P., Kimoto, M., Osprey, S., Smith, D., Risbey, J. S., Wang, Z., Cheng, L., Diaz, L. B., Donat, M. G., Ek, M., Lee, J.-Y., Minobe, S., Rusticucci, M., Vitart, F., and Wang, L.: Explaining and Predicting Earth System Change A World Climate Research Programme Call to Action, Bull. Am. Meteorol. Soc., 104, E325–E339, https://doi.org/10.1175/BAMS-D-21-0280.1, 2023. a
Garfinkel, C. I., Adam, O., Morin, E., Enzel, Y., Elbaum, E., Bartov, M., Rostkier-Edelstein, D., and Dayan, U.: The Role of Zonally Averaged Climate Change in Contributing to Intermodel Spread in CMIP5 Predicted Local Precipitation Changes, J. Climate, 33, 1141–1154, https://doi.org/10.1175/JCLI-D-19-0232.1, 2020. a, b, c, d, e, f, g
Garfinkel, C. I., Keller, B., Lachmy, O., White, I., Gerber, E. P., Jucker, M., and Adam, O.: Impact of parameterized convection on the storm track and near-surface jet response to global warming: Implications for mechanisms of the future poleward shift, J. Climate, 37, 2541–2564, https://doi.org/10.1175/JCLI-D-23-0105.1, 2024. a, b
Gervais, M., Shaman, J., and Kushnir, Y.: Impacts of the North Atlantic warming hole in future climate projections: Mean atmospheric circulation and the North Atlantic jet, J. Climate, 32, 2673–2689, 2019. a
Giorgi, F.: Climate change hot-spots, Geophys. Res. Lett., 33, L08707, https://doi.org/10.1029/2006GL025734, 2006. a
Grise, K. M. and Polvani, L. M.: Is climate sensitivity related to dynamical sensitivity?, J. Geophys. Res.-Atmos., 121, 5159–5176, https://doi.org/10.1002/2015JD024687, 2016. a, b
He, J. and Soden, B. J.: A re-examination of the projected subtropical precipitation decline, Nat. Clim. Chang., 7, 53–57, https://doi.org/10.1038/nclimate3157, 2017. a
Held, I. M. and Soden, B. J.: Robust Responses of the Hydrological Cycle to Global Warming, J. Climate, 19, 5686–5699, https://doi.org/10.1175/JCLI3990.1, 2006. a, b, c, d
Kang, J. M., Shaw, T. A., and Sun, L.: Anthropogenic Aerosols Have Significantly Weakened the Regional Summertime Circulation in the Northern Hemisphere During the Satellite Era, AGU Advances, 5, e2024AV001318, https://doi.org/10.1029/2024AV001318, 2024. a
Keller, B., Garfinkel, C. I., and Gerber, E. P.: Disentangling Projected Stationary Wave Changes: Implications for Future Drying of the Mediterranean Region, J. Climate, https://doi.org/10.1175/JCLI-D-24-0659.1, 2025. a, b, c, d, e
Kushnir, Y.: Mediterranean climate future: an insightful look into the Basin’s precipitation response to greenhouse gas forcing, Environ. Res. Lett., 10, 111001, https://doi.org/10.1088/1748-9326/10/11/111001, 2015. a, b, c
Lu, J., Vecchi, G. A., and Reichler, T.: Expansion of the Hadley cell under global warming, Geophys. Res. Lett., 34, L06805, https://doi.org/10.1029/2006GL028443, 2007. a
Rahmstorf, S., Box, J., Feulner, G., Mann, M. E., Robinson, A., Rutherford, S., and Schaffernicht, E. J.: Exceptional twentieth-century slowdown in Atlantic Ocean overturning circulation, Nat. Clim. Chang., 5, 475–480, https://doi.org/10.1038/nclimate2554, 2015. a
Schmidt, D. F. and Grise, K. M.: The response of local precipitation and sea level pressure to Hadley cell expansion, Geophys. Res. Lett., 44, 10–573, 2017a. a
Schmidt, D. F. and Grise, K. M.: The response of local precipitation and sea level pressure to Hadley cell expansion, Geophys. Res. Lett., 44, 10573–10582, https://doi.org/10.1002/2017GL075380, 2017b. a
Seager, R., Naik, N., and Vecchi, G. A.: Thermodynamic and Dynamic Mechanisms for Large-Scale Changes in the Hydrological Cycle in Response to Global Warming, J. Climate, 23, 4651–4668, https://doi.org/10.1175/2010JCLI3655.1, 2010. a
Seager, R., Liu, H. B., Henderson, N., Simpson, I., Kelley, C., Shaw, T., Kushnir, Y., and Ting, M. F.: Causes of Increasing aridification of the mediterranean region in response to rising greenhouse gases, J. Climate, 27, 4655–4676, https://doi.org/10.1175/JCLI-D-13-00446.1, 2014. a
Seager, R., Osborn, T. J., Simpson, Y. K. I. R., Nakamura, J., and Liu, H.: Climate Variability and Change of Mediterranean-Type Climates, J. Climate, 32, https://doi.org/10.1175/JCLI-D-18-0472.1, 2019. a, b
Seager, R., Yutian, W., Annalisa, C., Simpson, I. R., Osborn, T. J., Kushnir, Y., Lukovic, J., Liu, H., and Nakamura, J.: Recent and near-term future changes in impacts-relevant seasonal hydroclimate in the world's Mediterranean climate regions, Int. J. Climatol., 44, 3792–3820, https://doi.org/10.1002/joc.8551, 2024. a, b, c, d
Shaw, T. A., Arblaster, J. M., Birner, T., Butler, A. H., Domeisen, D. I. V., Garfinkel, C. I., H. Garny, K. M. G., and Karpechko, A. Y.: Emerging Climate Change Signals in Atmospheric Circulation, AGU Adv., 5, e2024AV001297, https://doi.org/10.1029/2024AV001297, 2024. a, b
Shepherd, T. G., Boyd, E., Calel, R. A., Chapman, S. C., Dessai, S., Dima-West, I. M., Fowler, H. J., James, R., Maraun, D., Martius, O., Senior, Catherine A., Sobel, A. H., Stainforth, D. A., Tett, S. F. B., Trenberth, K. E., van den Hurk, B. J. J. M., Watkins, N. W., Wilby, R. L., and Zenghelis, D. A.: Storylines: an alternative approach to representing uncertainty in physical aspects of climate change, Clim. Change, 151, 555–571, 2018. a
Simpson, I. R., Hitchcock, P., Seager, R., Wu, Y., and Callaghan, P.: The Downward Influence of Uncertainty in the Northern Hemisphere Stratospheric Polar Vortex Response to Climate Change, J. Climate, 31, 6371–6391, https://doi.org/10.1175/JCLI-D-18-0041.1, 2018. a, b
Smith, D. M., Gillett, N. P., Simpson, I. R., Athanasiadis, P. J., Baehr, J., Bethke, I., Bilge, T. A., Bonnet, R., Boucher, O., Findell, K. L., Gastineau, G., Gualdi, S., Hermanson, L., Leung, L. R., Mignot, J., Müller, W. A., Osprey, S., Otterå, O. H., Persad, G. G., Scaife, A., Schmidt, G. A., Shiogama, H., Sutton, R. T., Swingedouw, D., Yang, S., Zhou, T., and Ziehn, T.: Attribution of multi-annual to decadal changes in the climate system: The Large Ensemble Single Forcing Model Intercomparison Project (LESFMIP), Front. Clim., 4, 1, https://doi.org/10.3389/fclim.2022.955414, 2022. a
Smith, D. M., Dunstone, N. J., Eade, R., Hardiman, S. C., Hermanson, L., Scaife, A. A., and Seabrook, M.: Mitigation needed to avoid unprecedented multi-decadal North Atlantic Oscillation magnitude, Nat. Clim. Chang., 15, 403–410, https://doi.org/10.1038/s41558-025-02277-2, 2025. a
Tang, T., Shindell, D., Samset, B. H., Boucher, O., Forster, P. M., Hodnebrog, Ø., Myhre, G., Sillmann, J., Voulgarakis, A., Andrews, T., Faluvegi, G., Fläschner, D., Iversen, T., Kasoar, M., Kharin, V., Kirkevåg, A., Lamarque, J.-F., Olivié, D., Richardson, T., Stjern, C. W., and Takemura, T.: Dynamical response of Mediterranean precipitation to greenhouse gases and aerosols, Atmos. Chem. Phys., 18, 8439–8452, https://doi.org/10.5194/acp-18-8439-2018, 2018. a, b, c, d
Tuel, A. and Eltahir, E.: Why Is the Mediterranean a Climate Change Hot Spot?, J. Climate, 33, 5829–5843, https://doi.org/10.1175/JCLI-D-19-0910.1, 2020. a, b, c, d, e, f
Tuel, A., O’Gorman, P. A., and Eltahir, E.: Elements of the Dynamical Response to Climate Change over the Mediterranean, J. Climate, 34, 1135–1146, https://doi.org/10.1175/JCLI-D-20-0429.1, 2021. a
Vacca, A. V., Bellomo, K., and Fabiano, F.: On the role of AMOC weakening in shaping wintertime Euro-Atlantic atmospheric circulation, Clim. Dyn., 63, 273, https://doi.org/10.1007/s00382-025-07747-z, 2025. a
Vicente-Serrano, S., Tramblay, Y., Reig, F., et al.: High temporal variability not trend dominates Mediterranean precipitation, Nature, 639, 658–666, https://doi.org/10.1038/s41586-024-08576-6, 2025. a, b, c, d, e
Westervelt, D. M., Conley, A. J., Fiore, A. M., Lamarque, J.-F., Shindell, D. T., Previdi, M., Mascioli, N. R., Faluvegi, G., Correa, G., and Horowitz, L. W.: Connecting regional aerosol emissions reductions to local and remote precipitation responses, Atmos. Chem. Phys., 18, 12461–12475, https://doi.org/10.5194/acp-18-12461-2018, 2018. a
Zappa, G. and Shepherd, T. G.: Storylines of Atmospheric Circulation Change for European Regional Climate Impact Assessment, J. Climate, 30, 6561–6577, https://doi.org/10.1175/JCLI-D-16-0807.1, 2017. a
Zappa, G., Hawcroft, M. K., Shaffrey, L., Black, E., and Brayshaw, D. J.: Extratropical cyclones and the projected decline of winter Mediterranean precipitation in the CMIP5 models, Clim. Dyn., 45, 1727–1738, https://doi.org/10.1007/s00382-014-2426-8, 2015a. a
Zappa, G., Hoskin, B. J., and Shepherd, T. G.: The dependence of wintertime Mediterranean precipitation on the atmospheric circulation response to climate change, Environ. Res. Lett., 10, 104012, https://doi.org/10.1088/1748-9326/10/10/104012, 2015b. a, b, c, d, e
Zappa, G., Pithan, F., and Shepherd, T. G.: Multimodel evidence for an atmospheric circulation response to Arctic sea ice loss in the CMIP5 future projections, Geophys. Res. Lett., 45, 1011–1019, https://doi.org/10.1002/2017GL076096, 2018. a, b
Zelinka, M. D., Myers, T. A., D. T. McCoy, S. P.-C., Caldwell, P. M., Ceppi, P., Klein, S. A., and Taylor, K. E.: Causes of Higher Climate Sensitivity in CMIP6 Models, Geophys. Res. Lett., 47, e2019GL085782, https://doi.org/10.1029/2019GL085782, 2020. a
Zhang, C., Zhang, J., Xia, X., and Li, D.: Impact of Arctic Stratospheric Polar Vortex on Mediterranean Precipitation, J. Climate, 37, 4403–4419, https://doi.org/10.1175/JCLI-D-23-0469.1, 2024. a, b
Zhang, J., Zhang, C., Zhao, S., Liu, Y., Du, S., Wang, W., Huang, J., and Xu, M.: Impacts of the Arctic stratospheric polar vortex changes on the frontogenesis over the northern middle latitudes during winter, Atmos. Res., 289, 106751, https://doi.org/10.1016/j.atmosres.2023.106751, 2023. a