
the Creative Commons Attribution 4.0 License.
the Creative Commons Attribution 4.0 License.
 | 28 Jul 2026
Seasonal prediction of springtime tornado activity in the United States using a hybrid model
Matthew Graber
Robert J. Trapp
Tornado activity in the contiguous United States (CONUS) causes fatalities and financial losses every spring, motivating attempts to skillfully predict springtime tornadoes. Such predictions would facilitate decision-making and resource management for both public and private stakeholders. Using ERA5 reanalysis, we analyze five April–May weather regimes (WRs) from 1981–2023, some of which strongly modulate tornado activity. The WR information is incorporated into a hybrid model to predict April–May CONUS tornado activity, including tornado outbreaks (days with > 10 EF-1+ tornadoes). ECMWF seasonal forecasts initialized on 1 April are applied to predict WR frequency, including persistent and non-persistent WRs (lasting ≥ 5 and < 5 consecutive days, respectively). Prediction skill is evaluated using leave-one-year-out cross-validation. Predicted and observed tornado outbreak frequencies are significantly correlated (cc = 0.38). Outbreak predictions are more skillful during the positive phase of the Arctic Oscillation (AO) and Pacific North American pattern (PNA), with a proportion correct of 0.75 and 0.71, respectively. In general, model skill is higher during climate mode phases that favor suppressed tornado activity. This implies that climate modes of low-frequency variability can be used to identify forecasts of opportunity for low tornado activity. SSTs over the North Pacific and North Atlantic may help explain the predictability of tornado activity, specifically a +PNA pattern for years of low tornado activity, but further research is needed to confirm those results. Our study demonstrates the potential for skillful prediction of spring tornado outbreaks using WR forecasts and should be prioritized in future work.
- Article
(1649 KB) - Full-text XML
- Companion paper
-
Supplement
(1705 KB) - BibTeX
- EndNote


Tornadoes in the contiguous United States (CONUS) result in significant losses of life and property (Ashley, 2007; Smith, 2020; Strader et al., 2024). From 1981–2023 there were 2833 tornado-related fatalities in the CONUS, accounting for ∼ 13 % of weather-related fatalities (National Weather Service, 2025). Of these tornado-related fatalities, roughly 76 % are associated with tornado outbreaks (TOs; hereinafter, days with > 10 EF/F-1 tornadoes; Graber et al., 2025), consistent with Schneider et al. (2004). Recent studies show a statistically significant increasing trend of +2.5 TOs per decade since 1960, the majority of which occur in the boreal spring (Brooks et al., 2014; Graber et al., 2024). Given these trends of tornado activity and their societal impacts, skillful seasonal predictions of springtime tornado activity would improve decision-making and resource management for both public and private stakeholders.
Subseasonal-to-seasonal (S2S) predictability of tornado activity has been previously investigated. Deterministic and probabilistic GEFS forecasts demonstrated skill in predicting tornado activity out to day 9 (Gensini and Tippett, 2019). The Extended-Range Tornado Activity Forecast (ERTAF) project (Gensini et al., 2020) produced tercile-forecasts 2–3 weeks in advance during boreal spring and found predictive skill at both lead times. ERTAF emphasized the role of large-scale circulation patterns in conjunction with favorable severe thunderstorm environments, such as adequate convective available potential energy (CAPE) and vertical wind shear (VWS). Baggett et al. (2018) developed an empirical model using Madden Julian Oscillation phases and skillfully predicted weekly severe weather forecasts out 2–5 weeks in March–June. Similarly, Lepore et al. (2017) applied extended logistic regression based on the winter El Niño–Southern Oscillation (ENSO) phase to predict tornadoes in March–May, and found that the tornado prediction skill is higher during La Niña years compared to El Niño years. This background motivates the work herein that seeks to further explore skillful seasonal prediction of tornado activity.
Modes of climate variability are important drivers of seasonal tornado activity and can serve as sources of their predictability. Since tornado activity depends on favorable thermodynamic and dynamic environments (Thompson et al., 2003), shifts in jet streams or moisture transport associated with low-frequency climate variability may enhance or suppress springtime severe weather potential across the CONUS (Cook and Schaefer, 2008). A major mode of interannual climate variability is ENSO (Chen and Van den Dool, 1997), which is characterized by the anomalous warming (El Niño) and cooling (La Niña) of sea-surface temperatures (SSTs) in the central and eastern equatorial Pacific (Bjerknes, 1969). ENSO modulates the strength and position of the Pacific jet stream (Bjerknes, 1969) and can affect the large-scale circulations that influence the frequency, intensity, and spatial locations of CONUS severe weather. Previous studies have linked the winter ENSO phase to the variability of tornado activity, with increased springtime tornado activity during the La Niña phase, particularly in the Southeast (Allen et al., 2015, 2018; Cook and Schaefer, 2008; Knowles and Pielke, 2005; Lee et al., 2016; Malloy and Tippett, 2024).
The Arctic Oscillation (AO) and North Atlantic Oscillation (NAO) are prominent modes of climate variability in the extratropics (Cohen et al., 2014). Specifically, the AO refers to the leading EOF of variability in Northern Hemisphere sea-level pressures at mid and polar latitudes, while the NAO refers to the sea-level pressure difference between the Subtropical High and Subpolar Low over the North Atlantic (Hurrell, 1995; Hurrell and Deser, 2010; Thompson and Wallace, 2000; Wyburn-Powell and Jahn, 2024). NAO and AO are strongly correlated and modulate the strength and position of the midlatitude jet stream. Previous work has demonstrated that NAO and AO influence tornado activity across the central and eastern CONUS. The positive AO phase is associated with enhanced winter and early-spring tornado activity in the Southeast (Childs et al., 2018; Hoogewind et al., 2025a; Niloufar et al., 2021; Tippett et al., 2022), while the positive NAO phase corresponds to anomalously low springtime tornado activity in the Southeast and Central Plains (Elsner et al., 2016; Niloufar et al., 2021). These relationships indicate that the NAO and AO may provide additional sources of predictability for springtime tornado activity.
Another important mode is the Pacific North American (PNA) pattern, which is a leading mode of low-frequency variability over the North Pacific and North America (Phillips et al., 2014). Although the PNA is influenced by ENSO (Wallace and Gutzler, 1981), it exhibits some independent variability (Li et al., 2019) and can exist in the absence of interannual SST variability (Lau, 1981). PNA modulates the position and intensity of the East Asian jet stream which influences large-scale circulations relevant for severe weather over the CONUS (Leathers et al., 1991; Li et al., 2019; Ning and Bradley, 2015). The negative phase of PNA has been associated with enhanced springtime tornado activity and high-impact tornado outbreaks (Kim et al., 2024; Muñoz and Enfield, 2011). These relationships suggest that PNA, along with ENSO, AO, and NAO, potentially serve as sources of predictability for springtime tornado activity.
There is growing evidence that SST variability, which in some cases is related to climate modes, could serve as a source of predictability for seasonal tornado activity. Increasing CONUS tornado activity has been previously linked to global SST increases, with anomalously warm North Pacific SSTs associated with enhanced tornado activity (Zhao et al., 2025). Additional work shows that North Pacific SST anomalies can influence the variability of tornado activity through PNA-like circulation anomalies, including an eastward shift of the Aleutian Low and enhanced moisture transport from the Gulf of Mexico (Chu et al., 2019). The North Atlantic tripole SST pattern, which reinforces the NAO through positive air-sea interactions (Czaja and Frankignoul, 2002), has been linked to CONUS tornado outbreaks (Lee et al., 2016). Gulf of Mexico SSTs also modulate spring tornado frequency with anomalously warm (cool) Gulf SSTs favoring more (fewer) CONUS tornadoes (Hoogewind et al., 2025b; Molina et al., 2016). These Gulf SSTs are also somewhat dependent on the phase of ENSO with La Niña (El Niño) favoring warmer (cooler) SSTs. These studies motivate a closer examination of how SSTs may serve as an additional source of predictability for springtime tornado activity.
A limitation of such SST variability as well as of climate modes is that they do not fully capture the synoptic-scale variability of atmospheric circulation. Weather regimes (WRs) can effectively bridge the gap. WRs represent a finite number of equilibrium, recurring states of the atmospheric circulation (Charney and DeVore, 1979; Hannachi et al., 2017; Michelangeli et al., 1995). Miller et al. (2020) is among the first to apply WRs to tornado prediction. They constructed a hybrid prediction model for weekly tornado activity in May using WRs and achieved skillful prediction out to week 3. Tippett et al. (2024) explored the modulation of tornado activity using year-round WRs (Grams et al., 2017; Lee et al., 2023) and found statistically significant relationships between tornado reports and WRs during all months except June–August, with the frequency of the Pacific Ridge WR days being the main driver of the relationship with tornado reports. Graber et al. (2025) identified two WRs that strongly affect the warm-season tornado activity, especially TOs, and developed an empirical model using WR frequency, persistence, and probability of tornado days (TDs; hereinafter, days with ≥ 1 EF/F-1+ tornadoes). The empirical model skillfully captured the interannual variability of both TDs and TOs using WR information derived from the ERA5 reanalysis. Such a demonstration of empirical model skill by Graber et al. (2025) suggests that WR-based models provide an avenue for improving seasonal tornado prediction beyond the capabilities of current operational model guidance.
The remainder of this paper is organized as follows. Section 2 describes the data and methodology, including the hybrid model. Section 3 presents the hybrid predictions and a discussion of the sources of predictability that help connect the WRs, tornado activity, and climate modes together. The paper culminates with a summary and discussion in Sect. 4.
2.1 Weather Regimes
Daily 500-hPa heights (500H) from the European Centre for Medium-Range Weather Forecasts (ECMWF) reanalysis, version 5 (ERA5) (Hersbach et al., 2020) were used to analyze weather regimes (WRs) during April–May, the season of peak tornado activity (Graber et al., 2024), from 1981–2023. The seasonal cycle, defined as the long-term mean 500H for each calendar day, was removed from daily 500H. Unlike Graber et al. (2025), we did not remove the long-term linear trend in 500H of ERA5 to be consistent with the ECMWF seasonal forecast data. Rather than re-deriving WRs for this period, we used the WRs derived by Graber et al. (2025) using the K-means clustering method for 1960–2022 April–July as the reference WR patterns. WRs were assigned by finding the reference WR pattern with the smallest Euclidean distance from the daily 500H anomalies. We took this approach because K-means clustering yields slightly different WR patterns in different time periods and employing WRs during a longer time period as the reference patterns improves the robustness of the results.
Seasonal forecasts of daily 500H anomalies from the ECMWF were used to predict April−May WR frequency from 1981–2023 (Copernicus Climate Change Service, Climate Data Store, 2018; Vitart et al., 2017). The 25-ensemble forecasts are initialized once per month, are available on a 1° × 1° grid, are on 12 h temporal resolution, and go out 7 months. The forecasts initialized on 1 April were selected to mitigate the effect of the spring-predictability barrier (Duan and Wei, 2012). WRs were assigned for each ensemble forecast by projecting the forecast 500H anomalies to the reference WR patterns, and the resultant long-term mean WR frequencies are similar to those derived from ERA5. Persistent and nonpersistent WRs are defined as WRs lasting for ≥ 5 consecutive days and for < 5 consecutive days, respectively.
2.2 Tornado observations
Tornado reports during April–May 1981–2023 were obtained from the NOAA Storm Prediction Center Severe Weather Database. Reports are georeferenced with time, date, and EF/F rating. To be consistent with previous work, tornado days (TDs) are defined as days with ≥ 1 tornadoes ranked EF/F-1 or greater, and tornado outbreaks (TOs) are defined as any day with > 10 tornadoes ranked EF/F-1 or greater (Graber et al., 2024, 2025). EF/F-0 reports were excluded due to reporting uncertainties (Brooks et al., 2014; Trapp, 2013). Known biases remain in this database, which a focus on TDs rather than raw tornado reports attempts to alleviate (Brooks et al., 2014; Graber et al., 2024; Trapp, 2014).
2.3 Hybrid model
Following Graber et al. (2025), an empirical model was used to evaluate the seasonal prediction of tornado activity:
where Pi denotes the TD probability for each WR, which is defined as the number of TDs with WR-i divided by the number of total WR-i days. The predictand, TI(t), which is the tornado index for year t, is computed using the seasonal count of WR-i days in year t, f(i,t), multiplied by Pi. TD probabilities and counts were calculated for persistent and nonpersistent WRs separately, denoted by subscripts p and np, respectively. The same procedure was applied to TOs.
To evaluate tornado prediction skill, a leave-one-year-out cross-validation method was employed. For example, 1981 was first held for testing, and Pi,np and Pi,p were determined using the WR information derived from the ERA5 reanalysis and tornado reports during 1982–2023. The seasonal WR counts from the ECMWF ensemble forecasts for 1981 were used in Eq. (1) to predict the tornado index value in 1981. This process was repeated for each year, yielding a predicted time series of the tornado index. The tornado index time series for all ensemble members were averaged to form the ensemble mean of tornado index, which was standardized using z-score normalization.
The prediction skill was quantified using the Pearson correlation between the predicted and observed tornado index time series. Additionally, a three-tier categorical verification was used by classifying both observed and predicted tornado index values into lower (0th–33rd percentile), middle (33rd–67th percentile), and upper (67th–100th percentile) terciles. A correct prediction was recorded when the observed and predicted tornado index values fell within the same tercile for a given year. The proportion correct (PC) is defined as the number of correct predictions divided by the number of total predictions.
To assess the potential impacts of climate modes on tornado predictability, PC was calculated separately for positive, negative, and neutral phases of various climate modes (see more information on climate modes in Sect. 2.4). Significance (p ≤ 0.05) between PC of each phase and random chance (33 % for three-tier verification) was determined using a Monte Carlo test with 10 000 resamples.
2.4 Sources of Predictability
The impacts of some climate modes, ENSO (via Nino3.4), PNA, NAO, and AO, on tornado activity and WR counts were investigated to provide a physical basis for TD and TO predictability. We focus on their low-frequency variability on the seasonal and longer time scales and derived their April–May seasonal indices using the data from the NOAA Climate Prediction Center (2024a, b). Positive and negative phases of a climate mode are defined as the years when the standardized springtime (April–May) index exceeded ±0.9. 0.9 was used instead of 1.0 to slightly increase the sample size.
TD and TO probability anomalies were calculated for each climate mode phase as:
where the climatological mean TD (TO) probability (Pc) is defined as the total number of TDs (TOs) divided by the total number of days; Pr is TD (TO) probability for the given phase of the climate mode; and Pa is the percentage anomaly.
In addition, SSTs were investigated as a possible source of TO predictability. SST and 500H composite years were selected as years in which the April–May TO count exceeds +1 standard deviation (active) or falls below −1 standard deviation (inactive) relative to the 1960–2023 mean. Extended Range SST (ERSST) (Huang et al., 2017) of 2° × 2° resolution is used here, and we focus on SST anomalies in April because SST signals for TOs in April are more pronounced than in May based on a previous study (Chu et al., 2019) and our own analysis. In addition, the analysis is done for 1960–2023 to increase the sample size..
3.1 Model Prediction
For completeness, the five WRs (Fig. 1a–e) are briefly described here. WR-A features anomalous highs over the Pacific Northwest and off the US east coast. WR-B is characterized by a prevailing anomalous low centered over central North America and an anomalous high over the Southeast. WR-C exhibits a three-cell wave pattern with anomalous lows over both coasts. WR-D and WR-E display west-east dipole patterns that nearly mirror each other. The WR spatial structures closely resemble WRs in Miller et al. (2020), Zhang et al. (2024), and Lee et al. (2023). Specifically, WR-B and WR-E resemble the Pacific Ridge and Alaskan Ridge regimes in Lee et al. (2023), respectively, but noticeable differences exist due to differences in data processing procedures and the time periods analyzed. The impacts of the WRs on CONUS tornado activity during April–May 1981–2023 (Fig. 1f and h) are similar to those during April–July 1960–2022 from Graber et al. (2025; their Fig. 4). WR-A is the least favorable WR for springtime tornado activity, and WR-B is the most favorable. Tornado activity in WR-C and WR-E are slightly unfavorable, and in WR-D is slightly favorable. The estimated TDs and TOs based on the empirical model (Eq. 1) and the ERA5 during April–May 1981–2023 are significantly correlated with the observed time series (Fig. 1g and i).
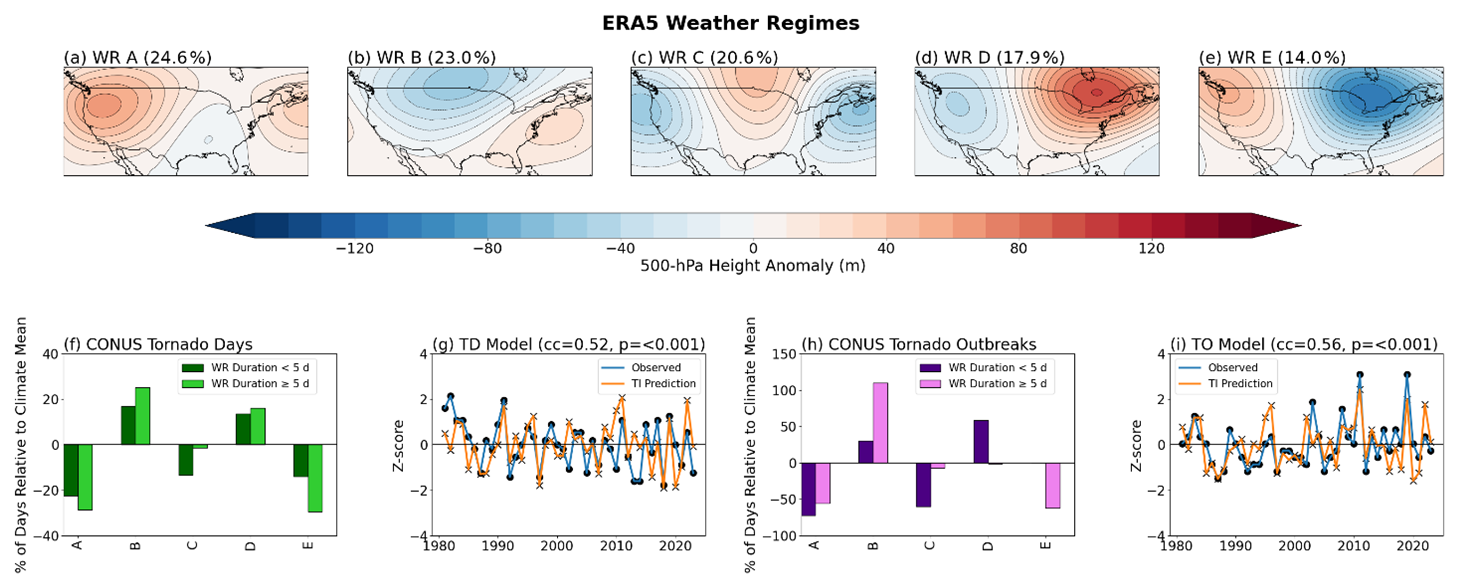
Figure 1500H anomaly patterns of WRs A-E with long-term frequency indicated in panel title (a–e). ERA5 tornado day (f) and tornado outbreak (h) CONUS probability anomalies for persistent (≥ 5 d; light green, pink) and nonpersistent (< 5 d; dark green, indigo) WRs. Time series of standardized tornado days (g) and tornado outbreak days (i) from the observation (blue) and estimation of the empirical modeling (red). Spearman rank correlation and p value are indicated in panels (g) and (i).
Before assessing the hybrid predictions of tornado activity, we first evaluate the prediction skill of WRs by the ECMWF springtime forecasts. The ECMWF ensemble mean prediction of springtime WR counts are significantly correlated with the ERA5 springtime WR counts (Fig. 2a–e). This indicates the seasonal predictability of WRs and provides the basis for tornado prediction using the hybrid framework (i.e., Eq. 1).
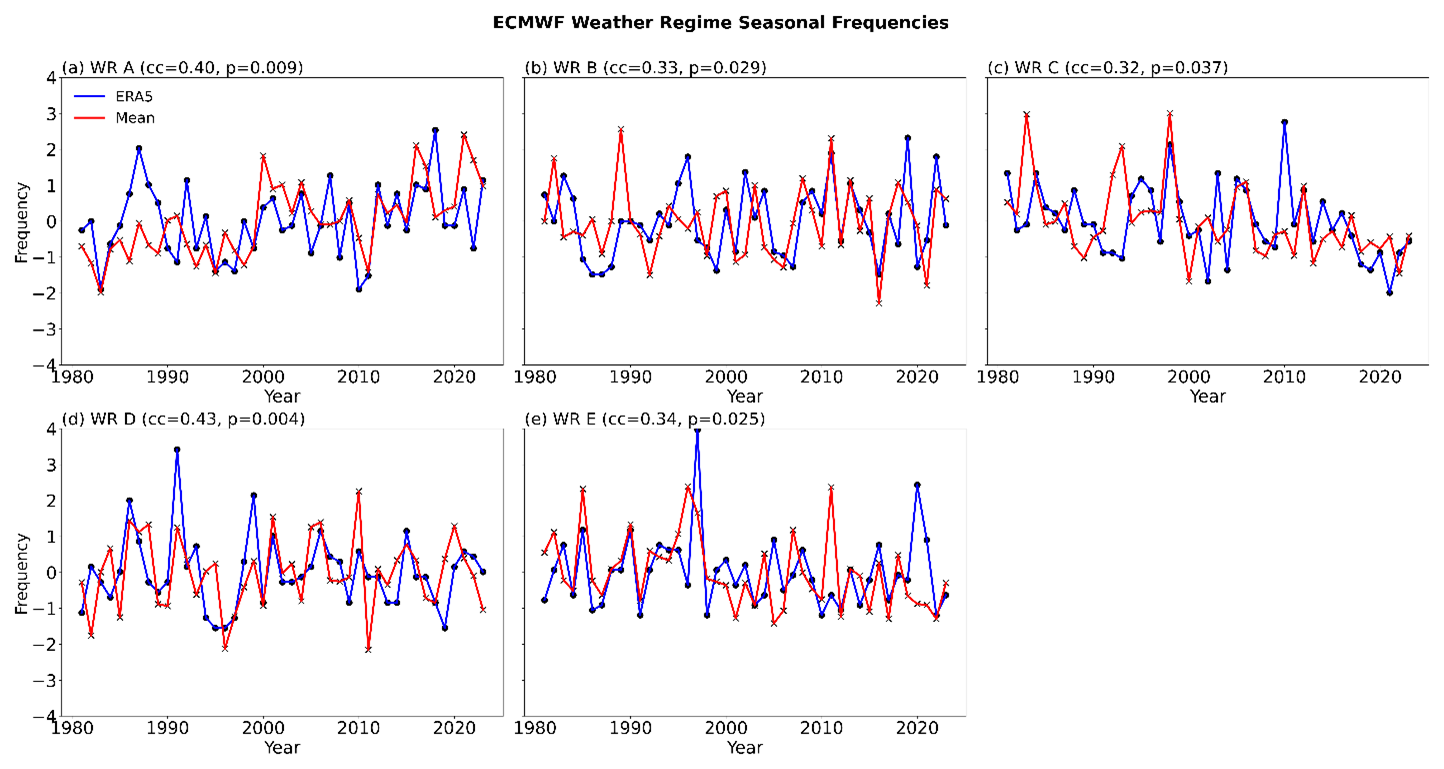
Figure 2Z-score normalized ERA5 (blue) and ECMWF ensemble mean (red) springtime frequency of each WR with Spearman rank correlation and p value indicated in each panel (a–e).
We assess the hybrid predictions of TDs and TOs using leave-one-year-out cross-validation method (Fig. 3). The hybrid prediction of TOs has a significant Pearson correlation of 0.38 with the observed TO time series, while TD prediction shows no skill, with a Pearson correlation close to zero. The skill contrast between the TO and TD predictions is probably because TOs usually occur under strong and persistent synoptic-scale patterns (Mercer et al., 2012; Cwik et al., 2022; Jiang et al., 2025; Graber et al., 2025), while transient (i.e., non-persistent) and weak patterns (e.g., patterns with weaker 500H anomalies than those associated with TOs), which are not well captured by the ECMWF springtime forecasts, may have strong impacts on TDs. In addition, it is worth noting that the percentage anomalies of TOs associated with various WRs are generally stronger than those of TDs (Fig. 1).
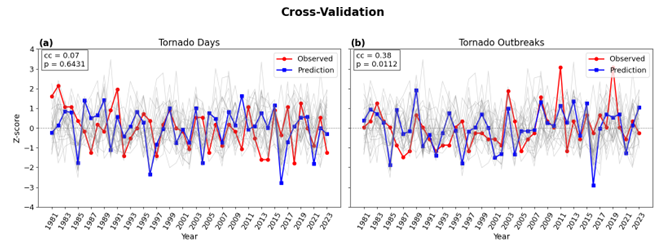
Figure 3Standardized TDs (a) and TOs (b) time series from observation (red) and the hybrid prediction (blue). Thin gray lines represent the individual ensemble prediction (grey) time series. Pearson correlations (cc) and p values (p) are shown at the upper left corner of each panel.
We also evaluated the tercile-based predictions using the TO and TD time series in Fig. 3 (see the tercile thresholds in Table S1 in the Supplement). The hybrid model correctly predicts TO terciles 53.5 % of years. Additionally, the PC is strongly modulated by some climate modes (Fig. 4). In particular, the hybrid model performs significantly better during the positive phases of the AO (75 % of correct prediction), NAO (71.4 %), PNA (71.4 %), and ENSO (70.0 %). PC also improves in the negative phases of NAO (62.5 %), AO (55.6 %), and ENSO (55.6 %), but the increases in PC are not significant (p > 0.05). In contrast, the PC in a neutral phase is below 53.5 %. Although the PC of the tercile-based TD prediction is close to random chance (34.9 %), the hybrid model performs better in +PNA years (57.1 %, p = 0.23) (figure not shown). This suggests that climate modes may be used to identify forecasts of opportunity for springtime tornado prediction.
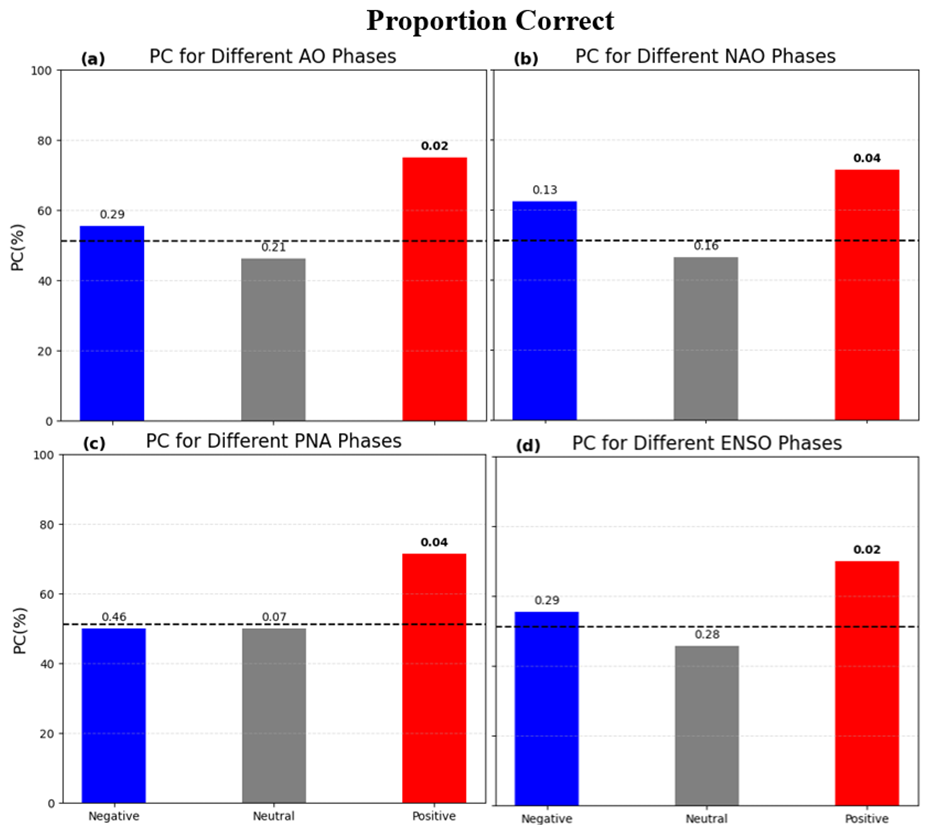
Figure 4Proportion of correct TO predictions for negative (blue), neutral (grey), and positive (red) phases of AO (a) and NAO (b), PNA (c), and ENSO (d). Numbers above the bars represent p values using a Monte Carlo test with 10 000 resamples, and bold values represent significant (p ≤ 0.05) differences from random chance. The dashed, horizontal line represents the overall PC (i.e., 53.5 %).
Additional cross-validation tests by leaving 2-, 3-, 4-, and 6-year out yield similar results (Fig. S1 in the Supplement). TO predictions maintain skillful across all tests, while TD predictions remain unskillful. Given the low model skill (Fig. 3) and weaker connection to WRs for TDs (Fig. 1), the remainder of this paper focuses solely on TOs.
3.2 Climate modes as sources of Predictability
To investigate predictability sources for tornado activity, the relationship between tornado activity and low-frequency variability of climate modes is examined using springtime TO probability anomalies associated with the AO, NAO, PNA, and ENSO phases (Fig. 5a–d). In addition to CONUS, we examined different regions, Midwest, Southern Great Plains (SGP), Southeast, and Southern Great Plains (SGP) (Fig. S2). The region definitions follow Moore (2018), with exception of the SGP, which herein contains New Mexico because it has storm events similar to those in the Texas Panhandle.
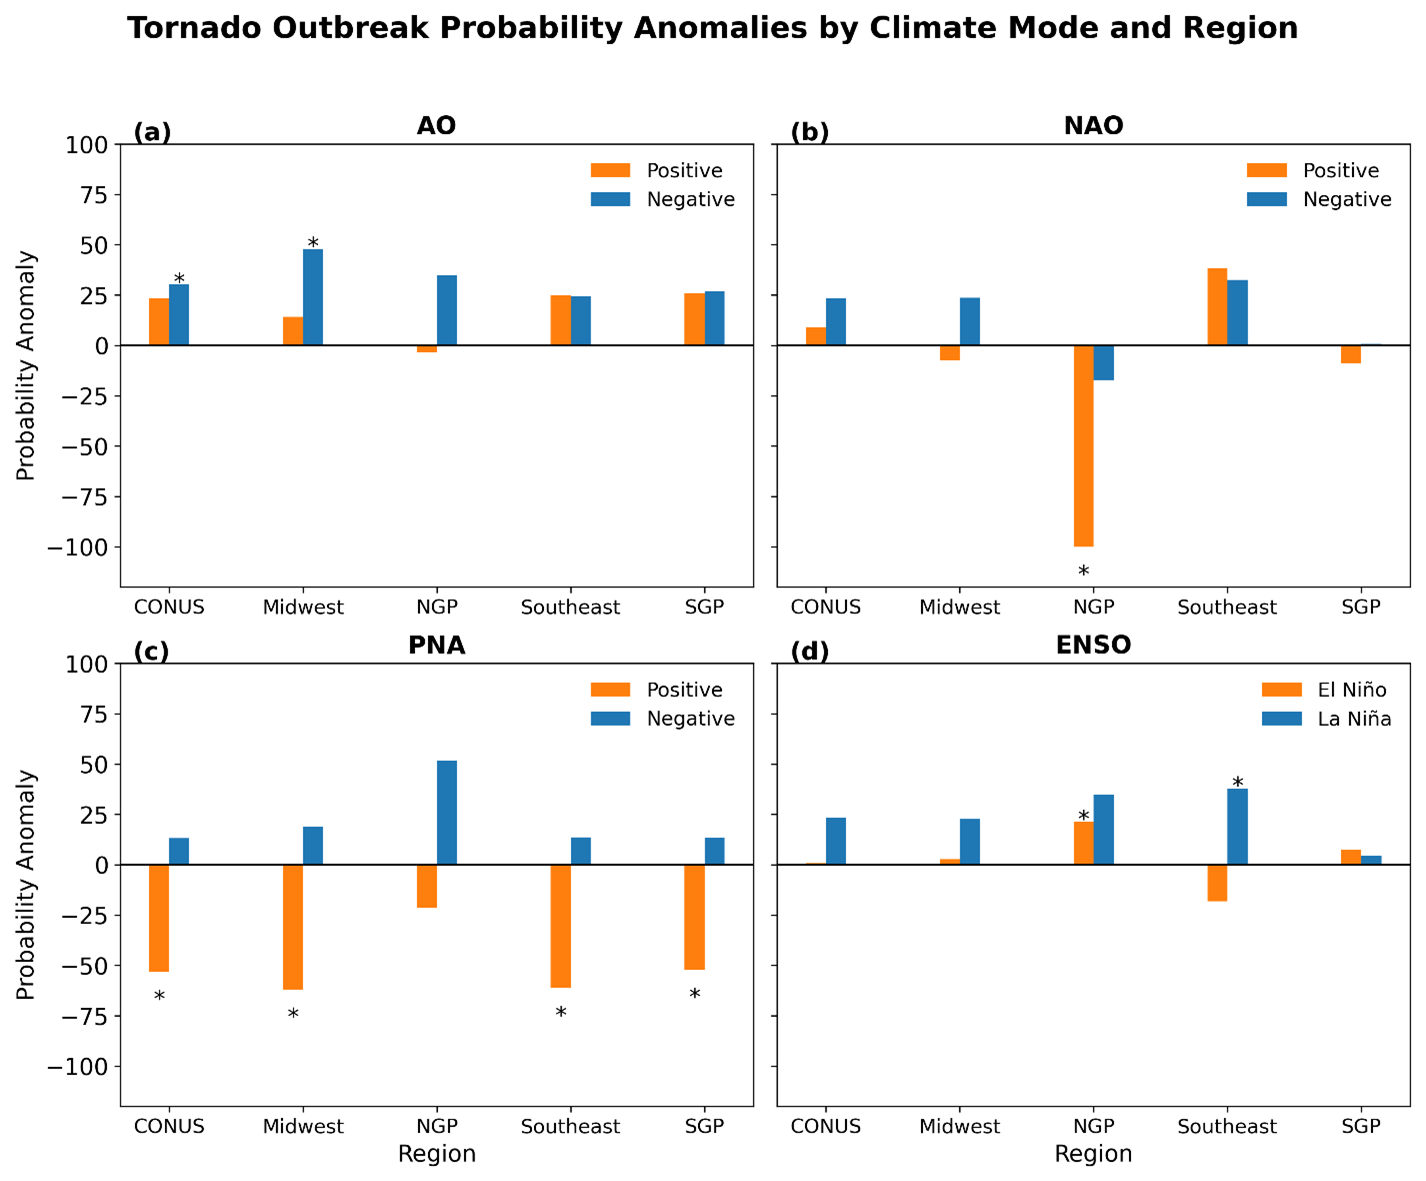
Figure 5TO probability anomalies by region and climate mode: AO (a), NAO (b), PNA (c), and ENSO (d). Asterisks represent significant anomalies (p ≤ 0.05) based on a Monte Carlo test with 10 000 resamples of each regions' data.
Significantly enhanced TO probability in the CONUS and Midwest is associated with the −AO phase. TO probability is also enhanced in the Southeast, NGP and SGP, but the anomalies are not statistically significant. +AO years are characterized by an anomalous high over the southeastern CONUS and negative anomalies over the north-central CONUS (Fig. S3a), implying enhanced westerly flow aloft and promoting moisture and warm-air advection from the Gulf of Mexico. These circulation anomalies lead to positive MUCAPE and TO probability anomalies over the Southeast and SGP (Fig. S3a). In contrast, −AO years feature negative 500H anomalies over the central CONUS, accompanied by anomalously positive VWS (Fig. S3b). Increased VWS supports positive TO probability anomalies when it occurs on days where MUCAPE is high (Diffenbaugh et al., 2013; Sherburn et al., 2016). These positive TO probability anomalies during −AO are only statistically significant over the Midwest, consistent with the region of anomalously positive VWS anomalies.
The TO probability anomalies during the NAO phases are generally consistent in sign with those during AO phases when one phase is statistically significant, but quantitative differences exist. TO probability is reduced significantly over the NGP during the +NAO phase. +NAO years feature an anomalous 500H high over the west-central CONUS, which hinders moisture and heat transport from the Gulf of Mexico. Additionally, anomalously low VWS over the SGP further limits tornado potential during +NAO years. However, +NAO years also feature an anomalous 500H high over the western Atlantic and anomalous 500H low over the Southeast, which enhances southerly flow and moisture transport into the Southeast (Zhao et al., 2025), supporting positive MUCAPE anomalies (Fig. S3c) and corresponding positive TO probability anomalies in that region (Fig. 5b).
The positive PNA phase (+PNA) is unfavorable for TOs across the CONUS, Midwest, SGP, and Southeast (Fig. 5c). +PNA years feature an anomalous 500H high over the western CONUS and an anomalous 500H low over the eastern CONUS (Fig. S3e), implying reduced moisture transport from the Gulf of Mexico and anomalously low MUCAPE and VWS. These circulation anomalies hinder tornado activity across the Midwest, SGP, and Southeast. Positive TO probability anomalies are present across the CONUS in the negative phase of PNA (Fig. 5c), though there is no clear circulation pattern over the CONUS during these years (Fig. S3f). Springtime PNA has become more negative over time (Fig. S4), possibly explaining the increasing trend in TOs (Graber et al., 2024), though further work with other seasons needs to be done to confirm this, which goes beyond the scope of this study.
TO probability is enhanced in La Nina years in various regions and is accompanied by positive VWS anomalies, although the TO enhancement is significant only in the Southeast. Additionally, TO probability over the NGP are enhanced in El Niño years. The La Niña-tornado-activity link is largely consistent with previous work (e.g., Cook and Schaefer, 2008; Cook et al., 2017; Tippett et al., 2022; Allen et al., 2015; Moore, 2019), but it is worth noting that the ENSO state in the springtime is examined here, while some previous studies focus on the winter ENSO state. Previous studies have found that ENSO modulates the phase of PNA during boreal winter (Li et al., 2019; Soulard et al., 2019); however, these spring results are not consistent with those findings. Accordingly, the correlation between the ENSO and PNA indices are much stronger during the peak stage of ENSO in December than during the ENSO decay stage in April–May (Fig. S5).
The model appears to perform better (Fig. 4) in years when climate modes unfavorable for TOs, such as +NAO and +PNA, are present. To further evaluate skill, the Threat Score (Schaefer, 1990) was calculated for upper-tercile TO years. These years yield a Threat Score of 0.375 with 6 hits, 2 misses, and 8 false alarms, indicating a tendency for the model to overpredict TOs. For lower-tercile years, the Threat Score is slightly higher at 0.429, with 9 hits, 7 misses, and 5 false alarms. While lower-tercile years have greater overall skill, they also include more misses. Overall, the model demonstrates higher skill for lower-tercile years, and modest skill for upper-tercile years.
Overall, the link between climate modes and tornado activity suggests that some climate modes provide a source of predictability for springtime TO prediction, and that the predictability seems slightly higher during inactive years for tornado activity.
The connection between climate modes and WRs is examined next to investigate whether climate modes modulate tornado activity via WRs. Figure 6 shows the relative likelihood of each WR during different phases of climate modes, expressed as the ratio of its phase-specific frequency to its climatological frequency. WR-A is ∼ 36 % less likely to occur during the −AO phase, while WR-B is ∼ 35 % more likely to occur (Fig. 6a). The increased occurrence of WR-B and decreased occurrence of WR-A in −AO years compared to the long-term mean (Fig. 1) are consistent with the positive TO probability anomalies in the CONUS and Midwest during the −AO years (Fig. 5). WR-D is ∼ 27 % less likely to occur during −AO, so the above average tornado activity in −AO (Fig. 5a) is mainly due to above average frequency of WR-B. Additionally, WR-A is ∼ 21 % more likely to occur during +AO years.
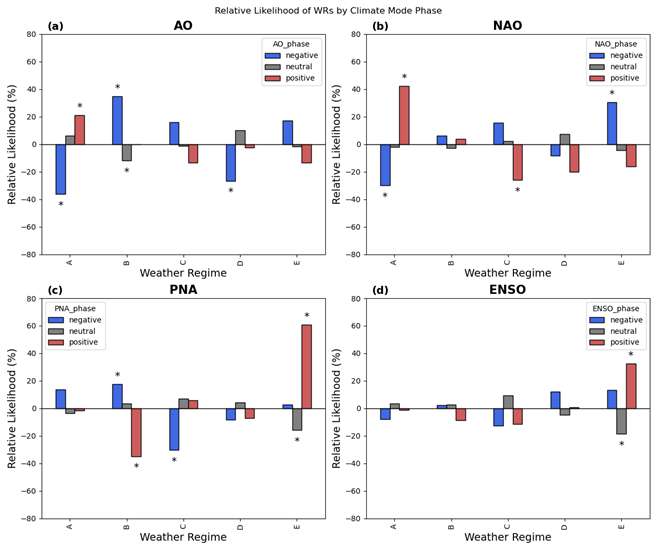
Figure 6Relative likelihood (RL: %) of each WR in different phases of AO (a), NAO (b), PNA (c), and ENSO (d). An asterisk indicates that the frequency is significantly different (p ≤ 0.05) from climatology using a scipy binomial test. Black horizontal line representing the climatological frequency is at RL = 0.0.
During +NAO years, WR-A is ∼ 42 % more likely to occur, which is consistent with the reduced TO probability in the NGP and SGP (Fig. 6). Composite 500H anomalies for +NAO years resemble WR-A, while composite 500H anomalies for +AO show a mix of WR-A and WR-B (Fig. S3). WR-A's increased occurrence helps explain the high predictive skill of inactive TO years and indicates that +NAO offers a forecast of opportunity for inactive TO years (Fig. 6b). Additionally, WR-A is ∼ 30 % less likely to occur and WR-E is ∼ 30 % more likely to occur during −NAO years.
During +PNA years, WR-B is ∼ 35 % less likely to occur, whereas WR-E is ∼ 62 % more likely to occur (Fig. 6c). The reduced occurrence of WR-B and increased occurrence of WR-E are consistent with reduced TO activity over CONUS, Midwest, and SGP during +PNA (Fig. 5), and also help explain the high predictive skill of inactive TO years and indicate that +PNA offers a forecast of opportunity for inactive TO years (Fig. 6c). Composite 500H anomalies during +PNA years resembles WR-E, with an anomalous high over the western CONUS and an anomalous low over the eastern CONUS (Fig. S3c).
ENSO is not associated with significant changes in WR frequency, except for WR-E (Fig. 6d). WR-E is ∼ 32 % more likely to occur during El Niño, which is consistent with the reduced tornado activity during El Niño years reported in previous studies (Cook et al., 2017). Additionally, WR-E is ∼ 18 % less likely to occur during the neutral phase.
To summarize, WRs associated with increased springtime tornado activity occur more frequently during the climate mode phases that favor increased tornado activity, while WRs associated with suppressed tornado activity preferentially occur during climate mode phases that are unfavorable for tornado activity. These consistent relationships provide additional confidence in the robustness of the WR-based prediction framework and help to understand the predictability of tornado activity.
3.3 Possible role of SST
In this section, we explore the potential role of SSTs as a source of predictability, in some cases through air-sea coupled climate modes. Composite SST and 500H anomalies during active and inactive TO years are shown in Fig. 7. During inactive TO years, significant positive SST anomalies are found over equatorial eastern Pacific and significant negative SST anomalies over the North Pacific and subtropical western Atlantic. Inactive TO years feature an anomalous 500H high over the west-central CONUS and anomalous 500H lows over the East Pacific and Southeast CONUS, resembling WR-A. A positive phase of the North Atlantic tripole SST pattern is present, consistent with (Lee et al., 2016). In contrast, significant SST anomalies are nearly absent during active TO years except a limited region of cold SST anomalies over the East Pacific just off California. The 500H anomalies are characterized by an anomalous trough over CONUS, resembling WR-B, but the anomalies are much weaker than those during the inactive TO years. The lack of significant SST anomalies and weak 500H anomalies in the active TO years are consistent with the reduced model skill during active TO years and during climate mode phases that are favorable for tornado activity and suggest that inactive TO years are more predictable than active TO years. Statistical significance of results for inactive years should be interpreted with caution given the limited sample size available (N = 7).
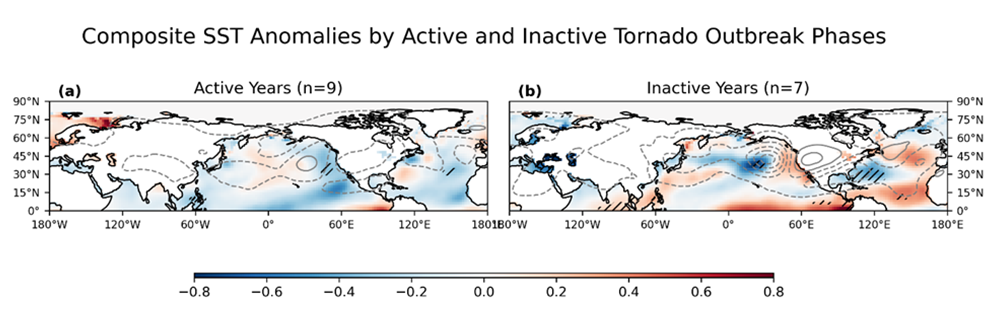
Figure 7April composite SST anomalies for active and inactive tornado outbreak years. Hatching indicates significant SST anomalies (p ≤ 0.05) using a one-sample, two-sided t-test. 500H anomalies are shown in gray contours. Sample sizes are included in each panel title.
To quantify the link between the SST anomalies and climate modes, we calculated the pattern correlations between SST composites in Fig. 7 and those associated with various climate modes (Table S2). Stronger correlations tend to be found in inactive TO years. The highest correlation occurs for inactive TOs and +PNA (cc = 0.71), thus demonstrating that +PNA can be used to identify a forecast of opportunity for inactive TO years.
We also examined composite SST and 500H anomalies for active and inactive WR years, defined as the years when the springtime WR count exceeds ±1 standard deviation from the mean (Fig. S6). WR-A shows opposite circulation patterns over the CONUS between its active and inactive years, with the inactive years resembling a −AO/−NAO pattern consistent with reduced WR-A occurrence during those phases. Active WR-B years exhibit a North Atlantic 500H pattern resembling a −AO pattern. In contrast, inactive WR-B years feature anomalously low SSTs over the North Pacific and an anomalous 500H high over Canada, resembling a +PNA pattern. These patterns are consistent with how PNA and AO modulate WR-B frequency (Fig. 6). The SST composite for active WR-B years has the highest pattern correlation with active TO years (cc = 0.45, Table S2). Active WR-C years feature enhanced southerly flow from the Gulf of Mexico and anomalously low SSTs in the Gulf of Mexico. Their offsetting effects help explain the near-climatology tornado activity. WR-D and WR-E show opposite and statistically significant SST anomalies in the subtropical Pacific, suggesting some potential predictability. Overall, the SSTs over the Pacific and Atlantic may help explain the predictability of WRs, though further investigation using longer observational records is needed to better understand the predictability of tornado activity.
A hybrid model for the seasonal prediction of CONUS springtime tornado activity is evaluated during 1981–2023. The model employs WR forecasts from the ECMWF ensemble springtime forecasts initialized on 1 April. Using the leave-one-year-out cross-validation, the WR-based model shows no predictive skill for TDs, but the predicted time series of TO days is significantly correlated with the observed time series. Predictive skill for TOs is modulated by certain climate modes and is significantly enhanced during +AO, +NAO, +PNA, and El Niño years, with the proportion correct of 75 %, 71.4 %, 71.4 %, and 70 %, respectively. Given the difficulty of predicting TDs beyond subseasonal timescales (Gensini et al., 2020), springtime prediction efforts should prioritize TOs due to their higher predictive skill and societal impacts, and certain climate modes can help to identify forecasts of opportunity.
To investigate the predictability sources of springtime tornado activity, the composite TO probability anomalies were examined during different phases of climate modes. Significantly enhanced TO probability anomalies were associated with −AO and La Niña years, while significantly reduced TO probability anomalies were associated with +NAO and +PNA years. Corresponding circulation patterns during these years provide physical support, through CAPE and vertical shear anomalies. In general, the model performs better during years that are unfavorable for tornado activity. Threat score results confirm this result, although the model still shows modest skill during active TO years.
Additionally, WR occurrence is modulated by some climate modes. WR-A is the dominant WR during +NAO years and WR-E is the dominant WR during +PNA years, consistent with reduced tornado activity during +NAO and +PNA years. Given the increased model skill during inactive TO years, +NAO and +PNA may provide forecasts of opportunity for reduced springtime tornado activity. Furthermore, WR-B is the dominant WR during −AO years and is the least frequent WR during +PNA years, consistent with enhanced (reduced) tornado activity during the −AO (+PNA) phase. WRs associated with increased springtime tornado activity tend to occur more frequently during the climate mode phases that favor increased tornado activity, while WRs associated with suppressed tornado activity preferentially occur during climate mode phases that are unfavorable for tornado activity. This physical consistency supports the use of WRs as a physically meaningful framework for predicting TOs.
The role of SSTs in the predictability of TOs was examined, with the focus on April SST anomalies. Statistically significant SST anomalies are present over the North Pacific and Western Atlantic during inactive TO years. In contrast, significant SSTs are mostly absent in active TO years. In addition, the 500H pattern is weaker during active TO years. This suggests that TO anomalies are more predictable during inactive years than active years. In addition, SST anomalies can help explain predictability of some WRs, but SST signals for other WRs are statistically insignificant or incoherent, making it challenging to identify specific SST-based predictors for WRs or tornado activity. Further investigation based on longer observational records would help better understand the role of SST in the predictability of WRs and tornado activity.
This study demonstrates that skillful prediction of springtime TOs is indeed possible with current resources via the connection between tornado activity and WRs. Questions remain on whether SSTs are a reliable driver of springtime TOs as well as the temporal extent to which TOs can be predicted.
Important python files for WR identification and modeling are included at https://doi.org/10.5281/zenodo.21502913 (Graber, 2026).
The ERA5 data are available through the NCAR research data archive (RDA) (d633000) and the Copernicus Climate Data Store (CDS) at https://doi.org/10.24381/cds.bd0915c6 (Hersbach et al., 2023a) and https://doi.org/10.24381/cds.adbb2d47 (Hersbach et al., 2023b). The ECMWF data are available through the Copernicus Climate Data Store (CDS) at https://doi.org/10.24381/cds.50ed0a73 (Copernicus Climate Change Service, Climate Data Store, 2018). April SST data are available through the Extended-range sea surface temperatures data (Huang et al., 2017). The tornado report data used in this study are available through the NOAA Storm Prediction Center severe weather database: https://www.spc.noaa.gov/wcm/ (last access: 31 March 2026). The dataset containing U.S. disaster cost assessments of the total, direct losses (USD) is available at https://doi.org/10.25921/stkw-7w73 (Smith, 2020).
The supplement related to this article is available online at https://doi.org/10.5194/wcd-7-1349-2026-supplement.
Conceptualization: MG, ZW, RJT. Methodology: MG, ZW, RJT. Project Administration: ZW, RJT. Supervision: ZW, RJT. Writing – Original Draft: MG. Writing – Review and Edits: MG, ZW, RJT.
The contact author has declared that none of the authors has any competing interests.
Publisher's note: Copernicus Publications remains neutral with regard to jurisdictional claims made in the text, published maps, institutional affiliations, or any other geographical representation in this paper. The authors bear the ultimate responsibility for providing appropriate place names. Views expressed in the text are those of the authors and do not necessarily reflect the views of the publisher.
We acknowledge the NCAR Computation and Information Systems Laboratory (CISL) for providing computing resources through Derecho. All ERA5 data used in this study are available at the research data archive. All ECMWF seasonal forecast data are available via the Copernicus Climate Change Service. Tornado report data are available through the NOAA Storm Prediction Center severe weather database.
Zhuo Wang is supported by the NSF grant no. 2518299.
This paper was edited by Amy Butler and reviewed by two anonymous referees.
Allen, J. T., Tippett, M. K., and Sobel, A. H.: Influence of the El Niño/Southern Oscillation on tornado and hail frequency in the United States, Nat. Geosci., 8, 278–283, https://doi.org/10.1038/ngeo2385, 2015.
Allen, J. T., Molina, M. J., and Gensini, V. A.: Modulation of annual cycle of tornadoes by El Niño–Southern Oscillation, Geophys. Res. Lett., 45, 5708–5717, https://doi.org/10.1029/2018GL077482, 2018.
Ashley, W. S.: Spatial and temporal analysis of tornado fatalities in the United States: 1880–2005, Weather Forecast., 22, 1214–1228, https://doi.org/10.1175/2007WAF2007004.1, 2007.
Baggett, C. F., Nardi, K. M., Childs, S. J., Zito, S. N., Barnes, E. A., and Maloney, E. D.: Skillful subseasonal forecasts of weekly tornado and hail activity using the Madden-Julian Oscillation, J. Geophys. Res.-Atmos., 123, 12661–12675, https://doi.org/10.1029/2018JD029059, 2018.
Bjerknes, J.: Atmospheric Teleconnections from the equatorial Pacific, Mon. Weather Rev., 97, 163–172, https://doi.org/10.1175/1520-0493(1969)097<0163:ATFTEP>2.3.CO;2, 1969.
Brooks, H. E., Carbin, G. W., and Marsh, P. T.: Increased variability of tornado occurrence in the United States, Science, 346, 349–352, https://doi.org/10.1126/science.1257460, 2014.
Charney, J. G. and DeVore, J. G.: Multiple flow equilibria in the atmosphere and blocking, J. Atmos. Sci., 36, 1205–1216, https://doi.org/10.1175/1520-0469(1979)036<1205:MFEITA>2.0.CO;2, 1979.
Chen, W. Y. and Van den Dool, H. M.: Atmospheric predictability of seasonal, annual, and decadal climate means and the role of the ENSO cycle: A model study, J. Climate, 10, 1236–1254, https://doi.org/10.1175/1520-0442(1997)010<1236:APOSAA>2.0.CO;2, 1997.
Childs, S., Schumacher, R. S., and Allen, J. T.: Cold-season tornadoes: Climatological and meteorological insights, Weather Forecast., 33, 671–691, https://doi.org/10.1175/WAF-D-17-0120.1, 2018.
Chu, J.-E., Timmermann, A., and Lee, J.-Y.: North American April tornado occurrences linked to global sea surface temperature anomalies, Sci. Adv., 5, https://doi.org/10.1126/sciadv.aaw9950, 2019.
Cohen, J., Screen, J. A., Furtado, J. C., Barlow, M., Whittleston, D., Coumou, D., Francis, J., Dethloff, K., Entekhabi, D., Overland, J., and Jones, J.: Recent Arctic amplification and extreme mid-latitude weather, Nat. Geosci., 7, 627–637, https://doi.org/10.1038/ngeo2234, 2014.
Cook, A. R. and Schaefer, J. T.: The relation of El Niño-Southern Oscillation (ENSO) to winter tornado outbreaks, Mon. Weather Rev., 136, 3121–3137, https://doi.org/10.1175/2007MWR2171.1, 2008.
Cook, A. R., Leslie, L., Parsons, D., and Schaefer, J.: The impact of El Nino-Southern Oscillation (ENSO) on Winter and early Spring U.S. tornado outbreaks, J. Appl. Meteorol. Clim., 56, 2455–2478, https://doi.org/10.1175/JAMC-D-16-0249.1, 2017.
Copernicus Climate Change Service, Climate Data Store: Seasonal forecast subdaily data on pressure levels, Copernicus Climate Change Service (C3S) Climate Data Store (CDS) [data set], https://doi.org/10.24381/cds.50ed0a73, 2018.
Cwik, P., McPherson, R. A., Richman, M. B., and Mercer, A. E.: Climatology of 500-hPa geopotential height anomalies associated with May tornado outbreaks in the United States., Int. J. Climatol., 43, 893–913, https://doi.org/10.1002/joc.7841, 2022.
Czaja, A. and Frankignoul, C.: Observed Impact of Atlantic SST Anomalies on the North Atlantic Oscillation, J. Climate, 15, 606–623, https://doi.org/10.1175/1520-0442(2002)015<0606:OIOASA>2.0.CO;2, 2002.
Diffenbaugh, N. S., Scherer, M., and Trapp, R. J.: Robust increases in severe thunderstorm environments in response to greenhouse forcing, P. Natl. Acad. Sci. USA, 110, 16361–16366, https://doi.org/10.1073/pnas.1307758110, 2013.
Duan, W. and Wei, C.: The “spring predictability barrier” for ENSO predictions and its possible mechanism: Results from a fully coupled model, Int. J. Climatol., 33, 1280–1292, https://doi.org/10.1002/joc.3513, 2012.
Elsner, J. B., Jagger, T. H., and Fricker, T.: Statistical models for tornado climatology: Long and short-term views, PLoS ONE, 11, e0166895, https://doi.org/10.1371/journal.pone.0166895, 2016.
Gensini, V. A. and Tippett, M. K.: Global Ensemble Forecast System (GEFS) predictions of days 1–15 U.S. tornado and hail frequencies, Geophys. Res. Lett., 46, 2922–2930, https://doi.org/10.1029/2018GL081724, 2019.
Gensini, V. A., Barrett, B. S., Allen, J. T., Gold, D., and Sirvatka, P.: The Extended-Range Tornado Activity Forecast (ERTAF) Project, B. Am. Meteorol. Soc., 101, E700–E709, https://doi.org/10.1175/BAMS-D-19-0188.1, 2020.
Graber, M.: Matt0604/Springtime-Prediction-Manuscript: Springtime Prediction Code for Publication, Version Springtime_Prediction, Zenodo [computer software], https://doi.org/10.5281/zenodo.21502913, 2026.
Graber, M., Trapp, R. J., and Wang, Z.: The regionality and seasonality of tornado trends in the United States, npj Clim. Atmos. Sci., 7, https://doi.org/10.1038/s41612-024-00698-y, 2024.
Graber, M., Wang, Z., and Trapp, R. J.: Linking weather regimes to the variability of warm-season tornado activity over the United States, Weather Clim. Dynam., 6, 807–816, https://doi.org/10.5194/wcd-6-807-2025, 2025.
Grams, C. M., Beerli, R., Pfenninger, S., Staffell, I., and Wernli, H.: Balancing Europe's wind-power output through spatial development informed by weather regimes, Nat. Clim. Change, 7, 557–562, https://doi.org/10.1038/nclimate3338, 2017.
Hannachi, A., Straus, D. M., Franzke, C. L. E., Corti, S., and Woollings, T.: Low-frequency nonlinearity and regime behavior in the northern hemisphere extratropical atmosphere, Rev. Geophys., 55, 199–234, https://doi.org/10.1002/2015RG000509, 2017.
Hersbach, H., Bell, B., Berrisford, P., Hirahara, S., Horányi, A., Muñoz-Sabater, J., Nicolas, J., Peubey, C., Radu, R., Schepers, D., Simmons, A., Soci, C., Abdalla, S., Abellan, X., Balsamo, G., Bechtold, P., Biavati, G., Bidlot, J., Bonavita, M., De Chiara, G., Dahlgren, P., Dee, D., Diamantakis, M., Dragani, R., Flemming, J., Forbes, R., Fuentes, M., Geer, A., Haimberger, L., Healy, S., Hogan, R. J., Hólm, E., Janisková, M., Keeley, S., Laloyaux, P., Lopez, P., Lupu, C., Radnoti, G., de Rosnay, P., Rozum, I., Vamborg, F., Villaume, S., and Thépaut, J.-N.: The ERA5 global reanalysis, Q. J. Roy. Meteor. Soc., 146, 1999–2049, https://doi.org/10.1002/qj.3803, 2020.
Hersbach, H., Bell, B., Berrisford, P., Biavait, G., Horányi, A., Munoz Sabater, J., Nicolas, J., Peubey, C., Radu, R., Rozum, I., Schepers, D., Simmons, A., Soci, C., Dee, D., and Thepaut, J.-N.: ERA5 hourly data on pressure levels from 1940 to present, Copernicus Climate Change Service (C3S) Climate Data Store (CDS) [data set], https://doi.org/10.24381/cds.bd0915c6, 2023a.
Hersbach, H., Bell, B., Berrisford, P., Biavati, G., Horányi, A., Munoz Sabater, J., Nicolas, J., Peubey, C., Radu, R., Rozum, I., Schepers, D., Simmons, A., Soci, C., Dee, D., and Thepaut, J.-N.: ERA5 hourly data on single levels from 1940 to present, Copernicus Climate Change Service (C3S) Climate Data Store (CDS) [data set], https://doi.org/10.24381/cds.adbb2d47, 2023b.
Hoogewind, K. A., Gensini, V. A., and Brooks, H. E.: On the relationship between monthly mean surface temperature and tornado days in the United States, npj Clim. Atmos. Sci., 8, https://doi.org/10.1038/s41612-025-00993-2, 2025a.
Hoogewind, K. A., Galarneau Jr., T. J., and Gensini, V. A.: Severe convective weather outbreaks on 10 and 15 December 2021: Large-scale antecedent conditions, Mon. Weather Rev., 153, 1171–1194, https://doi.org/10.1175/MWR-D-24-0213.1, 2025b.
Huang, B., Thorne, P. W., Banzon, V. F., Boyer, T., Chepurin, G., Lawrimore, J. H., Menne, M. J., Smith, T. H., Vose, R. S., and Zhang, H.-M.: Extended Reconstructed Sea Surface Temperature, version 5 (ERSSTv5): Upgrades, validations, and intercomparisons, J. Climate, 30, 8179–8205, https://doi.org/10.1175/JCLI-D-16-0836.1, 2017.
Hurrell, J. W.: Decadal trends in the North Atlantic Oscillation: Regional temperatures and precipitation, Science, 269, 676–679, https://doi.org/10.1126/science.269.5224.676, 1995.
Hurrell, J. W. and Deser, C.: North Atlantic climate variability: The role of the North Atlantic Oscillation, J. Marine Syst., 79, 231–244, https://doi.org/10.1016/j.jmarsys.2009.11.002, 2010.
Jiang, Q., Dawson II, D. T., Funing, L., and Chavas, D. R.: Classifying synoptic patterns driving tornadic storms and associated spatial trends in the United States, npj Clim. Atmos. Sci., 8, https://doi.org/10.1038/s41612-025-00897-1, 2025.
Kim, D., Lee, S.-K., Lopez, H., Jeong, J.-H., and Hong, J.-S.: An unusally prolonged Pacific-North American pattern promoted the 2021 winter quad-state tornado outbreaks, npj Clim. Atmos. Sci., 7, https://doi.org/10.1038/s41612-024-00688-0, 2024.
Knowles, J. B. and Pielke Sr., R. A.: The Southern Oscillation and its effects on tornadic activity in the United States, Colorado State University, Atmospheric Sciences Paper 755, 15 pp., https://api.mountainscholar.org/server/api/core/bitstreams/e1d910be-5493-4b4f-a15b-8079d0f9a9fc/content (last access: 23 July 2026), 2005.
Lau, N.-C.: A diagnostic study of recurrent meteorological anomalies appearing in a 15-year simulation with a GFDL general circulation model, Mon. Weather Rev., 109, 2287–2311, https://doi.org/10.1175/1520-0493(1981)109<2287:ADSORM>2.0.CO;2, 1981.
Leathers, D. J., Yarnal, B., and Palecki, M. A.: The Pacific/North American teleconnection pattern and United States climate. Part I: Regional temperature and precipitation associations, J. Climate, 4, 517–528, https://doi.org/10.1175/1520-0442(1991)004<0517:TPATPA>2.0.CO;2, 1991.
Lee, S. H., Tippett, M. K., and Polvani, L. M.: A new year-round weather regime classification for North America, J. Climate, 36, 7091–7108, https://doi.org/10.1175/JCLI-D-23-0214.1, 2023.
Lee, S.-K., Wittenberg, A. T., Enfield, D. B., Weaver, S. J., Wang, C., and Atlas, R.: US regional tornado outbreaks and their links to spring ENSO phases and North Atlantic SST variability, Environ. Res. Lett., 11, https://doi.org/10.1088/1748-9326/11/4/044008, 2016.
Lepore, C., Tippett, M. K., and Allen, J. T.: ENSO-based probabilistic forecasts of March–May U.S. tornado and hail activity, Geophys. Res. Lett., 44, 9093–9101, https://doi.org/10.1002/2017GL074781, 2017.
Li, X., Hu, Z.-Z., Liang, P., and Zhu, J.: Contrastive influence of ENSO and PNA on variability and predictability of North American winter precipitation, J. Climate, 32, 6271–6284, https://doi.org/10.1175/JCLI-D-19-0033.1, 2019.
Malloy, K. and Tippett, M. K.: A stochastic statistical model for U.S. outbreak-level tornado occurrence based on the large-scale environment, Mon. Weather Rev., 152, 1141–1161, https://doi.org/10.1175/MWR-D-23-0219.1, 2024.
Mercer, A. E., Shafer, C. M., Doswell III, C. A., Leslie, L. M., and Richman, M. B.: Synoptic composites of tornadic and nontornadic outbreaks, Mon. Weather Rev., 140, 2590–2608, https://doi.org/10.1175/MWR-D-12-00029.1, 2012.
Michelangeli, P.-A., Vautard, R., and Legras, B.: Weather regimes: Recurrence and quasi stationarity, J. Atmos. Sci., 52, 1237–1256, https://doi.org/10.1175/1520-0469(1995)052<1237:WRRAQS>2.0.CO;2, 1995.
Miller, D., Wang, Z., Trapp, R. J., and Harnos, D. S.: Hybrid prediction of weekly tornado activity out to week 3: Utilizing weather regimes, Geophys. Res. Lett., 47, https://doi.org/10.1029/2020GL087253, 2020.
Molina, M. J., Timmer, R. P., and Allen, J. T.: Importance of the Gulf of Mexico as a climate driver for U.S. severe thunderstorm activity, Geophys. Res. Lett., 43, 12295–12304, https://doi.org/10.1002/2016GL071603, 2016.
Moore, T. W.: Annual and seasonal tornado trends in the Contiguous United States and its regions, Int. J. Climatol., 38, 1582–1594, https://doi.org/10.1002/joc.5285, 2018.
Moore, T. W.: Seasonal frequency and spatial distribution of tornadoes in the United States and their relationship to the El Niño/Southern Oscillation, Ann. Am. Assoc. Geogr., 109, 1033–1051, https://doi.org/10.1080/24694452.2018.1511412, 2019.
Muñoz, E. and Enfield, D.: The boreal spring variability of the Intra-Americas low-level jet and its relation with precipitation and tornadoes in the eastern United States, Clim. Dynam., 36, 247–259, https://doi.org/10.1007/s00382-009-0688-3, 2011.
National Weather Service: 80-year list of severe weather fatalities, https://www.weather.gov/media/hazstat/80year_2024.pdf (last access: 15 June 2026), 2025.
Niloufar, N., Devineni, N., Were, V., and Khanbilvardi, R.: Explaining the trends and variability in the United States tornado records using climate teleconnections and shifts in observational practices, Sci. Rep., 11, https://doi.org/10.1038/s41598-021-81143-5, 2021.
Ning, L. and Bradley, R. S.: NAO and PNA influences on winter temperature and precipitation over the eastern United States in CMIP5 GCMs, Clim. Dynam., 46, 1257–1276, https://doi.org/10.1007/s00382-015-2643-9, 2015.
NOAA Climate Prediction Center: Daily climate mode indices, NOAA/NCEP/CPC [data set], https://ftp.cpc.ncep.noaa.gov/cwlinks/ (last access: 1 March 2026), 2024a.
NOAA Climate Prediction Center: Oceanic Niño Index (ONI) v5 – Monthly SST anomalies in the Nino 3.4 region, NOAA/NCEP/CPC [data set], https://www.cpc.ncep.noaa.gov/products/analysis_monitoring/ensostuff/ONI_v5.php (last access: 9 June 2026), 2024b.
Phillips, A. S., Deser, C., and Fasullo, J.: Evaluating modes of variability in climate models, Eos T. Am. Geophys. Un., 95, 453–471, https://doi.org/10.1002/2014EO490002, 2014.
Schaefer, J. T.: The critical success index as an indicator of warning skill, Weather Forecast., 5, 570–575, https://doi.org/10.1175/1520-0434(1990)005<0570:TCSIAA>2.0.CO;2, 1990.
Schneider, R. S., Brooks, H. E., and Schaefer, J. T.: Tornado outbreak days: An updated and expanded climatology (1875–2003), 22nd Conf. on Severe Local Storms, Hyannis, MA, 4–8 October 2004, Amer. Meteor. Soc., P5.1, https://ams.confex.com/ams/11aram22sls/techprogram/paper_82031.htm (last access: 23 July 2026), 2004.
Sherburn, K. D., Parker, M. D., King, J. R., and Lackmann, G.: Composite environments of severe and nonsevere high-shear, low-CAPE convective events, Weather Forecast., 31, 1899–1927, https://doi.org/10.1175/WAF-D-16-0086.1, 2016.
Smith, A. B.: U.S. Billion-dollar Weather and Climate Disasters, 1980 - present (NCEI Accession 0209268), NOAA National Centers for Environmental Information (NCEI) Data Archive [data set], https://doi.org/10.25921/stkw-7w73, 2020.
Soulard, N., Lin, H., and Yu, B.: The changing relationship between ENSO and its extratropical response patterns, Sci. Rep., 9, https://doi.org/10.1038/s41598-019-42922-3, 2019.
Strader, S. M., Gensini, V. A., Ashley, W. S., and Wagner, A. N.: Changes in tornado risk and societal vulnerability leading to greater tornado impact potential, npj Nat. Hazards, 1, https://doi.org/10.1038/s44304-024-00019-6, 2024.
Thompson, D. W. J. and Wallace, J. M.: Annular Modes in the Extratropical Circulation. Part 1: Month-to-month Variability, J. Climate, 13, 1000–1016, https://doi.org/10.1175/1520-0442(2000)013<1000:AMITEC>2.0.CO;2, 2000.
Thompson, R. L., Edwards, R., and Hart, J. A.: Close proximity soundings within supercell environments obtained from the rapid update cycle, Weather Forecast., 18, 1243–1261, https://doi.org/10.1175/1520-0434(2003)018<1243:CPSWSE>2.0.CO;2, 2003.
Tippett, M. K., Lepore, C., and L'Heureux, M. L.: Predictability of a tornado environment index from El Niño–Southern Oscillation (ENSO) and the Arctic Oscillation, Weather Clim. Dynam., 3, 1063–1075, https://doi.org/10.5194/wcd-3-1063-2022, 2022.
Tippett, M. K., Malloy, K., and Lee, S. H.: Modulation of U.S. tornado activity by year-round North American weather regimes, Mon. Weather Rev., 152, 2189–2202, https://doi.org/10.1175/MWR-D-24-0016.1, 2024.
Trapp, R. J.: Mesoscale-convective processes in the atmosphere, Cambridge University Press, 377 pp., https://doi.org/10.1017/CBO9781139047241, 2013.
Trapp, R. J.: On the significance of multiple consecutive days of tornado activity, Mon. Weather Rev., 142, 1452–1459, https://doi.org/10.1175/MWR-D-13-00347.1, 2014.
Vitart, F., Ardilouze, C., Bonet, A., Brookshaw, A., Chen, M., Codorean, C., Deque, M., Ferranti, L., Fucile, E., Fuentes, M., Hendon, H., Hodgson, J., Kang, H.-S., Kumar, A., Lin, H., Liu, G., Liu, X., Malguzzi, P., Mallas, I., Manoussakis, M., Mastrangelo, D., MacLachlan, C., McLean, P., Minami, A., Mladek, R., Nakazawa, T., Najm, S., Nie, Y., Rixen, M., Robertson, A. W., Ruti, P., Sun, C., Takaya, Y., Tolstykh, M., Venuti, F., Waliser, D., Woolnough, S., Wu, T., Won, D.-J., Xiao, H., Zaripov, R., and Zhang, L.: The subseasonal to seasonal (S2S) prediction project database, B. Am. Meteorol. Soc., 98, 163–173, https://doi.org/10.1175/BAMS-D-16-0017.1, 2017.
Wallace, J. M. and Gutzler, D. S.: Teleconnections in the geopotential height field during the Northern Hemisphere winter, Mon. Weather Rev., 109, 784–812, https://doi.org/10.1175/1520-0493(1981)109<0784:TITGHF>2.0.CO;2, 1981.
Wyburn-Powell, C. and Jahn, A.: Large-scale climate modes drive low-frequency regional Arctic sea ice variability, J. Climate, 37, 4313–4333, https://doi.org/10.1175/JCLI-D-23-0326.1, 2024.
Zhang, W., Wang, S.-Y. S., Chikamoto, Y., Gillies, R., LaPlante, M., and Hari, V.: A weather pattern responsible for increasing wildfires in the western United States, Environ. Res. Lett., 20, https://doi.org/10.1088/1748-9326/ad928f, 2024.
Zhao, J., Bai, L., Zhou, B., and Zhang, L.: Contributions of Interdecadal Pacific Oscillation, Atlantic Multidecadal Oscillation, and global ocean warming to the secular change in United States tornado occurrence, Atmos. Res., 331, https://doi.org/10.1016/j.atmosres.2025.108689, 2025.