
the Creative Commons Attribution 4.0 License.
the Creative Commons Attribution 4.0 License.
 | 28 Aug 2026
Derecho-favoring atmospheric environments in Finland: characteristics, identification criteria, and frequency trends
Oskari Rantala
Jouni A. Räisänen
Jenni Rauhala
Marja Bister
In this study, we investigate the atmospheric environments during eight summertime derechos and two derecho-type events in Finland, as well as trends in frequency of such environments during 1940–2022, using ERA5 reanalysis. We find that derechos in Finland tend to occur near the right entrance region of an upper-level jet streak, where deep-layer vertical wind shear is moderate, and deep-layer flow with a southerly component advects warm, moist air into the area. In all 10 studied cases, equivalent potential temperature at 850 hPa exceeds 325 K along the trajectory of the system. We define three sets of criteria to capture atmospheric environments favoring derecho formation in Finland. Two of the criteria sets are largely based on literature, whereas the third one is more adapted to the atmospheric conditions observed along the trajectories of derechos in Finland. The criteria sets consist particularly of kinematic parameters, including deep-layer (0–6 and 0–10 km) vertical wind shear and 6–10 km layer mean wind speed, but also contain thermodynamic variables, including convective available potential energy (CAPE) and equivalent potential temperature at 850 hPa. For each criteria set, we require that threshold values for combinations of these parameters are satisfied at the same grid point and over a sufficiently large grid area to classify the day as favorable for derecho formation. By applying the criteria sets, it appears that derecho-favoring environments in Finland have become more frequent, particularly in the period 1980–2022, which was characterized by both accelerated warming and a negative trend in the summer mean Eastern Atlantic/Western Russia teleconnection index. As such, it is plausible that derechos may become more common in the future, at least in Finland.
- Article
(7562 KB) - Full-text XML
-
Supplement
(11491 KB) - BibTeX
- EndNote


Thunderstorms often develop into larger convective weather events that can produce tornadoes, strong straight-line winds, hail, and intense precipitation. Economic losses due to convective weather events have increased remarkably during the last several decades. The average global overall (insured and uninsured) inflation-adjusted losses due to severe convective storms have increased by as much as 580 % from 1980–1994 to 2010–2024 (Munich RE, 2025a). Between the same time periods, the average global overall losses due to all natural disasters have increased by 209 % (Munich RE, 2025b). Therefore, it is vital to know how severe convective events have changed and will change in the future.
Regional weather forecasting and climate models now have horizontal resolutions down to a few kilometers (e.g., Lind et al., 2023). However, many physical processes responsible for the development of severe surface winds in convective storms require even higher resolution. For example, in a study of a severe wind gust event in Australia, El Rafei et al. (2025) showed that column-maximum downdraft velocities were generally about 30 % weaker in the 1 km-resolution simulation than in the 200 m-resolution simulation. Although derechos have been simulated with km-scale simulations (e.g., Li et al., 2023; González-Alemán et al., 2023; Lasher-Trapp et al., 2023), such simulations do not cover time periods comparable to those available from reanalyses or large-ensemble climate simulations. Therefore, proxies, such as convective available potential energy (CAPE), or another index representing instability, and deep-layer shear, have been used to analyze severity of convection in larger datasets with coarser resolution. For example, Taszarek et al. (2021a) used several convective proxies and reanalysis data to study how the conditions favoring convective initiation and tornadoes have changed in the United States and in Europe in recent decades. Prein (2023) showed that straight-line winds intensify with climate change using simulations with 4 km resolution and theoretical considerations regarding thermodynamical changes. Furthermore, by using convective proxies and applying a set of statistical models to represent convective hazards in climate models and reanalysis data, Rädler et al. (2019) found that the frequency of damaging convective weather events, including lightning, hail and severe wind gusts, will likely increase across Europe by the end of the 21st century.
Severe straight-line (as opposed to rotating) winds occur in various types of convective weather systems. The most destructive of them is a derecho. In a derecho, the wind damage path associated with gusts of at least 26 m s−1 must exceed 400 km (Johns and Hirt, 1987). Derechos also stand out by the formation mechanism of strong surface winds, which is often related to specific features like descending rear-inflow jets and mesovortices in the vicinity of the leading line of convection (Markowski and Richardson, 2010). Indeed, the more recent criteria for a derecho include features suggesting the dominant effect of the cold pool (Squitieri et al., 2025) and evidence of sustained bow echoes, mesoscale vortices, and/or rear-inflow jets (Corfidi et al., 2016; Shourd and Kaplan, 2025). Regardless of the exact criteria, destruction caused by derechos can be comparable to that caused by hurricanes (Ashley and Mote, 2005). Furthermore, convective systems producing derechos propagate exceptionally fast compared to other convective weather systems (e.g., Johns and Hirt, 1987; Cohen et al., 2007), which can complicate their forecasting.
It is crucial to find out whether climate change affects the formation of derechos. The fact that severe wind gusts associated with convection occur in a variety of meteorological conditions makes it difficult to find useful parameters for forecasting them (Taszarek et al., 2017). However, Cohen et al. (2007) showed that meteorological environments associated with derechos can be discriminated from those associated with weak convective systems and severe (but not derecho-producing) convective systems.
A series of derechos occurring in succession is a well-documented phenomenon in the United States (Ashley et al., 2005, 2007), and a series of four derechos was also documented in Europe between 10 and 12 August 2017, in a belt stretching from northern Italy to Estonia (Surowiecki et al., 2024). In Finland, a country located roughly between latitudes 60 and 70° N, derechos occurred on 4 d within a period of 10 d in summer 2010. These derechos damaged a total of 8 million m3 of timber (fallen or broken trees) and 35 000 km of power lines (Safety Investigation Authority, Finland, 2010). This unprecedented sequence in Finland raises the question of whether climate change has already affected or may in the future affect both the overall frequency of derechos and the likelihood of multiple derechos occurring in series within the same geographical region. In this study, we investigate historical changes in the frequency of environments favorable for derechos in Finland. The study area is roughly the same where the four derechos occurred in Finland in 2010, but a similar study can also be repeated for other geographical regions.
In this study, we develop three sets of criteria for a favorable environment for derecho formation. Two of them are mainly based on the study of Cohen et al. (2007) on variables that discriminate between summertime derechos and other mesoscale convective systems (MCSs) in the region east of the Rocky Mountains in the USA. However, as it is not clear that the environments favoring derechos would be the same elsewhere in the world, we also develop a third set of criteria which is more strongly guided by observations of environments of derechos in Finland and European derecho research. We then use these three sets of criteria to analyze the historical trend in the frequency of atmospheric conditions favoring derecho formation in Finland. Since large-scale atmospheric teleconnections have been noted to impact the convective activity in Europe (e.g., Piper and Kunz, 2017), we also study their effects to the frequency of derecho-favoring environments, in addition to the effects of global warming. In particular, we determine whether the frequency of favorable derecho environments is correlated with the summer mean North Atlantic Oscillation (NAO), Scandinavian (SCAND), Eastern Atlantic (EA), and Eastern Atlantic/Western Russia (EAWR) indices (Climate Prediction Center, 2026), along with the Atlantic Multi-decadal Oscillation (AMO) index (NOAA PSL, 2026). Additionally, we analyze the connection between the frequency of favorable derecho environments and summer mean surface temperature over the study area.
In Sect. 2, data and methods are described. Section 2 also briefly presents eight confirmed derecho cases and two derecho-like cases that have occurred in Finland and that we use to develop the criteria sets. In Sect. 3, an overview is presented of the synoptic and mesoscale environments of the ten derecho and derecho-like cases. Section 4 presents the three criteria sets for atmospheric conditions favoring derecho formation and their evaluation. In Sect. 5, trends in the frequency of derecho favoring environments are presented. The effects of global warming and large-scale teleconnections to the trends in favorable derecho environments are analyzed in Sect. 6. The results are discussed in Sect. 7 and conclusions are provided in Sect. 8.
The events that were used to define the criteria for derecho-favoring atmospheric conditions in Finland are presented in Sect. 2.1. Then, Sect. 2.2 describes how the ERA5 dataset was used to examine derecho-favoring conditions and their occurrence. The calculation of the parameters used in the criteria sets is detailed in Sect. 2.3. Lastly, Sect. 2.4 specifies the methods applied to analyze the trends in the frequency of derecho-favoring environments.
2.1 Derechos events in Finland
Table 1 catalogs eight confirmed summertime derecho cases and two derecho-type events in Finland. The confirmed derecho cases were identified using criteria similar to those of Evans and Doswell (2001) in the United States and Gatzen et al. (2020) in Europe. According to the criteria, measured wind gusts had to exceed 25 m s−1 (slightly lower than 26 m s−1 defined by Johns and Hirt, 1987) and/or damage of tornado scale F1 (Fujita, 1971) had to occur along a major axis length of at least 400 km. In addition, the time between successive wind damage reports had to be no longer than 2 h along the axis, and the damage had to be attributed to the same convective system. From the confirmed events, a few have already been studied in literature: Unto (Punkka et al., 2006), Asta (Chernokulsky et al., 2022), Sylvi (Törmä et al., 2013) and Paula (Virman et al., 2025). It is also worth noting that two separate derechos affected Finland on 8 August 2010. However, for the purposes of this study, it is sufficient to treat the date as a day when a derecho occurred.
Table 1List of derecho events used in the analysis, with dates, storm names by Finnish naming convention and classification. In the table, events that had derecho characteristics but were not classified as derechos are labeled as derecho-type.
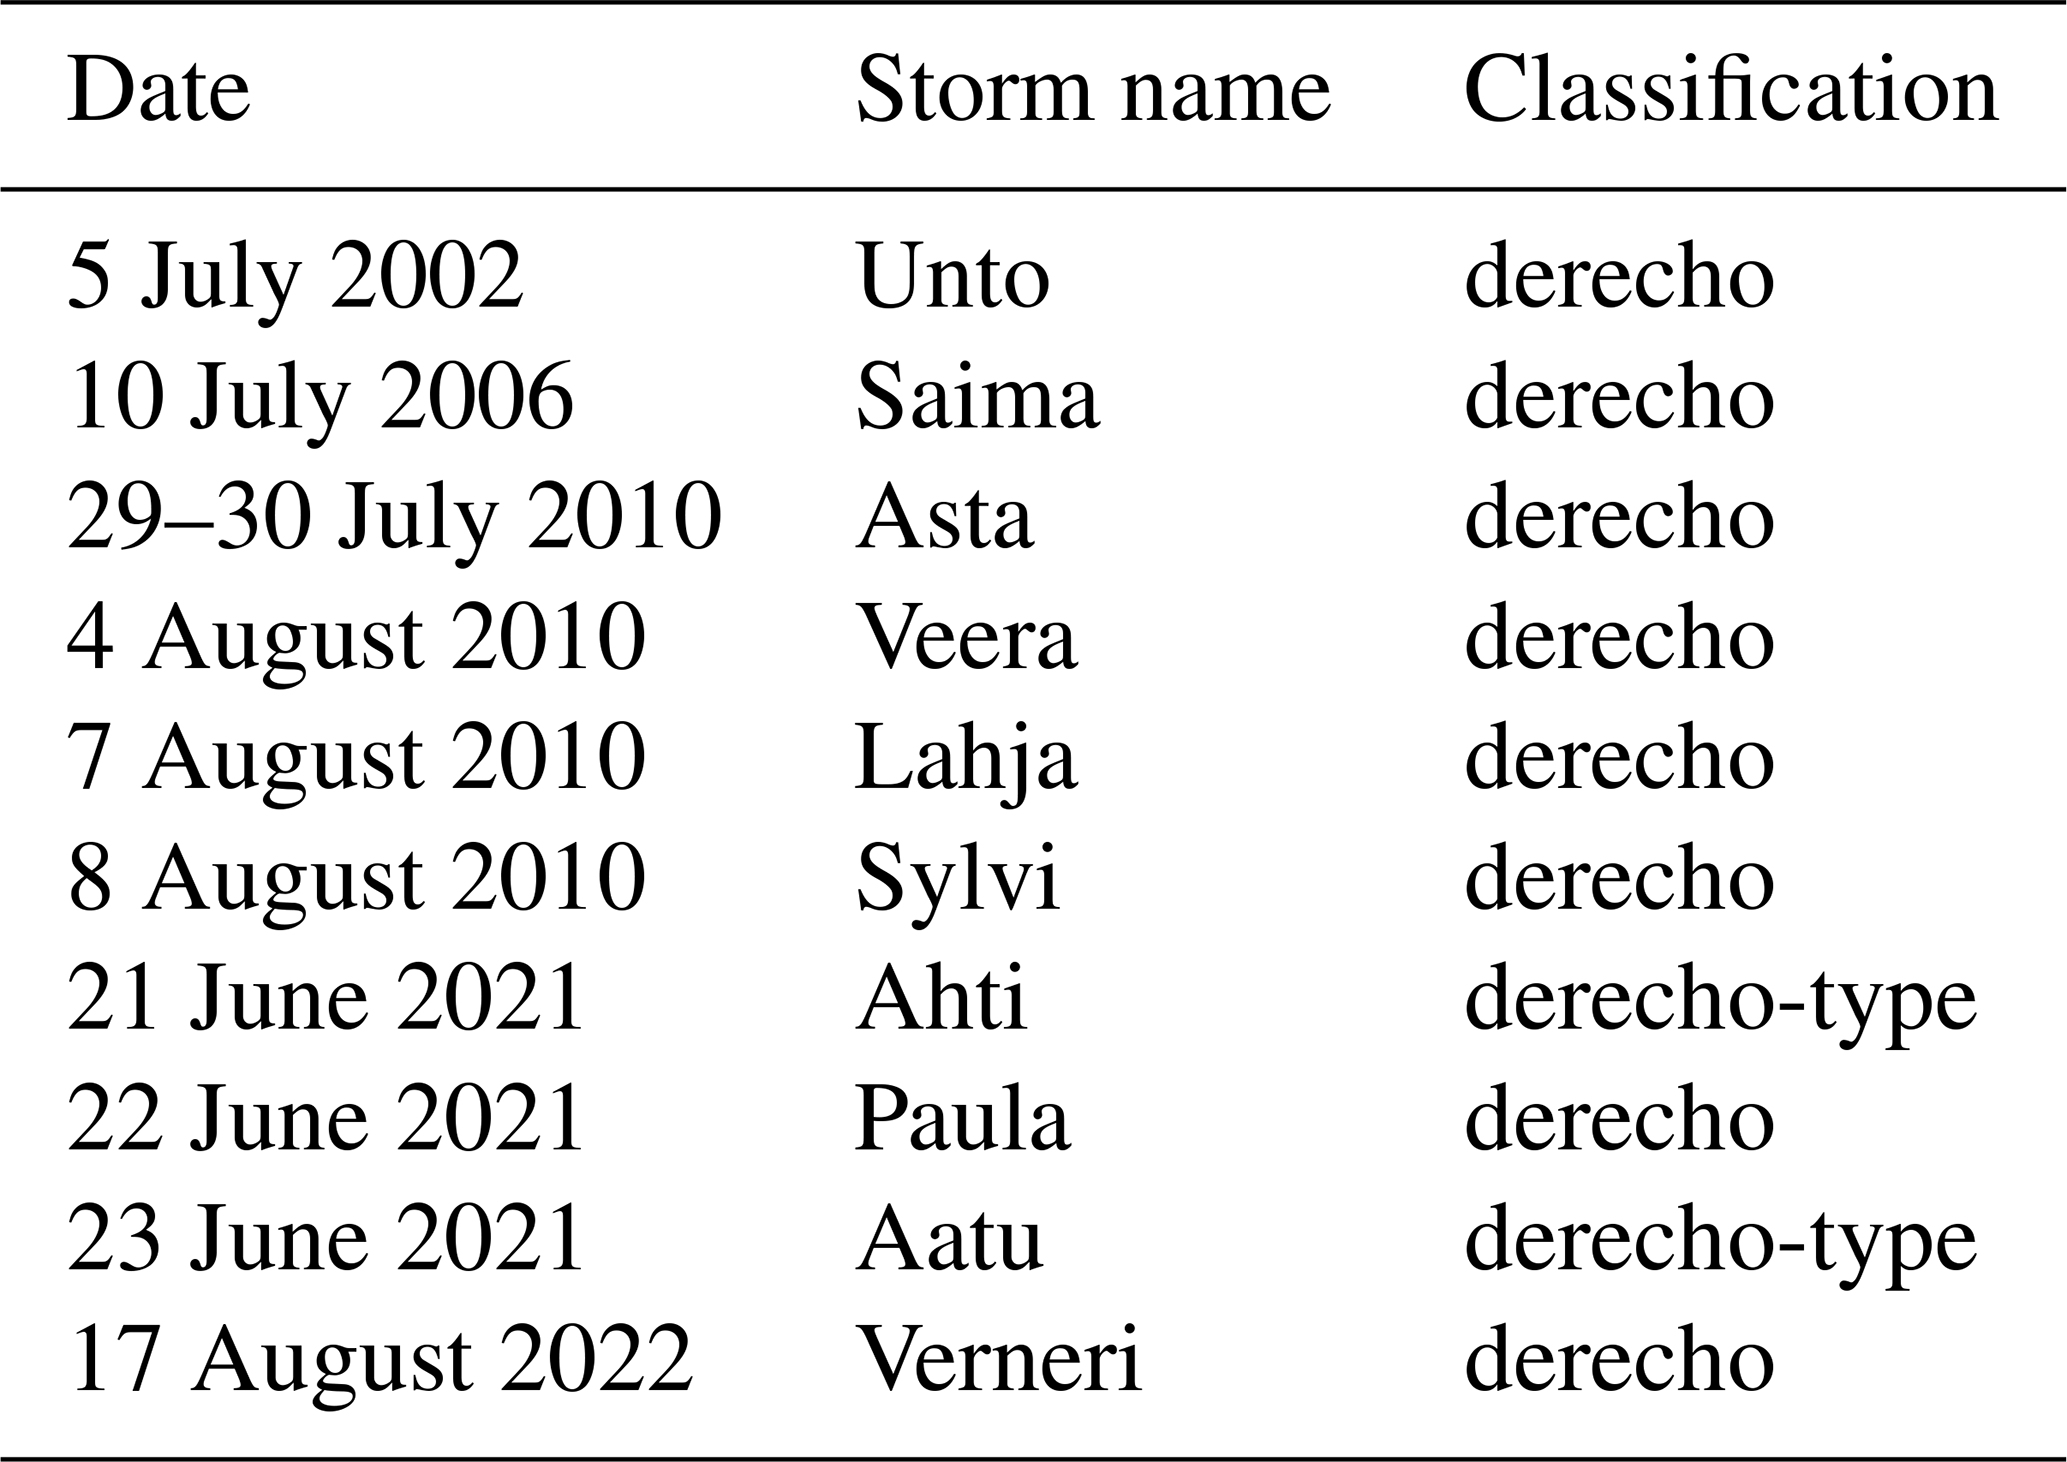
In addition to the confirmed derechos, the table includes two events (storms Ahti and Aatu) which had characteristics typical for derechos by causing widespread damage and were also investigated by Virman et al. (2025). Nevertheless, they did not fulfill all of the formal derecho criteria. For storm Ahti, the major axis of the wind gust and/or damage reports did not reach the required length of 400 km, and some of the damages were caused by isolated convective cells rather than a single system. Storm Aatu similarly fell slightly short of the path-length threshold for wind gusts and damage, which prevented it from being classified as a derecho.
Several potential derecho events cross national borders, which means their damage paths may be too short over Finland to meet the derecho criteria. For example, storm Aatu already affected Estonia (based on radar images), but it did not last long enough over Finland to classify as a derecho. Since storms Ahti and Aatu did not quite meet the requirements to be classified as derechos, they are classified as derecho-type events in this study. Importantly, the addition of these two events did not affect the criteria for derecho-favoring environments that are defined in Sect. 4.
The trajectories of all ten events are drawn in Fig. 1, which also shows the grid domain (21.5–34° E, 58.5–65.5° N) that was selected to study the atmospheric conditions favoring derecho formation in Finland. The trajectories were determined visually from radar images provided by Eerik Saarikalle at the Finnish Meteorological Institute (FMI). At least two of the derecho-producing systems (Asta 29 July 2010; Chernokulsky et al., 2022; and Sylvi 8 August 2010; Törmä et al., 2013) clearly developed outside of our grid and radar image area but propagated far enough across Finland to be classified as derechos.
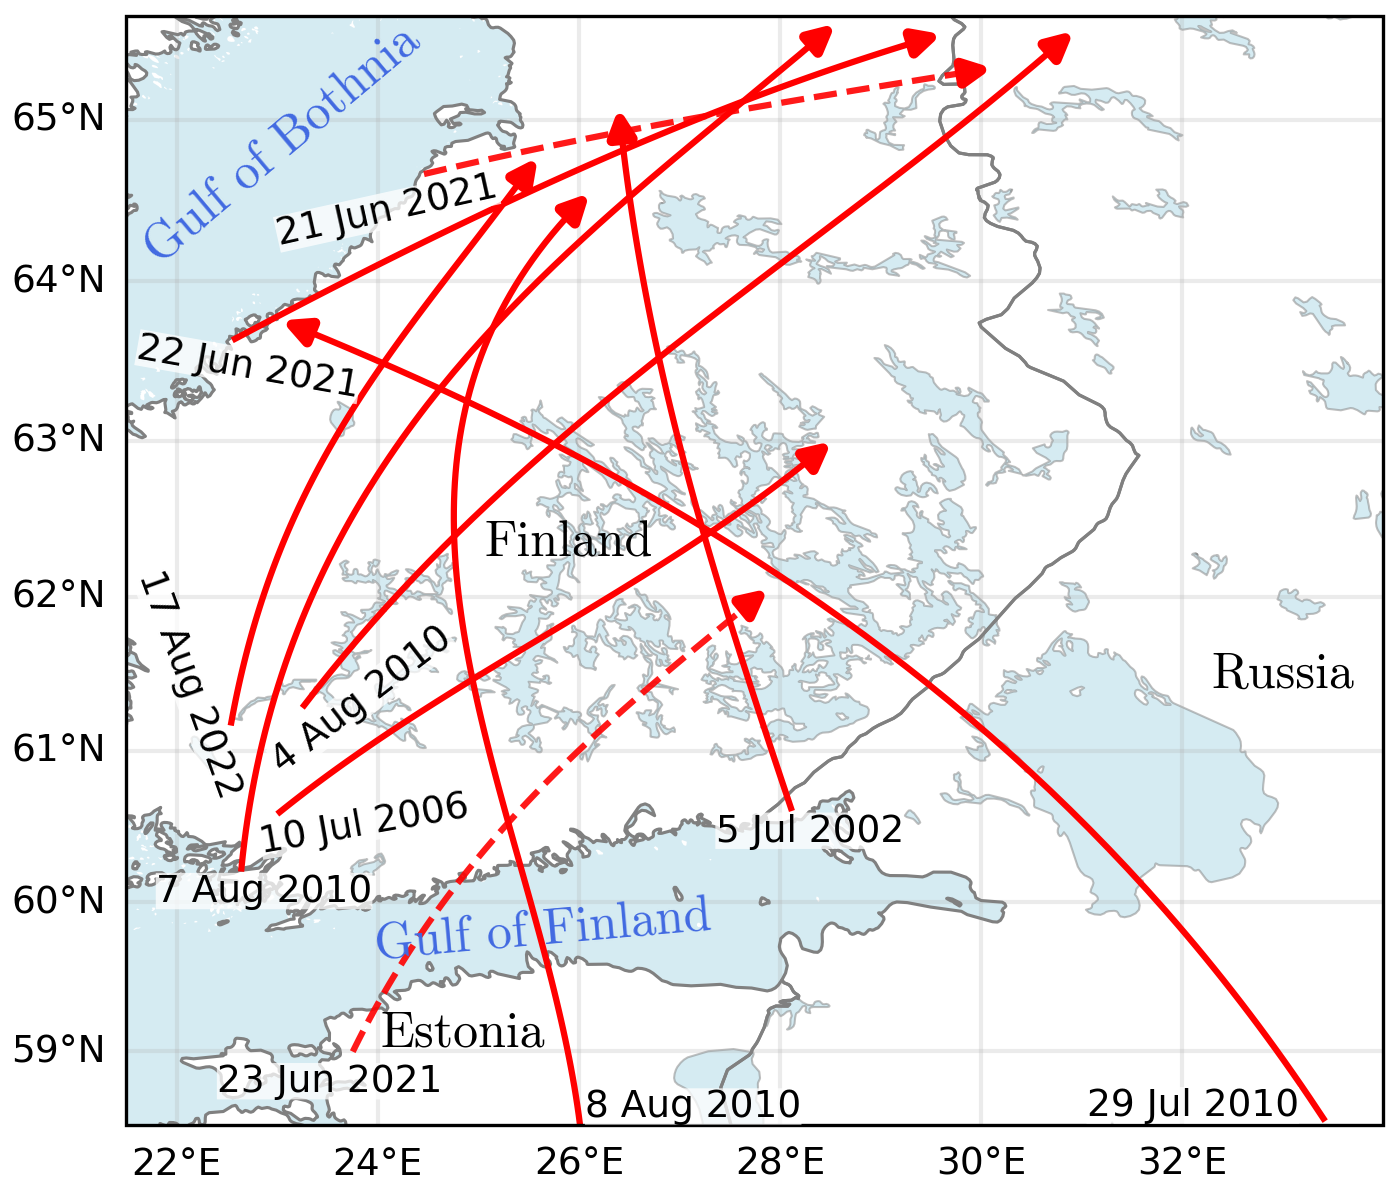
Figure 1The grid area selected for analyzing conditions favoring derecho formation. Approximate trajectories of the derechos within the study area are shown with solid red arrows, each labeled at its origin with the event’s start date. The two derecho-type tracks are distinguished from the confirmed derechos by dashed lines.
2.2 ERA5 reanalysis data
Environments of derechos have been analyzed in many studies using atmospheric soundings (e.g., Evans and Doswell, 2001; Doswell and Evans, 2003; Cohen et al., 2007). However, the sounding network in Finland is too sparse to comprehensively study the atmospheric conditions favoring derecho formation. Therefore, ERA5 reanalysis data (Hersbach et al., 2020) were used instead. ERA5 has several atmospheric, oceanic and land variables available for download on 37 pressure levels, extending from 1000 hPa (surface) up to 1 hPa (approximately 80 km altitude). The dataset has a horizontal resolution of 0.25° and a temporal resolution of 1 h.
To study synoptic patterns during derecho events in Finland in Sect. 3.1, ERA5 hourly pressure-level data were downloaded for all dates of the events, and every 6 h for 5 d preceding and one day following each event. The grid selected for the synoptic-scale analysis covered most of Europe and eastern parts of the Atlantic (30° W–50° E, 35–75° N). Horizontal wind components (u, v), temperature (T), specific humidity (q) and geopotential (Z) were downloaded from pressure levels 1000, 850, 700, 500 and 250 hPa. Additionally, single-level parameters were acquired: mean sea level pressure (MSLP), 100 m horizontal wind components, convective available potential energy (CAPE), and 2 m air temperature. In this study, no attention is paid to the ERA5 surface winds and precipitation during derechos in Finland, but some details on how they compare to observations are mentioned in Rantala (2025, pp. 27–28).
In Sects. 3.2–5, the focus will be on mesoscale environments favoring derecho formation. To analyze these conditions, the smaller grid area (21.5–34° E, 58.5–65.5° N) illustrated in Fig. 1 was utilized. For this grid, u, v, T, q and Z were downloaded from 21 pressure levels between 1000 and 250 hPa for all events. In addition, CAPE and 100 m horizontal wind components were acquired. CAPE in ERA5 is calculated by evaluating air parcels originating from model levels below the 350 hPa level, with the maximum value retained (i.e. the most unstable CAPE).
2.3 Calculation of criteria parameters
As mentioned in Sect. 1, Cohen et al. (2007) found parameters that distinguished summertime derecho-producing systems from other MCSs in the US. The most discriminating parameters were the 0–10 and 0–6 km vertical wind shear, and the 6–10 km layer mean wind speed (in addition to system propagation speed, which is not analyzed here). To calculate these parameters, ERA5 data was first interpolated to levels of constant altitudes (above ground level) at 500 m intervals from 500 m to 10 km using geopotential data from the pressure levels.
Shear parameters were computed as the magnitude of the vector difference between the wind at 100 m above the surface and the wind at either 6 or 10 km altitude. Hereafter, references to 0–6 or 0–10 km shear denote these two wind vector differences. The wind vector at 100 m was preferred over the 10 m wind to mitigate the effects of surface roughness. Nevertheless, the wind vector difference between 10 and 100 m was small.
The 6–10 km layer mean wind speed (hereafter 6–10 km U) was also calculated in the same manner as in Cohen et al. (2007). The corresponding formula is given in Eq. (1), where u and v are the wind vector components at all the interpolated altitude levels within the 6–10 km layer.
In many studies the 850 hPa equivalent potential temperature (θE) has been observed to be particularly high during European derechos (discussed further in Sect. 3.2). Therefore, θE was also calculated at the 850 hPa level using the “equivalent_potential_temperature” function from Python's MetPy library (May et al., 2025).
2.4 Trend analysis
To find out whether the frequency of derecho-favoring atmospheric conditions has changed during recent decades, ERA5 data were downloaded for the period 1940–2022. Since we were interested in the warm-season derechos in Finland, only data for June, July and August were analyzed. Additionally, based on our small sample of derecho cases in Finland, European derecho studies (e.g., Gatzen et al., 2020), and intense MCSs observed in Finland (Punkka and Bister, 2015), derechos and intense MCSs usually occur during the afternoon and evening hours. Consequently, ERA5 data were only acquired for 12:00, 15:00 and 18:00 UTC each day, which correspond to Finnish summer times 03:00, 06:00 and 09:00 p.m. These selected times provide sufficient sampling for the convectively relevant hours.
The trend analysis was carried out using several approaches. The three sets of criteria – the 10 km shear criteria, 6 km shear criteria and Derecho-favoring environments in Finland criteria that are presented in Sect. 4 – were applied separately in all trend analyses. For each summer, we calculated the number of favorable days (N) on which a given criteria set was satisfied at least once per day (1pd), twice per day (2pd, not necessarily consecutive), or at all three times (3pd) during 12:00, 15:00, and 18:00 UTC. The trends were then determined separately for the 1pd, 2pd and 3pd cases.
The warming of the global climate has become much more pronounced after ca. 1980 (IPCC, 2023). Furthermore, assimilation of satellite data into ERA5 began after 1979, producing more reliable data (Hersbach et al., 2019). Therefore, we analyzed the trends within the 1980–2022 period, in addition to the full 1940–2022 time range.
After separately computing N for conditions satisfied once, twice, and three times per day using each criteria set in each summer, we calculated the Pearson and Spearman correlation coefficients between N and time (year number) for both time periods. The p-values of these correlations were then used to evaluate the statistical significance of the trends. We used p-value of 0.05 as the threshold for statistical significance.
In Sect. 6 we analyze the effects large-scale atmospheric teleconnections on N, using monthly teleconnection indeces from Climate Prediction Center (2026). The data extend from 1950 to present and include North Atlantic Oscillation (NAO), Scandinavian (SCAND), Eastern Atlantic (EA), and Eastern Atlantic/Western Russia (EAWR) indices. Additionally, we acquired monthly Atlantic Multi-decadal Oscillation (AMO) index timeseries that extends from 1948 to 2023 (NOAA PSL, 2026).
Both synoptic-scale and mesoscale atmospheric conditions were analyzed for all 10 events. Since the main focus is on the atmospheric conditions favoring derecho formation in Finland, the role of mesoscale environments is more important for this study. Nevertheless, considering possible synoptic-scale patterns is also essential to understand why derechos occurred during these days. Hence, these synoptic-scale patterns are discussed in Sect. 3.1, before analyzing the mesoscale atmospheric conditions during derechos in Finland in Sect. 3.2.
3.1 Synoptic pattern
Figure 2 illustrates the large-scale weather pattern during three derecho events that occurred in Finland during 2010 and 2021 (storms Asta, Veera and Paula). Similar figures for the other seven cases are presented in the Supplement (Figs. S1–S3).
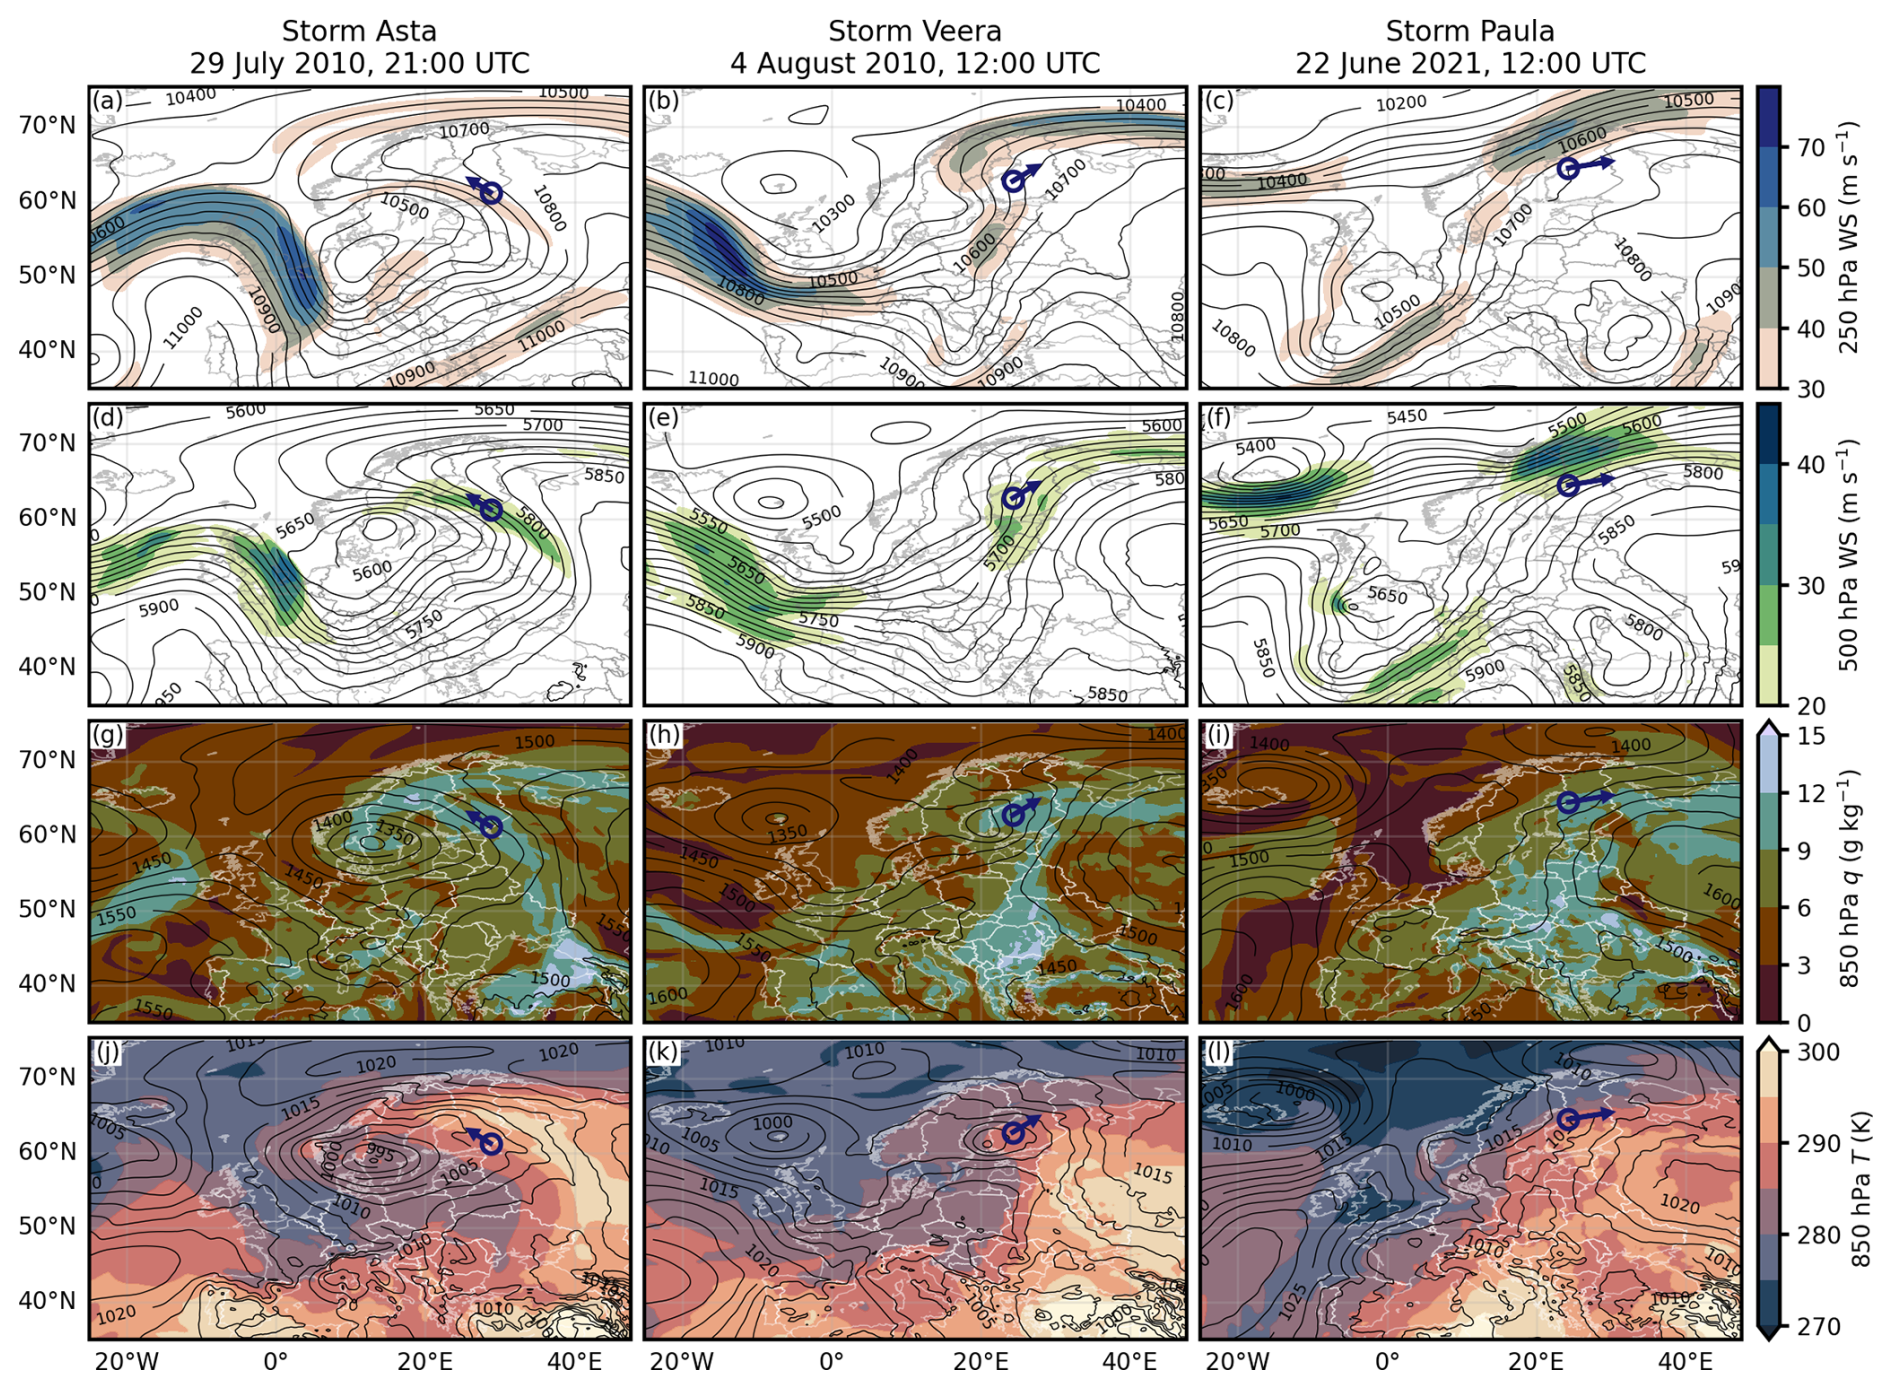
Figure 2Synoptic-scale pattern during the storms Asta (29 July 2010 at 21:00 UTC) in the left column (a, d, g, j), Veera (4 August 2010 at 12:00 UTC) in the center column (b, e, h, k) and Paula (22 June 2021 at 12:00 UTC) in the right column (c, f, i, l). Panels (a)–(c) show wind speed (WS, shading starting from 30 m s−1) and geopotential height at 250 hPa, (d–f) wind speed (WS, shading starting from 20 m s−1) and geopotential height at 500 hPa, (g–i) specific humidity (q, shading) and geopotential height (black contours) at 850 hPa, and (j–l) temperature (T) at 850 hPa (shading) and mean sea level pressure (MSLP, black contours). In all panels, blue circles indicate the approximate location of the systems at the times of the analyses and arrows point to the approximate movement of the system during the following 3 h.
Figure 2a–c show that storms Veera and Paula feature a southerly to southwesterly flow into Finland, whereas the flow is southeasterly during storm Asta. In all three cases, the flow extends from southern Europe into Finland, and is driven by a quasi-stationary high over Russia and a trough digging into central or western Europe. In storm Paula, the trough had developed into a cut-off low prior to derecho formation, whereas in storm Asta it had developed into a mature low. Jet streaks are observed over or just north of Finland, with all three events moving quasi-parallel and on the right-hand side of the jet streak. Moreover, storms Veera and Paula, in particular, are located near the right jet entrance region, which is known to favor ascent.
Figure 2d–f present 500 hPa winds that exceed 20 m s−1 in all three cases. Storms Asta and Veera move under a 500 hPa jet (≥ 20 m s−1), whereas storm Paula is located in the vicinity of a particularly strong midtropospheric jet streak, with the maximum exceeding 35 m s−1.
At the surface, the three events feature a strong high over Russia (Fig. 2j–l). Furthermore, a local surface low is observed, with the low center located over southern Sweden (Asta) or the Baltic Sea in between Finland and Sweden (Veera and Paula). The strongest low-pressure system among all 10 cases is observed during the only nighttime event, storm Asta, which is located near the cold front of the low. For the other two cases, the lows are significantly shallower, with the low associated with storm Veera being deeper than that associated with storm Paula. The air mass over Finland is also very warm and humid in the three cases as the 850 hPa specific humidity (q) exceeds 9 g kg−1 in large areas over Finland (Fig. 2g–i), while the 850 hPa temperature (T) surpasses 285 K in southern and central Finland (Fig. 2j–l). This observation is explained by the quasi-southerly flow, advecting warm and humid air to southern Finland. Finally, Fig. 2j–l indicate that the systems move perpendicular to an 850 hPa horizontal temperature gradient, with colder air to the left of the movement. For storm Paula, this temperature gradient is particularly strong (approximately 15 K (300 km)−1).
Overall, many European warm-season derechos have been associated with an upper-level trough pattern (e.g. Gatzen, 2004; López, 2007; Hamid, 2012; Celiński-Mysław and Matuszko, 2014; Taszarek et al., 2019; Gatzen et al., 2020; Surowiecki and Taszarek, 2020; Chernokulsky et al., 2022), and thus commonly have a meridional component of forward motion, which is also observed in our cases. In fact, the flow into Finland throughout the free troposphere has a southerly component during all 10 events, generally driven by a quasi-stationary high over Russia and a trough digging into central or western Europe. This type of pattern has been observed to increase lightning activity over southern Finland (e.g., clusters 13 and 14 in Ghasemifard et al., 2024). In at least 6 of the 10 cases, the trough has already developed into a cut-off low before the formation of the event (see Table A1 in Appendix A for the corresponding events and figure numbers). This flow pattern advects warm and moist air from southern Europe, resulting in 850 hPa temperature and specific humidity exceeding 285 K and 9 g kg−1, respectively, along the trajectories of all 10 cases. Furthermore, all 10 events seemed to move approximately perpendicular to the 850 hPa horizontal temperature gradient vector and are located either within the region of strongest local gradient or slightly on its warmer side. A similar characteristic has been commonly observed also for the US bow echoes (Johns, 1993) and derechos (Johns and Hirt, 1987), as well as in European derecho events (e.g. López, 2007; Gospodinov et al., 2015).
At the surface, all ten cases feature a strong high over Russia (as in Fig. 2j–l). Furthermore, a weak local low is typically observed, with the low center located over the Nordic countries. Overall, a low centered over the Nordics is found in 9 of the 10 cases (Table A1), excluding only storm Lahja (Fig. S1l).
The 500 hPa wind speed exceeds 20 m s−1 over some parts of Finland in all cases, which is consistent with the strong mid- to upper-level winds identified by e.g. Cohen et al. (2007) as a characteristic of derecho environments. In total, 6 of the 10 cases are located under the 500 hPa jet (Table A1), while the rest of the cases occur in close proximity. These observed 500 hPa wind speed values seem to fall within the range reported in Europe; for example, the 500 hPa flow in a derecho in Poland was found to have been only 10–15 m s−1 (Taszarek et al., 2019), whereas warm season derechos have also been observed to occur under midtropospheric jet streams reaching 40 m s−1 (Celiński-Mysław and Matuszko, 2014). It has also been reported that wind speeds throughout the troposphere tend to be stronger in the environments of the quasi-linear convective systems producing warm-season derechos than in non-derecho-producing systems in Europe, with the largest median difference reported in the midtroposphere (Pilguj et al., 2025). This agrees with our result of derechos in Finland tending to occur under a midtropospheric jet streak. Interestingly, in 6 out of the 10 events (Table A1), the maximum of this jet streak is located directly behind the system (as in storm Veera in Fig. 2e).
Finally, the 250 hPa jet streaks are also observed over or just north of Finland in all ten cases, with derechos moving quasi-parallel to them on their right-hand side. In fact, at least 4 out of 10 of the cases (Table A1) are located in the right jet entrance region which has strong deep-layer vertical wind shear and is a dynamically favorable location for ascent. Additionally, this region lies on the warm side of the jet, with high 850 hPa temperature and humidity values observed in these cases. Of the remaining events, five (storms Unto, Asta, Lahja, Sylvi, and Verneri) are also located near the canonical entrance region but their location relative to the jet streak varies. Storm Saima was both near the left exit of a strong jet on its western side and in the right entrance of a secondary flow maximum on its northern side (Fig. S1b). Similar observations have been made in Europe where derechos have been connected to either the left jet exits (e.g. Gatzen, 2004; López, 2007) or right jet entrances (e.g. Hamid, 2012). Comparable findings have also been reported in the US (e.g. Coniglio et al., 2004; Guastini and Bosart, 2016).
3.2 Mesoscale environments
In this section, the mesoscale atmospheric environments of derechos in Finland are examined, focusing on conditions along their approximate trajectories. The main interest is in the environment throughout the lifetime of each event rather than in single-point extremes. Thus, noting that a variable exceeds a threshold along the full trajectory (recall Fig. 1) means that even the lowest values along the trajectory exceed it (unless otherwise stated). Figure 3 presents mesoscale conditions for the same three example cases shown in Fig. 2. Storms Veera and Paula were selected as representative of an “average” derecho in Finland, as their mesoscale conditions were typical of the range observed in Finland, while storm Asta is an interesting case of being the only known nighttime derecho in Finland. Similar figures for other cases are again available in the Supplement (Figs. S4–S6).
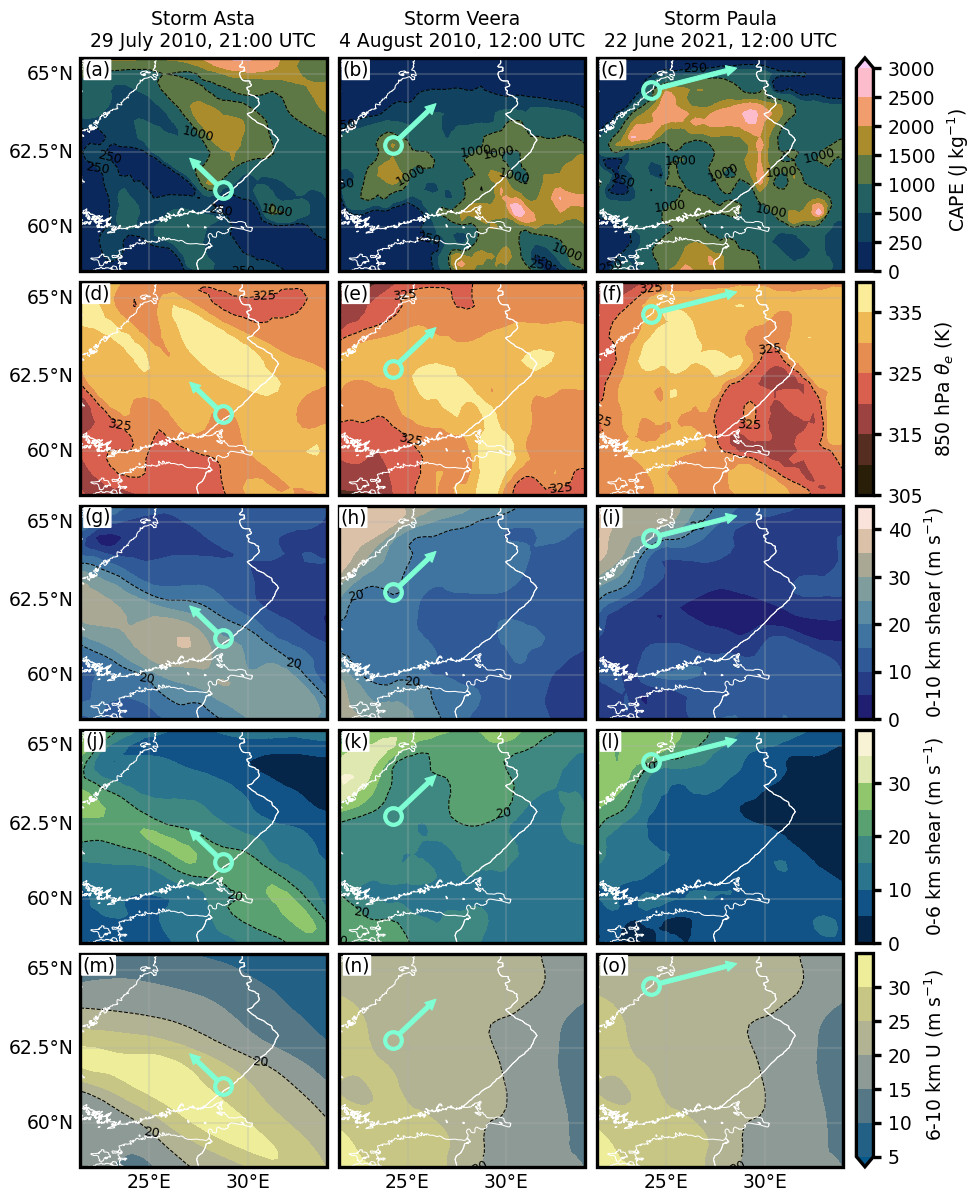
Figure 3Atmospheric conditions in southern and central Finland during the storms Asta (29 July 2010 at 21:00 UTC) in the left column (a, d, g, j, m), Veera (4 August 2010 at 12:00 UTC) in the center column (b, e, h, k, n) and Paula (22 June 2021 at 12:00 UTC) in the right column (c, f, i, l, o). Panels (a)–(c) show CAPE (shading, isolines of 250 and 1000 J kg−1 are also drawn with black dashed contours to help readability), (d–f) equivalent potential temperature (θE) at 850 hPa (shading, 325 K isolines drawn with dashed black contours), (g–i) 0–10 km vertical wind shear (shading, 20 m s−1 isolines drawn with dashed black contours), (j–l) 0–6 km vertical wind shear (shading, 20 m s−1 isolines drawn with dashed black contours) and (m–o) 6–10 km layer mean wind speed (shading, 20 m s−1 isotachs drawn with dashed black contours). In all panels, aquamarine circles indicate the approximate location of the systems at the times of the analyses and arrows point to the approximate movement of the system during the following 3 h.
The high air mass temperature and humidity noted in the synoptic-scale analysis in Sect. 3.1 is suggestive of convective instability in these three cases. Indeed, moderate convective available potential energy (CAPE) values are present during the three derechos (Fig. 3a–c). Throughout the lifetime of storm Veera, CAPE ranges from 500 to 1000 J kg−1 in its near environment (region extending ca. 100 km ahead of the storm along its direction of propagation), which represents mid-range of all analyzed cases. In storm Paula, the CAPE values are among the highest as CAPE exceeds 2000 J kg−1 in the vicinity of the derecho. During the nighttime event, Asta, the CAPE values are slightly higher compared to storm Veera but slightly lower compared to storm Paula. In total, CAPE values surpass 500 J kg−1 along 9 of the 10 trajectories, with only storm Lahja remaining partly below this value (Fig. S4c). The maximum CAPE, exceeding 3000 J kg−1, is observed on the trajectory of storm Sylvi (Fig. S5a), so the variability among the cases is large.
On average, the CAPE values are lower than those reported by Cohen et al. (2007) in the United States (US), as expected given that CAPE tends to be lower in Europe than in the US (Taszarek et al., 2020). Furthermore, Cohen et al. (2007) and Pilguj et al. (2025) also found that derechos typically exhibit lower CAPE than other severe convective storms in the US and Europe, respectively. The relatively frequently occurring elevated mixed layer in the US is likely one reason for higher CAPE values in the US derechos. Additionally, the equilibrium level is higher in the US than in Europe (Taszarek et al., 2020) contributing to higher CAPE values (Yano et al., 2013).
Nonetheless, the CAPE values we observe are similar to or slightly lower than those reported in European derechos. An 18-year climatological study of derechos in Germany noted that a mixed-layer CAPE median for warm-season derechos occurring in Germany was 513 J kg−1 based on proximity soundings (Gatzen et al., 2020), which is close to the ERA5 (most unstable) CAPE values observed in most derechos in Finland. Additionally, most unstable CAPE associated with the formation environment of a derecho in Poland ranged between 1000–2500 J kg−1 (Taszarek et al., 2019), which is comparable to our high-end cases, whereas a derecho in Spain had (surface-based) CAPE exceeding 3000 J kg−1 (López, 2007) near the genesis region, with similarly high (most unstable) CAPE values being observed only for storm Sylvi in Finland. Importantly, the CAPE values we observe do not appear to be higher than those associated with intense MCSs reported by Punkka and Bister (2015). This finding is inline with the results of Cohen et al. (2007) who found that CAPE does not distinguish derecho-producing from non-derecho-producing systems.
High values of equivalent potential temperature (θe) have been reported in several European derecho studies, especially at 850 hPa. For example, in a derecho in Germany (Gatzen, 2004), θe values as high as 340 K were advected to the area, and in a derecho in Belgium (Hamid, 2012), the θe maximum at 850 hPa was ca. 341 K. Our findings (e.g. in Fig. 3d–f) are broadly consistent with these observations. θe (850 hPa) surpasses 325 K in all 10 cases on their trajectories throughout their lifetime, with the maximum value in Finland reaching over 340 K during storm Sylvi (Fig. S5c). Since the 850 hPa θe average over the grid area for the three summer months (considering times 12:00, 15:00 and 18:00 UTC) is 310 K during 2000–2022, the values observed along the derecho trajectories are anomalously large. High values of θe above the boundary layer diminish the adverse effects of entrainment (Derbyshire et al., 2004), and thereby favor strong convection. Additionally, Westermayer et al. (2017) showed that dry mid-level (850–500 hPa) strongly suppresses convective storms even when conditions for convection are otherwise favorable, which could be the reason why derechos in Finland tend to occur only when 850 hPa θe is sufficiently large.
For the kinematic parameters, both the 0–10 km (Fig. 3g–i) and 0–6 km shear (Fig. 3j–l) are relatively strong over large areas during the three example derechos. Indeed, the 0–6 km shear is well above 15 m s−1 along the trajectories of storms Veera and Paula. Nevertheless, the strongest deep-layer shear is noted during storm Asta, where the 0–6 and 0–10 km shears exceed 25 and 30 m s−1, respectively. However, due to the locations of the jet streaks (recall Sect. 3.1), the highest 0–10 km shear values are generally located to the left of the derecho trajectories, whereas the highest 0–6 km shear values generally match better along the trajectories due to derechos being located under or in the vicinity of the 500 hPa jet. In two cases (storms Unto (Fig. S4g) and Verneri (Fig. S6f), the 0–10 km shear is even below 10 m s−1 on the trajectories. Additionally, the 0–6 km shear is stronger than the 0–10 km shear during storms Unto (Fig. S4), Lahja (Fig. S4) and Verneri (Fig. S6) which is the opposite to the other events. Storm Verneri stands out as an outlier, with abnormally weak upper-level winds and relatively low instability compared to other events. Furthermore, the surface winds (as observed from the MSLP contours in Fig. S3h) were stronger during Verneri, partly explaining the weaker deep-layer shear.
While the variability in the 0–6 km shear is relatively small, with a majority of the values being above 15 m s−1, the 0–10 km shear exhibits considerably larger variability between the events as the values vary approximately from 5 to 35 m s−1 along the trajectories. Cohen et al. (2007) found that 90 % of the US derechos experienced the 0–10 km shear stronger than about 19.5 m s−1, which is higher than in most of our cases. Only during storm Asta the 0–10 km shear exceeds 19.5 m s−1 along the trajectory throughout the lifetime of the system. Thus, the 0–10 km shear is relatively weak in derechos in Finland compared to the US. Additionally, the equilibrium level for lightning events is lower in Europe than in the US (Taszarek et al., 2020), implying that shear between the near-surface and 10 km wind may be less relevant for European convective environments. Therefore, it was considered whether the 8 km altitude should be used instead of the 10 km altitude. However, Pearson correlation between the 0–10 km shear and 0–8 km shear in convective situations (in grid points where CAPE ≥ 250 J kg−1) is strong (0.89) during 1980–2022, suggesting that the use of 0–10 km shear is adequate. Additionally, the difference between our observations and US derechos regarding the 0–10 km shear is expected as Taszarek et al. (2020) found that the vertical wind shear in European convective environments is generally weaker than in the US. We also use the 100 m altitude as ground (0 km altitude) which might play a minor role in our shear value comparison.
On the other hand, Cohen et al. (2007) found that the 0–6 km shear exceeded approximately 12 m s−1 in 90 % of the US derechos, and this value is met during every derecho in Finland, with a small majority of the events surpassing 15 m s−1 along the trajectories (as in Fig. 3j–l). While the 0–6 km shear values are known to be underestimated in ERA5 compared to soundings (Taszarek et al., 2021b), the observed 0–6 km shear values in Finland are still clearly lower than, for example, in Germany where a median of 20.1 m s−1 was reported based on proximity soundings for an 18-year warm-season derecho climatology (Gatzen et al., 2020).
Finally, the 6–10 km U exceeds 20 m s−1 along the trajectories of the three example derechos (Fig. 3m–o). Across all the events, the 6–10 km U surpasses 15 m s−1 along the full trajectory, except for storm Aatu (Fig. S6i). The result is consistent with the US derechos since 90 % of them experienced upper-level winds stronger than approximately 16 m s−1 (Cohen et al., 2007). The strongest 6–10 km mean winds (> 25 m s−1) are observed during storms Saima (Fig. S4n) and Asta (Fig. 3m), with the former being associated with a particularly strong upper-level jet, and the latter influenced by the moderately deep low-pressure system.
In total, three sets of criteria were developed to capture environments favoring derecho formation in Finland. Two of these are based on the findings of Cohen et al. (2007) and the analysis of CAPE during derecho events in Finland (Sect. 3.2). They are discussed in Sect. 4.1. However, atmospheric conditions in Europe, particularly in Finland, differ from those in the US (Taszarek et al., 2020). Therefore, the third criteria set was derived from the analysis of atmospheric conditions of the 10 events in Finland (Sect. 3.2), and it is introduced in Sect. 4.2. The performance of all three criteria sets is then evaluated for the Finnish derecho cases in Sect. 4.3.
4.1 10 and 6 km criteria sets
The 10th percentiles for the discriminating variables (recall Sect. 2.3) found by Cohen et al. (2007) were selected as baseline thresholds for the criteria sets. These thresholds correspond roughly to 19.5 m s−1 for 0–10 km shear, 12 m s−1 for 0–6 km shear and 16 m s−1 for 6–10 km U. Even though CAPE was not found to be a discriminating variable, it was used as a proxy to distinguish derecho environments from non-convective windstorms. Since all ten cases exceeded a CAPE value of 250 J kg−1 along their trajectories (Sect. 3.2), it was selected as the minimum threshold for a derecho-favoring environment in Finland.
The first criteria set, hereafter the 10 km criteria set, required that the 0–10 km shear, 6–10 km U and CAPE meet their respective minimum thresholds of 19.5 m s−1, 16 m s−1 and 250 J kg−1 at the same grid point. Since the formation of derechos requires favorable atmospheric conditions over a sufficiently large area, it was also required that at least 3.5 % of the selected grid area (Sect. 2.1) satisfy these thresholds. The area fraction was chosen so that the Finnish derecho events would meet the criteria at least once per day (1pd), with the exception of the outlier storm Verneri. This area was not required to be contiguous since derechos do not necessarily decay when passing through small regions that are not favorable.
Table 2Threshold values for parameters in all three criteria sets.
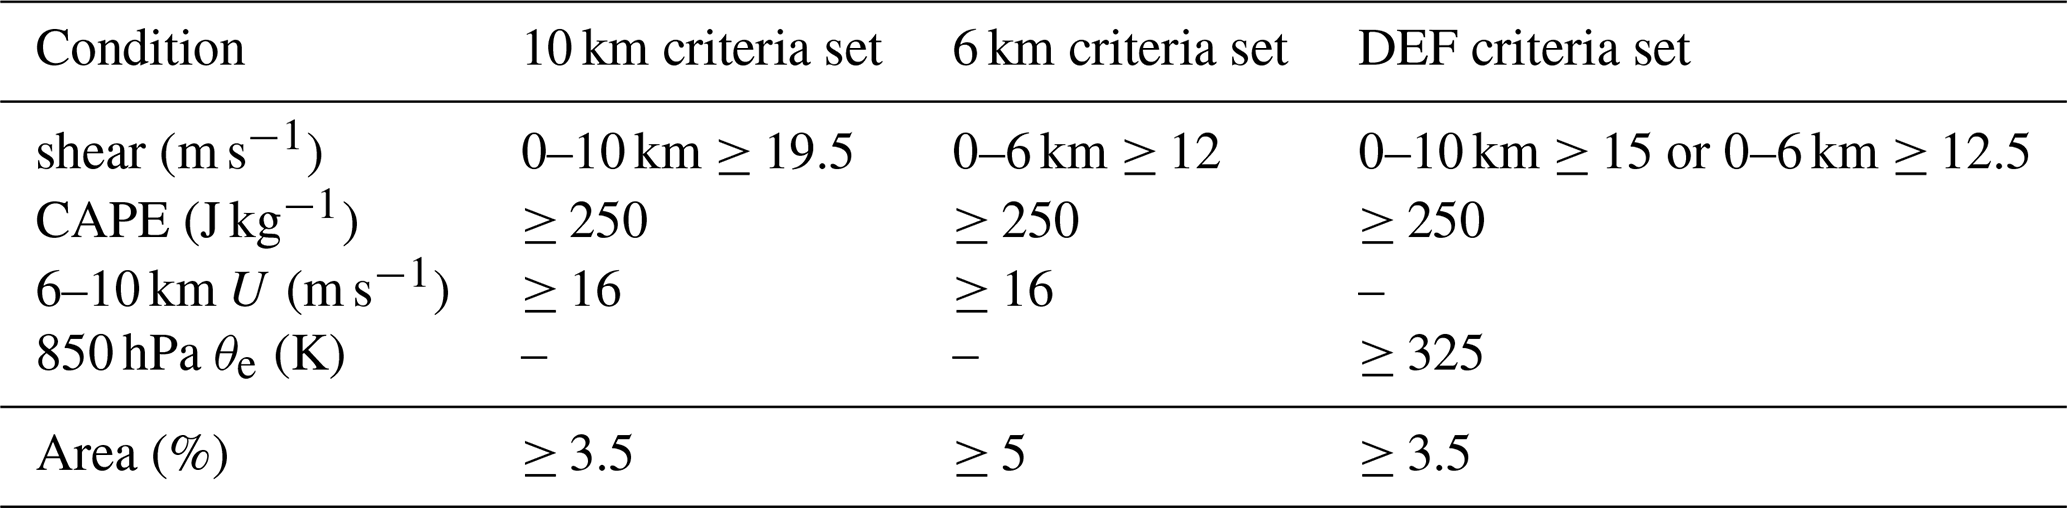
The second criteria set, hereafter the 6 km criteria set, was similar to the 10 km criteria set but it used 0–6 km shear and its respective threshold value of 12 m s−1 instead of 0–10 km shear. Additionally, the required area fraction was increased to 5 %. The 6–10 km U and CAPE thresholds remained the same as in the 10 km criteria set. The overview of criteria sets and their respective thresholds is summarized in Table 2.
4.2 Derecho-favoring environments in Finland criteria set
The 10 and 6 km criteria sets have limitations, which are discussed in Sect. 4.3. Thus, the third criteria set, hereafter the Derecho-favoring environments in Finland (DEF) criteria set, was developed to adapt the 10 and 6 km criteria set framework to the specific atmospheric conditions in Finland. It was tailor-made to be satisfied during the observed summertime derechos in Finland along their trajectories throughout their lifetime, including the outlier storm Verneri. The adaptation of parameter thresholds was done by selecting values that are marginally exceeded in the observed cases and that minimize the number of DEF-positive days otherwise.
The CAPE condition in the DEF criteria set was implemented in the same manner as in the 10 km and 6 km criteria sets, with the minimum threshold of 250 J kg−1. Since the results of Sect. 3.2 showed that particularly high 850 hPa θe values were present along the derecho trajectories, the 6–10 km U criterion used in the 10 and 6 km criteria sets was replaced with an 850 hPa θe threshold of 325 K. Similar to the CAPE criterion, this threshold was marginally satisfied along the trajectory of every event. Conversely, the 6–10 km U criterion was found to provide negligible additional value to the DEF criteria set.
We also considered using the difference of θe at the surface and midtroposphere (Δθe) since it is considered as an indicator for damaging microbursts (Atkins and Wakimoto, 1991). However, the variability between the cases was too high (from approximately 5 to 25 K, not shown), and therefore Δθe was eventually not used. The variability in Δθe in European derechos has also been found to be high in other studies (e.g., Pilguj et al., 2025).
In the DEF criteria set, the two shear parameters from the 10 and 6 km criteria sets were combined into a single combined shear criterion. Based on the results of Sect. 3.2 and additional sensitivity testing, merging the areas satisfying the 0–10 and 0–6 km shear thresholds produced a larger favorable area that better aligned with the derecho trajectories without substantially increasing the number of favorable days on which no derechos were observed. First, the 0–6 km shear threshold was increased from 12 to 12.5 m s−1 (compared to the 6 km criteria set) since this change did not significantly reduce the size of favorable area on derecho days, but it nevertheless reduced the number of favorable days on which derechos did not occur. Increasing the threshold further to 13 m s−1, however, made the criteria too restrictive for some events. Secondly, reducing the 0–10 km shear threshold (compared to the 10 km criteria set) from 19.5 to 15 m s−1 and requiring that at least one of the two modified shear criteria to be satisfied (0–10 km shear > 15 m s−1 or 0–6 km shear > 12.5 m s−1) provided the best trade-off between limiting the number of favorable non-derecho days and still capturing all derecho events.
The combined shear, 850 hPa θe and CAPE conditions were required to be satisfied simultaneously at the same grid point. As in the 10 km criteria set, these conditions also needed to be met over at least 3.5 % of the grid area. Compared to the 10 and 6 km criteria sets in which the area thresholds were selected so that the criteria sets were satisfied at least once on a derecho day, the DEF criteria set was required to be met at all three analyzed times. The area fraction for the DEF criteria set could have been set higher if storm Verneri had been excluded. However, given the small number of derechos observed in Finland, it was decided to not omit any event. The threshold values for the DEF criteria set are also summarized in Table 2.
4.3 Evaluation of criteria sets
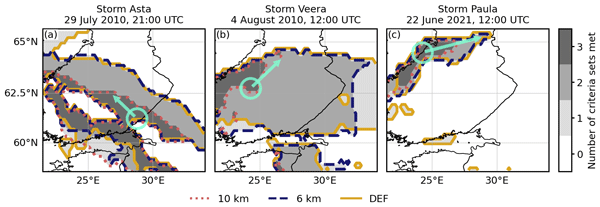
Figure 4 shows the performance of all three criteria sets during storms Asta, Veera and Paula at the same analysis times as in Figs. 2 and 3 (performance during the seven other events is shown in Figs. S7–S9). In both cases, all three criteria sets are satisfied in sufficiently large areas in the surroundings of the observed locations of the derechos. During storms Asta and Paula, in particular, the area where all three criteria sets are satisfied aligns well along the trajectory of the system (Fig. 4a, c).
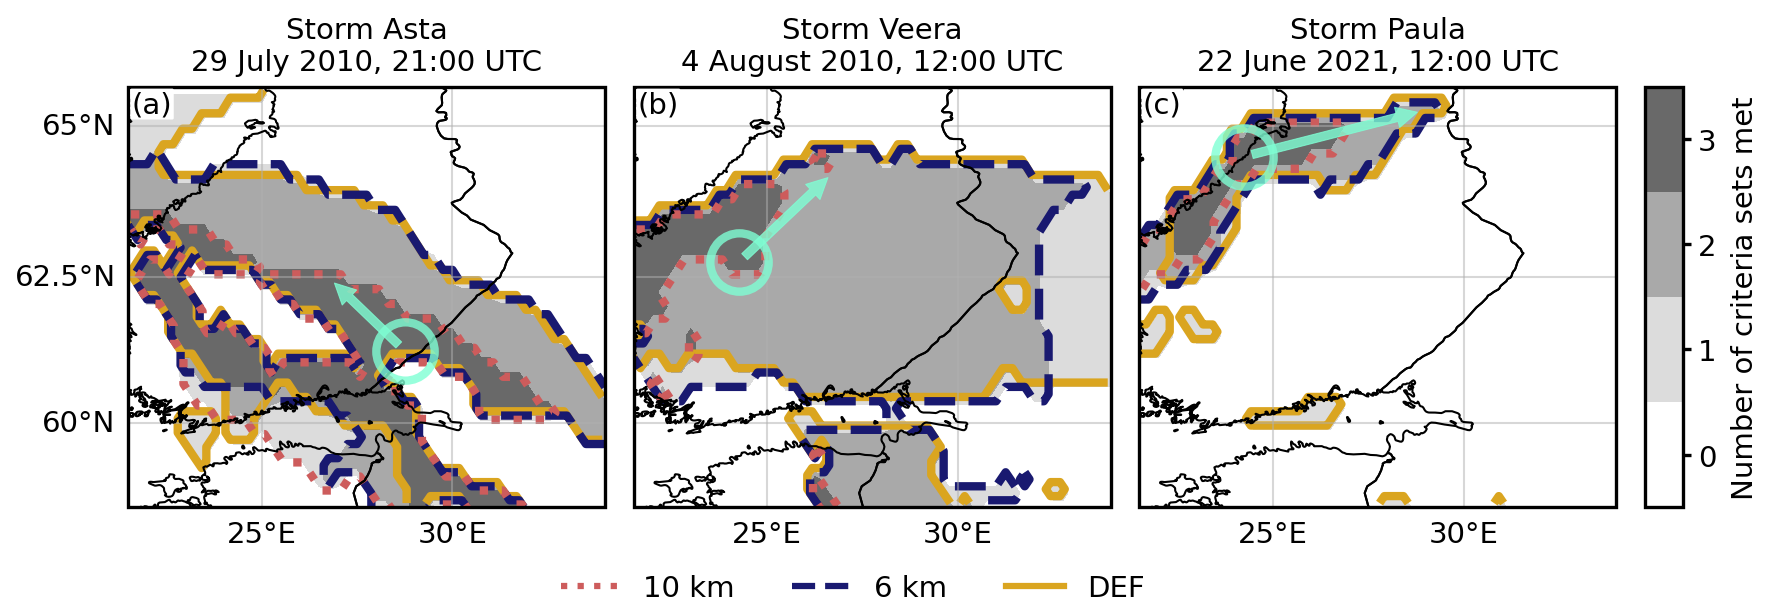
Figure 4Areas satisfying each criteria set during the storms Asta (29 July 2010 at 21:00 UTC) in panel (a), Veera (4 August 2010 at 12:00 UTC) in panel (b) and Paula (22 June 2021 at 12:00 UTC) in panel (c). Shades of gray indicate how many of the three criteria sets are met in each grid cell. The areas satisfying the 10 km criteria set are outlined with red dotted lines, the 6 km criteria set with blue dashed lines and the DEF criteria set with gold solid lines. Aquamarine circles indicate the approximate location of the systems at the times of the analyses and arrows point to the approximate movement of the system during the following 3 h.
In the case of storm Veera, a quite common problem for the 10 km shear criteria set arises: the satisfied area is more to the left of the derecho trajectory than along it (Fig. 4b). The problem is even worse for storm Unto (Fig. S7a) as the region satisfied by the 10 km criteria is ca. 150 km to the left of the trajectory due to weaker upper-level winds. Overall, the 10 km criteria set aligns moderately with the path of the derecho in roughly 6 out of 10 events. However, this set fails in Unto (as mentioned above) and Verneri (where the 10 km criteria were not fulfilled anywhere in the study area, Fig. S9b). Additionally, during storms Lahja (Fig. S7c) and Aatu (Fig. S9a) the regions where the 10 km criteria set is satisfied are too far to the north. Therefore, we can conclude that the 0–10 km shear threshold of 19.5 m s−1 is too strict for some derechos, which relates to the jet stream at 250 hPa being more leftward relative to the derecho's trajectory. Hence, the area satisfied by the 10 km criteria is generally smaller than for the other two criteria sets during the derechos.
The 6 km shear criteria set works better than the 10 km criteria set since the satisfied regions match better with the paths of the derechos. Still, some limitations are obvious. Similarly as for the 10 km criteria, the regions satisfied by the 6 km criteria during storm Aatu (Fig. S9a) are too much to the north due to the weaker midtropospheric winds (Sect. 3.2). Also, in the outlier storm Verneri, it was only satisfied once per day (Fig. S9b). Furthermore, even though the satisfied regions during storm Lahja were closer to the location of the system compared to the 10 km criteria (Fig. S7c), they were still slightly too far to the north because the regions fulfilled by the 6–10 km U and CAPE thresholds did not coincide. Nonetheless, the 6 km criteria set outperformed the 10 km criteria set as it was satisfied very well along the trajectories of the seven remaining cases.
The DEF criteria set was developed to avoid the aforementioned issues, and it matched quite well with all 10 cases. However, since the formation environments for derechos varied, it was not possible to achieve one perfect criteria set. For example, the outlier storm Verneri was a tricky one to include in any criteria set. Additionally, in the near surroundings of storm Saima (Fig. S7b), CAPE and 850 hPa θe (Fig. S4b, e) were untypically low, although they were rapidly increasing along the trajectory. Despite these minor problems, the DEF criteria set captured well the environments favoring derecho formation in Finland.
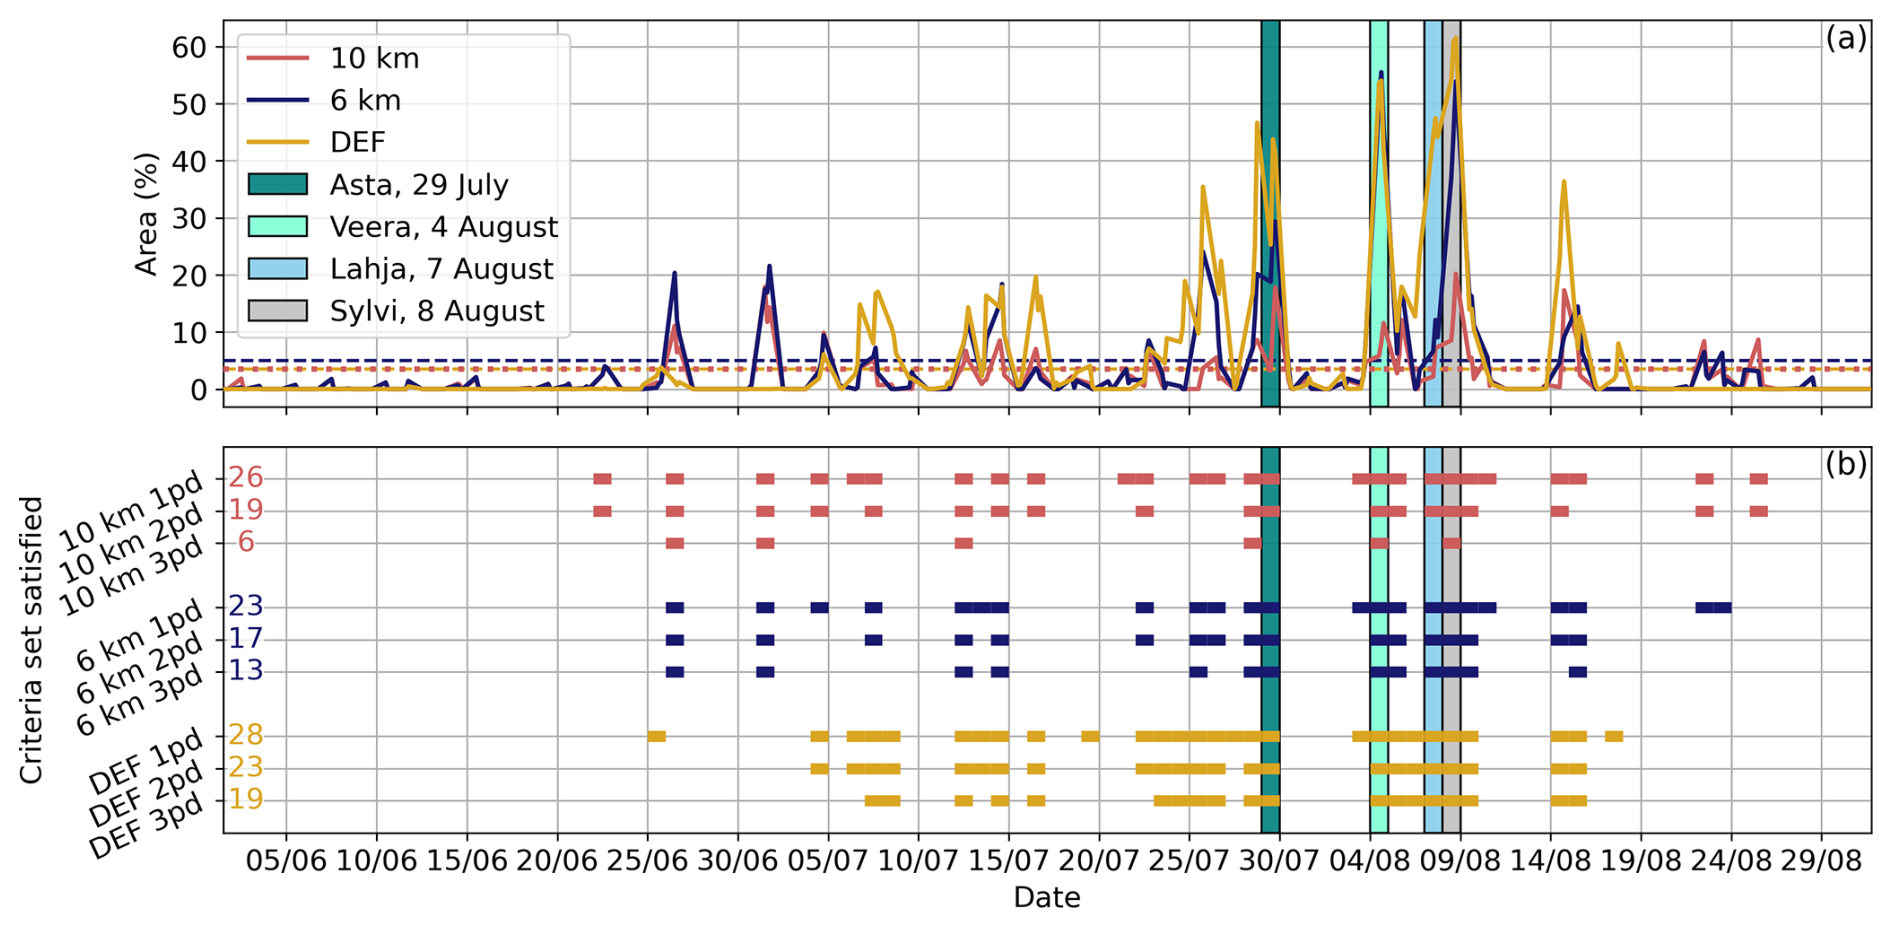
Figure 5Performance of the criteria sets during the summer of 2010. Vertical bars in both panels indicate days when derechos occurred. Panel (a) shows the fraction (%) of the grid area where each criteria set is satisfied. The red line represents the 10 km criteria set, the blue line the 6 km criteria set, and the gold line the DEF criteria set. Data includes three time steps per day (12:00, 15:00, and 18:00 UTC), as described in Sect. 2.4. Horizontal lines illustrate the area demands for each criteria set: 5 % for the 6 km criteria set (blue, dashed) and 3.5 % for both the 10 km (red, dashed) and DEF criteria sets (gold, dotted). Panel (b) presents the favorable days throughout the summer for each criteria set, with conditions satisfied once per day (1pd), twice per day (2pd) and at all three times per day (3pd), illustrated with bold lines. Total number of favorable days for each category is indicated on the left side of the panel.
Figure 5 demonstrates the performance of all three criteria sets during the summer of 2010 which was an exceptionally warm summer in Finland and resulted in four derecho days in a span of 1.5 weeks. The regions where the criteria sets are satisfied in comparison to the grid area are quite large during the derecho days, especially for the 6 km and DEF criteria sets, with relative area values exceeding 50 % during storms Veera and Sylvi (Fig. 5a). Overall, Fig. 5a shows that all criteria sets easily meet the requirements for classification of a favorable day for derecho (recall Sect. 2.4), with conditions being satisfied at least once per day (1pd) of the three analyzed times (12:00, 15:00 and 18:00 UTC). All of the criteria sets also satisfy the conditions at least twice per day (2pd), but the 10 km criteria set is not satisfied at all three times (3pd) on the days of storms Asta and Lahja (Fig. 5b). Storm Asta is the only event that occurred mostly during the night, and therefore the favorable conditions (based on the 10 km criteria set) were present slightly later during the day compared to other events. For storm Lahja, the regions satisfying the 0–10 km shear and CAPE conditions did not coincide well.
From Fig. 5b, we can also determine how many favorable days each criteria set captures during the summer of 2010, with conditions satisfied 1pd, 2pd and 3pd. The number of favorable days (N) decreases when more times (pd's) are required, as expected. Nevertheless, N is much larger for all the criteria sets and pd’s than the number of derecho days (four). One reason for this may be that the criteria do not account for whether convection is actually initiated. Nonetheless, the summer of 2010 was indeed special due to its prolonged periods of warm and humid air mass being present in Finland. During the time periods when the conditions were satisfied (e.g. in early/mid July), severe thunderstorms occurred in Finland, but they were not classified as derechos.
During the other summers when derechos occurred (2002; Fig. S10, 2006; Fig. S11, 2021; Fig. S12, and 2022; Fig. S13), N is clearly smaller than in the summer of 2010. For example, the DEF criteria set finds only six favorable days for the 1pd condition and four for both 2pd and 3pd from the summer of 2006 (Fig. S11). Nevertheless, there were also more derechos in summer 2010 than in other summers, indicating that the prevalence of N is related to the frequency of derechos, including the 2010 indirect series of derechos (as defined by Ashley et al., 2007).
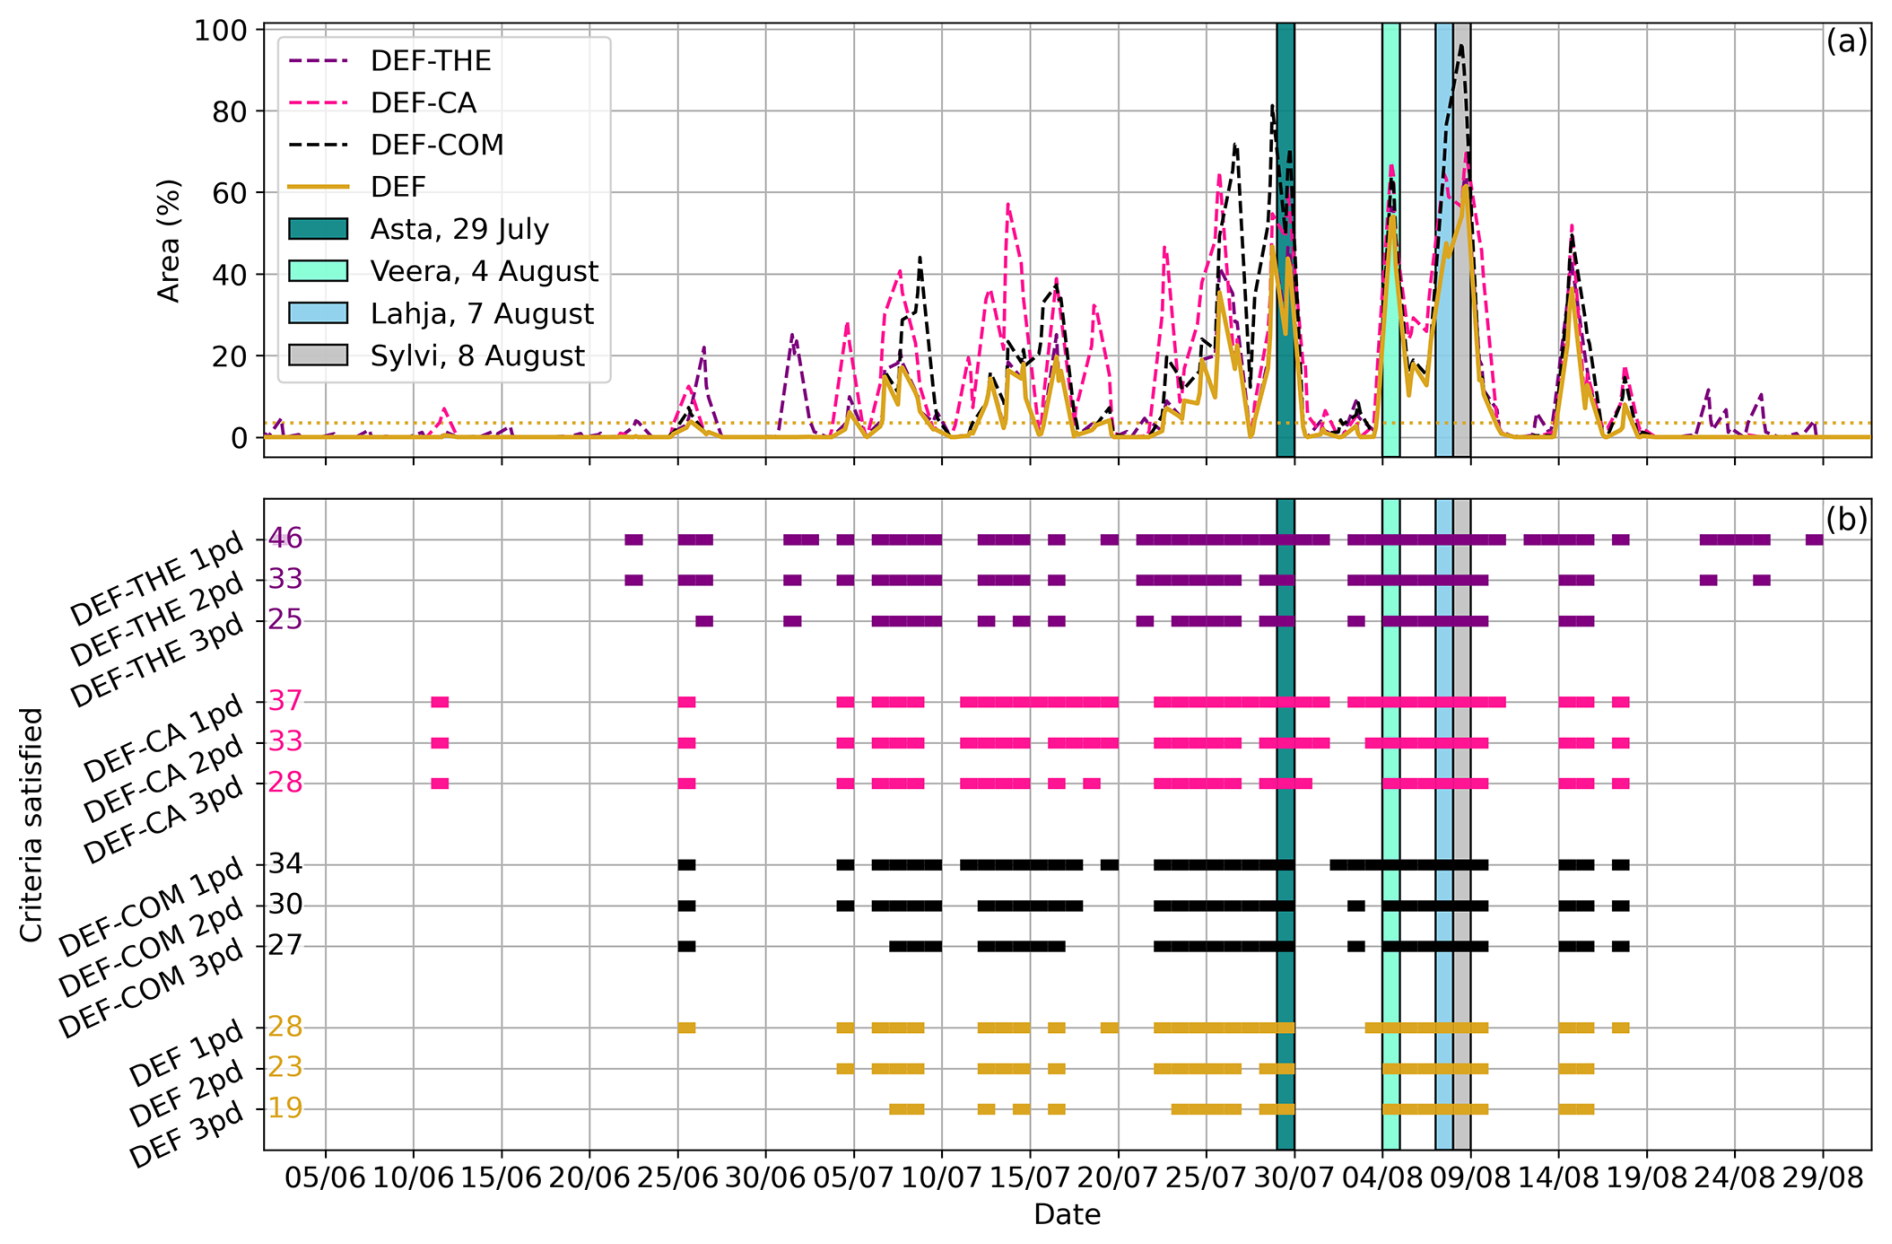
Figure 6As in Fig. 5 but for combinations of criteria within the DEF criteria set, with the dashed lines representing the DEF criteria set excluding the 850 hPa θE≥325 K condition (DEF-THE, purple), CAPE ≥ 250 J kg−1 condition (DEF-CA, pink) and combined shear condition (DEF-COM, black). The gold solid line shows the full DEF criteria set (DEF) as a reference.
Since the DEF criteria set is the best suited for derechos in Finland, the impacts of its individual criteria conditions to N are studied in more detail. Figure 6 illustrates how excluding one condition at a time from the criteria set affects the area of satisfied conditions (a) and N (b) during the summer of 2010. From both panels, it can be determined that each individual criterion has an effect on N. Despite the combined shear criterion (recall Sect. 4.2) being satisfied during most of the summer, at least somewhere within the grid area (not shown), it still contributes to the DEF criteria set. In fact, the areas where the shear criterion is satisfied do not necessarily match with the areas where the other conditions (CAPE and 850 hPa θe) are fulfilled.
Importantly, during the summer of 2010, the combined shear and CAPE conditions (DEF-THE) were quite often satisfied at least once per day, but when they were demanded to be met at least twice per day, N clearly decreased. This observation repeats across all derecho summers (2002; Fig. S14, 2006; Fig. S15, 2021; Fig. S16, and 2022; Fig. S17). Furthermore, N obtained without the θe condition is much higher compared to that obtained with the full DEF criteria, particularly during derecho summers other than 2010 (Figs. S14–S17). Thus, it is not rare for shear and CAPE to meet their respective criteria conditions simultaneously, but it is much less common that high values of shear, CAPE and 850 hPa θe coexist for a prolonged time period (> 3 h). Thus, a key strength of the criteria set is its ability to discriminate derecho-producing atmospheric environments from those that do not produce derechos. In particular, the results in Fig. 6 highlight the importance of 850 hPa θe in the DEF criteria set and the presence of high 850 hPa θe during derechos in Finland.
In this section, the frequency of environments favoring derecho formation is analyzed by applying the criteria sets discussed in Sect. 4.1–4.2 and using the trend analysis methods described in Sect. 2.4. The focus is mainly on determining whether the frequency has changed during recent decades. The number of favorable days (N) for every summer within the 1940–2022 time range is shown in Fig. 7. It was obtained by applying each criteria set separately, with the conditions required to be satisfied at least twice per day (2pd). Similar figures for at least once per day (1pd) and at all three times (3pd) cases are in the Supplement (Figs. S18–S19).
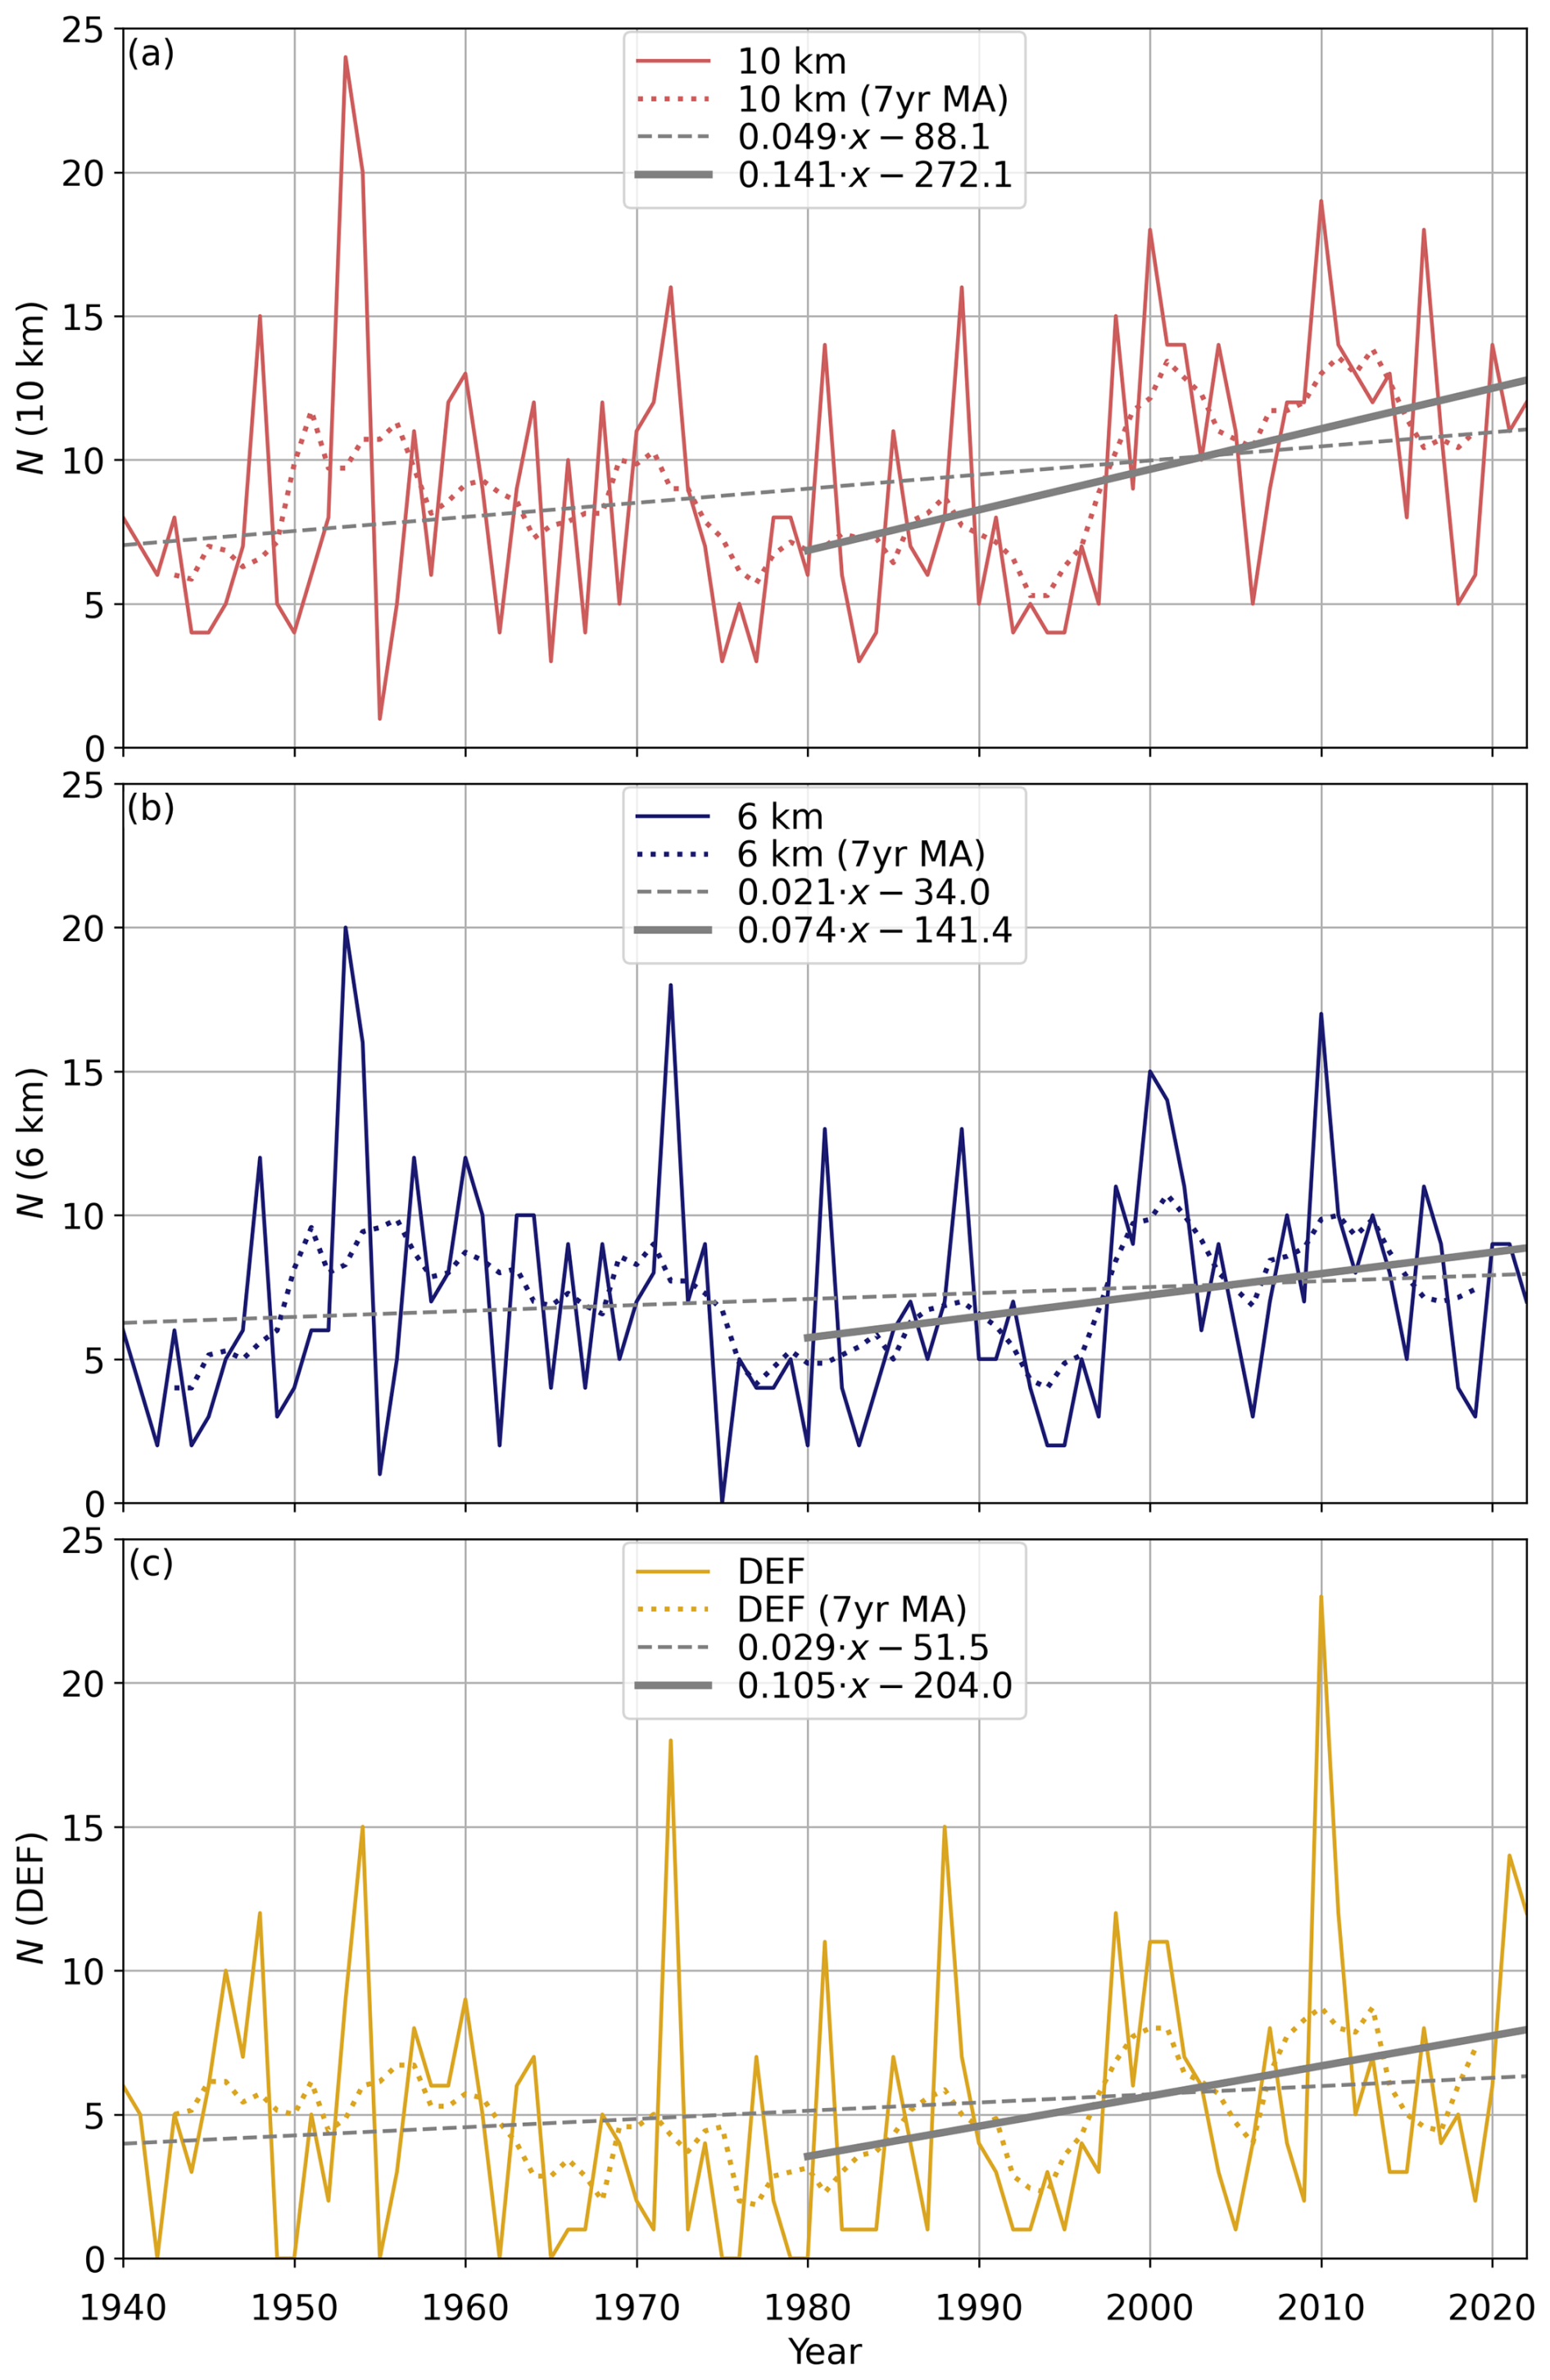
Figure 7Number of favorable days (N) per year, with conditions satisfied at least twice per day (2pd), obtained with the 10 km criteria set (a, solid red line), 6 km criteria set (b, solid blue line) and DEF criteria set (c, solid gold line). Linear regressions are fitted to each panel for both the 1940–2022 time range (dashed gray lines) and 1980–2022 time range (solid gray lines). The dotted lines represent 7-year moving averages (7yr MA).
The first observation from Fig. 7 is that the interannual variability in N across all criteria sets is large, with N ranging, for example, for the DEF criteria set from 0 to 23. Summers 1954, 1972, and 2010 stand out with particularly high N. To highlight differences among the criteria sets, summer 1953 is found to be extremely favorable for derechos by the 10 and 6 km criteria sets with N being 24 and 20, respectively, but the DEF criteria only captures 9 favorable days. Conversely, the DEF criteria obtains 15 favorable days from summer 1988, while the 10 and 6 km criteria sets are only satisfied on 8 and 7 d, respectively.
Opposite to Fig. 5 in Sect. 4.3 where the DEF criteria set produced the highest N during summer 2010, it actually captures the least N on average within the whole time range, again highlighting the unusualness of summer 2010. In fact, the DEF criteria set identifies 5.2 favorable days on average per summer, whereas the 10 and 6 km criteria sets obtain 9.0 and 7.1 d, respectively. For 1pd, the respective averages were 17.6 for the 10 km criteria set, 13.3 for the 6 km criteria set and 6.9 for the DEF criteria set. On the other hand, applying the 3pd condition decreased N with all criteria set as the averages were 4.5, 3.6 and 3.3 for the 10 km, 6 km and DEF criteria sets, respectively.
Table 3Pearson and Spearman correlations and p-values for the 10 km, 6 km and DEF criteria sets, with conditions satisfied either 1pd, 2pd or 3pd. Results are shown for 1940–2022 and 1980–2022 periods side by side. Statistically significant correlations (p < 0.05) are bolded.
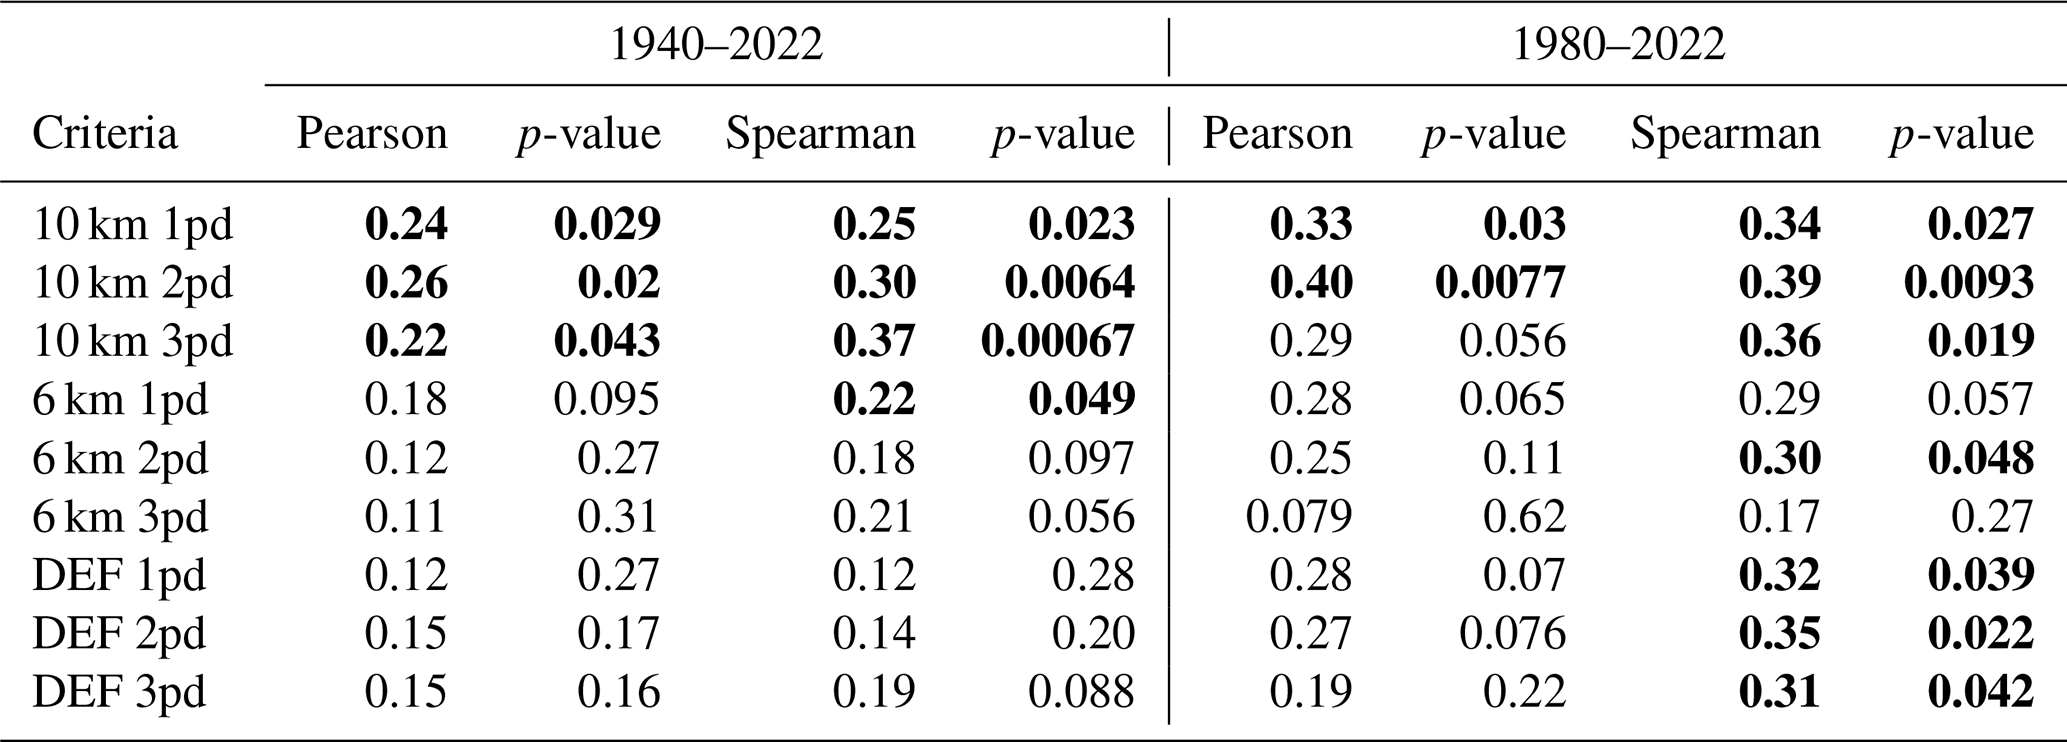
Linear regression lines were computed for all criteria sets for both the 1940–2022 and 1980–2022 time ranges (Fig. 7). The key finding is that the trends are positive across all criteria sets (and “pd's”), for both 1940–2022 and 1980–2022. Even though the trend slopes were significantly different from zero for only the 10 km criteria set (see p-values in Table 3), the fact that all slopes are positive gives an indication that the atmospheric conditions favoring derecho formation have become more frequent during recent decades. Furthermore, steeper slopes are observed for the 1980–2022 time range, during which the climate has clearly become warmer (IPCC, 2023). We can observe the trend also visually from 7-year moving averages, as the averages are clearly higher during the last 25 years (1998–2022) than during the preceding 25 years (1973–1997). All the observations in this paragraph are also true for the 1pd (Fig. S18) and 3pd (Fig. S19) cases.
The computed Pearson and Spearman correlations in Table 3 confirm the findings from Fig. 7. The correlations are not strong, moderate at most, with statistically significant correlations ranging from 0.22 to 0.4. The fact that the correlations are not strong and not always statistically significant is probably partly due to the high interannual variability in N. This statement is supported by the fact the Spearman correlations are in general higher than the Pearson correlations, as the rank-based Spearman correlation is less sensitive to the spikes in the data than the linear Pearson correlation.
While the correlations obtained applying the 10 km criteria set are mostly statistically significant, the correlations obtained with the 6 km or DEF criteria sets are commonly not. However, all Spearman correlations calculated for the shorter time range with the 2pd condition are statistically significant, ranging from 0.3–0.39. The correlations also confirm that the trends within the 1980–2022 time range are in most cases stronger than within the 1940–2022 time range.
As N is highly variable, the correlations and their statistical significance might depend on the start year of the trend analysis. Since the choice of 1980 as a start year is somewhat arbitrary, we also computed the mean Spearman correlation and p-value for trend analysis from different start years within 1975–1985 (mean of 11 time ranges in total). The averages of these statistics are very similar to those obtained with 1980 as the start year. For example, an average Spearman correlation of 0.35 (same as for 1980) and p-value of 0.04 were calculated for the DEF 2pd case.
When analyzing the trends in environments favoring derecho formation, it is necessary to keep in mind the performance of each criteria set. Although the 10 km criteria set produces the strongest trends, it was the worst performing criteria set, as noted in Sect. 4.3, which decreases the validity of the trends. On the other hand, the 6 km criteria set was satisfied in all cases other than storm Verneri when applying the 2pd condition, and it matched better with the trajectories than the 10 km criteria set, but it produces only one statistically significant correlation. The DEF criteria set satisfied all 10 events even when using the 3pd condition and matched relatively well with the trajectories of all cases. Importantly, all the Spearman correlations are statistically significant for the shorter (1980–2022) time range when applying the DEF criteria set. This observation allows us to state with a relatively strong confidence that the conditions favoring derecho formation have become more frequent during the era of global warming.
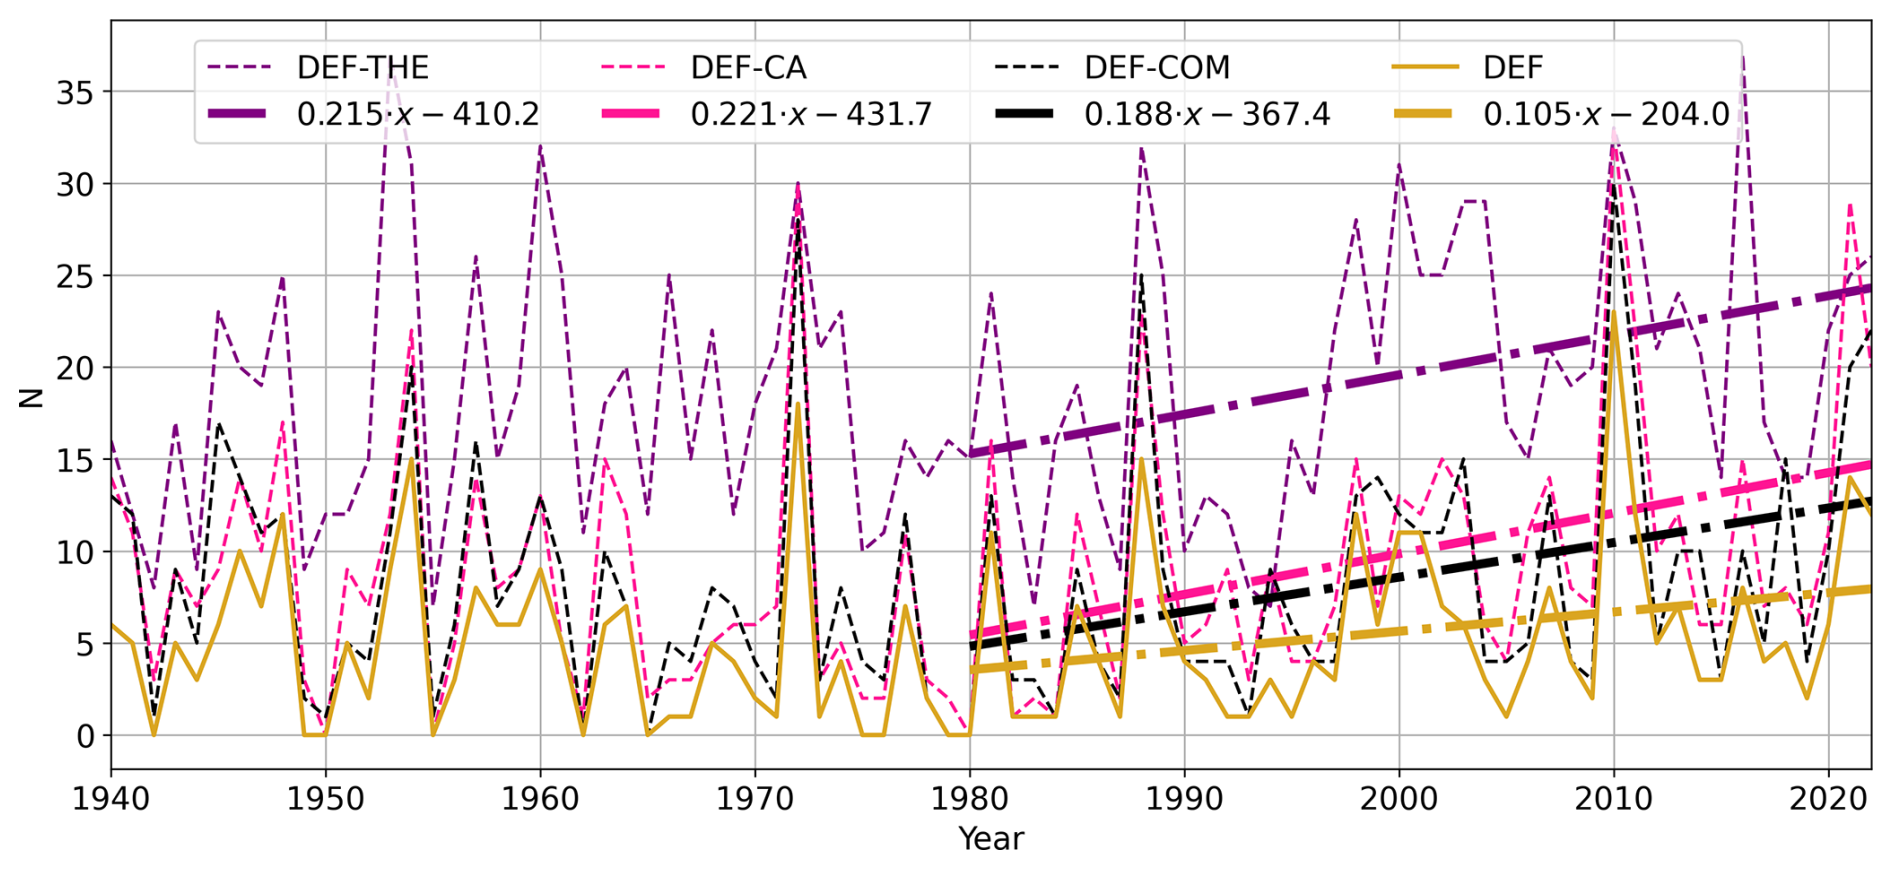
Similarly as done for the summer of 2010 in Sect. 4.3, impacts of the individual criteria conditions within the DEF criteria set to the trends are also assessed. Figure 8 shows that when the 850 hPa θe condition is left out from the DEF (2pd) criteria set (DEF-THE), it produces clearly higher N than the full DEF criteria set. Thus, the 850 hPa θe condition dominates in the DEF criteria set, something which was not evident from the results for summer 2010 in Fig. 6. Despite this dominance, all conditions still contribute to the DEF criteria set. For example, the combined shear condition is satisfied somewhere within the grid area during most of the summers (not shown), but still it has an impact to the DEF criteria set as a higher N resulted from the criteria set excluding the combined shear condition (DEF-COM) than from the full DEF criteria set. The same conclusions can be drawn using either the 1pd (Fig. S20) or 3pd (Fig. S21) conditions.
The linear regression lines in Fig. 8 for the 1980–2022 time range reveal that the frequency of the combined shear and 850 hPa θe conditions (DEF-CA) co-occurring has increased the most, by nearly 200 %. Conversely, the occurrence of the full DEF criteria has increased less than its stripped versions.
Table 4Similar to Table 3 but for the same criteria combinations within the DEF criteria set as in Figs. 6 and 8.
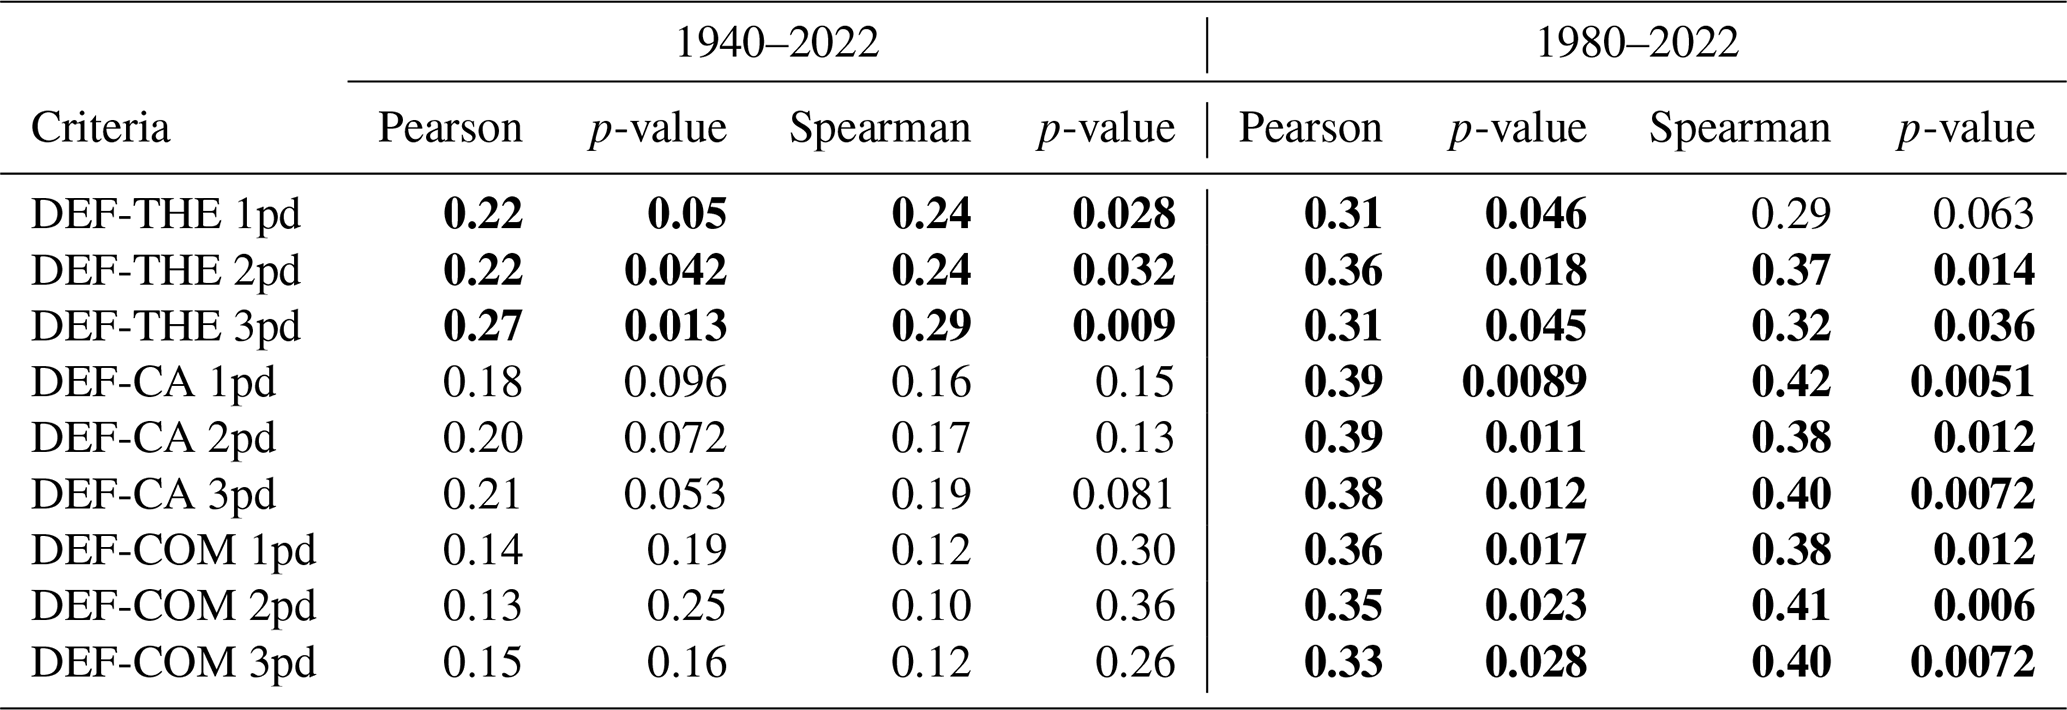
Based on the Pearson and Spearman correlations, the 1980-to-2022 frequency trends for all the DEF criteria combinations are statistically significant, except for the DEF-THE 1pd case, as shown by Table 4. The contrast between the two time ranges in Table 4 is even larger than for the full DEF criteria set in Table 3. The most striking difference is observed when the combined shear condition is excluded from the DEF criteria set (DEF-COM). While the shorter 1980-to-2022 time range presents moderate (0.33–0.41) statistically significant correlations, the longer 1940-to-2022 time range shows very weak correlations that are not statistically significant. Therefore, environments where higher values of both CAPE and 850 hPa θe coexist have clearly become more common during recent decades.
We now proceed to explore some of the large-scale climate factors that might affect the interannual variability and trends in the frequency of derecho-favoring environments. The most obvious candidates include variations in the atmospheric circulation (as quantified by teleconnection indices) and the gradual warming of climate. The frequency of derecho-favoring environments (N) is here characterized by the DEF 2pd criteria set. However, the interpretation of the results does not change when using either DEF 1pd or DEF 3pd.
Table 5 lists the Pearson correlations between N, time (year number), the summer (JJA) mean 2 m temperature in ERA5 in the area shown in Fig. 1 (T) and two summer mean teleconnection indices: the Eastern Atlantic pattern (EA) and the Eastern Atlantic/Western Russia pattern (EAWR). We also computed correlations using North Atlantic Oscillation (NAO), Scandinavian (SCAND) and Atlantic Multi-decadal Oscillation (AMO) indices (not shown), but the correlations were not as strong as with EA and EAWR, and not necessarily statistically significant. Thus, we will focus on T, EAWR and EA.
Table 5Pearson (r) and detrended Pearson (rd) correlations (with p-values) among the annual number of favorable days (N) obtained with the DEF 2pd criteria set, time (year numbers from 1950 to 2022), study area summer mean 2 m temperature (T), Eastern Atlantic (EA) index, and Eastern Atlantic/Western Russia (EAWR) index during 1950–2022.
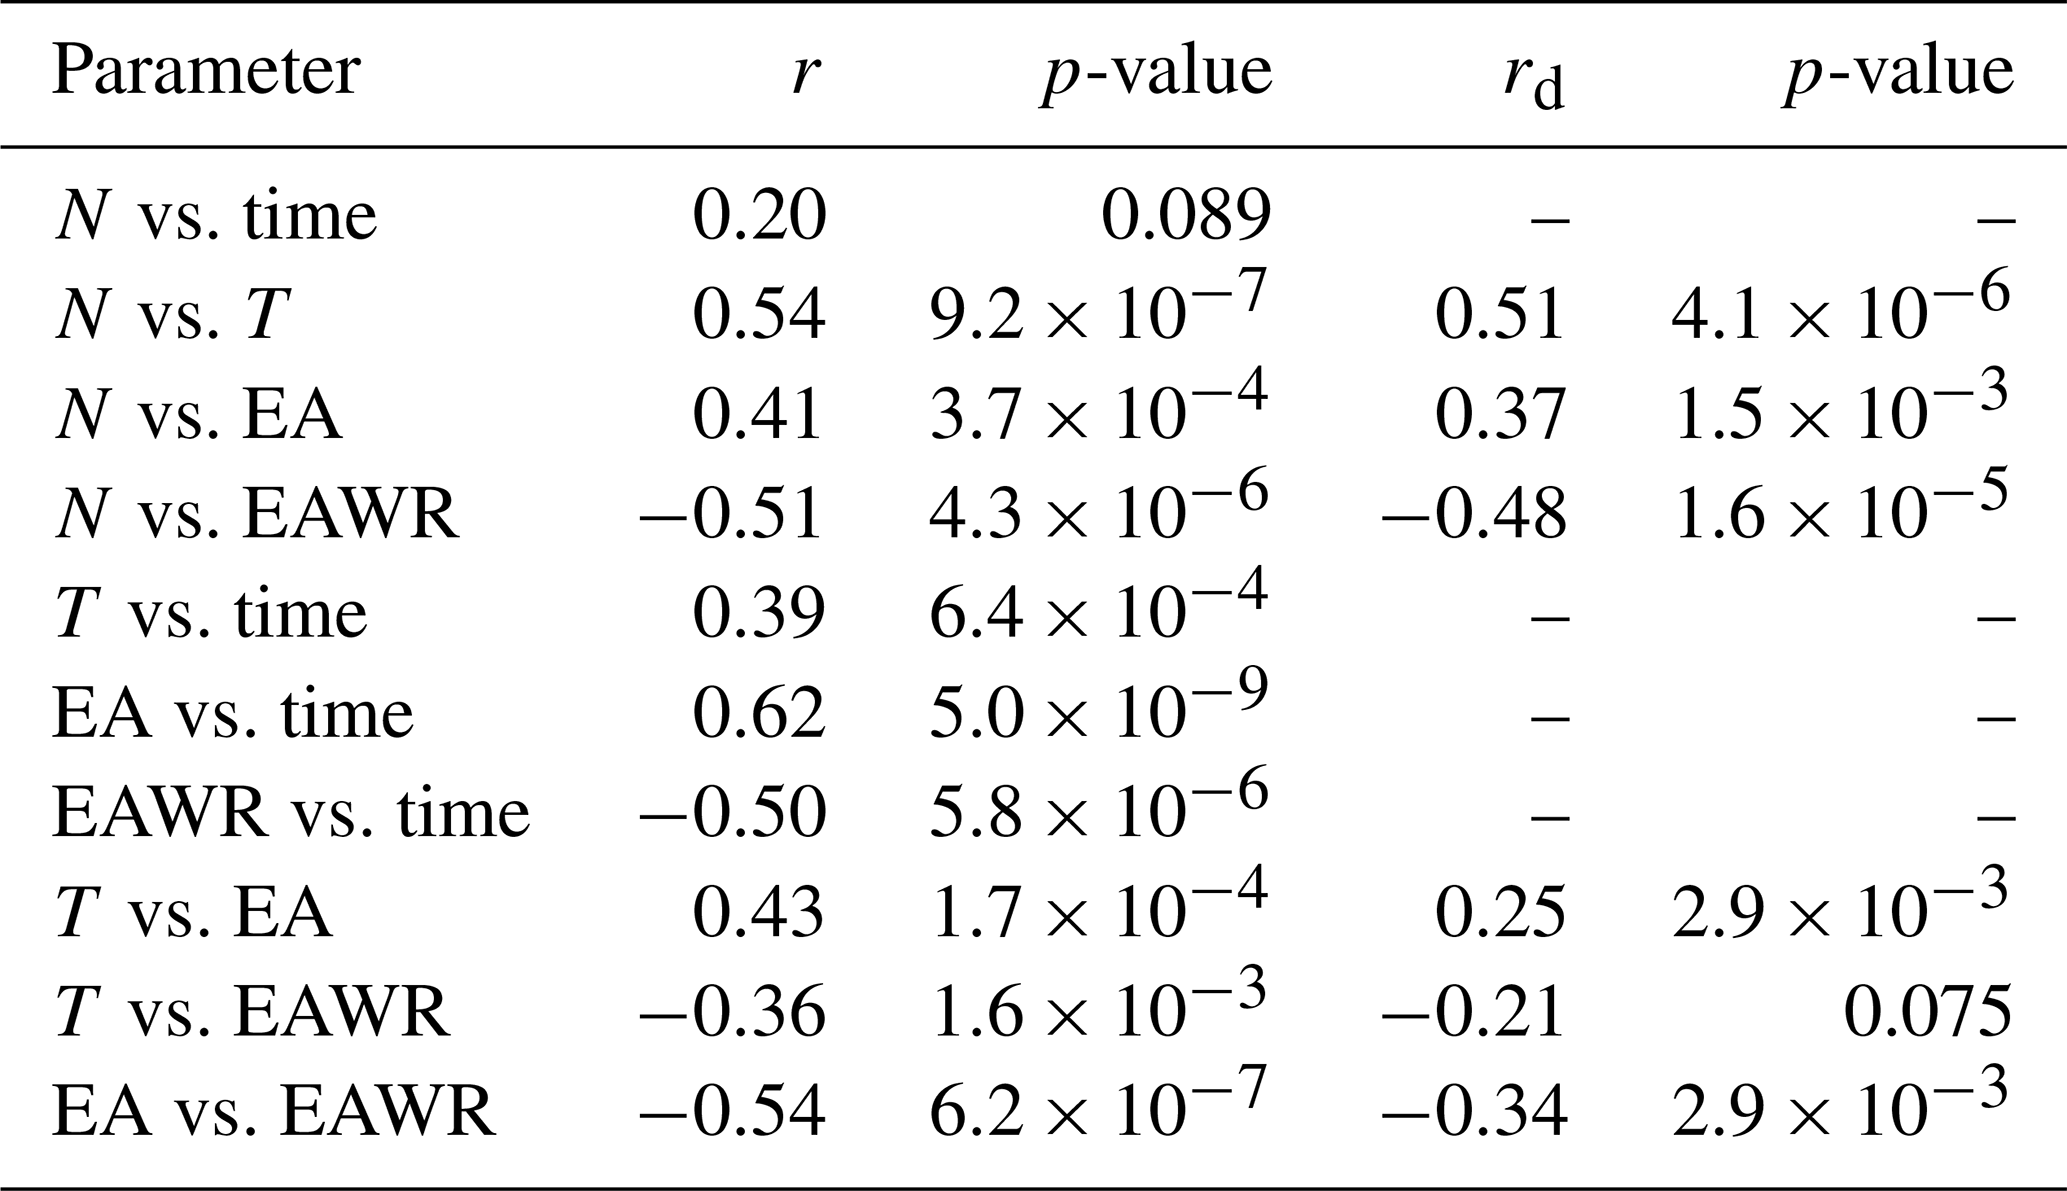
From Table 5, we can observe that T (r=0.54), EA (r=0.41) and EAWR () are moderately correlated with N. Furthermore, T, EA and EAWR are moderately correlated with one another. Since T, EA and EAWR each demonstrate a long-term trend within 1950–2022, detrended correlations were also computed by removing the linear trend prior to computing the Pearson correlation. While detrending the time series does not largely impact the correlations computed between N and T, EA, and EAWR, the correlations among T, EA and EAWR are reduced after detrending. This observation suggests that T, EA and EAWR are correlated with one another partly due to their shared long-term trends, whereas the relationship between N and T, EA and EAWR holds after detrending. Thus, the relation between N and these three variables is not explained by their shared temporal trends.
Based on the aforementioned observations, an ordinary least squares (OLS) regression model was fitted to annual time series of N (DEF 2pd) using T, EA and EAWR as predictors. However, the model indicated that the contribution of EA to N was negligible (not shown), and thus EA was removed from the fit. This result is not unexpected given that, of the three predictors, EA exhibits the weakest correlation with N and is more strongly correlated with both T and EAWR than T and EAWR are with each other (Table 5). Additionally, a negative EAWR index in the summer implies a weak negative geopotential anomaly over Denmark and a stronger positive geopotential height anomaly over northwestern Russia. This pattern resembles what we observed in Sect. 3.1 for the synoptic-scale pattern in Finland during derechos.
The final OLS model is given in Eq. (2).
The model suggest that a 1 °C increase in the summer mean temperature within the chosen study area or a decrease of 1.0 in the EAWR index would increase N by approximately 2 d per summer. Nonetheless, the model only explains 40 % of the interannual variance of N and is thus far from perfect. We also fitted the model using detrended time series, with largely the same results (not shown).
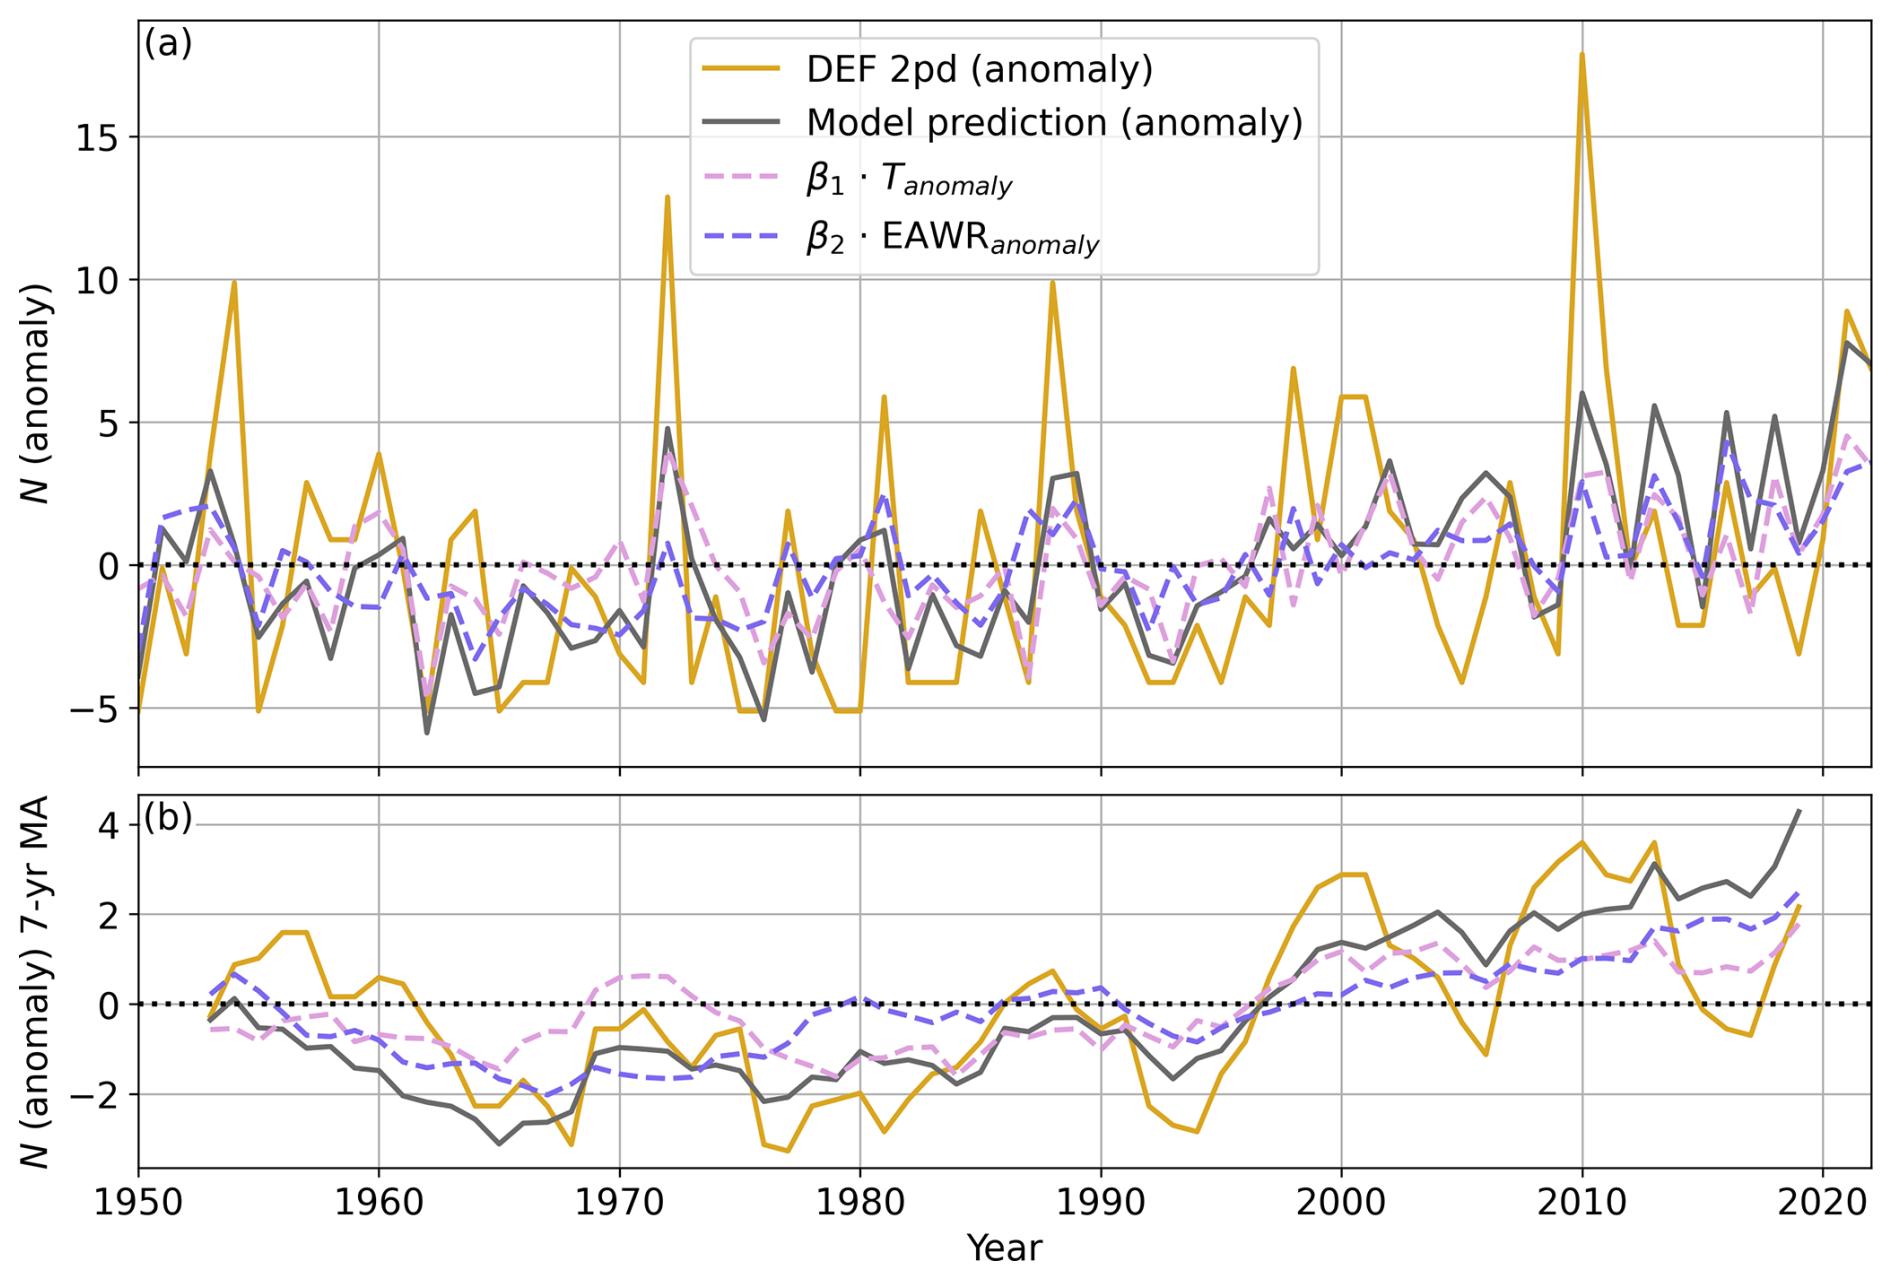
Figure 9Anomalies of the annual number of favorable derecho days (N) during 1950–2022. Panel (a) shows the N anomalies obtained using the DEF 2pd criteria set (gold solid line), the anomalies predicted by the linear regression model given in Eq. (2) (dark gray solid line), the contribution from the first term on the right-hand side of Eq. (2) (light purple dashed line), and the contribution from the second term (slate blue dashed line). Panel (b) shows the corresponding 7-year moving averages (7-yr MA) of the anomalies presented in panel (a). In both panels, the dotted black horizontal line marks zero anomaly.
Figure 9a shows the anomaly of the observed N and the corresponding anomaly predicted by the linear model. The individual contributions from T and EAWR are shown separately. The anomalies have been computed by subtracting the mean values for 1950–2022 from all the variables. Although the model greatly underestimates the interannual variability of N and largely misses the strong observed peaks in 1954, 1972, 1988 and 2010, the model prediction still qualitatively reproduces many features of the observed time series.
Figure 9b shows the 7-year moving averages of the anomalies presented in Fig. 9a. The lowest mean N observations align relatively well with the model in the mid-to-late 1960s and late 1970s. During these two periods, the summer mean temperature has been anomalously low in the study area area, and the EAWR index has been anomalously positive. In fact, the contribution of the EAWR index was, on average, negative prior to 1997, when the EAWR index was generally positive. However, the contribution has since turned positive, with the EAWR index being predominantly negative after 1997. Positive temperature anomalies have also acted to increase N since 1995. Thus, the regression model suggests that both the negative trend in EAWR and the increasing trend in temperature have caused N to increase after the 1990s, making derecho formation in Finland more likely.
Note that T and EAWR are relatively weakly correlated with each other, particularly when their time series are detrended (Table 5). This suggests that their contributions to the N trends are quasi-independent. While it should be reasonably safe to attribute most of the increase in T to the thermodynamic effects of the ongoing global warming, the apparent decreasing trend in the EAWR index is more difficult to interpret. It is not obvious whether it results from anthropogenic climate change, long-term natural variability or a combination of these two.
To assess the trustworthiness and usefulness of the results, a few potential sources of error are discussed here. Even though the ERA5 reanalysis is generally regarded as the most accurate global reanalysis currently available, it still has its limitations in representing the atmosphere correctly. For example, ERA5 has been observed to underestimate CAPE, especially when considering extreme values (Taszarek et al., 2021b). However, since our criteria sets used a relatively low CAPE threshold value (250 J kg−1), the potential errors in the larger values of CAPE, and ERA5 overall, are unlikely to have a large impact on the results.
While one of the main goals of this study was to determine the atmospheric environments favoring derecho formation, the three criteria sets we created to capture them have their limitations as well. The 10 and 6 km criteria sets were not satisfied throughout the lifetime of the systems and not necessarily on the paths of the derechos. As for the DEF criteria set, derechos in Finland occurred in varying atmospheric conditions. Therefore, to include all derechos in our criteria sets, the threshold values had to be set relatively low. Hence, our criteria sets also captured many days in which derechos were not observed.
To reduce the number of favorable days which did not produce derechos, we tried a stricter criteria set that was only satisfied in a couple of more evident derechos (events which satisfied the criteria sets easily: Asta, Veera and Sylvi). As expected, N was clearly reduced, but the reduction led to insufficient sample size of N to perform the trend analysis. Furthermore, all of our events produced severe damage, and a few of the other cases produced even more damage than those in the more evident derechos category. Therefore, this stricter criteria set was abandoned and not discussed in detail here.
The biggest problem we faced in this study was the small number of derechos in Finland. The lack of observed derechos means we cannot expect that these criteria sets will capture all future derechos occurring Finland. Thus, some derechos will likely form in atmospheric environments that do not satisfy the criteria sets we have presented here. Furthermore, while the trend analysis assumes that the criteria sets capturing derecho favoring environments are time-invariant, these environments may have changed during 1940–2022 or may change in the future.
Despite the aforementioned uncertainties, the results still hold scientific merit. Although the trends in the frequency of derecho-favoring environments were not strong nor always statistically significant, they were positive for all our methodological choices and both the 1940–2022 and 1980–2022 periods which is a strong sign of a positive trend. Moreover, small modifications were applied to the criteria sets (not shown) to test the sensitivity of the trends. For example, we slightly lowered and increased the threshold values within each criteria set. Again, all of the slightly modified criteria sets produced only positive trends. The fact that all of the correlations and slopes were positive, and they were not very sensitive to small modifications to the criteria sets suggest that the environments favoring derecho formation in Finland have become more frequent during recent decades. These results are also in line with the results of Hoeppe (2016) who discovered that the convective storms and their associated financial losses have clearly increased during recent decades in Europe.
The presence of high 850 hPa θe during derechos in Finland seems to be crucial based on Sect. 3.2. Since the frequency of days that fulfill the 850 hPa θe criterion shows a highly significant positive trend from 1980 to 2022 (e.g., Pearson correlation of 0.49 with the p-value of 0.0008 using the 2pd condition, not shown), the recurrence of particularly high 850 hPa θe appears likely in Finland as the climate warms up. This finding is supported by the moderate linear trend (0.7 K (10 yr)−1) in the yearly summer mean 850 hPa θe over the grid area within 1980–2022 (Pearson correlation of 0.43 with the p-value 0.004).
While it is relatively straightforward to relate the increase in the frequency of favorable days during 1980–2022 to global warming via the increasing trend in 850 hPa θe, it requires more interpretation to link the increase in favorable days to the decrease in summer mean EAWR index. The EAWR index, or Eurasian pattern type 2 as defined by Barnston and Livezey (1987), corresponds to a wave train pattern with three centers. The western center is located near Denmark, the middle center north of the Caspian sea, and the eastern center in northeast China. As mentioned in Sect. 6, the negative phase of the EAWR index agrees with what was observed for the synoptic-scale pattern in Sect. 3.1. This observation is consistent with the relation between negative summer mean EAWR values and a higher frequency of derecho-favoring environments. While the EAWR index trend has been negative for the recent decades (as noted in Sect. 6), likely associated with increasing (500 hPa) geopotential heights over western Russia (not shown), its future evolution remains uncertain since future changes in the large-scale circulation over Europe are not consistently projected across studies.
Derecho-favoring environments may also become more common across Europe in general. For example, Rädler et al. (2019) found that convective storms in Europe are projected to increase in frequency based on an ensemble of 14 regional climate simulations. This predicted increase in activity comes mainly from the increasing convective instability caused by increasing near-surface absolute humidity, which in turn comes from increasing evaporation over warming water surfaces (Púčik et al., 2017). Conversely, the polar jet stream is predicted to weaken due to the Arctic amplification (Coumou et al., 2018). This weakening would result in a decrease in the deep-layer shear which, on the other hand, could reduce the occurrence of favorable derecho environments. Yet, it has also been found that this weakening of the jet will make the jet stream to become more wavy, and therefore the number of persistent weather patterns is expected to increase (Rädler et al., 2019). As discovered in Sect. 3.1, derechos tend to form in Finland when a persistent wavy jet pattern advects warm and moist air from southern Europe, resulting in very high θe values. If future changes in the jet stream favor more persistent wave-train patterns over Europe, circulation patterns resembling the negative phase of the EAWR may become more frequent. Such changes could potentially increase the occurrence of environments favorable for derechos in Finland. However, a large uncertainty exists across studies regarding the future changes in the jet stream due to climate change, and it is therefore not possible to robustly determine how this may affect the future occurrence of favorable conditions.
In a study of a single derecho in midwestern United States, it was found that if the same event were to occur at the end of this century, its intensity in terms of maximum wind gusts might not be stronger than today, but the associated damage area could increase up to 50 %–100 %, primarily due to the increasing latent instability (Lasher-Trapp et al., 2023). Nevertheless, results from similar studies have been conflicting as, for example, Li et al. (2023) reported that a derecho in North America was weaker in a future environment, whereas González-Alemán et al. (2023) found that anthropogenic warming increased the intensity of a Mediterranean derecho. On the other hand, the results of Kaminski et al. (2025) indicate that derechos may not only become more widespread in the future but also more frequent and intense based on a large-scale simulation of convective activity under two different climate scenarios. Yet, the frequency and intensity of derechos in the future remain uncertain, and hence more studies would be needed before a convincing link between worsening derechos and climate change could be established. Therefore, it would be vital to perform a follow-up study which focuses on determining how the frequency of derecho-favoring environments changes before the end of this century using climate model simulations. Furthermore, the framework of our criteria sets, particularly the Derecho-favoring environments in Finland (DEF) criteria set, can be applied to any other regions in Europe. With local adaptations to the threshold values based on regional derecho climatology, our approach could be used to study the changes of the frequency of derecho-favoring environments in Europe both in the past and future. Finally, a new derecho index could be developed that would combine the information from different dynamic and thermodynamic parameters without setting fixed thresholds for the individual parameters.
In this study, the formation environments of 10 derecho-type events in Finland were examined using ERA5 reanalysis. It was identified that derechos in Finland developed and moved under a strong midtroposperic jet, with the derecho located on the right-hand side of an upper-level jet streak, commonly near the right jet entrance region. In these environments, deep-layer vertical wind shear was moderate, and the lower troposphere was particularly warm and moist due to a southerly flow pattern.
Three sets of criteria were developed to capture the mesoscale environments favoring derecho formation in Finland. While the 6 and 10 km criteria sets were mostly based on findings of kinematic parameters from US derechos, the Derecho-favoring environments in Finland (DEF) criteria set was tailored based on the local environments in which the 10 derecho events occurred in Finland. The 10 and 6 km criteria sets composed respectively of 0–10 and 0–6 km vertical wind shear proxies, and they both also included 6–10 km layer mean wind speed and convective available potential energy (CAPE). The DEF criteria set was built on 850 hPa equivalent potential temperature (θe), with θe exceeding a very high value of 325 K along the trajectory of each derecho event. In addition to the θe criterion, the DEF criteria used the same CAPE condition as the two aforementioned criteria sets and a combination of 0–6 and 0–10 km shear proxies. Applying the θe criterion decreased the number of favorable days to be closer to the observations of derecho occurrence in Finland.
For each of the parameters in the criteria sets, a threshold value was set. While the threshold values for the 6–10 km layer mean wind speed, 0–6 and 0–10 km shear in the 6 and 10 km criteria sets were derived from the literature, the CAPE condition was defined based on the minimum value encountered along the trajectories of derechos in Finland. For the DEF criteria set, the threshold values derived from literature were adjusted to match better with the conditions present during derechos in Finland. All individual criteria conditions within each criteria set were required to be met at the same grid point and over a sufficiently large area to classify the day as favorable for derecho formation. The area threshold for each criteria set was set as high as possible such that the 10 and 6 km criteria were still satisfied at least once among the three analyzed UTC times and the DEF criteria set at all three times on derecho days. Furthermore, since derechos are relatively long-lasting events, the persistence of the favorable conditions was assessed by examining whether the conditions were satisfied on more than one time step per day.
The 6 km criteria set matched clearly better with the derecho trajectories than the 10 km criteria set, but the DEF criteria set clearly outperformed the other two, satisfying all 10 events quite well along, or at least near, each event's trajectory. This result was unsurprising as the DEF criteria set was tailored to Finnish derechos. Even though the criteria sets were made to represent the atmospheric conditions during derechos in Finland, particularly the DEF criteria set can also be adapted for derecho research elsewhere by modifying the threshold values to better match the local environments in which derechos tend to develop.
In addition to the development of the criteria sets, they were used to analyze recent trends in the frequency of occurrence of derecho favoring conditions in Finland. It was found that derecho-favoring environments have become more common within the 1980–2022 period, with this increase being associated with both global warming and a negative summer mean Eastern Atlantic/Western Russia teleconnection index, although the trends were not particularly strong compared with the large interannual variability. Nevertheless, despite the caveats noted in Sect. 7, increasing trend in the number of favorable days with greater 850 hPa θe, amid favorable shear in warm-season troughing patterns, raises the question of whether such conditions may make derechos more frequent in Finland, and potentially elsewhere in northern Europe, in a warming climate. However, further research is needed to confirm this hypothesis.
Table A1Presence of synoptic-scale features discussed in Sect. 3.1 for all studied derecho events throughout their lifetime. An “X” marks that the feature is present, “(X)” denotes cases where its presence is uncertain or arguable, and blanks indicate that the feature is absent. The assessments can be partly inferred from the figures, with storms Unto, Saima and Lahja shown in Fig. S1, Sylvi and Ahti in Fig. S2, Aatu and Verneri in Fig. S3, and Asta, Veera and Paula in Fig. 2. Note that some of these classifications may have been affected by subjective interpretation.

ERA5 reanalysis data is available for download from the Copernicus Climate Change Service (https://doi.org/10.24381/cds.143582cf, Hersbach et al., 2017). Example Python code used in this study to process ERA5 data can be accessed in a Zenodo repository (https://doi.org/10.5281/zenodo.20797398, Rantala et al., 2026).
The supplement related to this article is available online at https://doi.org/10.5194/wcd-7-1571-2026-supplement.
OR, JAR and MB contributed to the design of the study. OR: formal analysis, visualization, writing (original draft, apart from Sect. 1). JAR: supervision, writing (review and editing). JR: derecho identification, writing (review and editing). MB: conceptualization, supervision, writing (wrote Sect. 1, review and editing).
The contact author has declared that none of the authors has any competing interests.
Publisher's note: Copernicus Publications remains neutral with regard to jurisdictional claims made in the text, published maps, institutional affiliations, or any other geographical representation in this paper. The authors bear the ultimate responsibility for providing appropriate place names. Views expressed in the text are those of the authors and do not necessarily reflect the views of the publisher.
The authors would like to express their gratitude to Eerik Saarikalle at the Finnish Meteorological Institute for providing the radar images of the derecho events. The authors also wish to acknowledge CSC – IT Center for Science, Finland, for computational resources, and ECMWF for producing ERA5 reanalysis. The authors wish to thank two anonymous reviewers for their constructive comments that significantly improved this manuscript. Figures in this study use the Scientific colour maps by Crameri (2023) to prevent visual distortion of the data and exclusion of readers with colour-vision deficiencies (Crameri et al., 2020).
This research has been supported by the Research Council of Finland (grant nos. 328616, 333397, and 364665) and the Finnish State Nuclear Waste Management Fund (Dnro SAFIR 6/2022 and SAFER 5/2025).
Open-access funding was provided by the Helsinki University Library.
This paper was edited by Johannes Dahl and reviewed by Monika Feldmann and one anonymous referee.
Ashley, W. S. and Mote, T. L.: Derecho Hazards in the United States, B. Am. Meteorol. Soc., 86, 1577–1592, https://doi.org/10.1175/BAMS-86-11-1577, 2005. a
Ashley, W. S., Mote, T. L., and Bentley, M. L.: On the episodic nature of derecho-producing convective systems in the United States, Int. J. Climatol., 25, 1915–1932, https://doi.org/10.1002/joc.1229, 2005. a
Ashley, W. S., Mote, T. L., and Bentley, M. L.: The extensive episode of derecho-producing convective systems in the United States during May and June 1998: A multi-scale analysis and review, Meteorol. Appl., 14, 227–244, 2007. a, b
Atkins, N. T. and Wakimoto, R. M.: Wet Microburst Activity over the Southeastern United States: Implications for Forecasting, Weather Forecast., 6, 470–482, https://doi.org/10.1175/1520-0434(1991)006<0470:WMAOTS>2.0.CO;2, 1991. a
Barnston, A. G. and Livezey, R. E.: Classification, seasonality and persistence of low-frequency atmospheric circulation patterns, Mon. Weather Rev., 115, 1083–1126, 1987. a
Celiński-Mysław, D. and Matuszko, D.: An analysis of selected cases of derecho in Poland, Atmos. Res., 149, 263–281, https://doi.org/10.1016/j.atmosres.2014.06.016, 2014. a, b
Chernokulsky, A., Shikhov, A., Bykov, A., Kalinin, N., Kurgansky, M., Sherstyukov, B., and Yarinich, Y.: Diagnosis and modelling of two destructive derecho events in European Russia in the summer of 2010, Atmos. Res., 267, 105928, https://doi.org/10.1016/j.atmosres.2021.105928, 2022. a, b, c
Climate Prediction Center: Teleconnection Indices Dataset, NOAA, https://www.cpc.ncep.noaa.gov/data/teledoc/telecontents.shtml (last access: 12 June 2026), 2026. a, b
Cohen, A. E., Coniglio, M. C., Corfidi, S. F., and Corfidi, S. J.: Discrimination of Mesoscale Convective System Environments Using Sounding Observations, Weather Forecast., 22, 1045–1062, https://doi.org/10.1175/WAF1040.1, 2007. a, b, c, d, e, f, g, h, i, j, k, l, m, n, o
Coniglio, M. C., Stensrud, D. J., and Richman, M. B.: An Observational Study of Derecho-Producing Convective Systems, Weather Forecast., 19, 320–337, https://doi.org/10.1175/1520-0434(2004)019<0320:AOSODC>2.0.CO;2, 2004. a
Corfidi, S. F., Coniglio, M. C., Cohen, A. E., and Mead, C. M.: A proposed revision to the definition of “derecho”, B. Am. Meteorol. Soc., 97, 935–949, 2016. a
Coumou, D., Di Capua, G., Vavrus, S., Wang, L., and Wang, S.: The influence of Arctic amplification on mid-latitude summer circulation, Nat. Commun., 9, 2959, https://doi.org/10.1038/s41467-018-05256-8, 2018. a
Crameri, F.: Scientific colour maps (8.0.1), Zenodo [code], https://doi.org/10.5281/zenodo.8409685, 2023. a
Crameri, F., Shephard, G. E., and Heron, P. J.: The misuse of colour in science communication, Nat. Commun., 11, 5444, https://doi.org/10.1038/s41467-020-19160-7, 2020. a
Derbyshire, S. H., Beau, I., Bechtold, P., Grandpeix, J.-Y., Piriou, J.-M., Redelsperger, J.-L., and Soares, P.: Sensitivity of moist convection to environmental humidity, Q. J. Roy. Meteor. Soc., 130, 3055–3079, 2004. a
Doswell, C. A. and Evans, J. S.: Proximity sounding analysis for derechos and supercells: an assessment of similarities and differences, Atmos. Res., 67–68, 117–133, https://doi.org/10.1016/S0169-8095(03)00047-4, 2003. a
El Rafei, M., Isaza, A., Sherwood, S. C., Evans, J., Brown, A., Ji, F., and Dowdy, A.: Downdrafts and convective gusts in high-resolution simulations: An Australian case study, J. Geophys. Res.-Atmos., 130, e2025JD044151, https://doi.org/10.1029/2025JD044151, 2025. a
Evans, J. S. and Doswell, C. A.: Examination of Derecho Environments Using Proximity Soundings, Weather Forecast., 16, 329–342, https://doi.org/10.1175/1520-0434(2001)016<0329:EODEUP>2.0.CO;2, 2001. a, b
Fujita, T. T.: Proposed characterization of tornadoes and hurricanes by area and intensity, Tech. rep., No. NASA-CR-125545, https://ntrs.nasa.gov/api/citations/19720008829/downloads/19720008829.pdf (last access: 1 September 2025), 1971. a
Gatzen, C.: A Derecho in Europe: Berlin, 10 July 2002, Weather Forecast., 19, 639–645, https://doi.org/10.1175/1520-0434(2004)019<0639:ADIEBJ>2.0.CO;2, 2004. a, b, c
Gatzen, C. P., Fink, A. H., Schultz, D. M., and Pinto, J. G.: An 18-year climatology of derechos in Germany, Nat. Hazards Earth Syst. Sci., 20, 1335–1351, https://doi.org/10.5194/nhess-20-1335-2020, 2020. a, b, c, d, e
Ghasemifard, H., Groenemeijer, P., Battaglioli, F., and Púčik, T.: Do changing circulation types raise the frequency of summertime thunderstorms and large hail in Europe?, Environmental Research: Climate, 3, 015008, https://doi.org/10.1088/2752-5295/ad22ec, 2024. a
González-Alemán, J. J., Insua-Costa, D., Bazile, E., González-Herrero, S., Marcello Miglietta, M., Groenemeijer, P., and Donat, M. G.: Anthropogenic warming had a crucial role in triggering the historic and destructive Mediterranean derecho in summer 2022, B. Am. Meteorol. Soc., 104, E1526–E1532, https://doi.org/10.1175/BAMS-D-23-0119.1, 2023. a, b
Gospodinov, I., Dimitrova, T., Bocheva, L., Simeonov, P., and Dimitrov, R.: Derecho-like event in Bulgaria on 20 July 2011, Atmos. Res., 158–159, 254–273, https://doi.org/10.1016/j.atmosres.2014.05.009, 2015. a
Guastini, C. T. and Bosart, L. F.: Analysis of a Progressive Derecho Climatology and Associated Formation Environments, Mon. Weather Rev., 144, 1363–1382, https://doi.org/10.1175/MWR-D-15-0256.1, 2016. a
Hamid, K.: Investigation of the passage of a derecho in Belgium, Atmos. Res., 107, 86–105, https://doi.org/10.1016/j.atmosres.2011.12.013, 2012. a, b, c
Hersbach, H., Bell, B., Berrisford, P., Hirahara, S., Horányi, A., Muñoz‐Sabater, J., Nicolas, J., Peubey, C., Radu, R., Schepers, D., Simmons, A., Soci, C., Abdalla, S., Abellan, X., Balsamo, G., Bechtold, P., Biavati, G., Bidlot, J., Bonavita, M., De Chiara, G., Dahlgren, P., Dee, D., Diamantakis, M., Dragani, R., Flemming, J., Forbes, R., Fuentes, M., Geer, A., Haimberger, L., Healy, S., Hogan, R.J., Hólm, E., Janisková, M., Keeley, S., Laloyaux, P., Lopez, P., Lupu, C., Radnoti, G., de Rosnay, P., Rozum, I., Vamborg, F., Villaume, S., and Thépaut, J.-N.: Complete ERA5 from 1940: Fifth generation of ECMWF atmospheric reanalyses of the global climate, Copernicus Climate Change Service (C3S) Data Store (CDS) [data set], https://doi.org/10.24381/cds.143582cf, 2017. a
Hersbach, H., Bell, B., Berrisford, P., Horányi, A., Sabater, J. M., Nicolas, J., Radu, R., Schepers, D., Simmons, A., Soci, C., and Dee, D.: Global reanalysis: goodbye ERA-Interim, hello ERA5, ECMWF Newsletter, 159, 17–24, 2019. a
Hersbach, H., Bell, B., Berrisford, P., Hirahara, S., Horányi, A., Muñoz-Sabater, J., Nicolas, J., Peubey, C., Radu, R., Schepers, D., Simmons, A., Soci, C., Abdalla, S., Abellan, X., Balsamo, G., Bechtold, P., Biavati, G., Bidlot, J., Bonavita, M., De Chiara, G., Dahlgren, P., Dee, D., Diamantakis, M., Dragani, R., Flemming, J., Forbes, R., Fuentes, M., Geer, A., Haimberger, L., Healy, S., Hogan, R. J., Hólm, E., Janisková, M., Keeley, S., Laloyaux, P., Lopez, P., Lupu, C., Radnoti, G., de Rosnay, P., Rozum, I., Vamborg, F., Villaume, S., and Thépaut, J.-N.: The ERA5 global reanalysis, Q. J. Roy. Meteor. Soc., 146, 1999–2049, 2020. a
Hoeppe, P.: Trends in weather related disasters – Consequences for insurers and society, Weather and Climate Extremes, 11, 70–79, https://doi.org/10.1016/j.wace.2015.10.002, 2016. a
IPCC: Summary for Policymakers, in: Climate Change 2023: Synthesis Report, Contribution of Working Groups I, II and III to the Sixth Assessment Report of the Intergovernmental Panel on Climate Change edited by: Core Writing Team, Lee, H., and Romero, J., IPCC, Geneva, Switzerland, 1–34, https://doi.org/10.59327/IPCC/AR6-9789291691647.001, 2023. a, b
Johns, R. H.: Meteorological conditions associated with bow echo development in convective storms, Weather Forecast., 8, 294–299, 1993. a
Johns, R. H. and Hirt, W. D.: Derechos: Widespread convectively induced windstorms, Weather Forecast., 2, 32–49, 1987. a, b, c, d
Kaminski, K., Ashley, W. S., Haberlie, A. M., and Gensini, V. A.: Future derecho potential in the United States, J. Climate, 38, 3–26, 2025. a
Lasher-Trapp, S., Orendorf, S. A., and Trapp, R. J.: Investigating a derecho in a future warmer climate, B. Am. Meteorol. Soc., 104, E1831–E1852, 2023. a, b
Li, J., Qian, Y., Leung, L. R., Chen, X., Yang, Z., and Feng, Z.: Potential weakening of the June 2012 North American derecho under future warming conditions, J. Geophys. Res.-Atmos., 128, e2022JD037494, https://doi.org/10.1029/2022JD037494, 2023. a, b
Lind, P., Belušić, D., Médus, E., Dobler, A., Pedersen, R. A., Wang, F., Matte, D., Kjellström, E., Landgren, O., Lindstedt, D., Christensen, O. B., and Christensen, J. H.: Climate change information over Fenno-Scandinavia produced with a convection-permitting climate model, Clim. Dynam., 61, 519, https://doi.org/10.1007/s00382-022-06589-3, 2023. a
López, J. M.: A Mediterranean derecho: Catalonia (Spain), 17th August 2003, Atmos. Res., 83, 272–283, https://doi.org/10.1016/j.atmosres.2005.08.008, 2007. a, b, c, d
Markowski, P. and Richardson, Y.: Mesoscale meteorology in midlatitudes, John Wiley & Sons, https://doi.org/10.1002/9780470682104, 2010. a
May, R. M., Arms, S. C., Marsh, P., Bruning, E., Leeman, J. R., Goebbert, K., Thielen, J. E., Bruick, Z. S., and Camron, M. D.: MetPy: A Python Package for Meteorological Data, v1.7.1, GitHub, https://doi.org/10.5065/D6WW7G29, 2025. a
Munich RE: Hail, tornadoes and flash floods: Risks from severe thunderstorms are on the rise, https://www.munichre.com/en/risks/natural-disasters/thunderstorms-hail-tornados.html (last access: 1 September 2025), 2025a. a
Munich RE: Natural disasters worldwide: Losses are on the rise as climate change strikes, https://www.munichre.com/en/risks/natural-disasters.html (last access: 1 September 2025), 2025b. a
NOAA PSL: AMO (Atlantic Multidecadal Oscillation) Index Time Series, https://psl.noaa.gov/data/timeseries/AMO/ (last access: 12 June 2026), 2026. a, b
Pilguj, N., Surowiecki, A., Taszarek, M., and Piasecki, K.: Quasi-linear convective systems and derechos across Europe: ERA5 convective environments and synoptic-scale patterns, Mon. Weather Rev., https://doi.org/10.1175/MWR-D-25-0029.1, 2025. a, b, c
Piper, D. and Kunz, M.: Spatiotemporal variability of lightning activity in Europe and the relation to the North Atlantic Oscillation teleconnection pattern, Nat. Hazards Earth Syst. Sci., 17, 1319–1336, https://doi.org/10.5194/nhess-17-1319-2017, 2017. a
Prein, A.: Thunderstorm straight line winds intensify with climate change, Nat. Climate Change, 13, 1353–1359, 2023. a
Púčik, T., Groenemeijer, P., Rädler, A. T., Tijssen, L., Nikulin, G., Prein, A. F., van Meijgaard, E., Fealy, R., Jacob, D., and Teichmann, C.: Future changes in European severe convection environments in a regional climate model ensemble, J. Climate, 30, 6771–6794, 2017. a
Punkka, A.-J. and Bister, M.: Mesoscale Convective Systems and Their Synoptic-Scale Environment in Finland, Weather Forecast., 30, 182–196, https://doi.org/10.1175/WAF-D-13-00146.1, 2015. a, b
Punkka, A.-J., Teittinen, J., and Johns, R. H.: Synoptic and Mesoscale Analysis of a High-Latitude Derecho–Severe Thunderstorm Outbreak in Finland on 5 July 2002, Weather Forecast., 21, 752–763, https://doi.org/10.1175/WAF953.1, 2006. a
Rädler, A. T., Groenemeijer, P. H., Faust, E., Sausen, R., and Púčik, T.: Frequency of severe thunderstorms across Europe expected to increase in the 21st century due to rising instability, npj Clim. Atmos. Sci., 2, 30, https://doi.org/10.1038/s41612-019-0083-7, 2019. a, b, c
Rantala, O.: Atmospheric conditions favoring derecho formation and the frequency of these conditions in Finland, Master's thesis, University of Helsinki, https://helda.helsinki.fi/items/59830da5-0c1d-4493-bb6b-54e08e4af980 (last access: 7 January 2026), 2025. a
Rantala, O., Räisänen, J., Rauhala, J., and Bister, M.: Python code for the manuscript “Derecho-favoring atmospheric environments in Finland: characteristics, identification criteria, and frequency trends” (Version v2), Zenodo [code], https://doi.org/10.5281/zenodo.20797398, 2026. a
Safety Investigation Authority, Finland: The storms of July–August 2010, Investigation report S2/2010Y, https://www.turvallisuustutkinta.fi/app/uploads/sites/8/2024/11/s22010y_tutkintaselostus.pdf (last access: 20 August 2026), 2010. a
Shourd, K. N. and Kaplan, M. L.: A Climatology of 1995–2024 United States Warm Season Derecho Events and Analysis of Potential Climate Forcing Associations, E-Journal of Severe Storms Meteorology, 20, https://doi.org/10.55599/ejssm.v20i2.98, 2025. a
Squitieri, B. J., Wade, A. R., and Jirak, I. L.: On a modified definition of a derecho. Part I: Construction of the definition and quantitative criteria for identifying future derechos over the contiguous United States, B. Am. Meteorol. Soc., 106, E84–E110, 2025. a
Surowiecki, A. and Taszarek, M.: A 10-year radar-based climatology of mesoscale convective system archetypes and derechos in Poland, Mon. Weather Rev., 148, 3471–3488, 2020. a
Surowiecki, A., Pilguj, N., Taszarek, M., Piasecki, K., Púčik, T., and Brooks, H. E.: Quasi-linear convective systems and derechos across Europe: climatology, accompanying hazards, and societal impacts, B. Am. Meteorol. Soc., 105, E1619–E1643, https://doi.org/10.1175/BAMS-D-23-0257.1, 2024. a
Taszarek, M., Brooks, H. E., and Czernecki, B.: Sounding-Derived Parameters Associated with Convective Hazards in Europe, Mon. Weather Rev., 145, 1511–1528, https://doi.org/10.1175/MWR-D-16-0384.1, 2017. a
Taszarek, M., Pilguj, N., Orlikowski, J., Surowiecki, A., Walczakiewicz, S., Pilorz, W., Piasecki, K., Łukasz Pajurek, and Półrolniczak, M.: Derecho Evolving from a Mesocyclone – A Study of 11 August 2017 Severe Weather Outbreak in Poland: Event Analysis and High-Resolution Simulation, Mon. Weather Rev., 147, 2283–2306, https://doi.org/10.1175/MWR-D-18-0330.1, 2019. a, b, c
Taszarek, M., Allen, J. T., Púčik, T., Hoogewind, K. A., and Brooks, H. E.: Severe Convective Storms across Europe and the United States. Part II: ERA5 Environments Associated with Lightning, Large Hail, Severe Wind, and Tornadoes, J. Climate, 33, 10263–10286, https://doi.org/10.1175/JCLI-D-20-0346.1, 2020. a, b, c, d, e
Taszarek, M., Allen, J. T., Brooks, H. E., Pilguj, N., and Czernecki, B.: Differing trends in United States and European severe thunderstorm environments in a warming climate, B. Am. Meteorol. Soc., 102, E296–E322, 2021a. a
Taszarek, M., Pilguj, N., Allen, J. T., Gensini, V., Brooks, H. E., and Szuster, P.: Comparison of convective parameters derived from ERA5 and MERRA-2 with rawinsonde data over Europe and North America, J. Climate, 34, 3211–3237, 2021b. a, b
Törmä, A., Rauhala, J., and Viksna, A.: A derecho in northeastern Europe on 8 August 2010, in: 7th European Conference on Severe Storms, 3–7, https://www.essl.org/ECSS/2013/programme/abstracts/177.pdf (last access: 27 August 2026), 2013. a, b
Virman, M., Rantanen, M., Laurila, T. K., Mäkelä, A., van den Broek, D., and Gregow, H.: Damaging thunderstorms in Finland in June 2021, Weather, 80, 111–119, 2025. a, b
Westermayer, A., Groenemeijer, P., Pistotnik, G., Sausen, R., and Faust, E.: Identification of favorable environments for thunderstorms in reanalysis data, Meteorol. Z., 26, 59–70, 2017. a
Yano, J.-I., Bister, M., Fuchs, Ž., Gerard, L., Phillips, V. T. J., Barkidija, S., and Piriou, J.-M.: Phenomenology of convection-parameterization closure, Atmos. Chem. Phys., 13, 4111–4131, https://doi.org/10.5194/acp-13-4111-2013, 2013. a
- Abstract
- Introduction
- Data and methods
- Characteristic conditions during derechos in Finland
- Development and evaluation of derecho environment criteria for Finland
- Trends in frequency of atmospheric conditions favoring derecho formation
- Effects of warming and large-scale teleconnections
- Discussion
- Conclusions
- Appendix A
- Code and data availability
- Author contributions
- Competing interests
- Disclaimer
- Acknowledgements
- Financial support
- Review statement
- References
- Supplement
- Abstract
- Introduction
- Data and methods
- Characteristic conditions during derechos in Finland
- Development and evaluation of derecho environment criteria for Finland
- Trends in frequency of atmospheric conditions favoring derecho formation
- Effects of warming and large-scale teleconnections
- Discussion
- Conclusions
- Appendix A
- Code and data availability
- Author contributions
- Competing interests
- Disclaimer
- Acknowledgements
- Financial support
- Review statement
- References
- Supplement