
the Creative Commons Attribution 4.0 License.
the Creative Commons Attribution 4.0 License.
 | 14 Oct 2026
The dual effect of urban areas on supercell storms

Christopher Rozoff
Andrea Zonato
Stefano Alessandrini
Silvana Di Sabatino
The effect of urban land use on convective storms with deep and persistent rotating updrafts (supercell storms) is systematically investigated using ensembles of idealized numerical simulations. A supercell is simulated over a flat domain containing a circular city surrounded by croplands. It is triggered upstream of the city so that it subsequently moves into the urban area. Twenty-five experiments with eleven ensemble members each are conducted in which city size, urban fraction, building height, and building density are varied. The results show a statistically significant weakening of the supercell with increasing city size. The weakening of the approaching storm is primarily driven by the urban dry island (UDI), which substantially reduces convective available potential energy. While the initial storm can be suppressed by the city, the urban heat island (UHI) generates a pressure minimum and horizontal convergence, which induce upward motions and can trigger a new supercell downwind of the city, in a corridor where SRH is also higher. Compared with UHI-induced vertical velocities, the building-generated vertical velocities are negligible. This study expands our understanding of the complex interactions between the urban environment and deep moist convection, emphasizing the role of the UHI and UDI in influencing storm dynamics and highlighting the potential dual effects of urban land use on supercell storms.
- Article
(10378 KB) - Full-text XML
-
Supplement
(1239 KB) - BibTeX
- EndNote


The most severe socio-economic impacts of severe storms typically occur when they strike urban areas, where large populations are at risk of injuries, and dense infrastructure and numerous vehicles are exposed to damage (e.g., Heimann and Kurz, 1985; Wurman et al., 2007). This underscores the need for a thorough examination of the interactions between urban land use and severe storm behavior, with the ultimate goals of improving early warning systems, designing effective emergency plans, informing the public about associated risks, and strengthening socio-economic resilience.
It is well established that the presence of buildings and urban materials significantly modifies the Planetary Boundary Layer (PBL), leading to the Urban Heat Island (UHI; i.e., higher temperatures within cities, Oke, 1982), and modifications in streamlines (Britter and Hanna, 2003), which often result in weaker surface winds over urban areas. Urban areas also modify the moisture field: both Urban Wet Islands (UWIs) and Urban Dry Islands (UDIs) have been observed (Oke, 1988; Huang and Song, 2023). UWIs are more common at night, due to enhanced evapotranspiration associated with the UHI (which is stronger at night, Meili et al., 2022), in winter, due to anthropogenic emissions, and in dry regions (Luo et al., 2021b). UDIs, instead, are more frequent in the late afternoon and in spring or summer in wet regions (Argüeso et al., 2016; Lokoshchenko, 2017; Luo et al., 2021a; Luan et al., 2022), where evapotranspiration within urban areas is reduced due to less vegetation cover relative to rural areas (Hao et al., 2023).
Urban areas affect also precipitation, and the existence of an Urban Rainfall Effect (URE) was already noted more than 50 years ago (Changnon and Ackerman, 1977). This phenomenon is typically characterized by enhanced precipitation downstream of both large and compact urban areas (Liu and Niyogi, 2019; Yang et al., 2024). Several hypotheses have been proposed to explain it, ranging from thermodynamic mechanisms (UHI-induced vertical motions that trigger convection; Thielen and Gadian, 1997; Rozoff et al., 2003), to dynamic processes (vertical velocities induced by flow modifications caused by buildings; Yang et al., 2021a; Bornstein and LeRoy, 1990), and chemical interactions (urban aerosols affecting rainfall efficiency; Lin et al., 2011; Fan et al., 2020). In particular, the dynamic explanation has received considerable attention. Various mechanisms have been proposed to explain enhanced vertical velocities resulting from building-induced flow modifications, including dynamical blocking of the flow upstream of buildings (Dou et al., 2024; Shen and Yang, 2023; Yang et al., 2021a; Zhang et al., 2017), flow merging downstream of cities (Shen and Yang, 2023; Dou et al., 2015), downstream wind convergence driven by a pressure minimum induced by flow bifurcation (Yang et al., 2021b), and storm bifurcation via the so-called building-barrier effect (Dou et al., 2015; Bornstein and Lin, 2000). However, these hypotheses have generally not been tested quantitatively. While it is reasonable to expect that all these factors may influence a convective cell to some extent, it remains unclear whether one (or some) of them plays a dominant role in producing the URE phenomenon.
Moreover, most of these studies have focused on ordinary convective cells, while only a limited number have examined the effects of urban land use on local severe storms. In particular, the present study focuses on supercells, which are convective storms with a deep and persistent rotating updraft and represent the most dangerous type of local severe storm (e.g., Homeyer et al., 2025). Since surface-based supercells are fueled primarily by air masses located in the lowest few hundred meters of the troposphere (Coffer et al., 2023), it is reasonable to hypothesize that they may be influenced as well by urban land use (Shepherd, 2013). Indeed, some case studies have found that supercells occurring over the US Great Plains were intensified by the presence of cities (Reames and Stensrud, 2018; Lin et al., 2021; Fan et al., 2023). Similarly, Platonov et al. (2024) reported a systematic increase in updraft helicity (UH) over Moscow (Russia) compared to simulations without the city. A recent study showed that even a Quasi-Linear Convective System (QLCS) can be displaced and broken up by urban land use (De Martin et al., 2025).
Attempts to generalize these pioneering case studies have been made using idealized simulations (Naylor, 2020; Naylor and Mulholland, 2023; Naylor et al., 2024), which found that both supercells and QLCSs intensified when a city was included. However, in those simulations, the city was simplified as a thermal and roughness perturbation, and a realistic city was not considered in the simulation domain.
These early investigations suggest that even local severe storms can be modified by urban land use. Nevertheless, they either lack generality or rely on overly simplified urban representations. Therefore, the present research employs idealized simulations using state-of-the-art urban parameterizations to better assess whether urban perturbations are sufficiently strong to alter supercell behavior. Another important aspect that has been only marginally addressed in previous studies concerns the physical processes responsible for urban-induced modification of supercells. Accordingly, this research is guided by two main scientific questions:
- 1.
Can a city modify a supercell?
- 2.
What are the physical processes that cause such modifications?
The limitation of idealized simulations is that they rely on the outcomes of a numerical model, which must be trusted. To enhance the trustworthiness of the idealized simulations, similar model settings used for a real case study by De Martin et al. (2025) are employed in the present study.
The analysis is divided into two main phases. The primary objective of the first phase is to investigate how an already developed supercell is modified by the presence of a city. To this end, the storm is initiated upstream and advected toward the city center, where an urban boundary layer has developed during the preceding hours. In particular, we aim to assess the storm's sensitivity to variations in city size, urban fraction, building height, and building density. The second phase of the analysis focuses on understanding how the pre-storm environment is influenced by different urban morphological configurations. This aspect is crucial for explaining the urban-induced storm modifications identified in the first phase.
The methodology used is described in detail in Sect. 2. The results of the first phase are presented in Sect. 3, while those of the second phase are shown in Sect. 4. Finally, the main outcomes of both phases are discussed in Sect. 5, along with comparisons with the existing literature. Tentative answers to the scientific questions posed above will be provided in Sect. 6.
2.1 Numerical simulation setup
Numerical simulations are performed using version 4.6.1 of the Weather Research and Forecasting (WRF) numerical model (Skamarock et al., 2019). Numerical simulations are conducted in a single square domain with horizontal grid spacing of 1 km, consisting of 250 × 250 grid points. The same 64 vertical levels used in De Martin et al., 2025 are employed, as they were shown to accurately reproduce severe storm dynamics in a real urban setting. Periodic Boundary Conditions (PBCs) are implemented. A sufficiently large domain is chosen to ensure that spurious wave interactions do not occur during the period analyzed in this study.
The simulations are initialized at 10:00 local time (LT), and the storm is triggered at 16:00 LT, a typical initiation time of convection (e.g., Manzato et al., 2022). The supercell is initiated using a thermal bubble released at 16:00 LT near the bottom-left corner of the domain, at grid point (40,40). The bubble is a thermal perturbation of +3 K released at 1800 m a.g.l. The perturbation relaxes to zero with a vertical radius of 1800 m and a horizontal radius of 10 km. This setup allows the storm to develop for approximately two hours before reaching the city. This numerical configuration is similar to that used by Markowski and Dotzek (2011) to investigate interactions between supercells and idealized orography.
The microphysics scheme used is Morrison et al. (2009), with hail as the prognostic rimed ice species. Longwave radiation is parameterized using the Rapid Radiative Transfer Model (Mlawer et al., 1997), while shortwave radiation is parameterized using the Dudhia scheme (Dudhia, 1989). Radiative forcing corresponds to conditions at a latitude of 45° N (the same as Milan) on 31 May. Noah-MP is used as the land surface model (Niu et al., 2011; Yang et al., 2011), while the Revised MM5 scheme (Jiménez et al., 2012) is employed to resolve the surface layer processes.
Several schemes are tested for the representation of PBL processes, coupled with the 1.5 TKE closure (km_opt = 2 in the WRF namelist), including the Boulac (Bougeault and Lacarrere, 1989), Yonsei University (YSU, Hong et al., 2006), or Mellor–Jamada–Janjic (Janjić, 1994) schemes. Since no remarkable differences are observed among the PBL schemes considered, the YSU scheme is preferred because it is widely used in severe storm studies at mid latitudes and also in urban settings (e.g., Reames and Stensrud, 2018).
The domain is entirely flat, with a surface soil moisture1 of 0.34 m3 m−3 and croplands as the uniform land-use category, except for a circular city centered at grid point (90,76). This location is chosen based on an analysis of the supercell evolution in the no_urban control run, where the land use is cropland everywhere. The goal is to locate the city such that the supercell passes over its center two hours after initiation, coinciding with the time of peak intensity. Urban surface processes are resolved using the Building Effect Parametrization (BEP, Martilli et al., 2002) and the Building Energy Model (BEM, Salamanca et al., 2010). In both models, buildings are not explicitly resolved; instead, their effects on the grid-averaged variables are parameterised. BEP computes the impact of roofs, streets, and walls on wind speed, temperature, and turbulent kinetic energy, also accounting for the shadowing and radiation-trapping effects induced by urban canyons. Building-height information affects the momentum, heat, moisture, and turbulent kinetic energy source terms passed from the urban canopy to the atmospheric model. The model can therefore accurately represent the aggregate, grid-cell-scale effect of building height, which is the scale relevant to our simulations (Zonato et al., 2021). In BEM, the exchange of momentum, heat, and radiation between indoor rooms and urban canyons is parameterised, also accounting for the heat generated by occupants and equipment and the effect of air conditioning systems. In this work, the sea_breeze_2d, adapted to run with the BEP-BEM scheme in a three-dimensional domain (Zonato et al., 2021; Pappaccogli et al., 2020), was employed.
We chose a grid spacing of 1 km rather than a finer resolution because the BEP-BEM and PBL schemes have been extensively tested at that scale. At finer resolutions, within the 0.1–1 km grid-spacing range, a “terra incognita” exists (Zhou et al., 2014), in which PBL schemes become unreliable (as part of the turbulence is explicitly resolved), while large-eddy simulations (LES) are also not fully appropriate (because not all coherent eddies are directly resolved at such coarse resolution). Using LES at a resolution of 100 m or finer would have been a valuable alternative; however, the computational costs were beyond our capabilities, especially given the sensitivity tests and ensemble approach we implemented. Therefore, we preferred to use a well-established mesoscale modelling configuration with an advanced urban parametrization rather than adopting a finer resolution within the “gray zone”, with a potentially less reliable representation of urban processes.
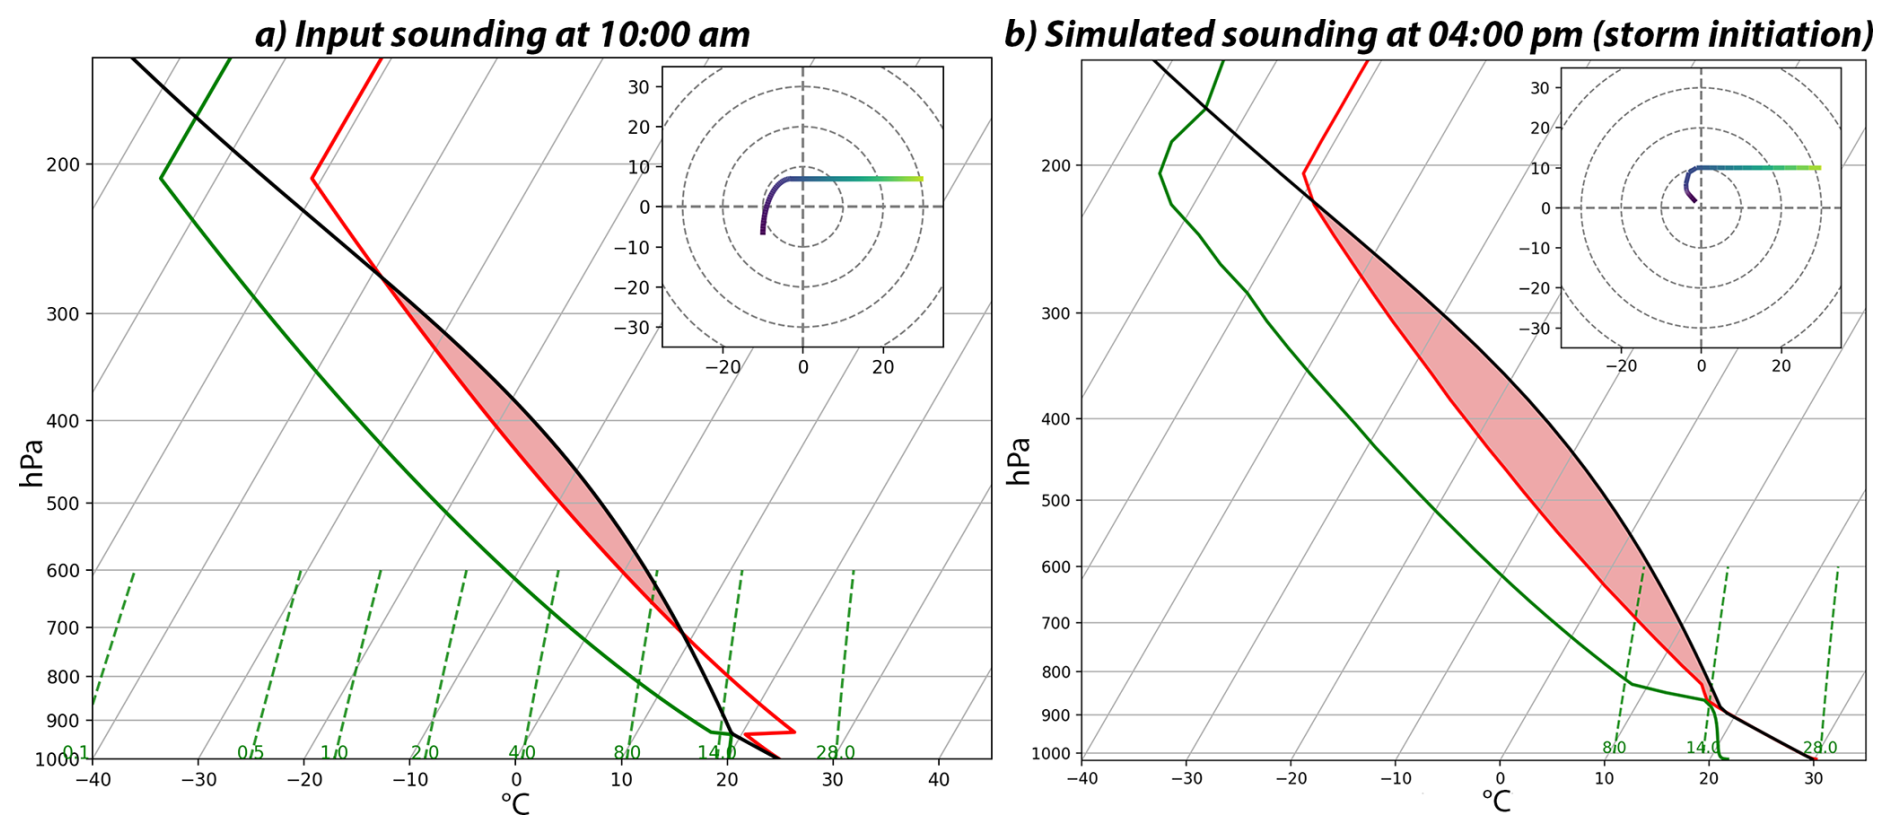
Figure 1(a) Input sounding at 10:00 LT; (b) simulated sounding at 16:00 LT when the storm is initiated with a thermal bubble. Temperature (red line), dew point temperature (green line), and temperature of a surface parcel lifted adiabatically (black line) are shown. The CAPE area is red shaded. The hodograph is shown in the upper-right panel (the first 6 km of wind speeds are plotted).
2.2 Choice of the input sounding
A spin-up time is needed in the simulations to permit the generation of the urban boundary layer. During this spin-up time, deep moist convection is not desired. To achieve the desired controlled experiment, the Weisman–Klemp supercell sounding profile (Weisman and Klemp, 1982) is used. Since the radiative heating during the day quickly triggers deep moist convection, an artificial thermal inversion of 4 K is added in the profile to coincide in height with the lifting condensation level (LCL, Fig. 1a). Through trial and error, an increase of 4 K is chosen as the threshold that completely suppresses the development of moist convection. The same issue was addressed similarly by Nowotarski et al. (2014) and Boyer et al. (2025). At the LCL, the relative humidity is also reduced by a factor of 1.5, to resemble the presence of an Elevated Mixing Layer (EML, see Fig. 1 of Emanuel, 2023), a frequent feature during severe storm events both in the US (Andrews et al., 2024) and in Europe (Dahl and Fischer, 2016). The denominator 1.5 is chosen in order to decrease the mid-level moisture, without drying the troposphere excessively. A thermal inversion of 4 K is compatible with real EML profiles (Tuckman and Emanuel, 2024)2. Thus, the vertical profile of potential temperature Θ(z) of the input sounding is defined as:
where g is gravity acceleration, Cp the specific heat capacity of the atmosphere, Θ0 = 296 K the potential temperature at the surface, ztr = 12 000 m the height of the tropopause, zlcl is the height of the LCL, Θtr = 343 K the potential temperature at the tropopause and Ttr = 219 K its temperature.
The vertical profile of relative humidity rh(z) is defined as:
An exponent of 0.75 is used instead of the 1.25 employed in the original version of Weisman and Klemp (1982), in agreement with Markowski and Dotzek (2011). The moisture in the boundary layer is defined by fixing a maximum value for specific humidity qbl = 14.5 g kg−1.
Six hours after the start of the simulation, the solar heating deepens the PBL (Fig. 1b), eroding the thermal inversion and creating high Convective Available Potential Energy (CAPE) values, as expected by the conceptual model of Emanuel (2023). At this time, the convective inhibition is negligible, and convection can grow once a lifting mechanism is provided. In the previous 6 h, deep moist convection is suppressed by the thermal inversion, permitting the generation of the urban boundary layer.
The environmental wind profile is defined by the quarter-circle hodograph proposed by Rotunno and Klemp (1982). The profiles of the zonal u(z) and meridional v(z) wind components used for the current study, and plotted in the hodograph of Fig. 1a, are defined as:
and
where h1 = 1500 m, h2 = 6000 m, u1 = 7 m s−1, u2 = 40 m s−1, v1 = 10 m s−1 are chosen to produce a right-moving supercell (Markowski and Dotzek, 2011 used similar parameters). The diurnal mixing in the boundary layer and the surface drag changes the imposed wind profiles, as can be inferred by comparing the hodographs at 10:00 and 16:00 LT in Fig. 1. This is also a consequence of the lack of a meridional thermal gradient in the domain, which hinders the presence of a thermal wind capable of maintaining the curved hodograph in long-lasting simulations.
The transient evolution of the simulated profile suggests that the optimal timing for triggering the supercell should be carefully estimated. In the first part of the simulation thermodynamic and kinematic atmospheric parameters change (as shown in Fig. S1 in the Supplement); in particular, CAPE and LCL increase, Convective Inhibition (CIN) and Storm Relative Helicity (SRH) decrease. Between 17:00 and 20:00 LT, these parameters reach a minimum and a quasi-steady state, before nocturnal radiative cooling again significantly modifies the atmosphere. Therefore, triggering the storm at 16:00 LT and analyzing its interaction with the urban area between 17:00 and 19:00 LT is an appropriate choice. Even if at the beginning the supercells are moving into a slightly less favourable environment, any difference between the numerical experiments (that includes the city) and the no_urban simulations (Table 3) observed in that time span can be reasonably attributed to the urban morphological parameters rather than to changes in the broader environment.
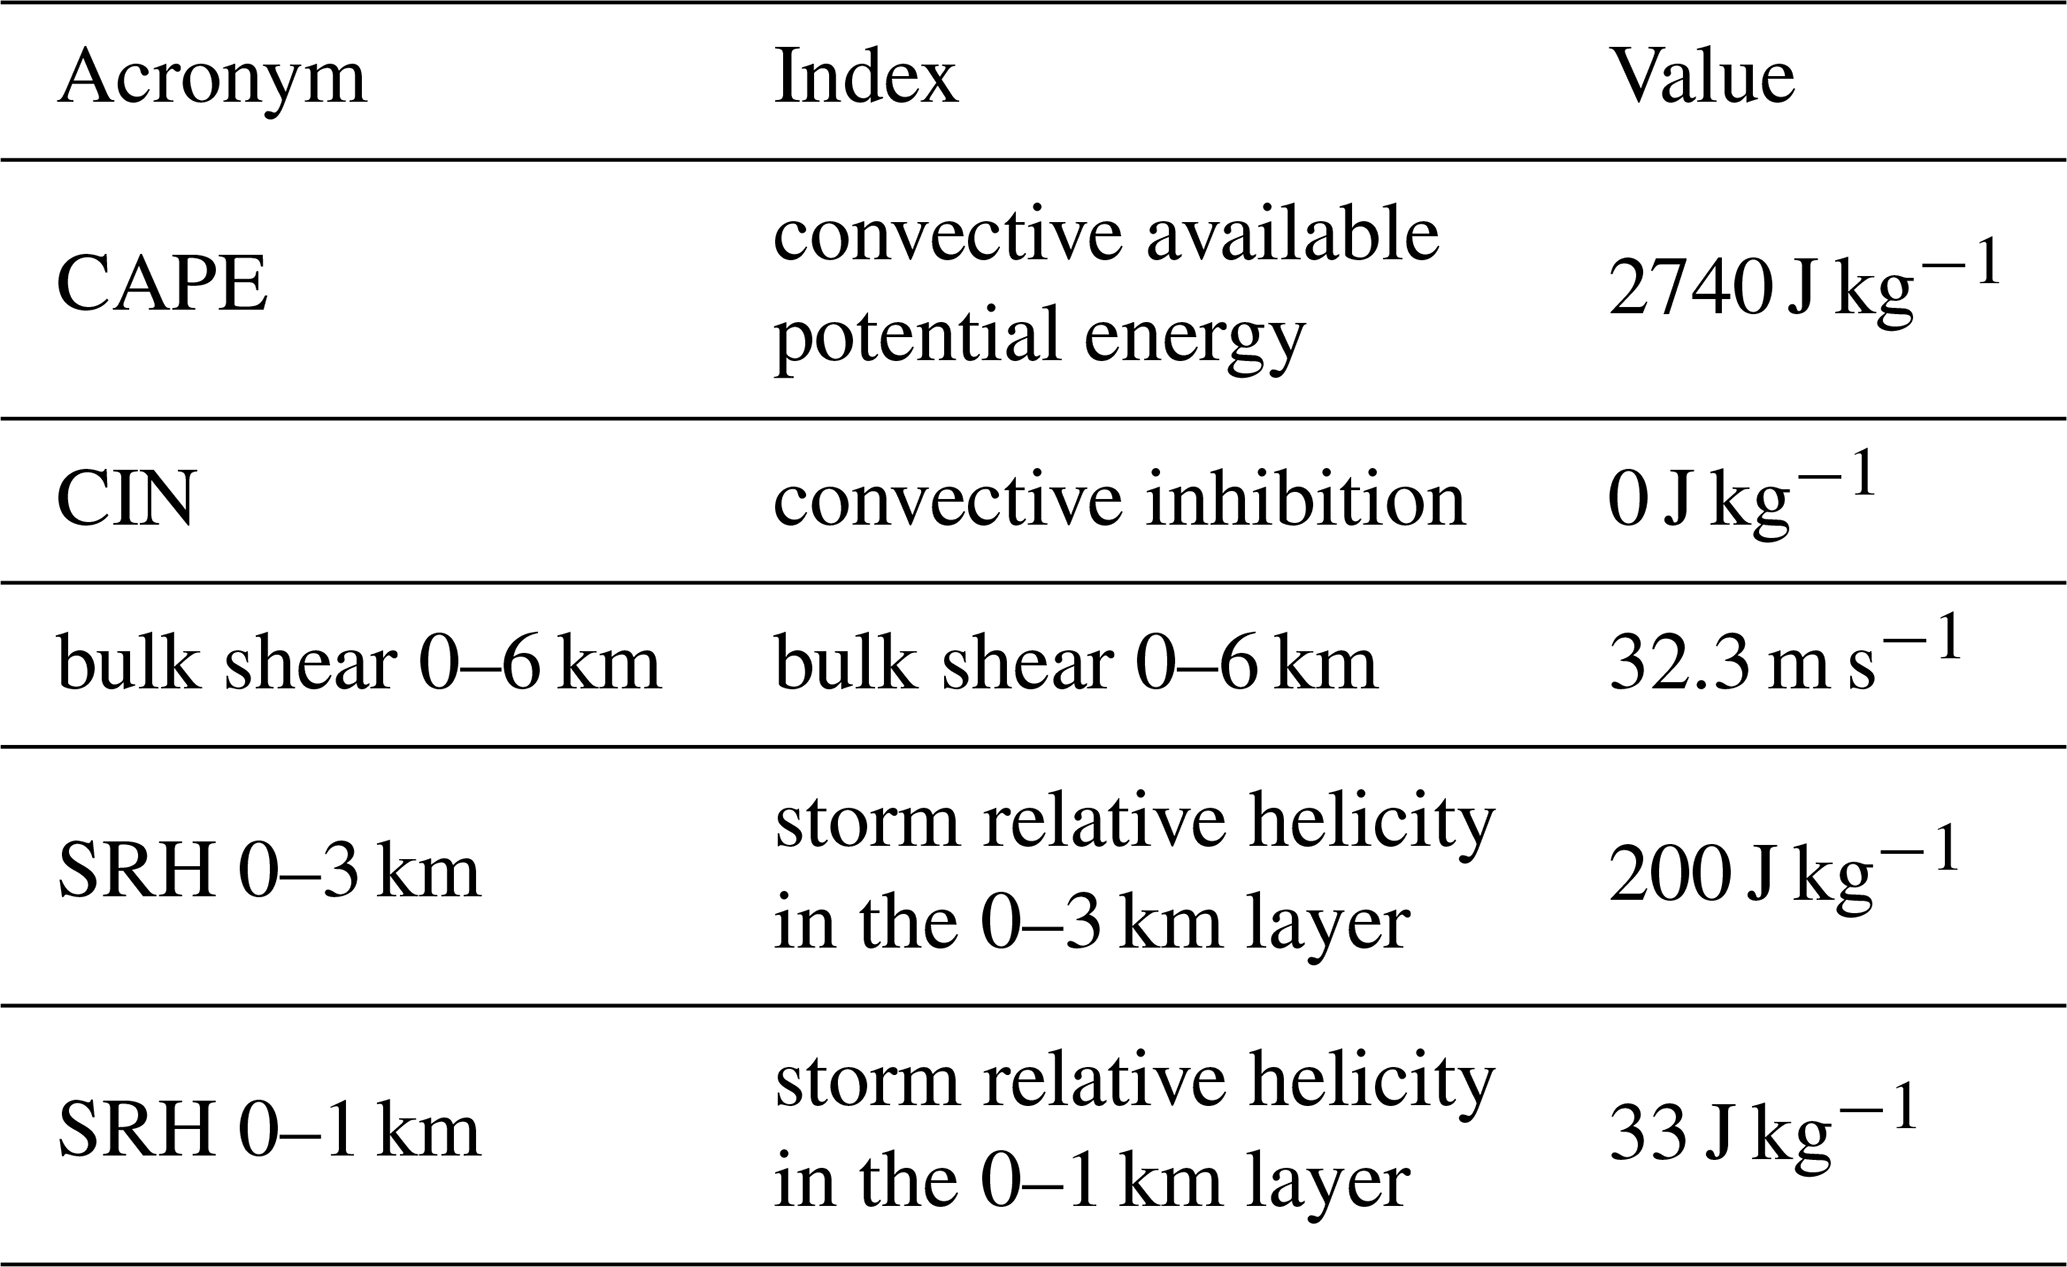
Values of selected parameters calculated from the simulated sounding at 16:00 LT, when convection is initiated, are shown in Table 1. At 16:00 LT, the atmosphere is conducive to supercell storms, since the substantial – albeit not extreme – Surface Based (SB) CAPE (2740 J kg−1, virtual correction is considered), strong bulk shear 0–6 km (32.3 m s−1) and moderate 0–3 km SRH (200 J kg−1). The highest Θe in the low-levels is observed at the surface, suggesting that storms are surface-based with this profile.
Table 1Some relevant thermodynamic and kinematic indices computed on the simulated sounding at 16:00 LT shown in Fig. 1b.
2.3 The numerical experiments
The BEP-BEM model requires several urban morphological parameters to run. The thermal features of the city are kept constant: the default values (reported in Table 2) of Local Climate Zone 2 are used (Ching et al., 2018). The sensitivity of the supercell to some of the BEP-BEM parameters is investigated in this work: street width (s), building width (b), building height (hb), and urban fraction (uf). In Table 3, a summary of the numerical experiments conducted is provided, while in Fig. 2, a graphical summary is furnished. The range of parameters explored is selected by studying the mean morphological parameters of some European and US cities frequently affected by severe storms (see, for example, Table S1 and Fig. S2 in the Supplement), using the GLobal Building heights for Urban Studies (GLOBUS) dataset (Kamath et al., 2024). In that dataset, the plan area fraction (λp) and the building surface-to-plan area ratio (λb) are reported. These are defined as:
λp is the fraction of ground covered by buildings, it quantifies the building density in a city. Instead, λp quantifies the total urban area (roofs, walls, streets) exposed to the atmosphere.
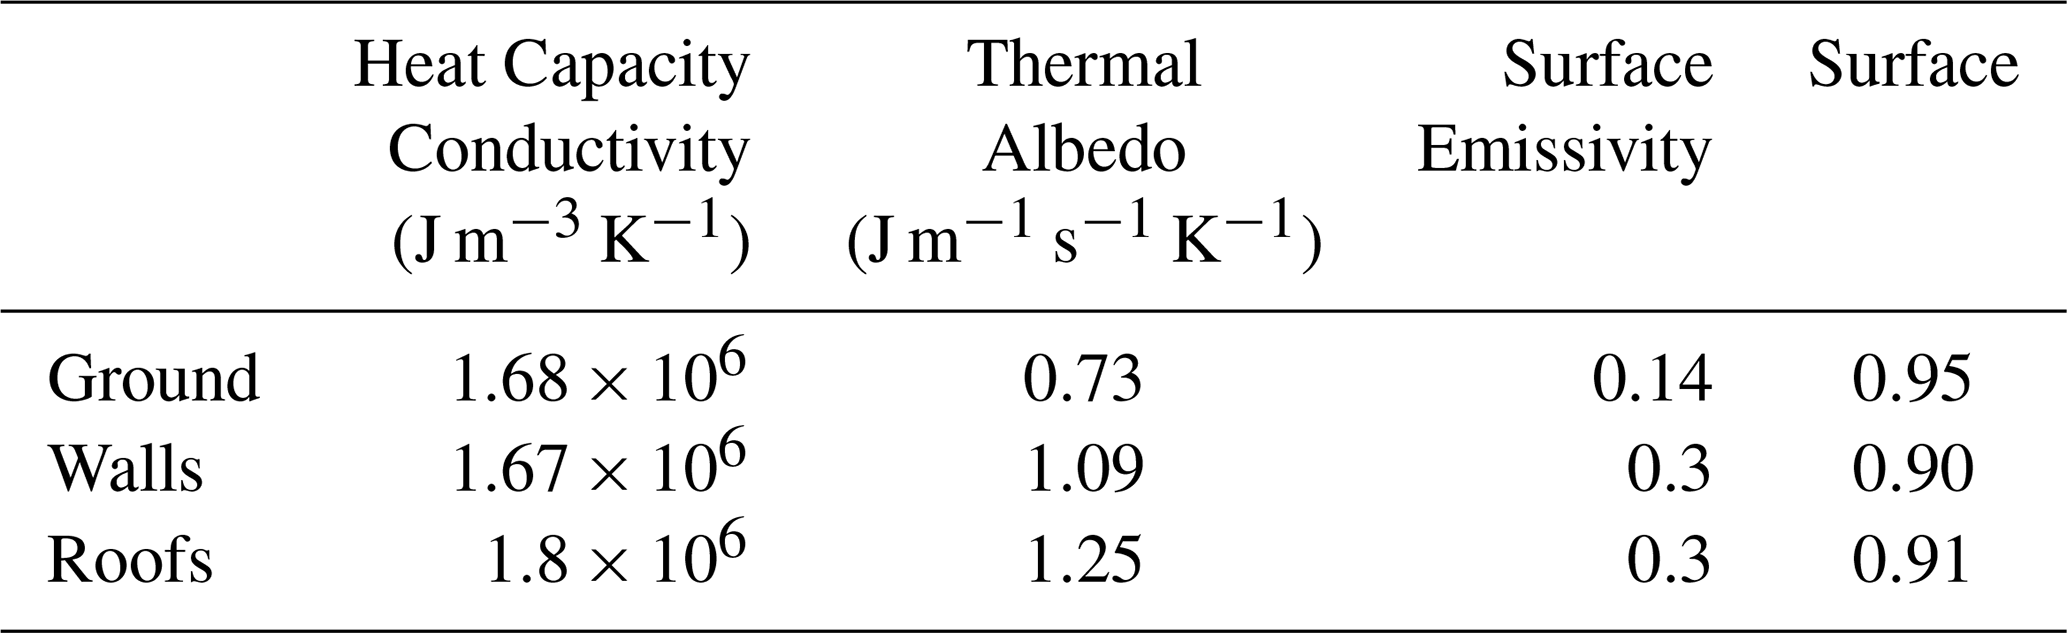
Table 3Numerical experiments conducted and parameters explored.
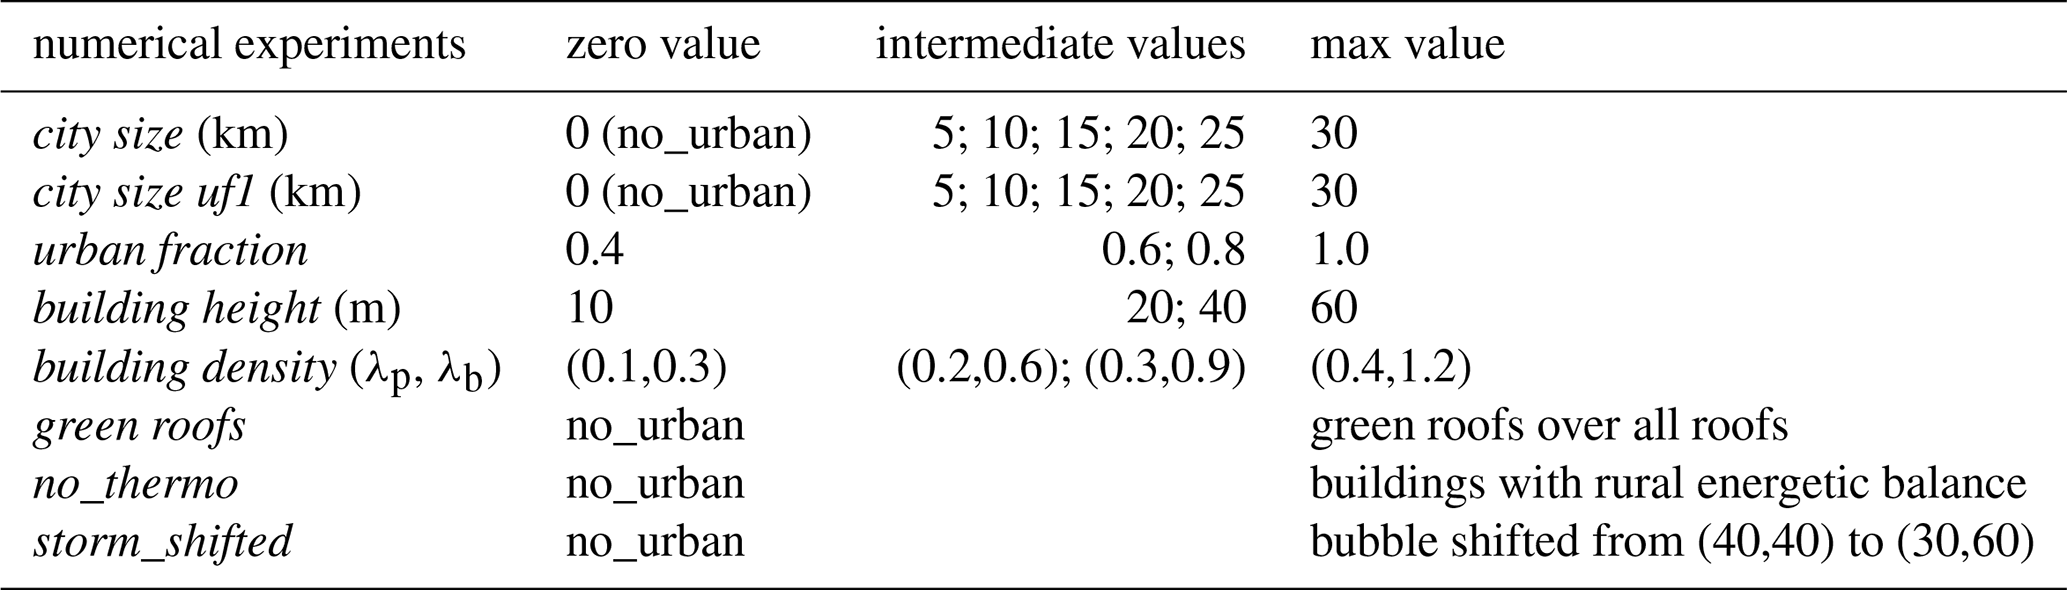
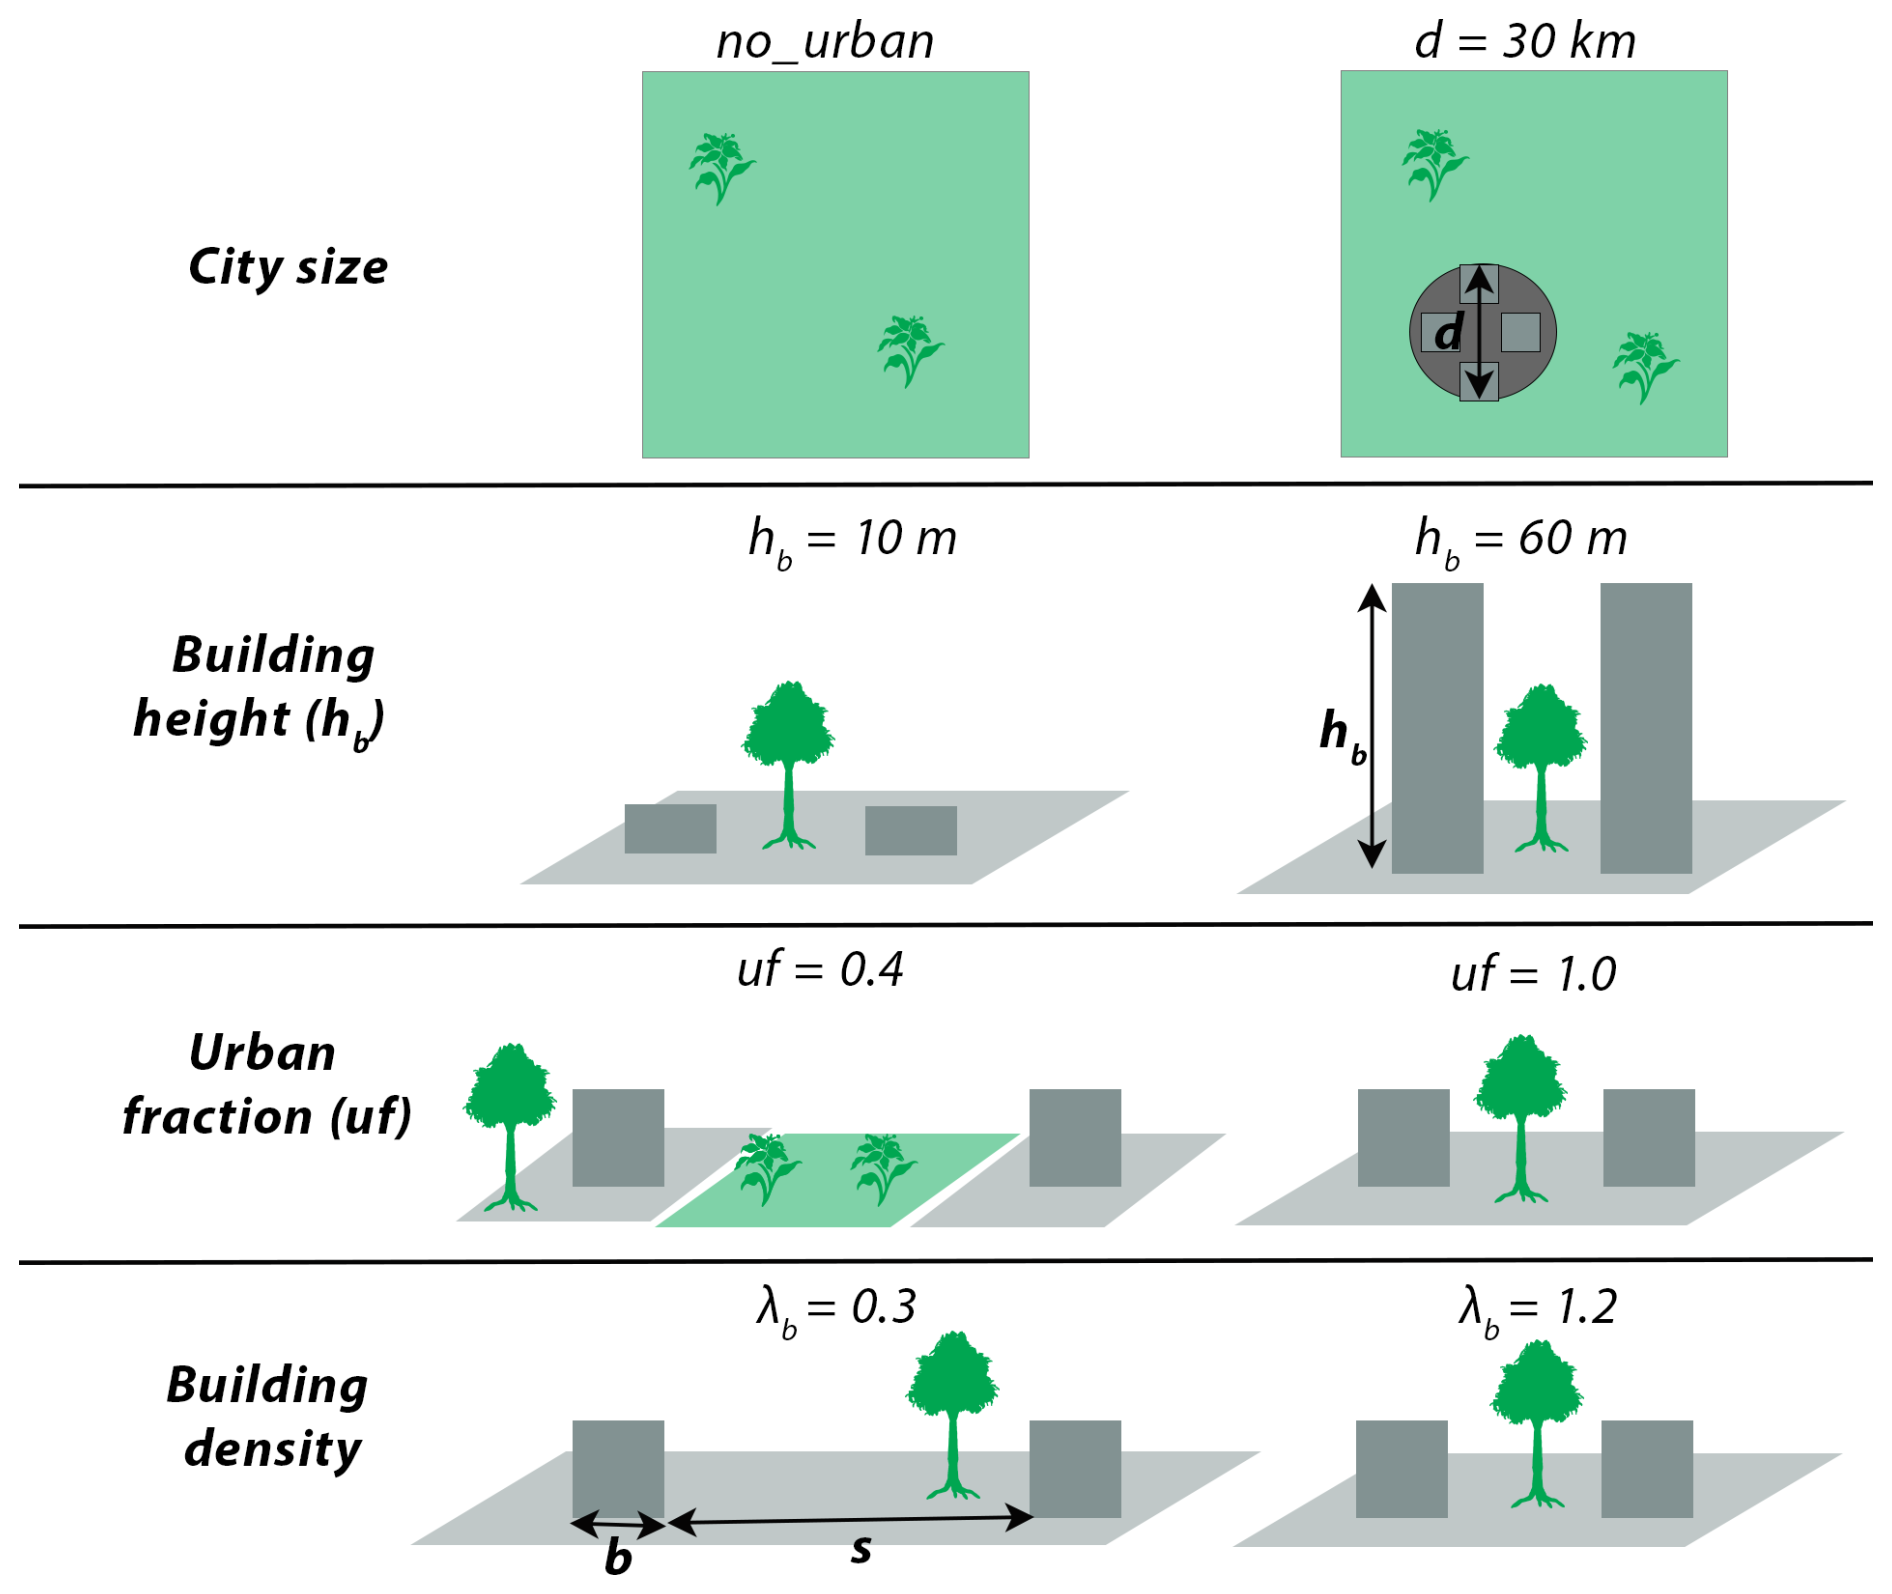
Figure 2Schematic representation of some of the urban features explored in the idealized simulations. The zero value (left) and the max value (right) of the studied urban morphological parameters (city size, building height, urban fraction, and building density) are shown (see Table 3). In the first row, the simulation domain is depicted from above, showing croplands (green shading with plants) and the city (grey circle). In the remaining rows, the view is lateral. Grey rectangles represent buildings. d denotes the city diameter, hb the building height, uf the urban fraction, s the street width, b the building width, and λb the ratio of building area to total area.
First, a sensitivity analysis of city size is conducted, with city diameters ranging from 0 km in the no_urban scenario to 30 km (numerical experiments city size). Table 4 presents the parameters used to define the idealized city uniformly in the control runs. These are based on the Milan, Italy, GLOBUS data (Table S1). Milan, Italy, is chosen as the reference city both because it was object of investigation in a preceding case study analysis (De Martin et al., 2025), and also because its morphological parameters are relatively typical of European cities. It is characterized by urban fraction of 0.63, mean building heights of 20 m and (λp,λb) = (0.24,0.78).
Table 4Urban morphological parameters used in the set of numerical experiments city size (in the first row the name of the experiments is reported).

The same set of numerical experiments is also performed using an urban fraction (uf) of 1.0 instead of 0.63 (numerical experiments city size uf1, Table 5). An urban fraction of 1.0 means the entire urban surface is built-up (i.e., no croplands within the city radius). However, 20 % of the street surface remains covered by trees in these experiments, as a city without any trees is unrealistic. Although a mean urban fraction of 1.0 is not observed in European or U.S. cities (Table S1), this experiment is conducted to explore the impact of city size under the extreme scenario of a fully urbanized city.
Table 5As in Table 4, but for numerical experiments city size uf1.

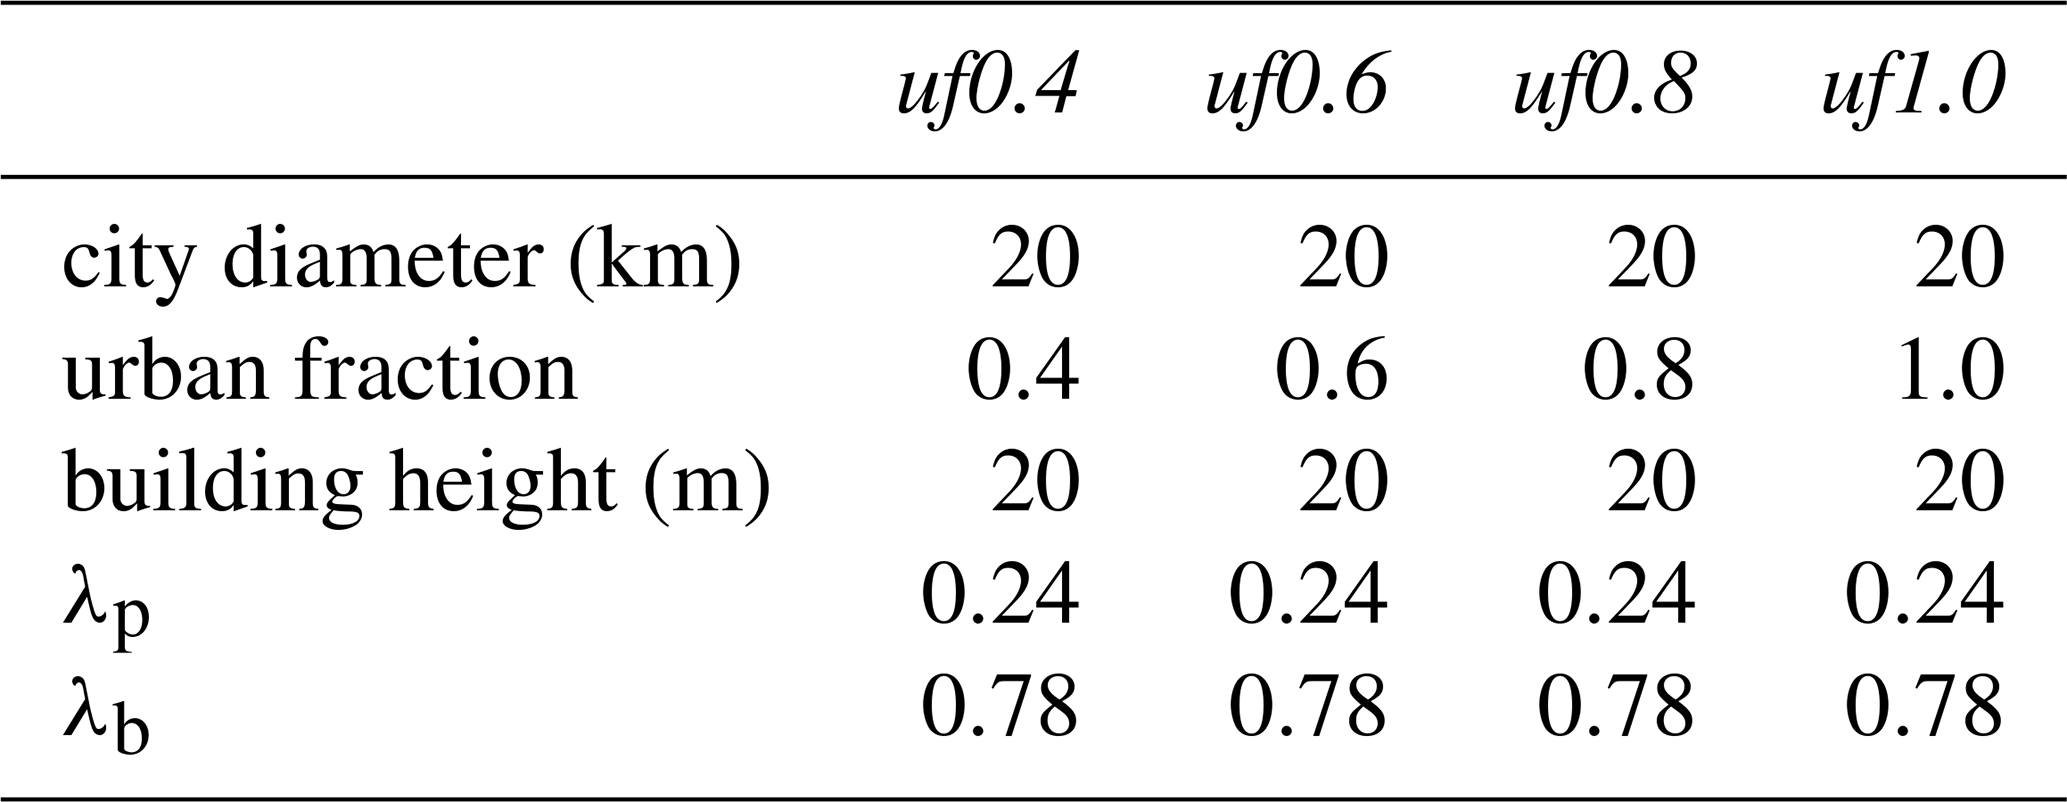
A third set of numerical experiments, called urban fraction, is conducted to examine the supercell's sensitivity to urban fraction. Values ranging from 0.4 to 1.0 are investigated for an idealized city with a diameter of 20 km (Table 6).
Table 6As in Table 4, but for numerical experiments urban fraction (uf).
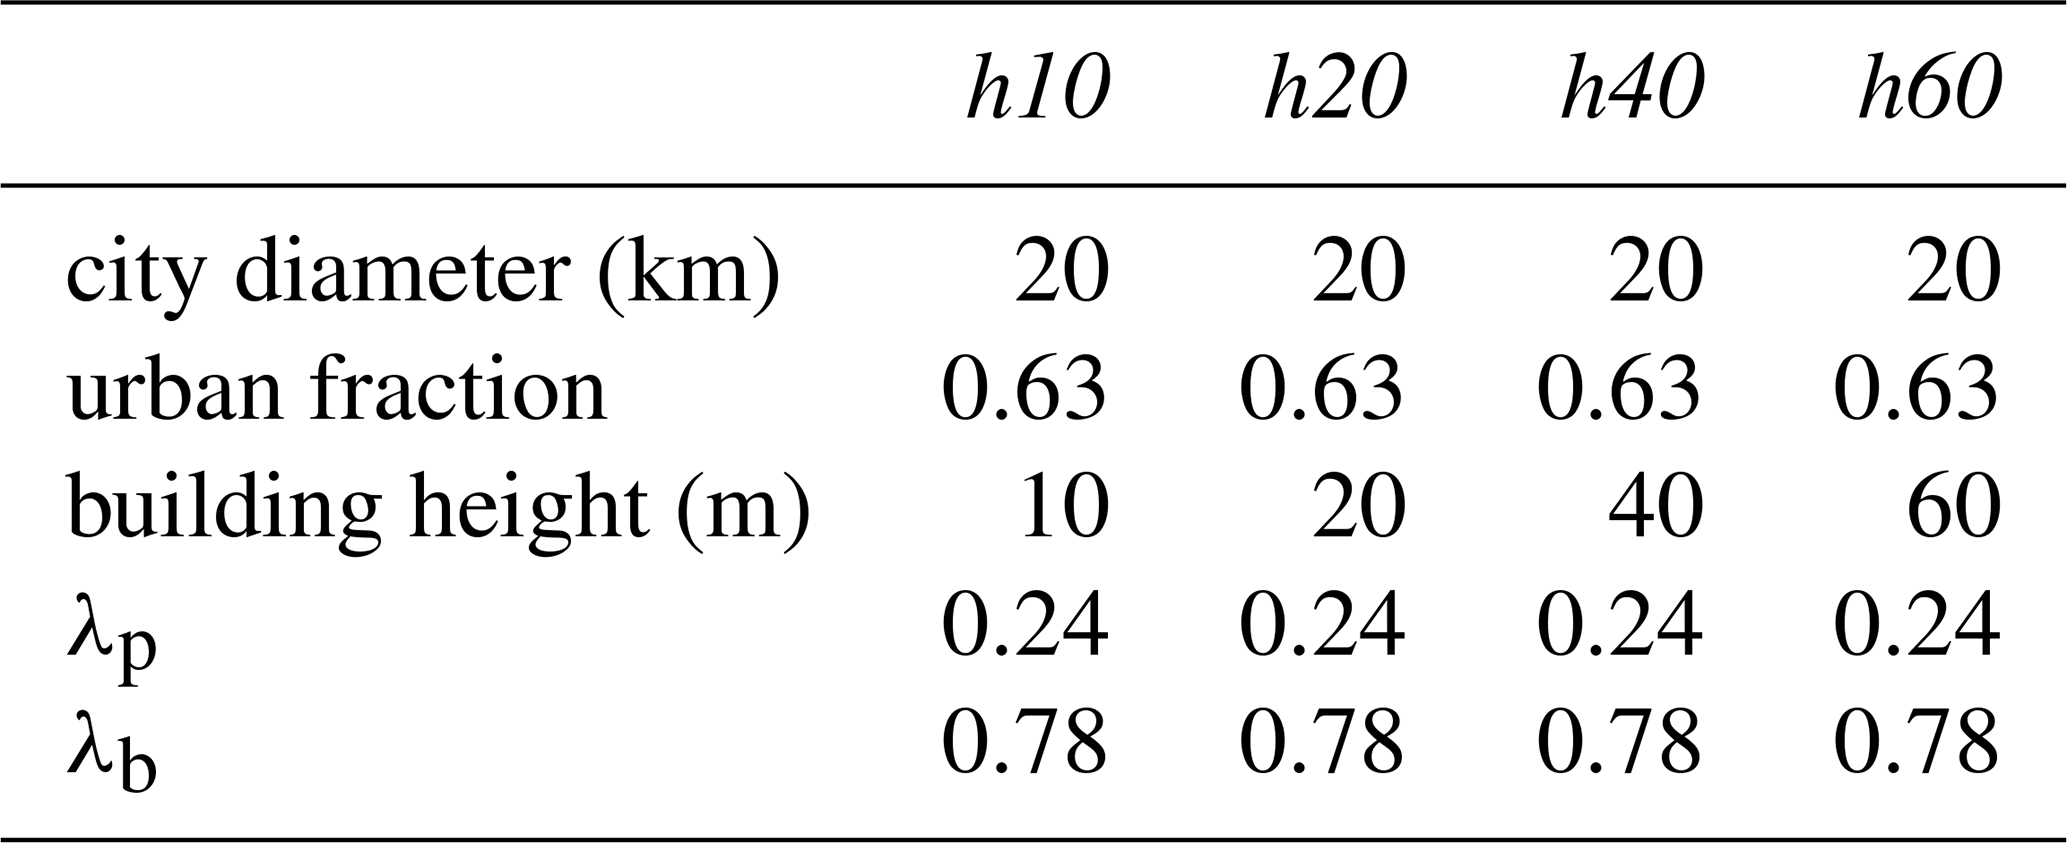
The building height experiments, investigate the effect of building height on the simulated storm (Table 7). The building heights explored range from 10 to 60 m, representing cities from the Chicago metropolitan area to downtown New York.
Table 7As in Table 4, but for numerical experiments building height (hb).
Furthermore, the building density experiments explore the effect of building density on the simulated storms (Table 8). Since the BEP-BEM scheme uses street and building widths as input parameters (rather than the λ parameters), the building height and the building width are kept constant at 20 m, while the street width is varied from 106 to 11.5 m. This corresponds to a range of (λp,λb) values from (0.1,0.3) to (0.4,1.2), representing a transition from a very dispersed to a highly compact city.
Table 8As in Table 4 but for numerical experiments building density.
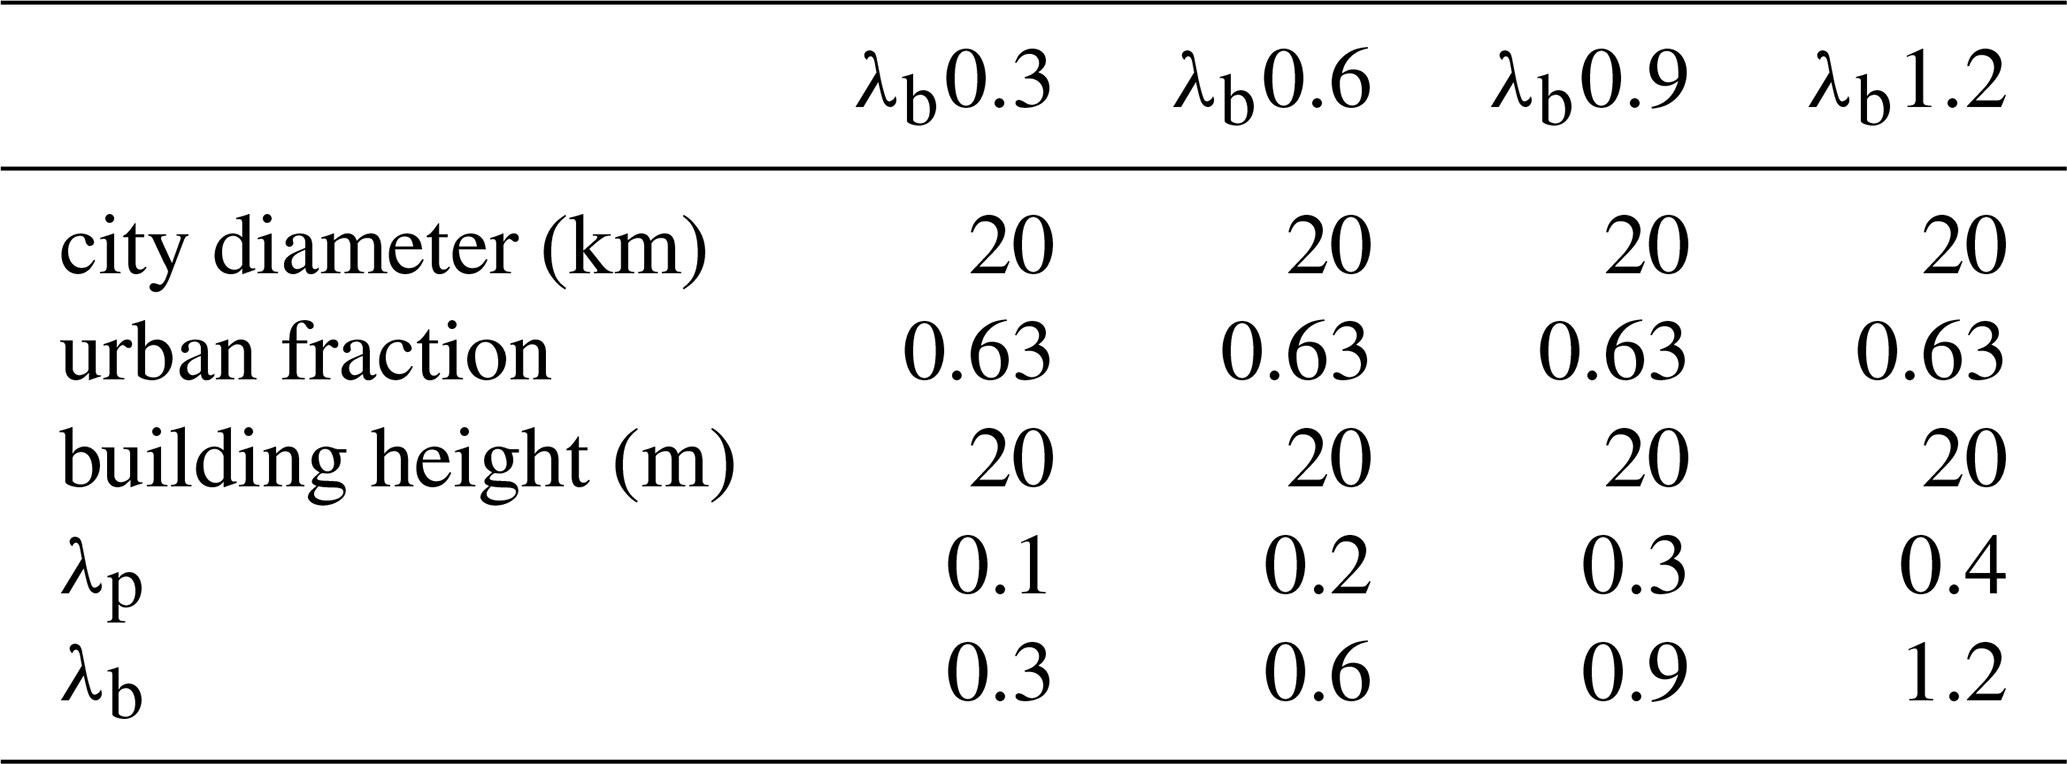
Lastly, some additional experiments are conducted to investigate other specific questions. An experiment is carried out using the settings of numerical experiment uf1_30km, but with vegetation placed over all the buildings of the idealized city (Zonato et al., 2021), to investigate the effect of this nature-based solution on storm dynamics (this experiment is called green roofs; see Table 3). A second experiment, called no_thermo, is conducted with the settings of the uf1_30km experiment and the same urban roughness, but with the urban energetic balance replaced by the rural one. This experiment serves to disentangle the dynamical (i.e., building barrier-effects) and thermodynamics (i.e., UHI and UDI) effects of the city on the storm and the pre-storm environment. An experiment, called storm_shifted (Table 3), is also run to test the sensitivity of the results to whether a different part of the urban plume is crossed by the storm. In this experiment, the thermal bubble is shifted from grid-point (40,40) to (30,60), while keeping the same parameters of experiment uf1_30km (Table 5).
2.4 Generation of the ensembles
An ensemble approach is adopted to better assess the physical signal of urban-induced storm modifications across different flow realizations, given the intrinsic chaotic variability of the atmosphere. For each numerical experiment, eleven simulations are conducted: one is the control run, and the other ten are generated using the Stochastic Kinetic Energy Backscatter Scheme (SKEBS, Berner et al., 2009). SKEBS generates stochastic streamfunction perturbations through autoregressive processes in spectral space and injects them into regions where the model exhibits excessive systematic kinetic energy loss. In the present study, the parameters used to generate the ensemble with SKEBS are set following Romine et al. (2014), who investigated ensemble dispersion in deep moist convective events. The only difference from their setup is the value of the maximum wavenumber of the potential temperature and streamfunction perturbation, which is set to match the number of grid points in the current simulations.
The ten ensemble members are generated using ten distinct random seeds, which are kept constant across all numerical experiments. As a result, the same members across different experiments are using the same seeds and are not fully independent (this is considered in the statistical analysis). This is done intentionally to better evaluate the influence of each parameter over the different flow evolutions (i.e., members).
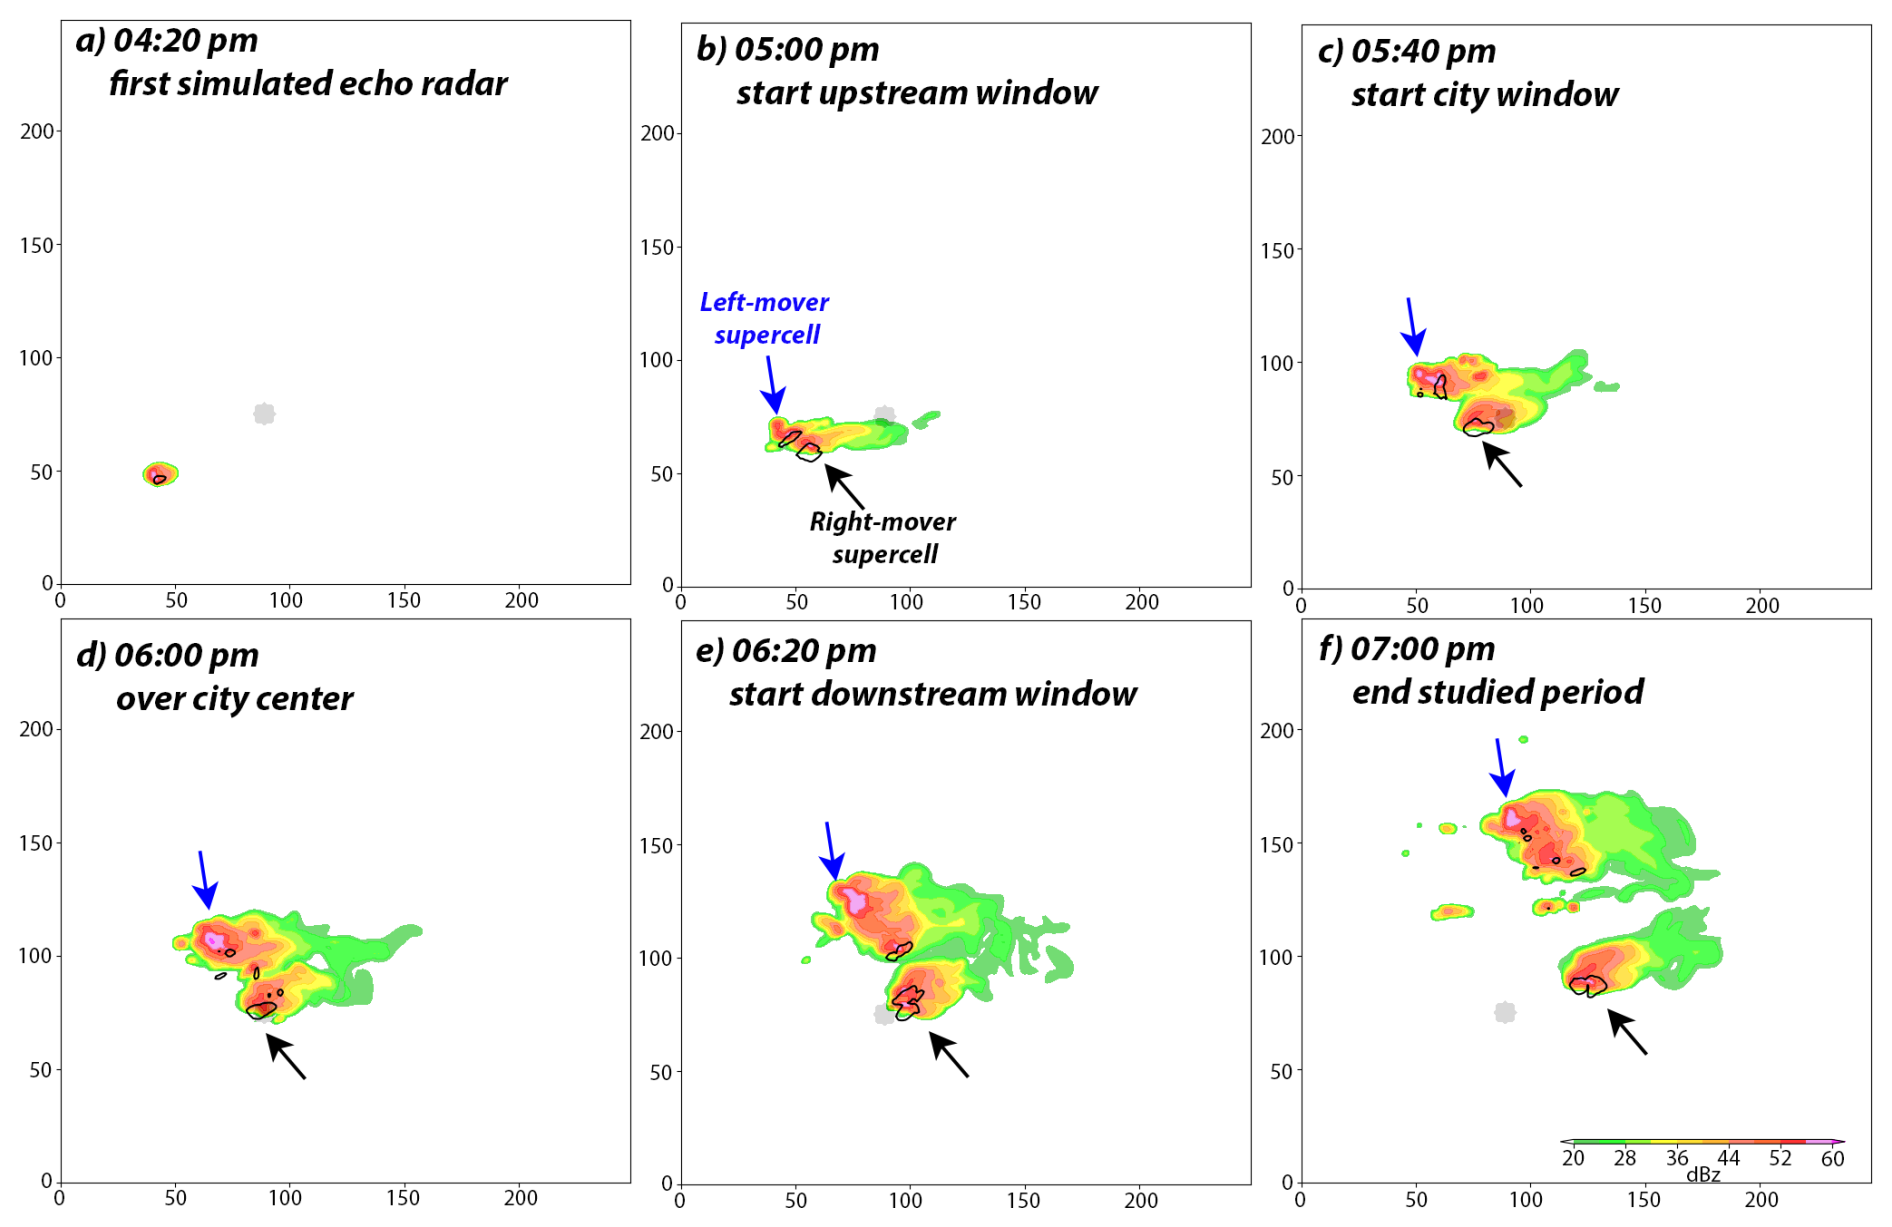
Figure 3Maximum simulated reflectivity (colour shading) at (a) 16:20 LT, (b) 17:00 LT, (c) 17:40 LT, (d) 18:00 LT, (e) 18:20 LT, (f) 19:00 LT by the control run of numerical experiment uf0.63_10km. The city is shown with a grey shading. UH value higher than 100 m s−1 are highlighted with a black contour. The black (blue) arrow indicates the right-moving (left-moving) supercell.
2.5 Storm tracking
The Statistical and Programmable Objective Updraft Tracker (SPOUT, Terwey and Rozoff, 2014) algorithm is used to track the simulated updrafts. Fine-tuning of some user-defined parameters is necessary to achieve satisfactory tracking of the supercell updrafts. Table S2 lists these parameters and compares them with those originally employed by Terwey and Rozoff (2014).
Further filtering of the SPOUT-detected tracks is necessary to isolate the right-moving supercell track, as the algorithm frequently splits it. This occurs because SPOUT tracks updrafts individually, and supercells may cycle, producing new updrafts.
To filter out these updrafts, only the track that begins near the location where the thermal bubble is released is considered. If the track terminates at x < 150 (i.e., before 3 h after the bubble release), a new track is searched for within a 10 km radius. If found, the new track is connected to the previous one. This process is repeated until the track reaches x = 150 or the storm dissipates.
Each point along the track is considered the storm center at a given time step. Storm diagnostics are extracted every 10 min, and the extracted variables are listed in Table 9. For each time step, the mean (or maximum or minimum, depending on the variable) is calculated within an 8 km radius around the storm center, and this value is assigned to the storm at that time step.
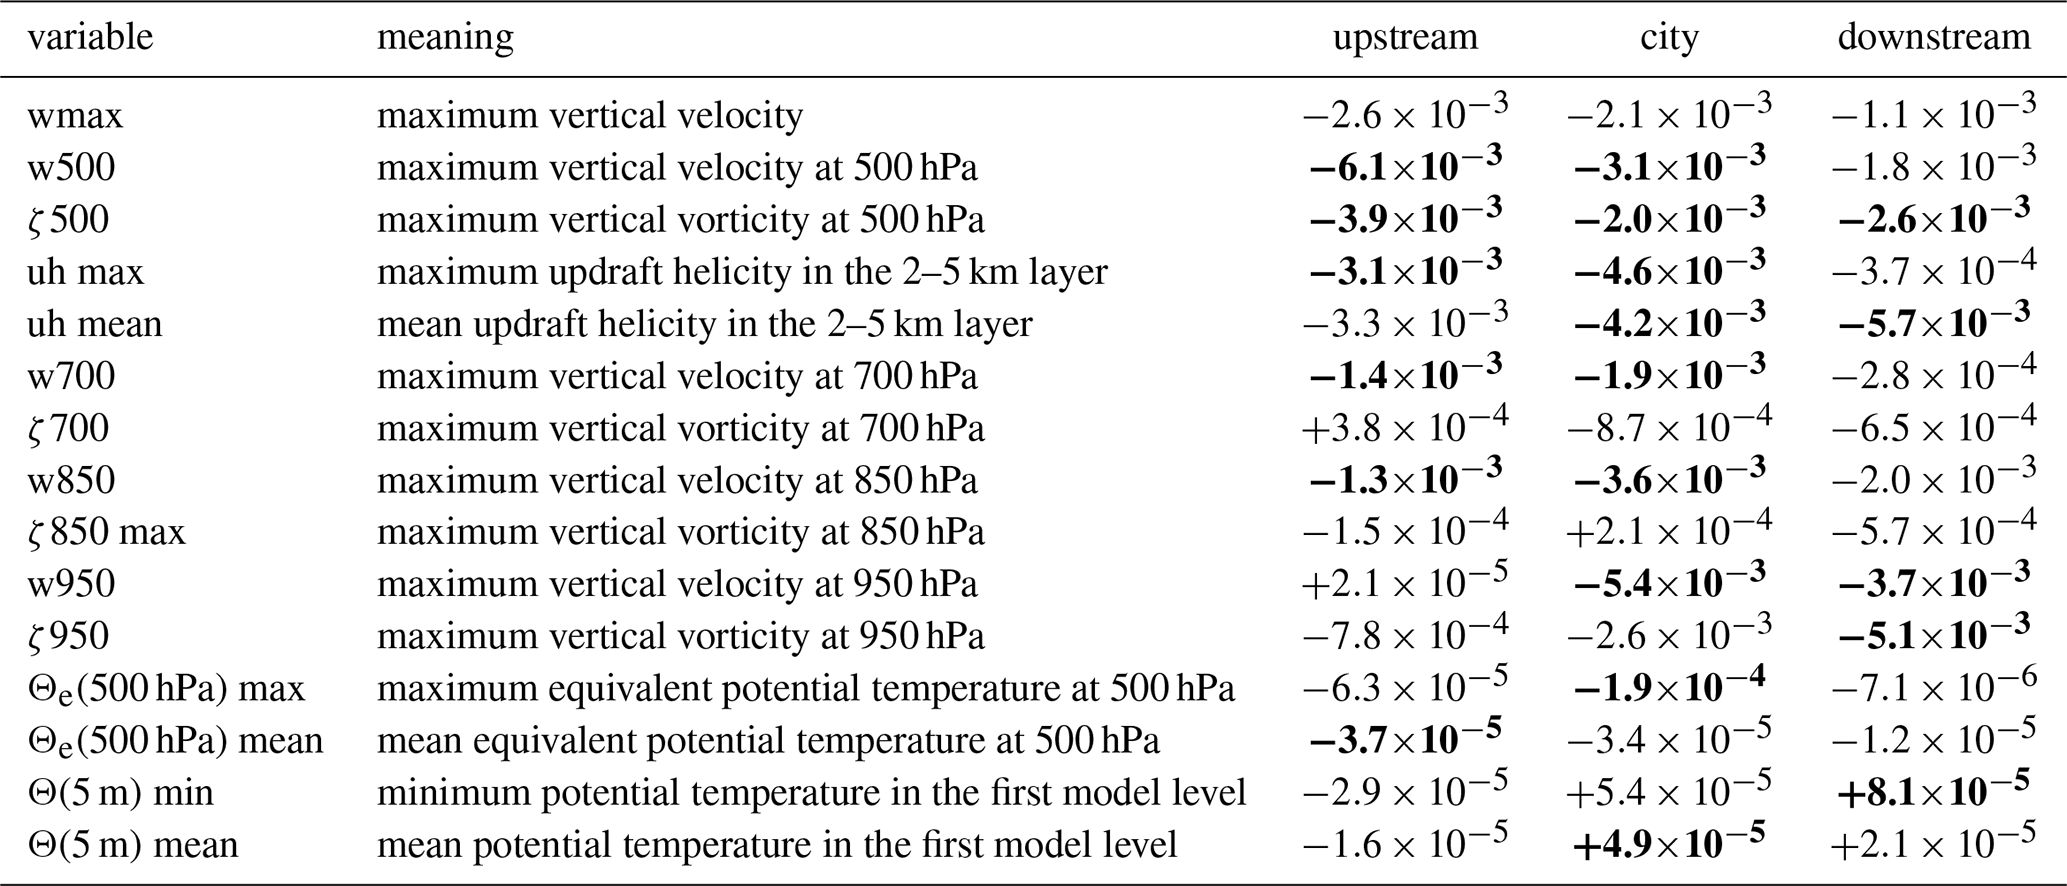
Table 9List of storm diagnostic variables used (every value is computed considering an 8 km radius following the storm track) and corresponding mean slopes (km−1) of the linear fits between diagnostic variables and city diameters in the city size numerical experiments. Bold values are statistically significant lower (or larger) than zero.
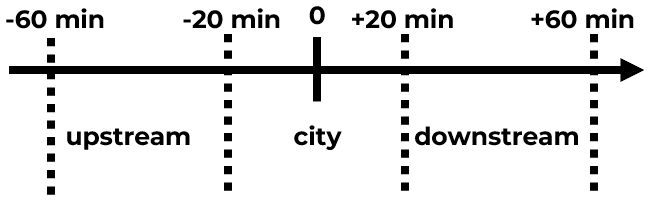
Then, three regions are defined using a temporal criterion to compare the storms at the same developmental stage across different numerical experiments. Those regions are defined with respect to a zero, defined as the time step when the supercell is above the city, corresponding to grid point (90,76) in the control run of the no_urban experiment. This time step is at 18:00 LT (see, for instance, Fig. 3d). Then, three 40 min windows are defined (sketch in Fig. 4). The first one, from −20 to +20 min, defines the city region. The upstream region is defined from −60 to −20 min. Lastly, the downstream region is defined from +20 to +60 min. In these windows, the variables previously computed for each time step are averaged. Thus, considering the 10 min output frequency, four time steps are averaged for each window.
2.6 Statistical method used to analyze the numerical experiments
Given a set of numerical experiments, a statistical analysis is conducted for each region and for each variable. The variables are normalized with respect to a reference zero value (defined case-by-case in Table 3). The normalized zij variable for the ensemble member j and numerical experiment i is given by:
where xij is the original variable and x0j is the reference value for the ensemble member j. This approach is adopted to understand how storm diagnostics vary relative to a reference case (e.g., how updraft speed changes with increasing city size compared to the no_urban case). A linear fit is performed using the curve_fit function from SciPy (Virtanen et al., 2020) on the normalized variables sharing the same SKEBS seed. Any null values are excluded: specifically, if a storm dissipates, the corresponding ensemble member is omitted from the fit. This exclusion is necessary because, for some variables (e.g., Θ), including a null value in the linear fit lacks physical meaning. In general, excluding such values has been observed to increase the fit's statistical significance.
We focus solely on the slope parameter of the linear fit, particularly its sign. The statistical significance of the slope relative to a null hypothesis of a zero slope is assessed using a 5 %–95 % bootstrap confidence interval, computed from 1000 iterations using the bootstrap function of SciPy.
In this section, the sensitivity of the simulated supercell to urban morphological parameters is presented. Across the different ensemble members, there are variations in the storm tracks and intensity; however, all simulations of the no_urban reference experiment produce a long-lasting, right-moving supercell, similar to the one shown in Fig. 3 for the uf0.63_10km experiment. The right-moving supercell approaches the city from the WSW (Fig. 3c) and remains isolated and intense also 1 h after hitting the city (Fig. 3f).
3.1 City size
In the numerical experiments city size, the effect of increasing the diameter of the city with the same characteristics as Milan on the supercell is investigated. The normalized mean value of the storm's UH in the city region is shown in Fig. 5a for each ensemble member as a function of city diameter (the same plots for the upstream and downstream regions are displayed in Fig. S3). In the city region, there is a clear decreasing trend in UH, even with considerable ensemble spread. A similar pattern is observed in the upstream region (Fig. S4a), whereas in the downstream region a more consistent decreasing trend is seen across all ensemble members (Fig. S3c).
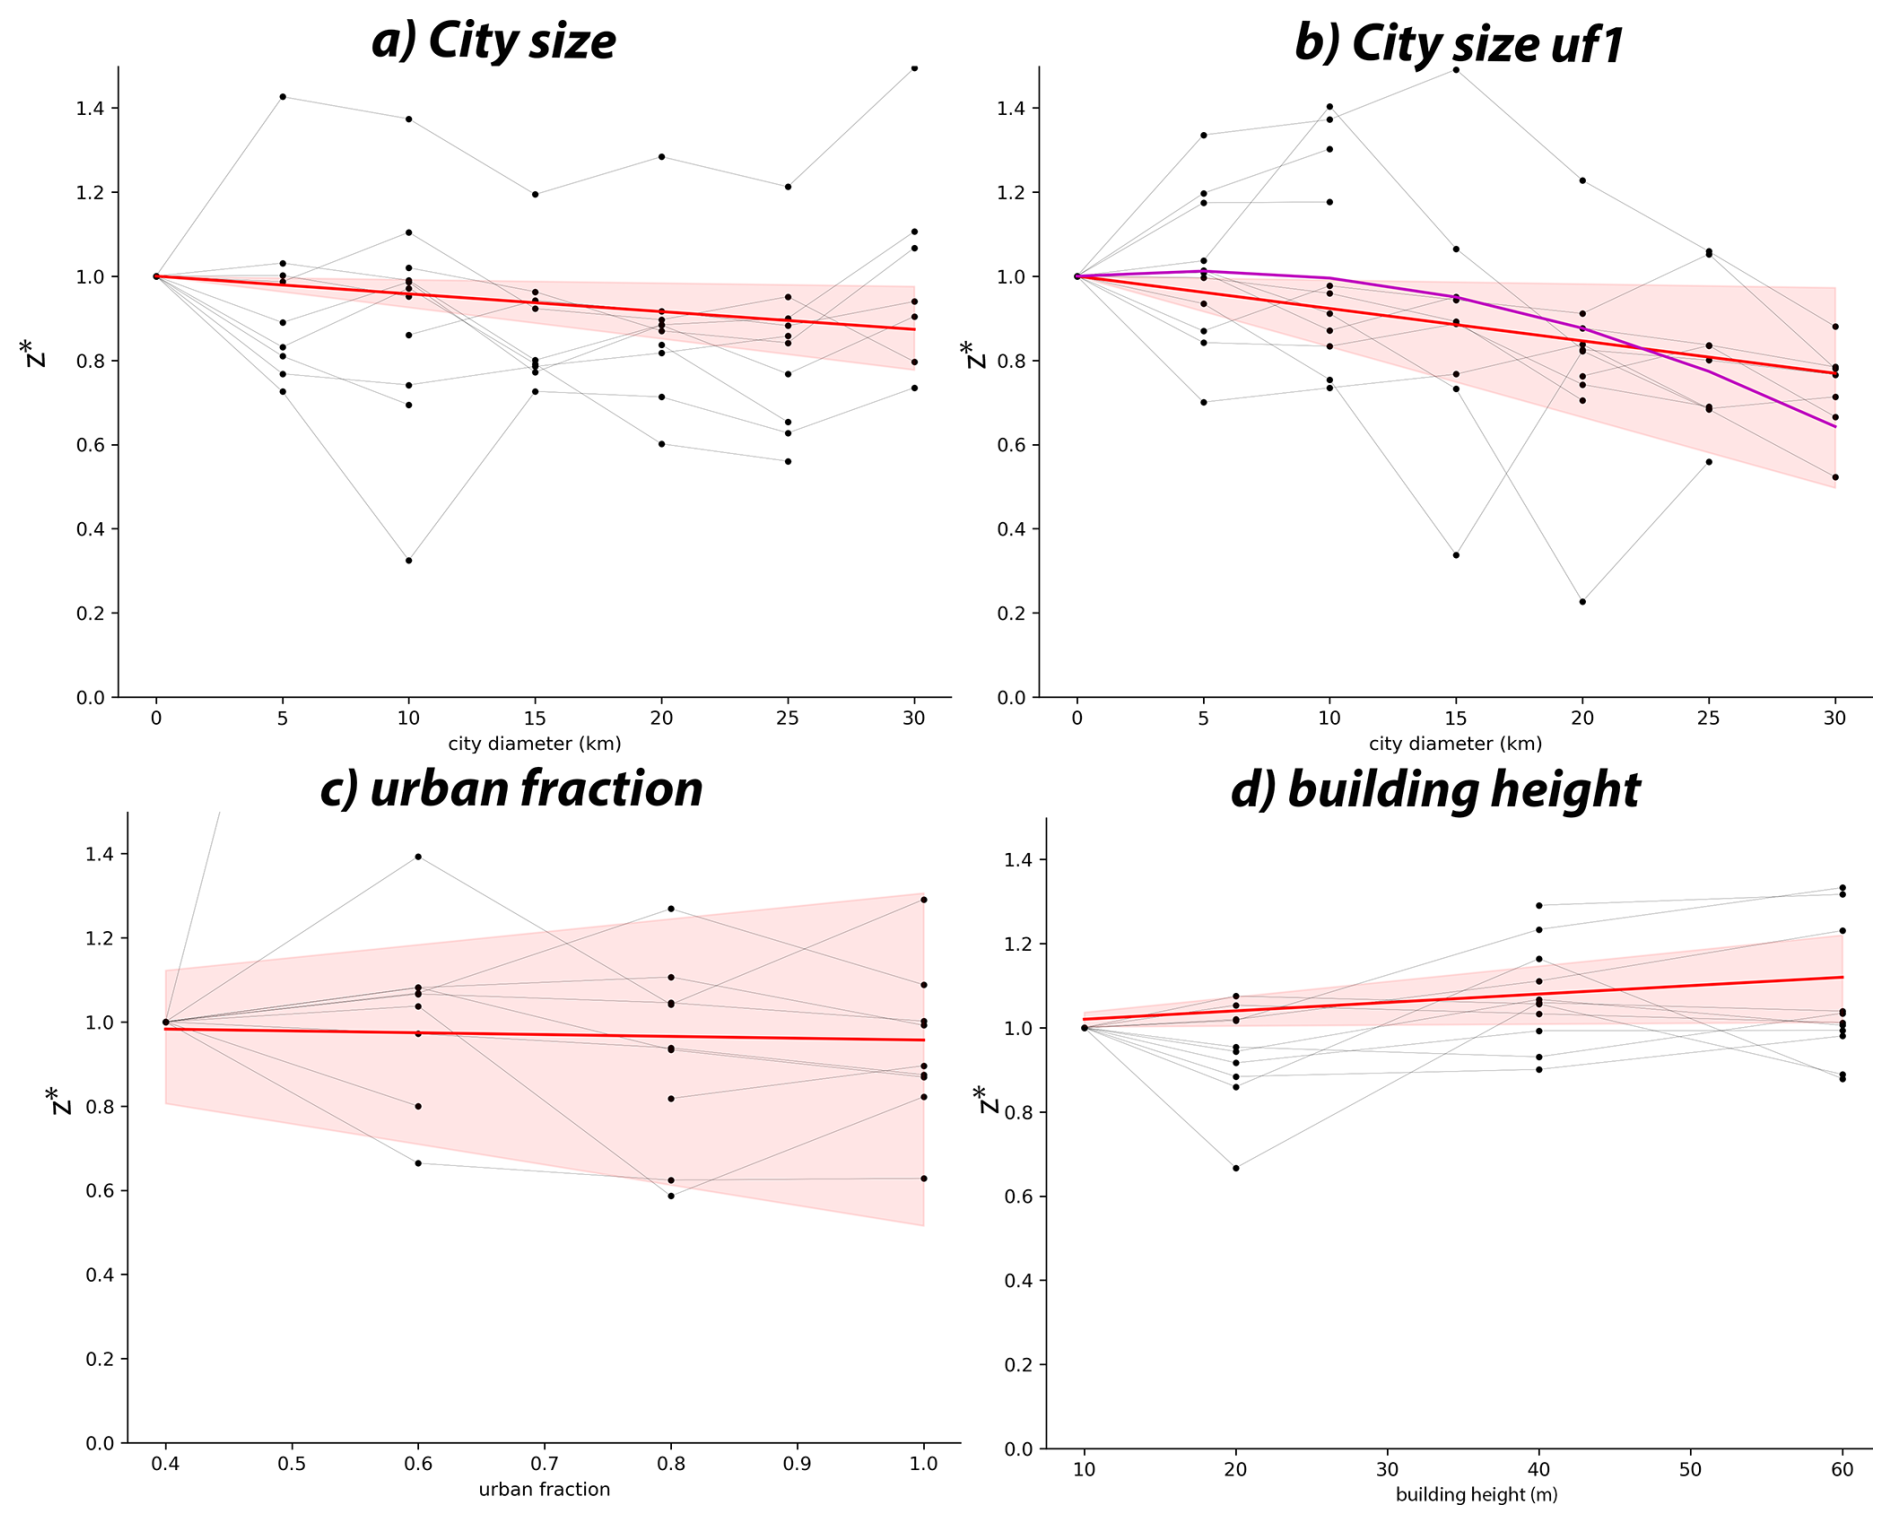
Figure 5(a) Normalized mean UH (z*) in each ensemble member (black dots) of the city size set of experiments (Table 4) in function of the city diameter (km) in the city region. Ensemble members obtained with the same seed are connected. The mean linear fit is shown with a red line, while the 5 %–95 % confidence interval is red shaded. Panels (b), (c) and (d) as in panel (a) but for the city size uf1, urban fraction and building height set of experiments, respectively. In panel (b), a quadratic fit is shown with a purple line.
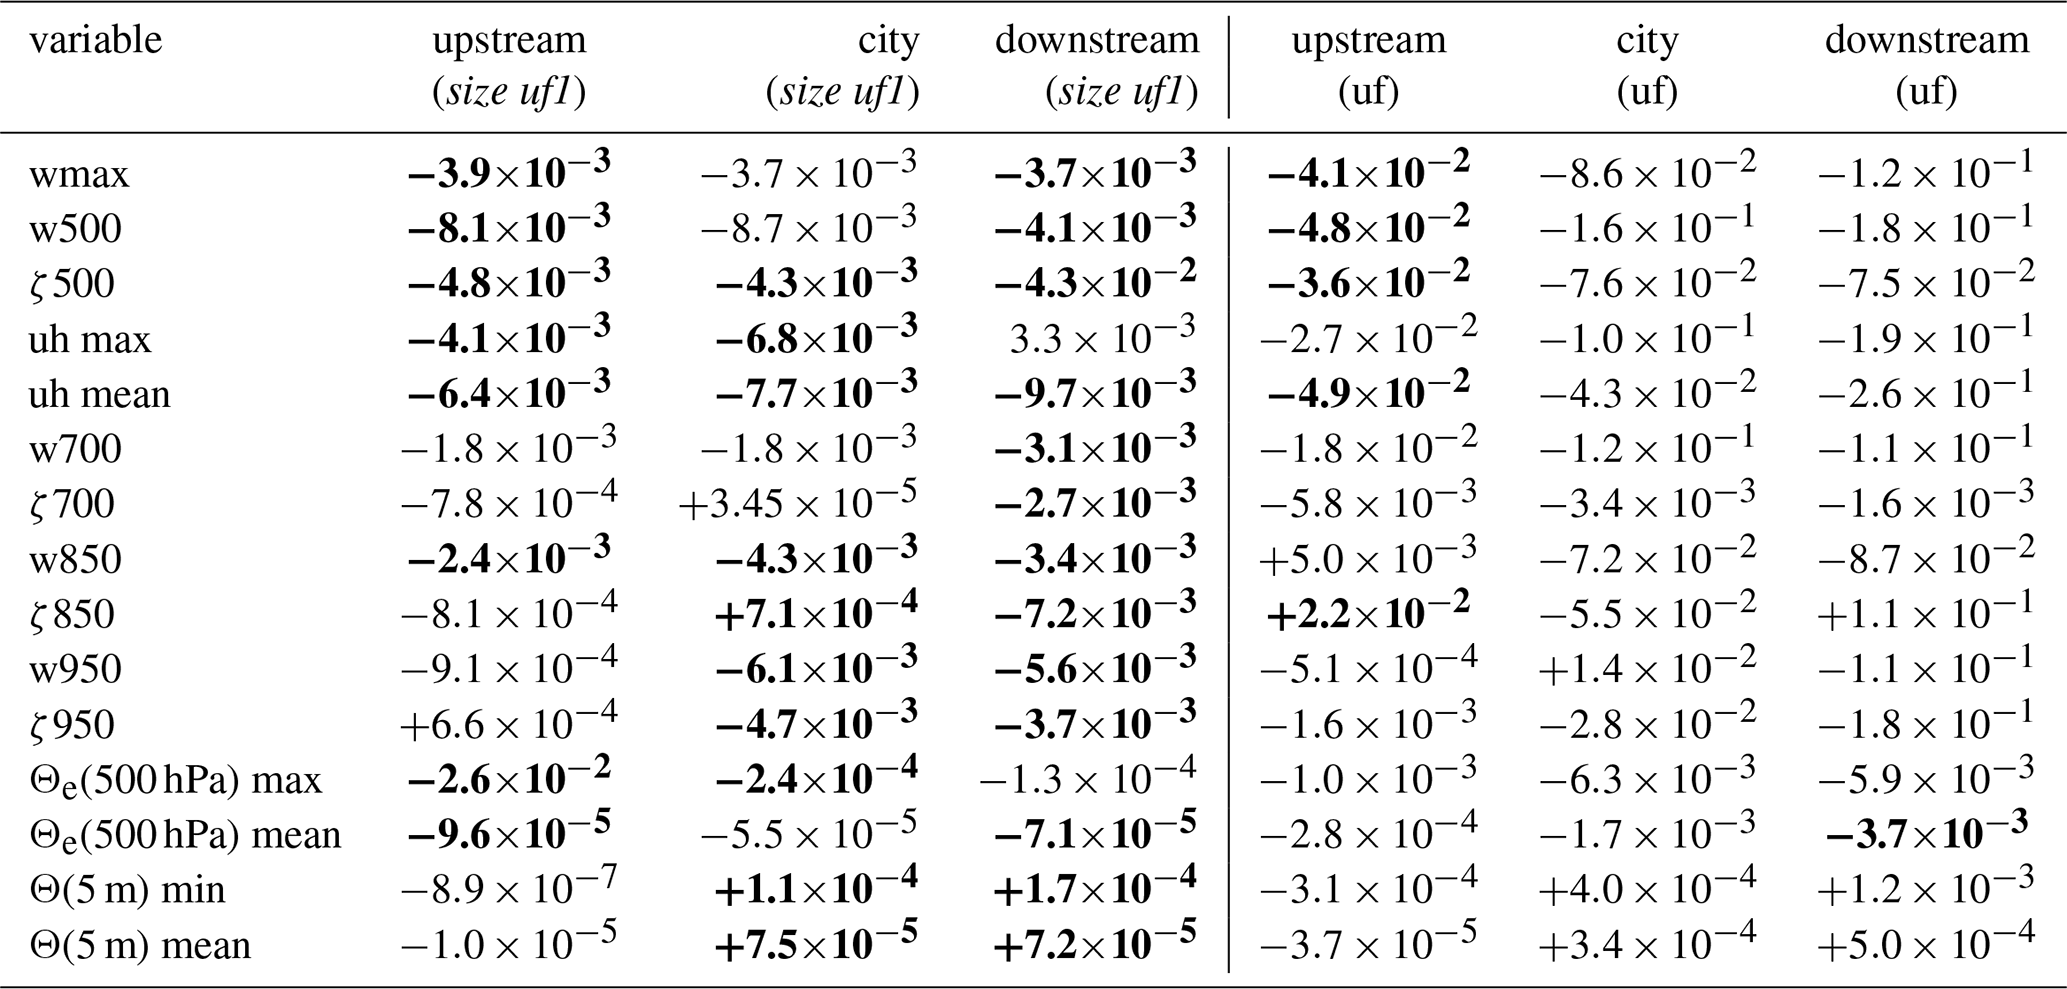
Table 9 presents the mean slopes for each storm diagnostic variable in the three regions. A general negative trend is observed, though it is statistically significant only for some of them3. The trend is particularly significant in the city region and for the vertical velocity and vorticity at 500 hPa, and for UH. This indicates that the supercell weakens as city diameter increases, with the weakening more pronounced and statistically significantly lower than zero at the mid-levels and when the storm is over the city. The increasing trend shown by some ensemble members in Figs. S3a and 5a suggests that, even if rare, an intensification of the supercell is possible in the upstream and city regions.
In the city size uf1 experiments, a similar trend of the city size sample is observed, but the weakening of the storm is even more pronounced (Fig. 5b). This weakening is particularly evident downstream of the city and, in this case, is statistically significantly lower than zero also for several low-level storm diagnostic variables (Table 10)4. In the city region, a quadratic fit is statistically significantly lower than zero (purple line in Fig. 5b). For city diameters up to about 10 km, the city has little effect on the storm. However, in larger cities, the storm weakens faster with city size than a linear fit would suggest.
Table 10Slope of fitting lines between diagnostic variables of the supercell and city size uf1 experiments (size uf1, left block, units m−1), or urban fraction (uf, right block). Bolded values are statistically significant lower (or larger) than zero.
The cumulative ensemble mean of UH clearly illustrates the effect of urban land use on the supercell. In the no_urban experiment, a substantial UH swath is present5 (Fig. 6a), which is considerably weakened as it passes over the city (Fig. 6b). The suppression becomes nearly complete in the uf1_30km experiment (Fig. 6c). Notably, the suppression is significantly more pronounced in the city size uf1 sample than in the city size sample (Fig. 6d).
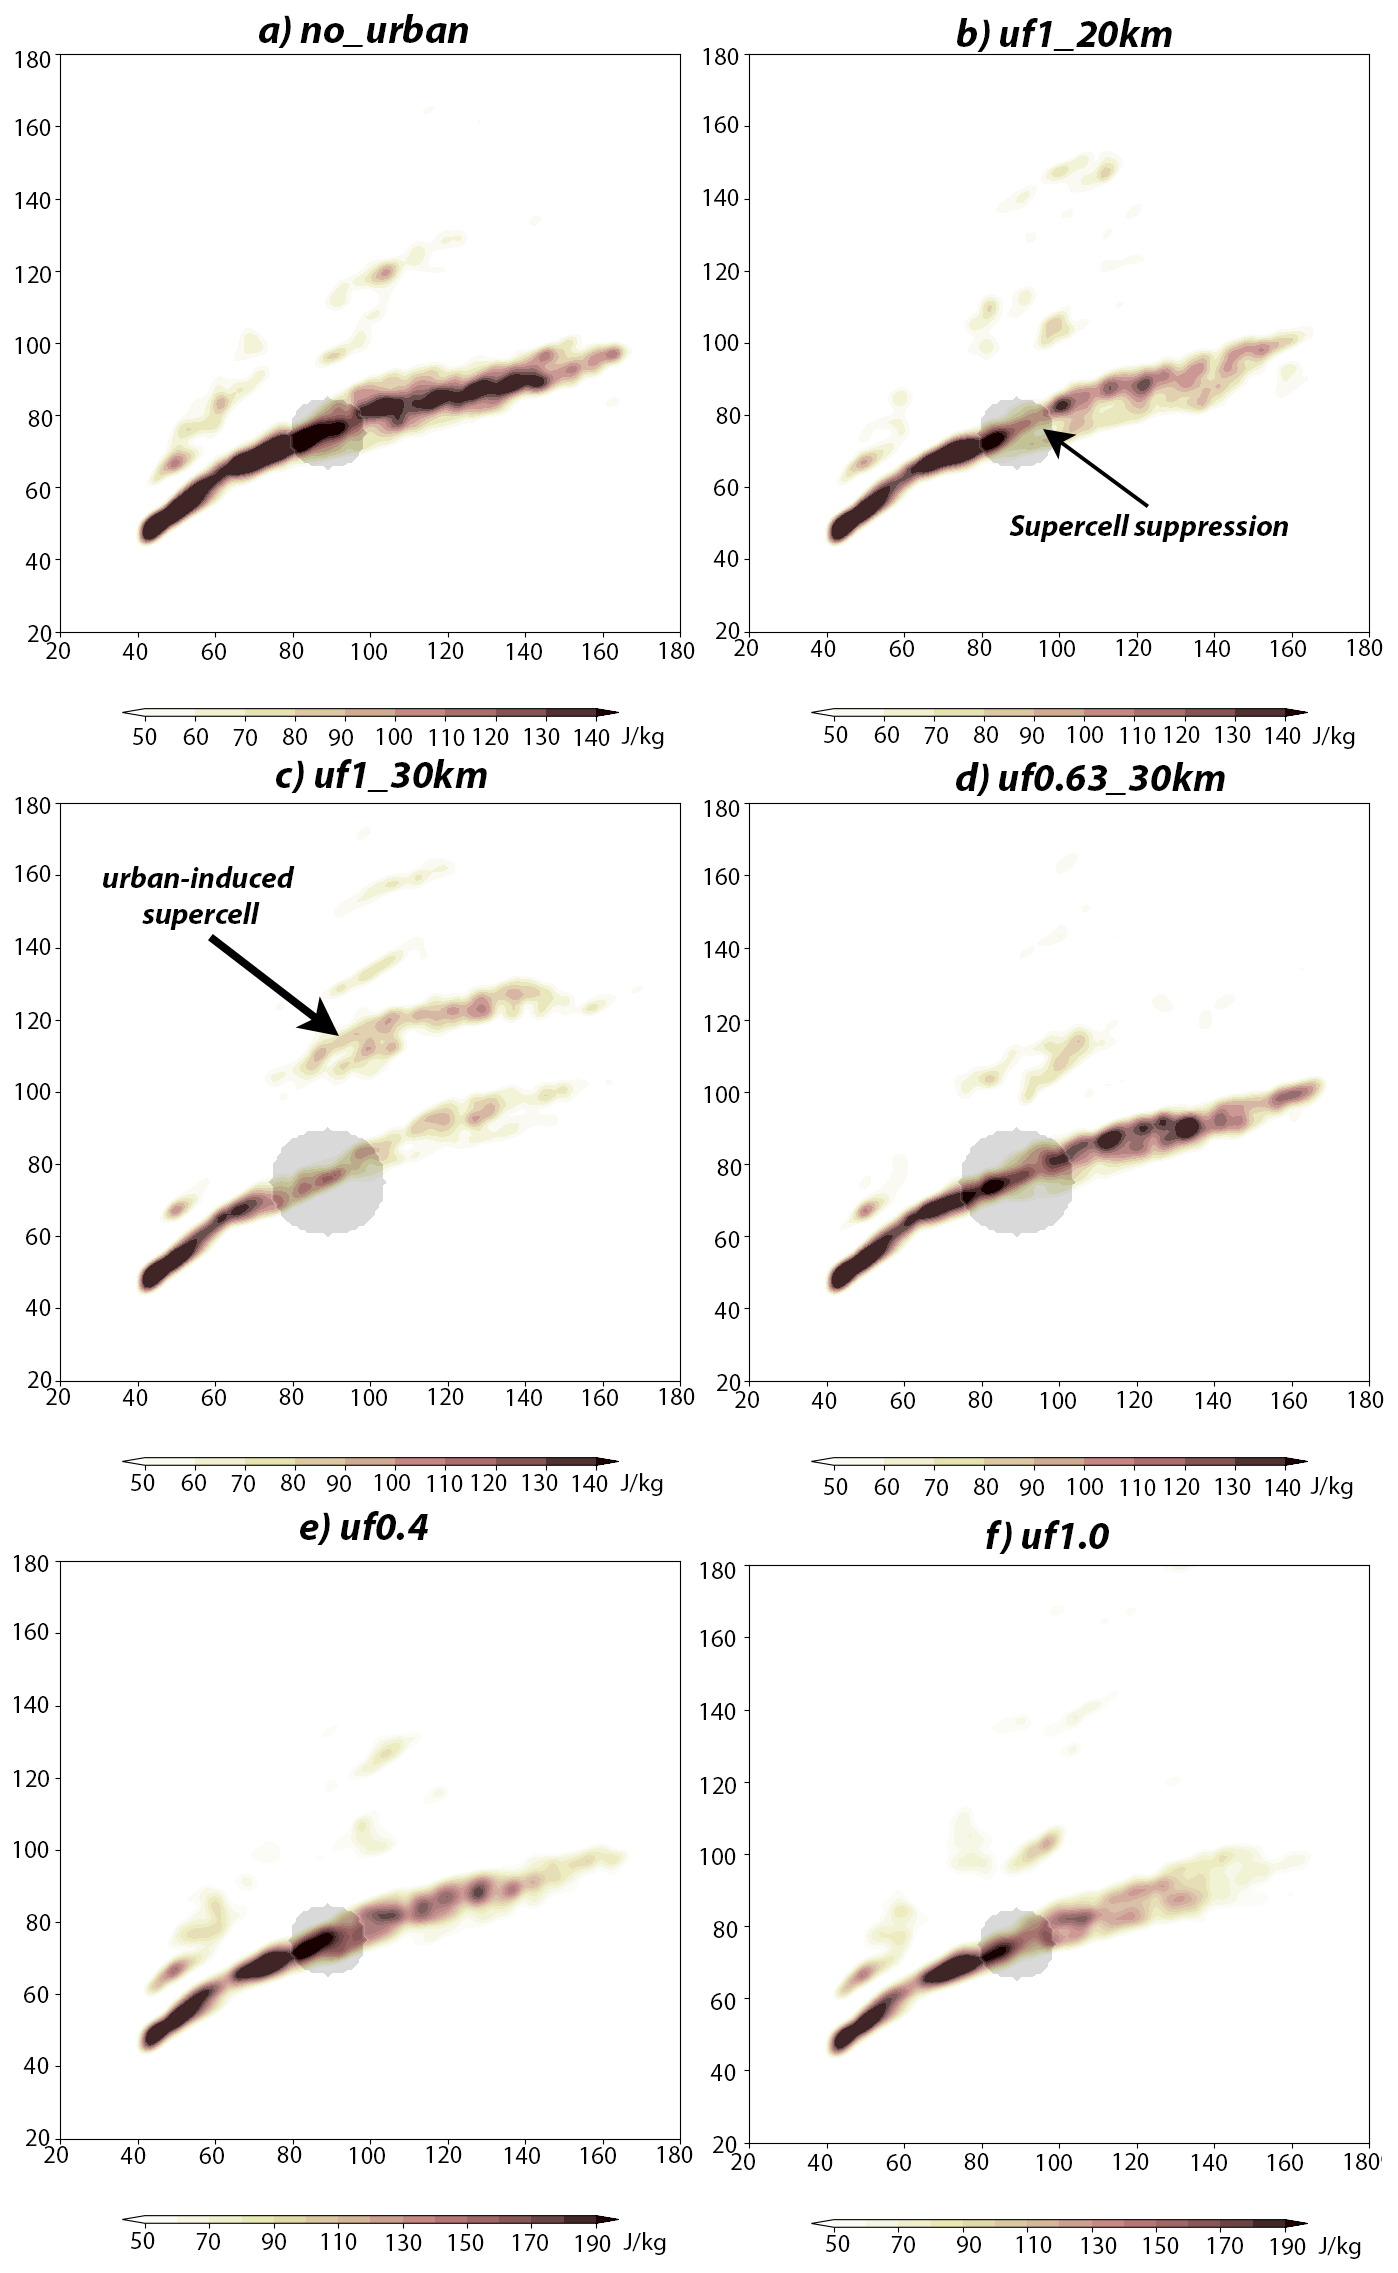
Figure 6Cumulated UH ensemble mean in (a) the no_urban experiment (Table 5), (b) in the uf1_20km experiment, (c) in the uf1_30km experiment, (d) in the uf0.63_30km experiment (Table 4), (e) in the uf0.4 experiment (Table 6), (f) in the uf1.0 experiment. The city is highlighted in grey shading. In panel (a) the city of the 20km experiment is shown just for reference, in the experiment there are croplands everywhere.
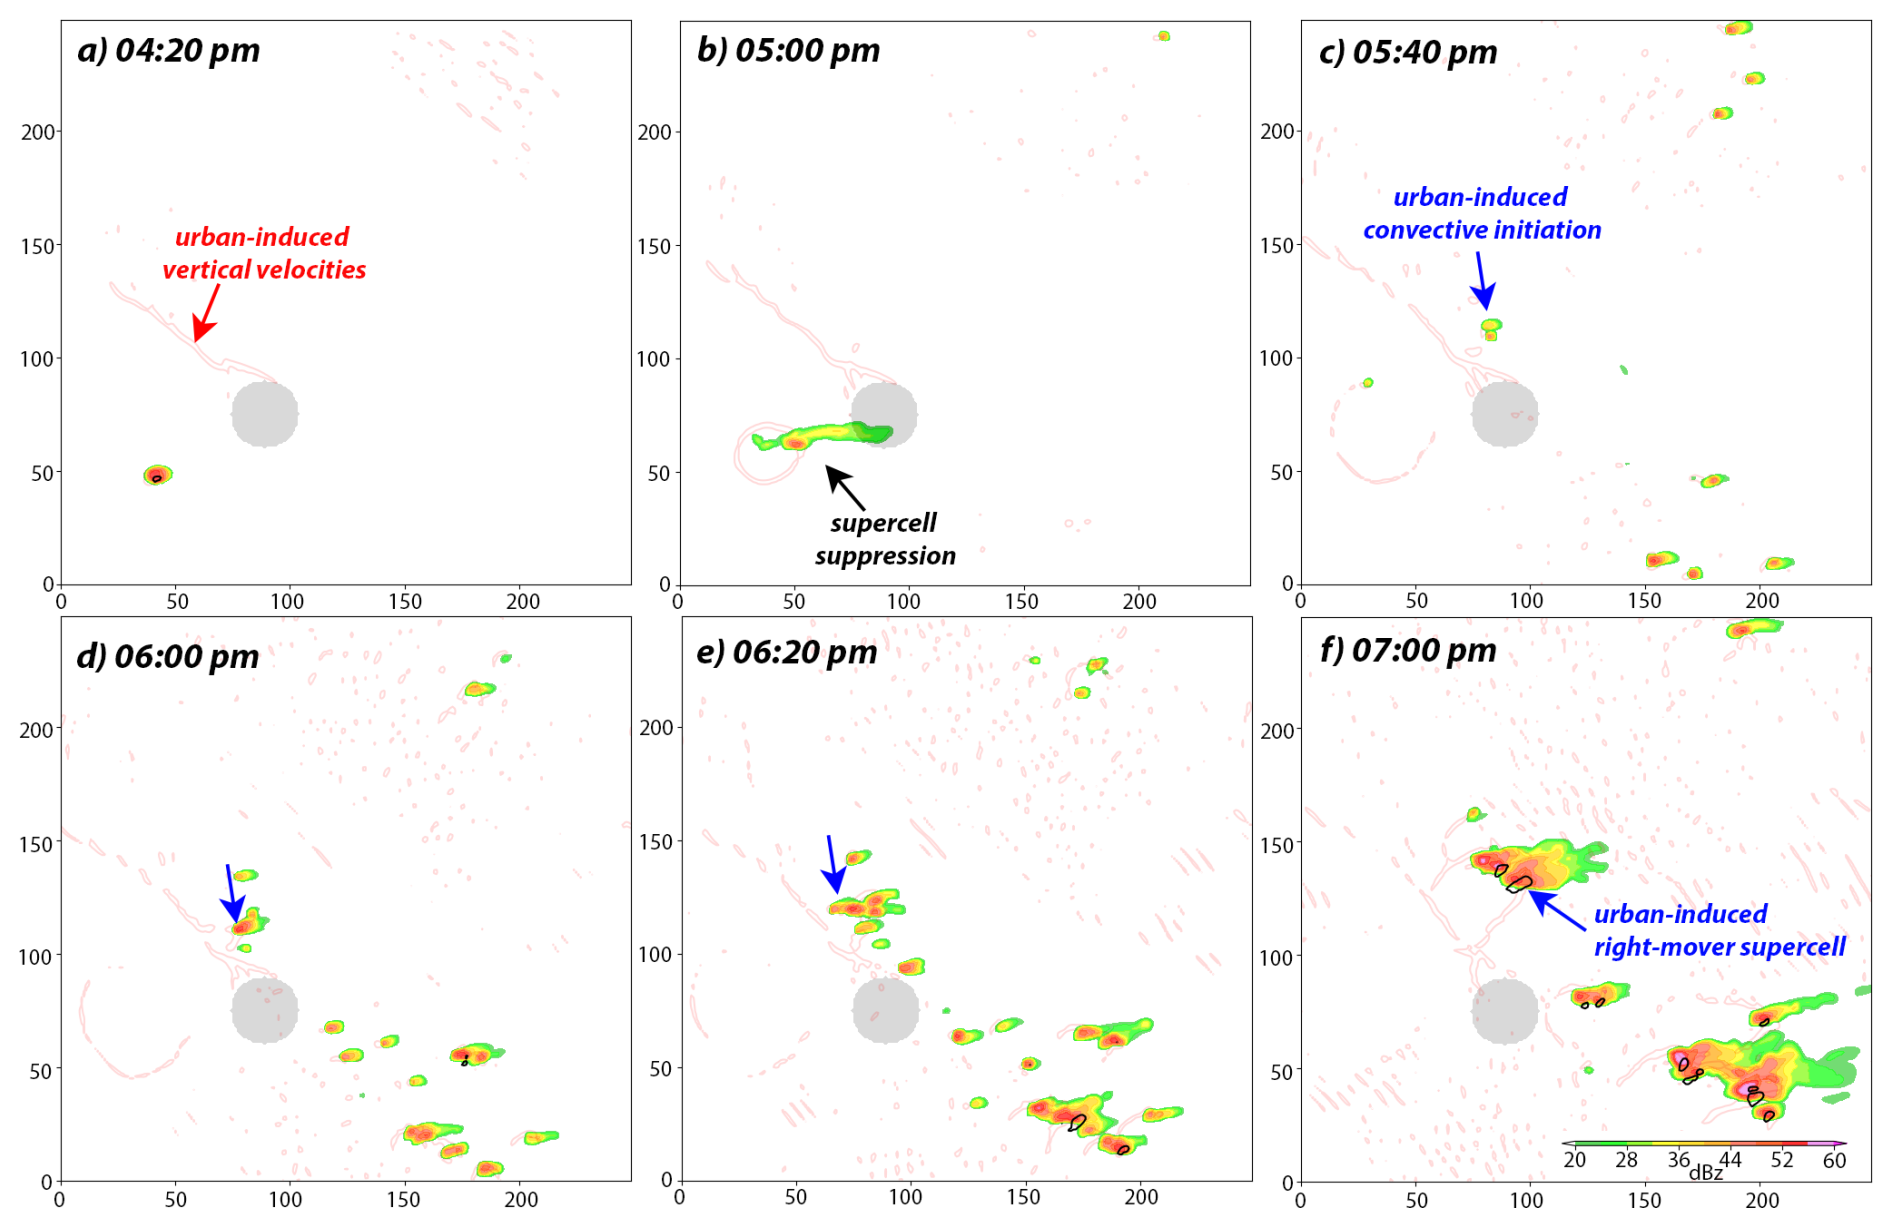
Figure 7As in Fig. 3, but for the ensemble member 1 of the uf1_30km numerical experiment. Vertical velocities at 950 hPa higher than 0.5 m s−1 are plotted with red contours. The blue arrows indicate the triggering of the urban-induced right-moving supercell.
A noteworthy feature in the uf1_30km experiment is the emergence of a new UH swath north of the city (Fig. 6c). To better understand this behavior, the same time steps showing maximum reflectivity from ensemble member 1 of the uf1_30km experiment (Fig. 7) are compared with those from the control run of the uf0.63_10km experiment (Fig. 3). In the uf1_30km experiment, the initial supercell is suppressed very early, already by 17:00 LT (Fig. 7b). However, a stripe of vertical velocities exceeding 0.5 m s−1 extends from the city toward the northwest. Just east of this stripe, new convective cells begin to develop between 17:40 (Fig. 7c) and 18:20 LT (Fig. 7e). By 19:00 LT, a new right-moving supercell forms from these earlier convective initiations (Fig. 7f). Thus, in this simulation, the original supercell is suppressed, while a new, urban-induced supercell develops. This behavior occurs in 8 out of 11 members of the uf1_30km experiment and is not observed in any of the other experiments (see Figs. 6 and 8). Additional evidence supporting the urban origin of the second supercell initiated at 19:00 LT will be presented in Sect. 4.
3.2 Urban fraction
In the urban fraction experiments, most storm diagnostic variables decrease as a function of the urban fraction (Table 10). However, only some of these trends are statistically significantly lower than zero in the upstream region. By contrast, no statistically significant trends are observed in the city and downstream region (except for Θe(500 hPa) in the downstream region). In the upstream region, the ensemble spread is relatively small (Fig. S5a), which leads to statistically significant trends – even though the slope of the mean linear fit is smaller than in the other two regions. Nevertheless, examining the ensemble mean of the UH swath in the uf0.4 and uf1.0 experiments (Fig. 6e, f) reveals a visible weakening of the storm. We conclude that the supercell weakens with increasing urban fraction, although this trend is not statistically significant lower than zero.
3.3 Building height
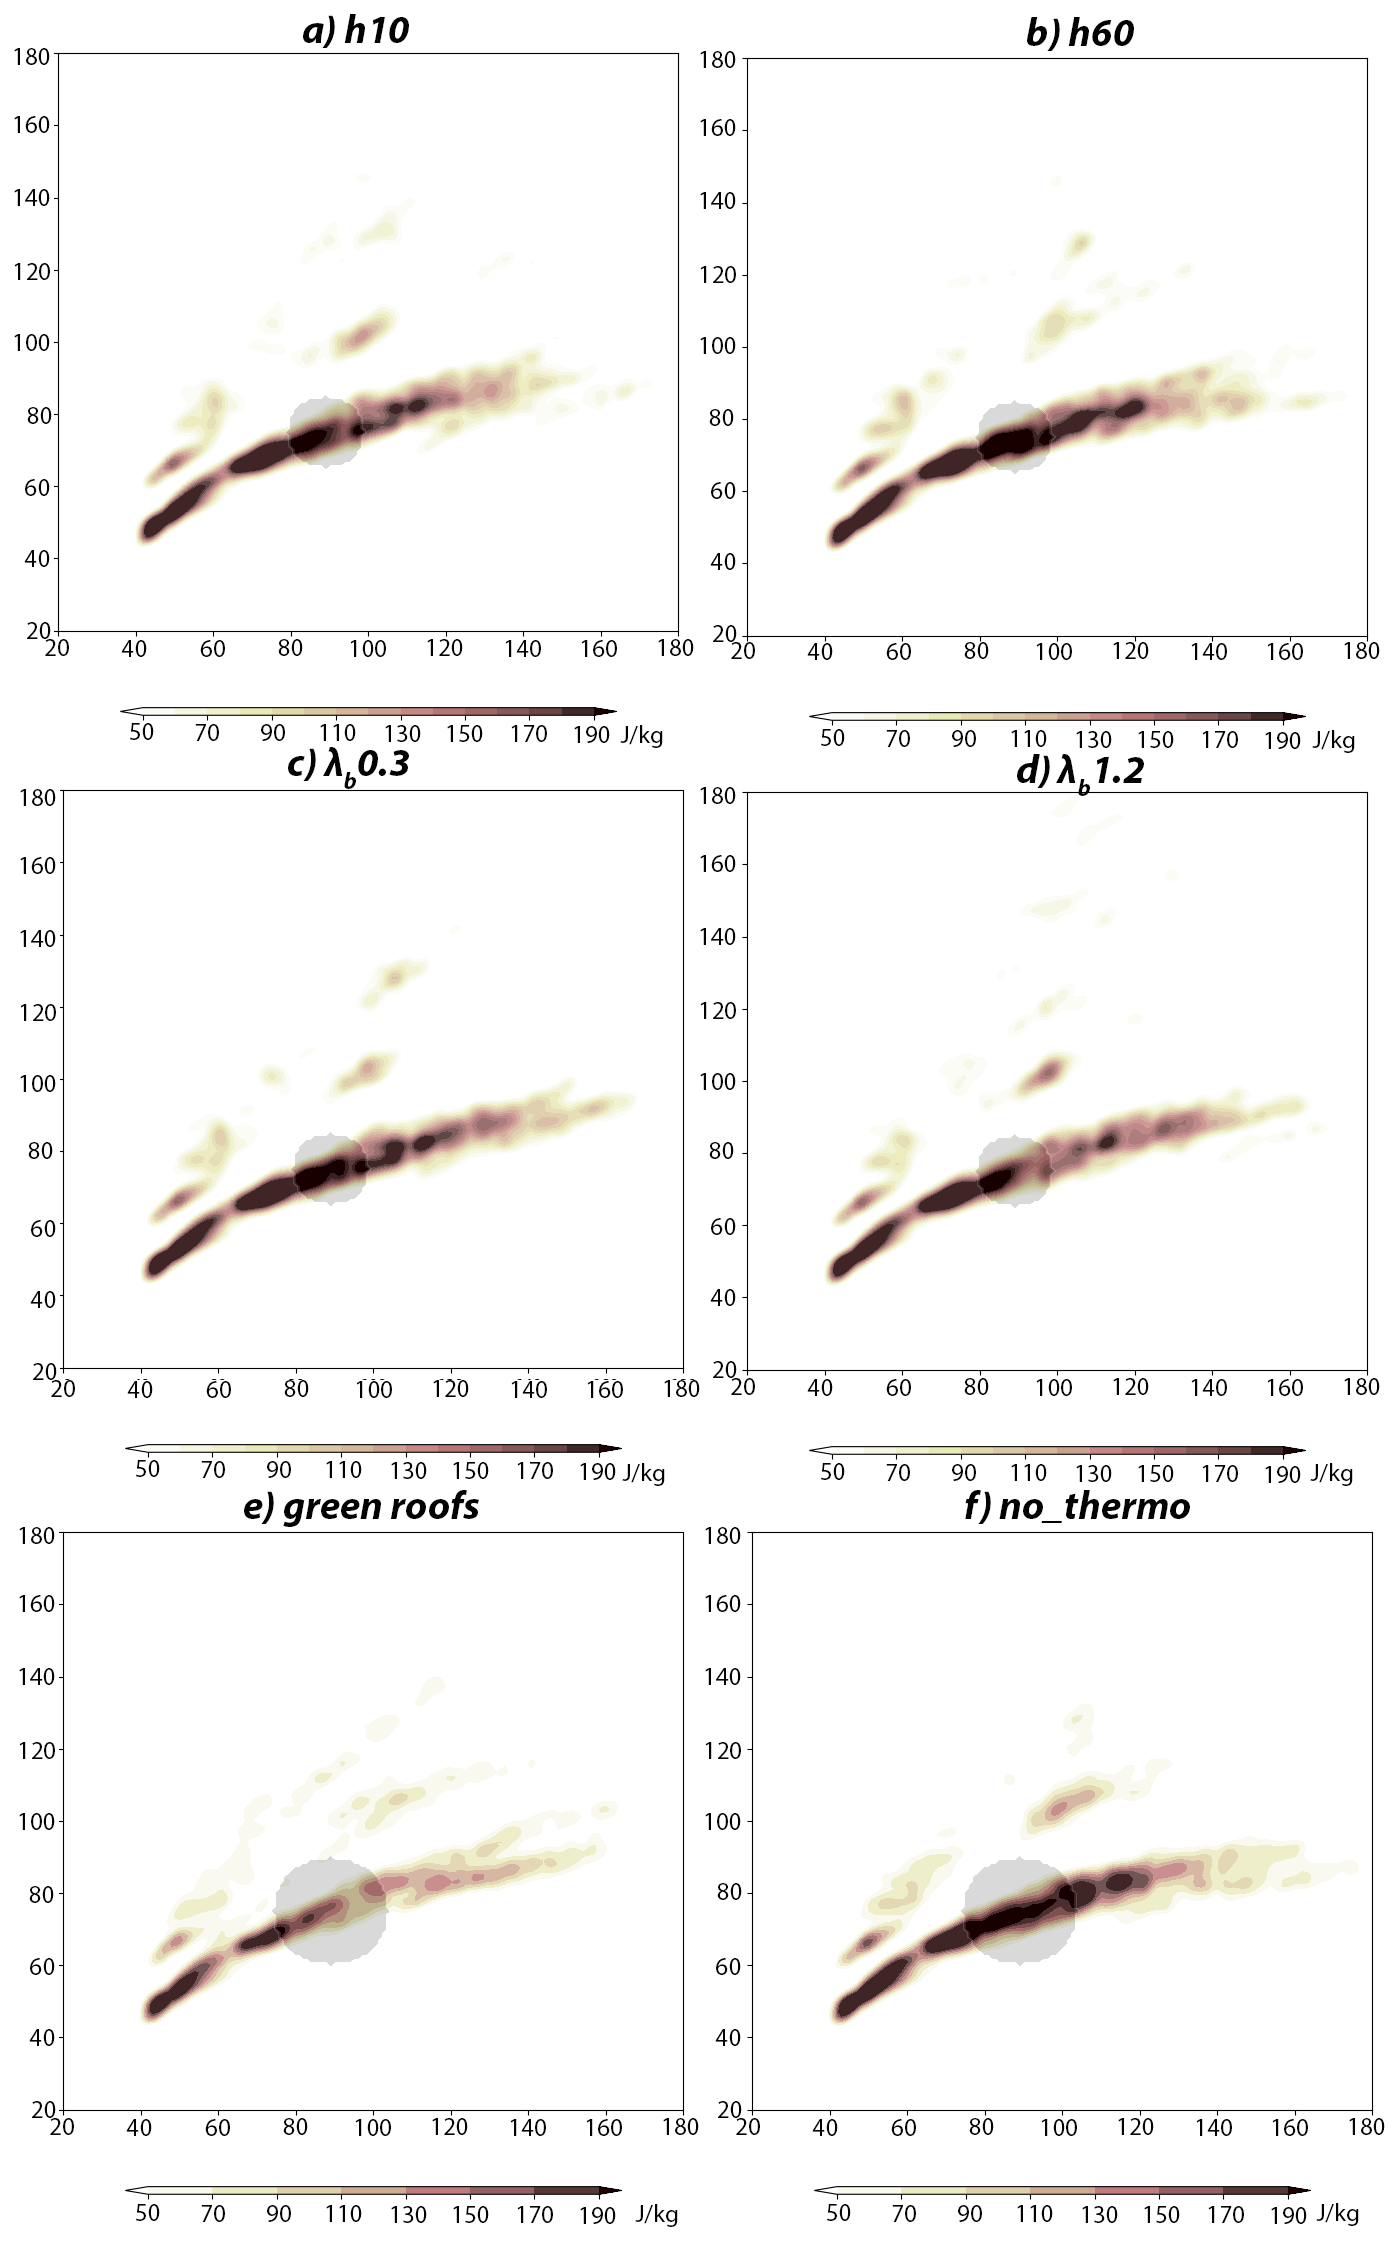
An opposite trend is observed in the supercell's sensitivity to building height. In all three regions, the mean UH increases with increasing building height (Figs. 5d and S6). The positive trend in mean UH is statistically significantly larger than zero across all three regions studied (Table 11). Other mid-level storm diagnostic variables exhibit a similar positive trend; however, these trends are statistically significantly larger than zero only in the upstream and city regions for some variables (e.g., w500 and w700). In agreement with this result, the ensemble mean of the UH swath in the h60 experiment (Fig. 8b) is higher than in the h10 experiment (Fig. 8a).
Table 11Slope of fitting lines between diagnostic variables of the supercell and building heights (hm, left block, units m−1), or building density (λb, right block). Bolded values are statistically significant lower (or larger) then zero.
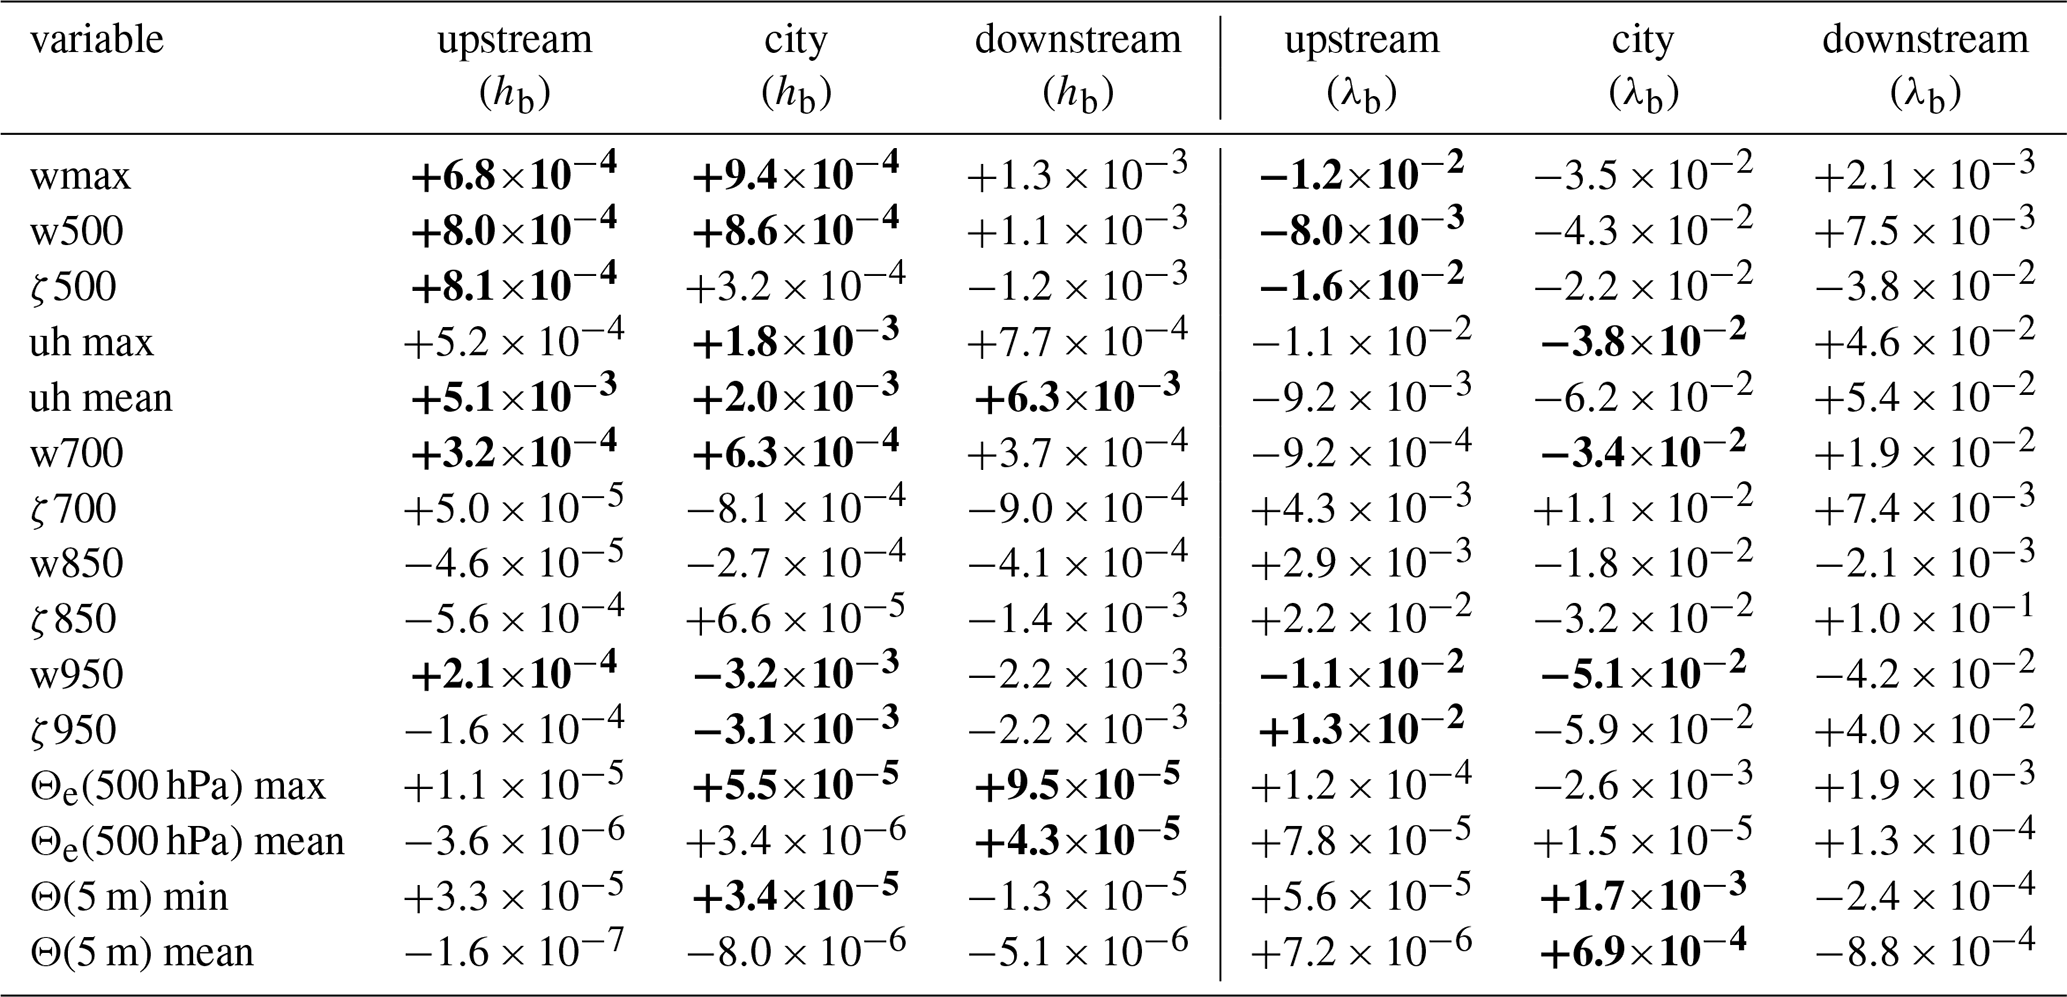
In contrast, low-level storm diagnostic variables show a decreasing trend with increasing building height (Table 11), and this trend is statistically significantly lower than zero for some variables (e.g., w950 in the city region). This result is surprising and interesting, as it contrasts with the storm behavior aloft and also with the hypothesis that taller buildings should enhance vertical motions due to the building-barrier effect and mass conservation (e.g., Dou et al., 2024).
3.4 Building density
Variables describing the storm's mid-level characteristics show a general weakening trend in the upstream and city regions with increasing building density (Table 11). However, this trend is statistically significantly smaller than zero only for some variables (e.g., w500 and ζ500, Table 11). The mean UH does not exhibit a clear trend with increasing building density (Fig. S7). Low-level storm diagnostic variables do not show a consistent trend. In general, in the downstream region, no clear trend is observed either aloft or near the surface, and none of the studied variables exhibit statistically significant trends.
The ensemble mean of the UH swath shows slightly lower values downstream of the city in the λb1.2 experiment (Fig. 8d) compared to the λb0.3 experiment (Fig. 8c). Overall, we conclude that the storm does exhibit some sensitivity to building density; however, this parameter appears to be the least influential in determining storm dynamics among the previously studied parameters.
3.5 Additional experiments
Comparing Fig. 6c with Fig. 8e, it is evident that the weakening of the storm as it passes over the city is much less pronounced when the roofs are covered with vegetation (green roof experiment). Furthermore, using the rural energetic balance in the no_thermo experiment (Fig. 8f) results in a UH swath that is very similar to that of the no_urban experiment (Fig. 6a). Thus, the greater the amount of vegetation in a city, the less effect the city has on the approaching storm.
To understand the urban effects on the simulated storm, we examine how urban morphological parameters influence near-surface variables, CAPE, SRH, and w950 at 16:00 LT (the time of convective initiation). This analysis compares ensemble-mean differences between simulations using the highest values of the morphological parameters (“max value” column in Table 3) and those using the lowest values (“zero value” column in Table 3).
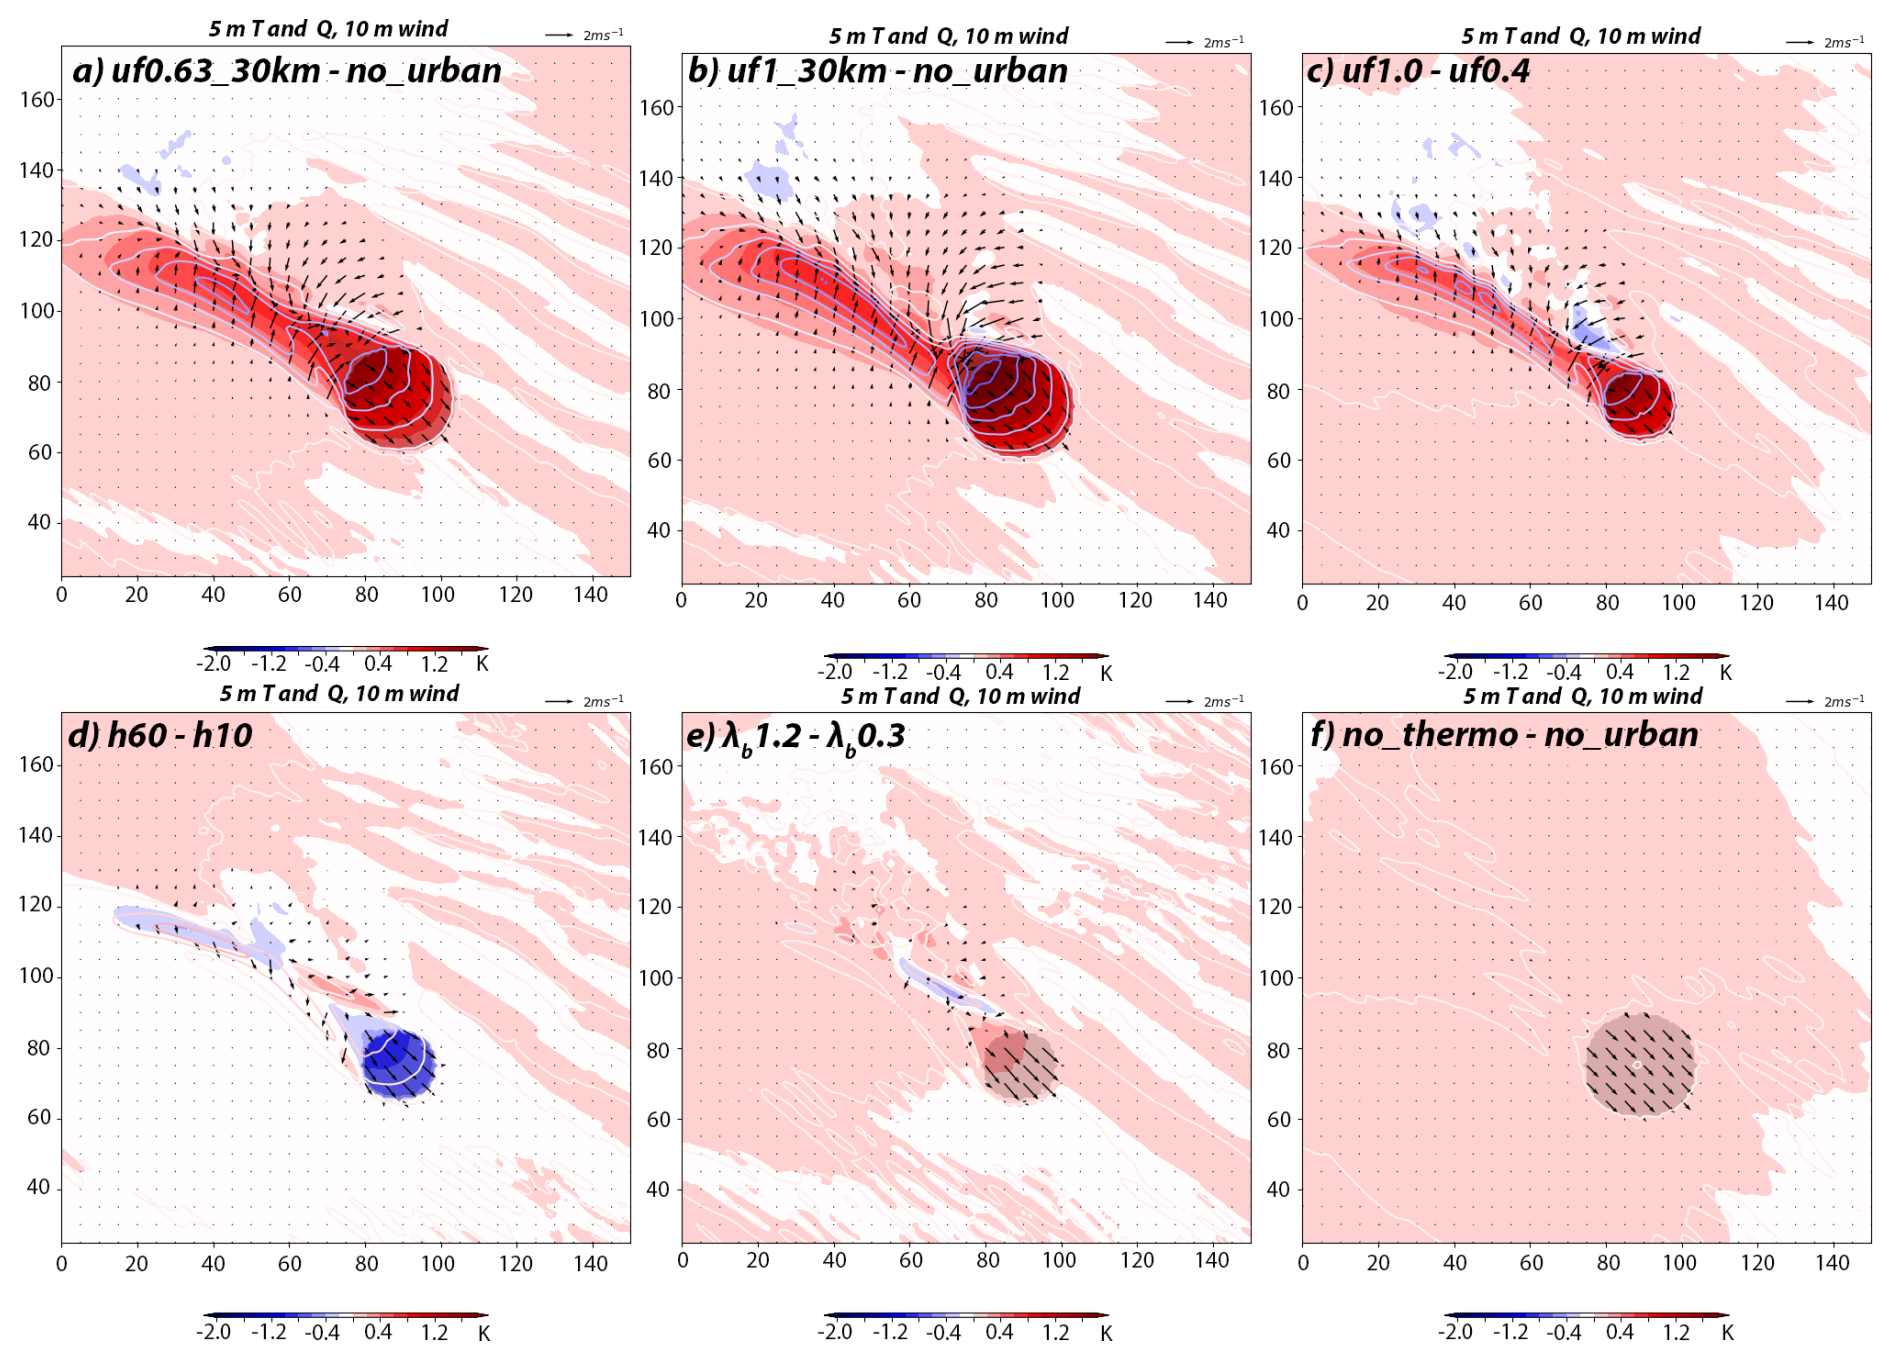
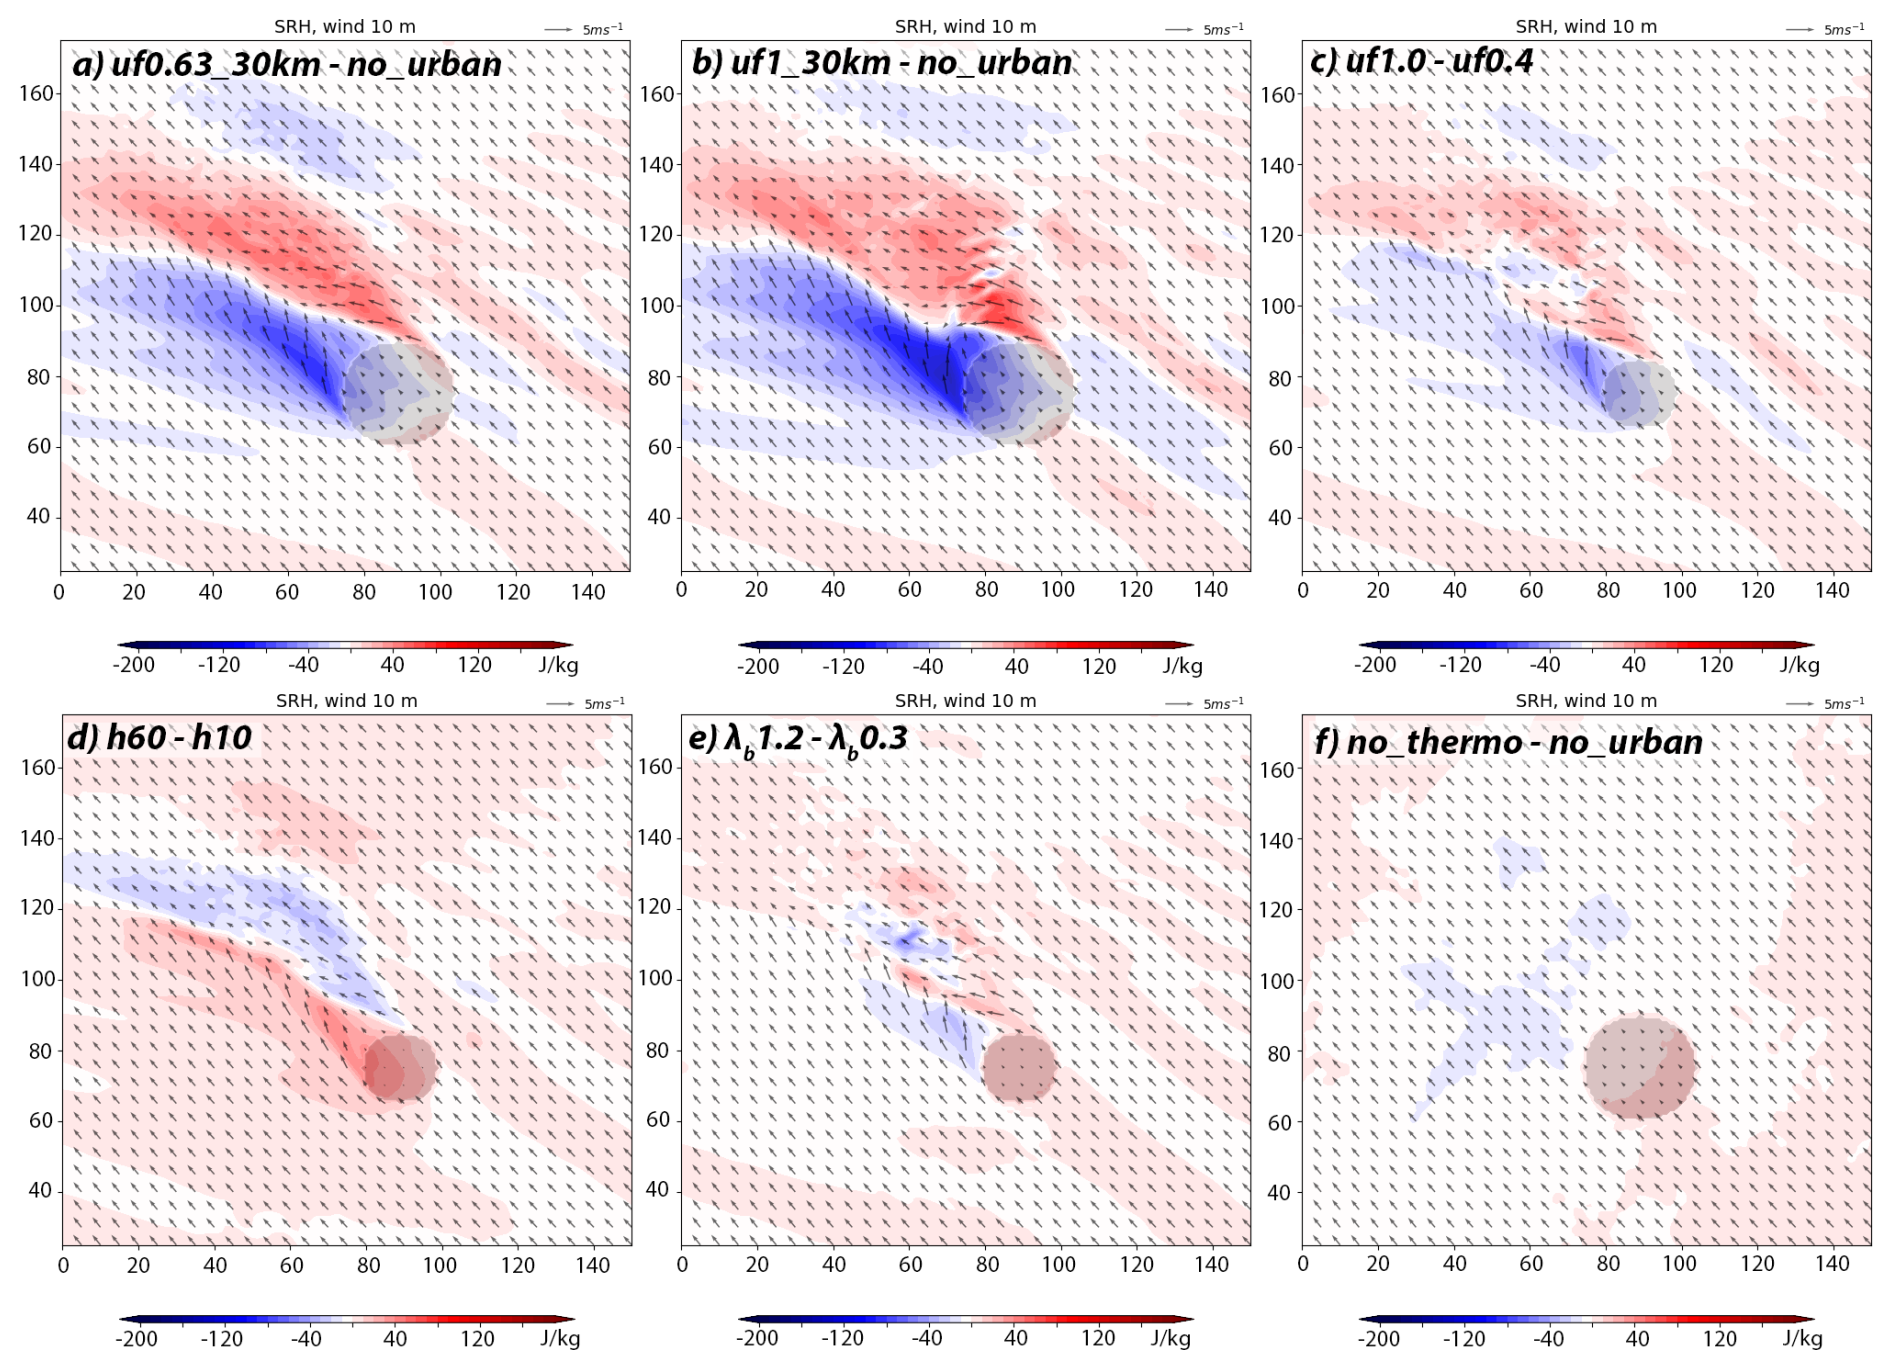
Figure 9Ensemble mean of temperature (color shading) and specific humidity (contours every 0.5 g kg−1, blue negative, red positive) in the first model level (about 5 m a.g.l.), and 10 m wind difference (vectors) at 16:00 LT between (a) uf0.63_30km and no_urban experiments; (b) uf1_30km and no_urban experiments; (c) uf1.0 and uf0.4 experiments; (d) h60 and h10 experiments; (e) λb1.2 andλb0.3 experiments; (f) no_thermo and no_urban experiments. The city is shown with grey shading.
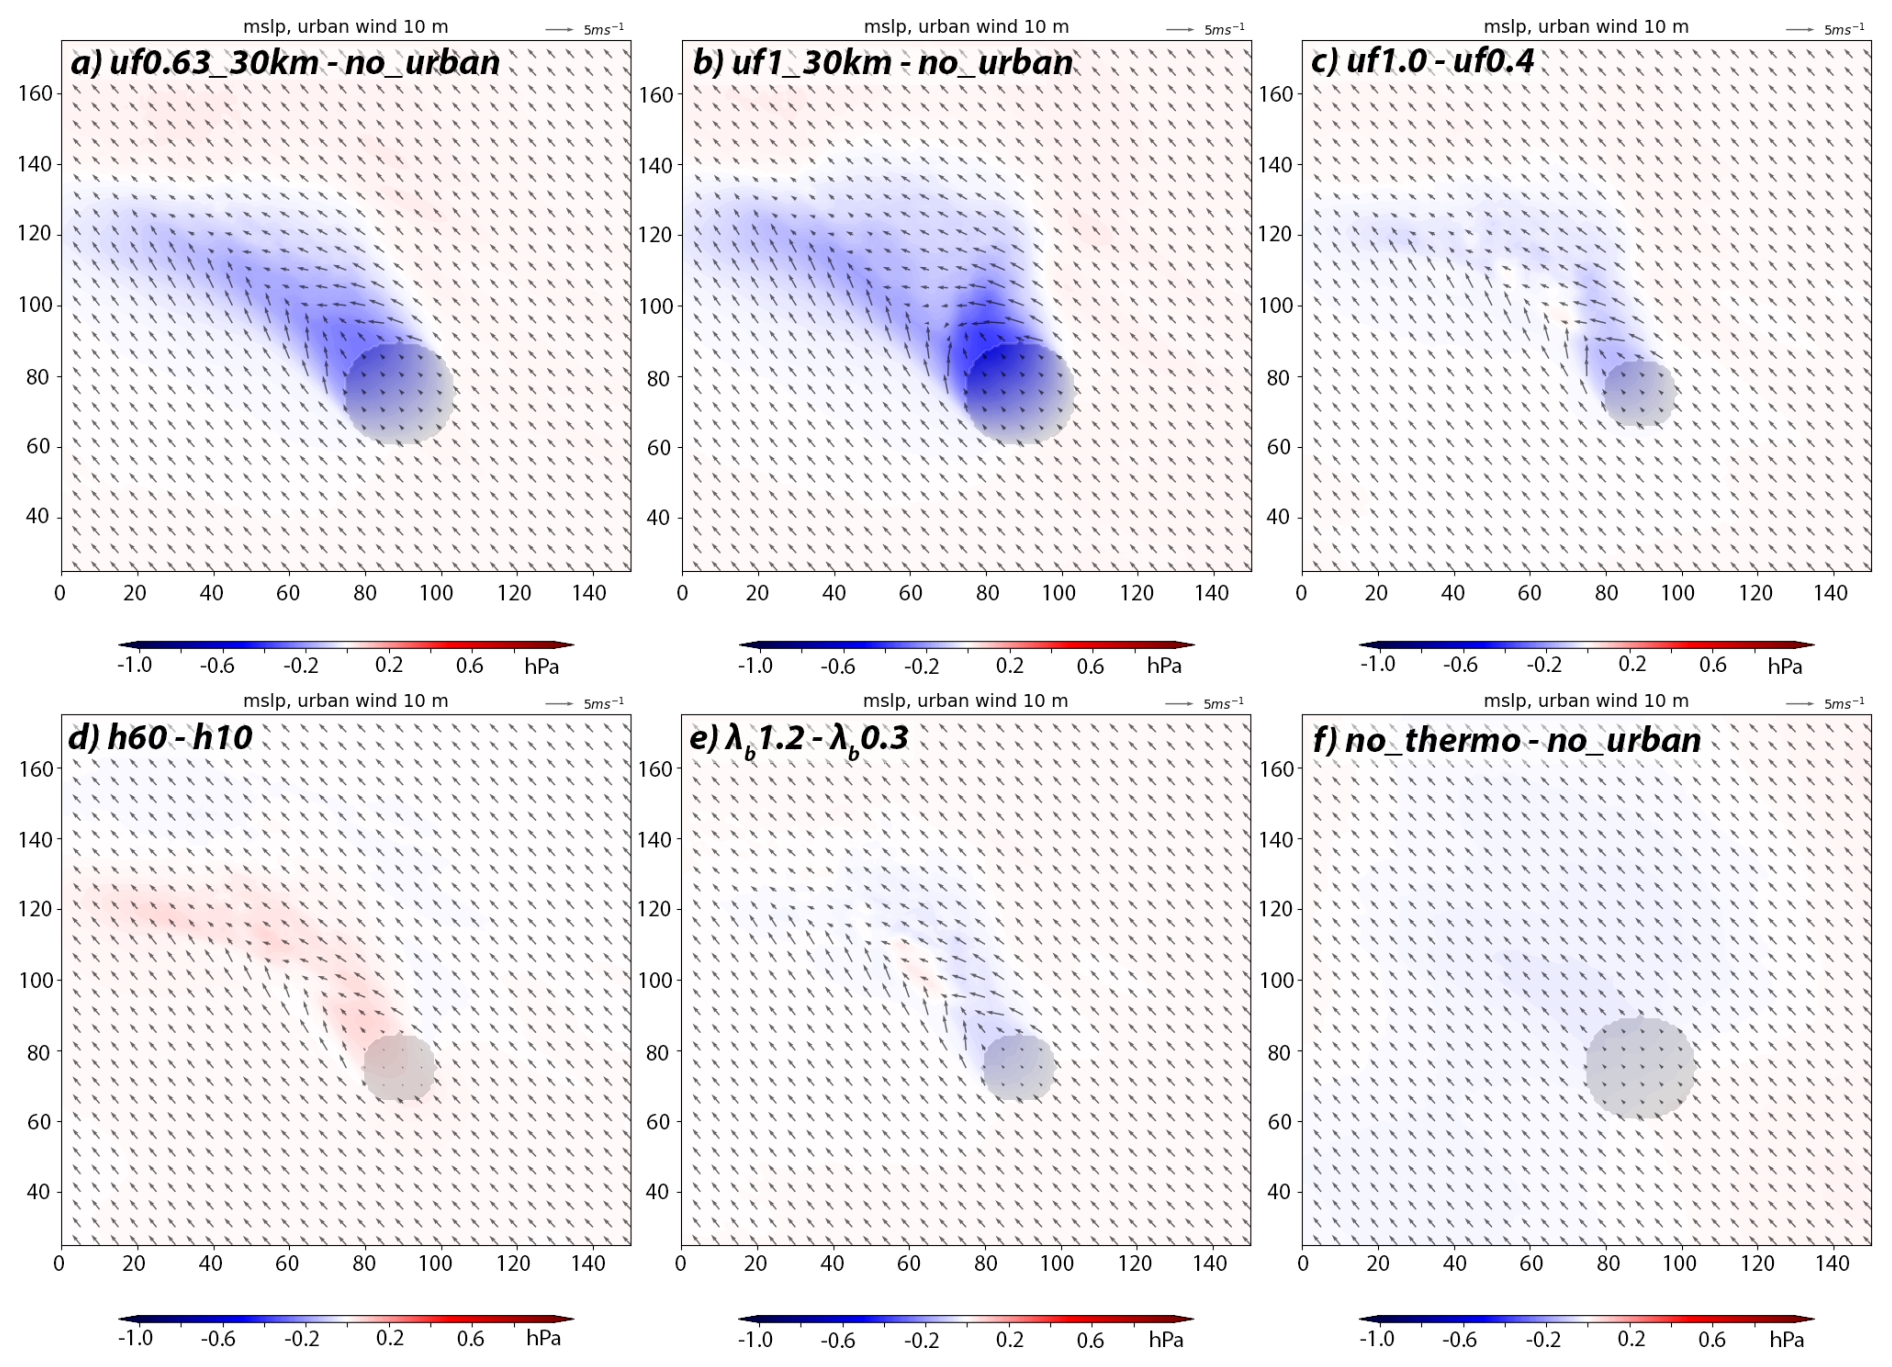
Figure 10Ensemble mean of mean sea level pressure difference at 16:00 LT between (a) uf0.63_30km and no_urban experiments; (b) uf1_30km and no_urban experiments; (c) uf1.0 and uf0.4 experiments; (d) h60 and h10 experiments; (e) λb1.2 andλb0.3 experiments; (f) no_thermo and no_urban experiments. The 10 m wind of the minuend simulation of the subtraction is shown with vectors. The city is shown with grey shading.
4.1 Near-surface variables
The uf0.63_30km simulations produce a weak UHI of about 1.5 K over the city (Fig. 9a), in good agreement with typical daytime UHI magnitudes (e.g., Zonato et al., 2021; Sabatino et al., 2020; Basara et al., 2008). A pronounced UDI is also reproduced (peak of −2 g kg−1), corresponding to a relative humidity difference of about 13 % between the city and the surrounding rural areas, consistent with several other studies (Meili et al., 2022; Luan et al., 2022; Luo et al., 2021a; Lokoshchenko, 2017). A wake of higher temperatures and lower humidity extends downwind (with respect to the southeasterly surface wind) up to 80 km from the city. Within this wake, a wind convergence is induced by the urban land use, while winds over the city are significantly reduced by increased drag. In the uf1_30km simulations, the UHI and UDI are slightly stronger, but the spatial pattern is similar (Fig. 9b).
The impact of urban fraction on UHI and UDI is much smaller than that of city size, about 0.5 K and −1.0 g kg−1, respectively (Fig. 9c). The downwind wind convergence is also weaker. A more compact city does not significantly alter the UHI or UDI but does reduce surface winds over the city (Fig. 9e).
An interesting result is that taller buildings reduce the UHI by about 1 K and increase moisture by 0.5 g kg−1 (Fig. 9d). Wind speeds are weaker in simulations with taller buildings, as well as the wind convergence downwind of the city. The reduction in temperature and increase in moisture in the urban canopy are likely due to reduced ventilation and consequent moisture stagnation (Wang et al., 2021). Our simulations begin with high moisture in the PBL, which decreases during the day due to mixing. In deeper urban canopies, drying is slower due to building shade, resulting in lower temperatures and higher moisture (Huang and Song, 2023).
Finally, in the no_thermo experiment, the UHI and UDI are eliminated, as expected, while maintaining the wind reduction over the city (Fig. 9f). This experiment can be interpreted as preserving the city's dynamic perturbation on the atmosphere (the building-barrier effect) while suppressing its thermodynamic effect (the UHI and UDI). Overall, city size is the factor with the most decisive influence on the UHI, consistent with previous studies (Zhou et al., 2017).
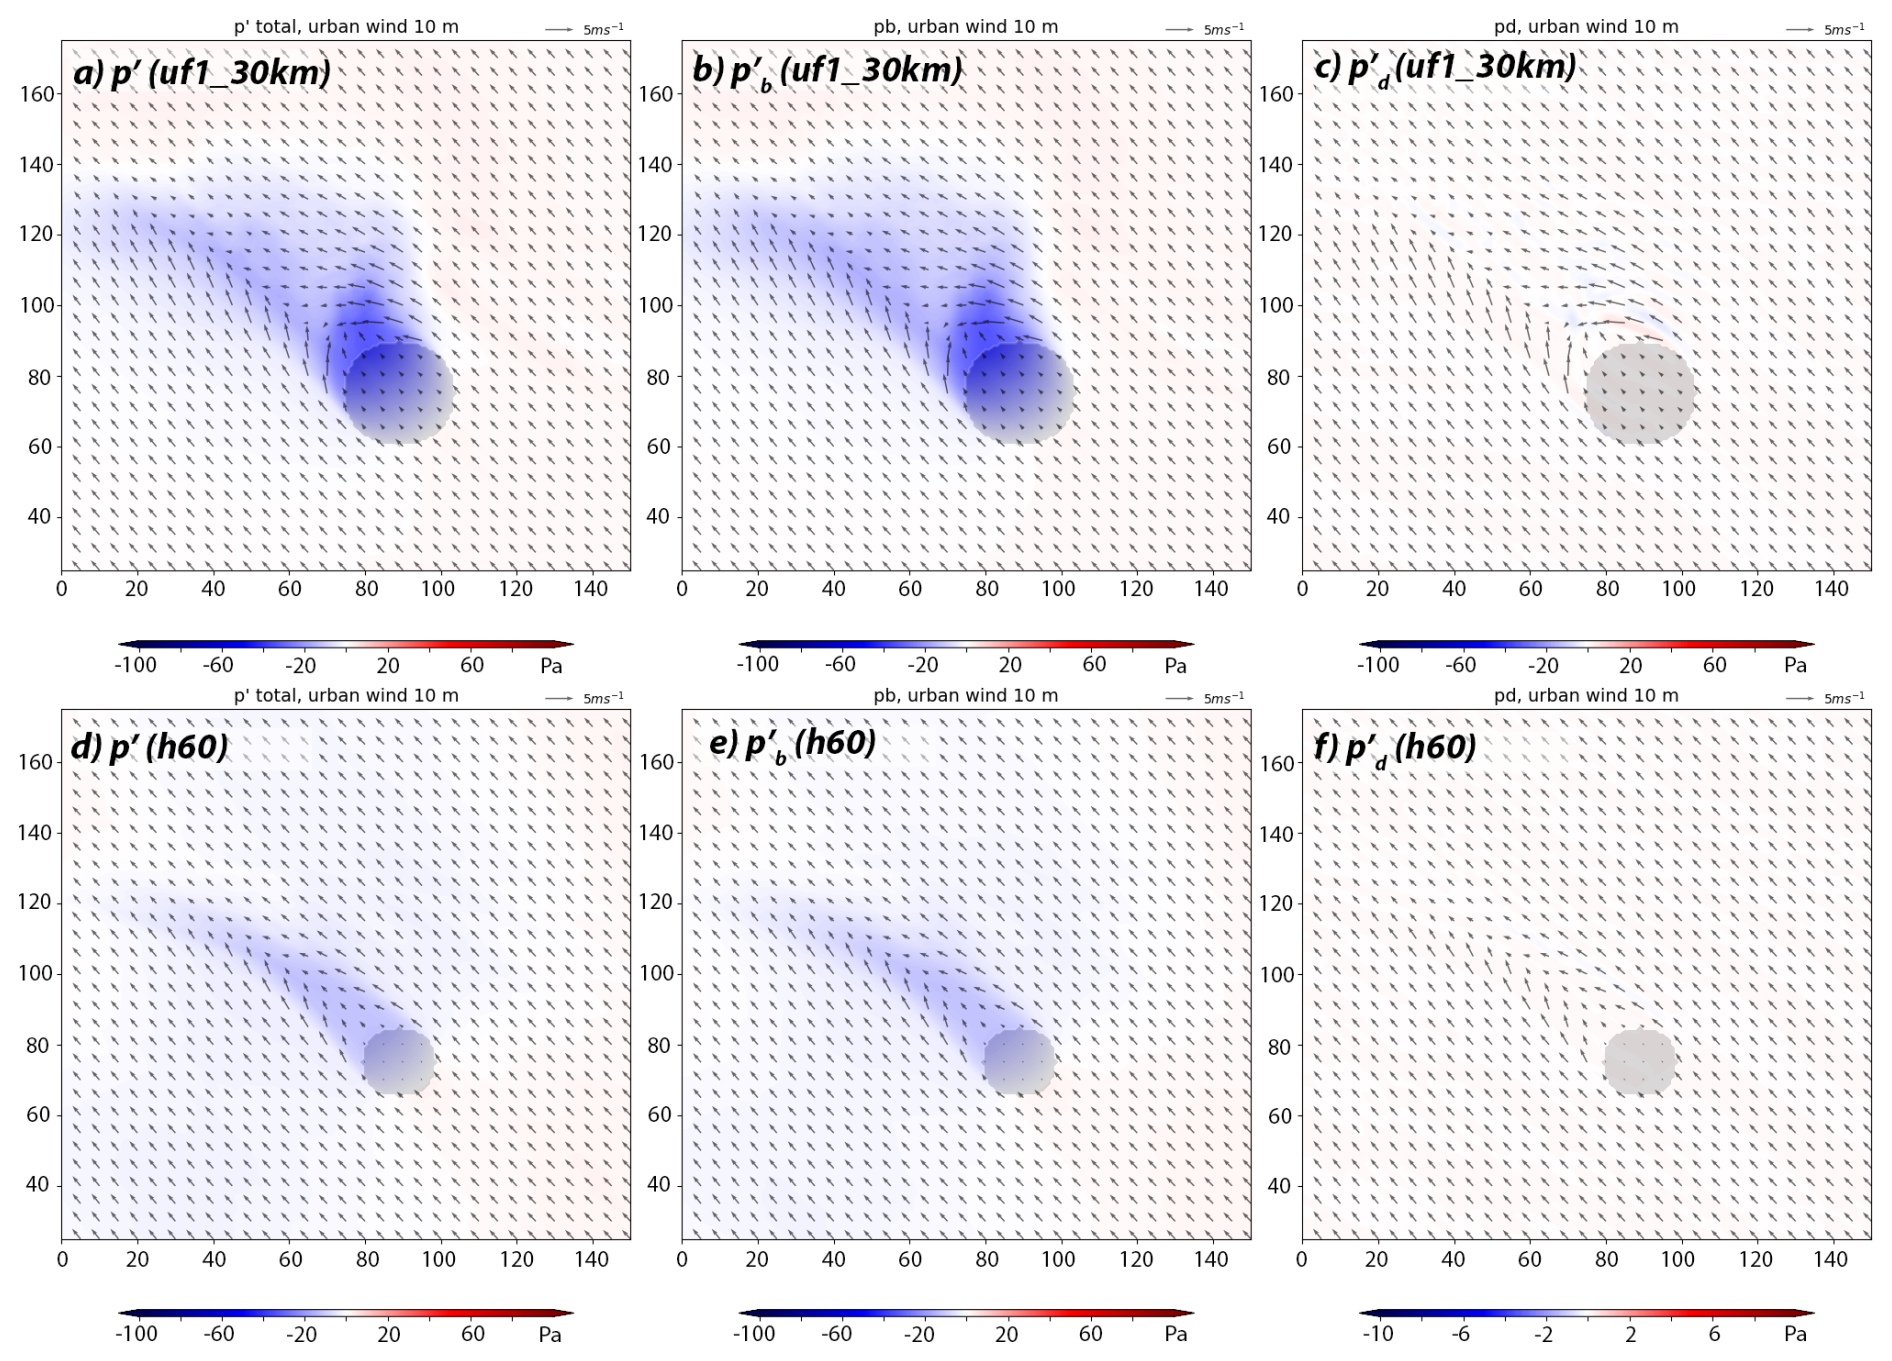
Figure 11Ensemble mean of (a) total pressure perturbations p′ at 300 m a.g.l. in the uf1_30km experiment at 16:00 LT; panel (b) as panel (a) but for buoyancy pressure perturbations ; panel (c) as panel (b) but for dynamic pressure perturbations ; panels (d), (e) and (f) as panel (a), (b) and (c), respectively, but for the h60 experiment.
To understand the urban-induced flow perturbations, the sea level pressure field is investigated. A weak minimum (about −0.5 hPa) is generated downwind of the city (with respect to the surface winds) by the urban land use (Fig. 10a). The downwind pressure minimum coincides with the wind convergence. With a higher urban fraction, the pressure minimum is stronger (about −1.0 hPa; Fig. 10b), as also suggested by the comparison between the uf1.0 and uf0.4 experiments (Fig. 10c). On the other hand, with taller buildings, the pressure minimum is slightly weaker (about 0.2 hPa; Fig. 10d), while a more compact city plays only a marginal role in intensifying it (Fig. 10e). Lastly, in the no_thermo experiment, the pressure minimum is absent (Fig. 10f).
A relationship between the UHI and the mean sea-level pressure is evident: in simulations with a stronger UHI (e.g., uf1_30km experiment), the pressure minimum is also stronger, whereas when the UHI is weaker (h60 experiment) or absent (no_thermo experiment), the pressure minimum is weaker or absent. Thus, it appears that the pressure minimum is thermodynamically induced by the UHI (i.e., it is a consequence of the buoyancy and not of the dynamical modification of the flow by the buildings). To further support this hypothesis, an additional analysis is carried out. The dynamic and buoyancy pressure perturbations are computed for the ensemble mean of the uf1_30km simulations. The elliptic partial differential equations that define and are solved using a Gauss–Seidel iterative method. The reference p0 value is taken from the ensemble mean of the no_urban experiment. Figure 11 shows the results at the 10th vertical level (about 300 m a.g.l.). Buoyancy pressure perturbations clearly dominate the generation of the downstream pressure minimum, consistent with the previously noted sensitivity between the pressure minimum and the intensity of the UHI. The contribution of the dynamic pressure perturbations is negligible. This outcome is also valid for the h60 experiment (Fig. 11d, e, f): tall buildings have a marginal effect on the generation of the downwind pressure minimum with respect to the thermodynamic modification of the PBL induced by urban land use.
4.2 SB CAPE
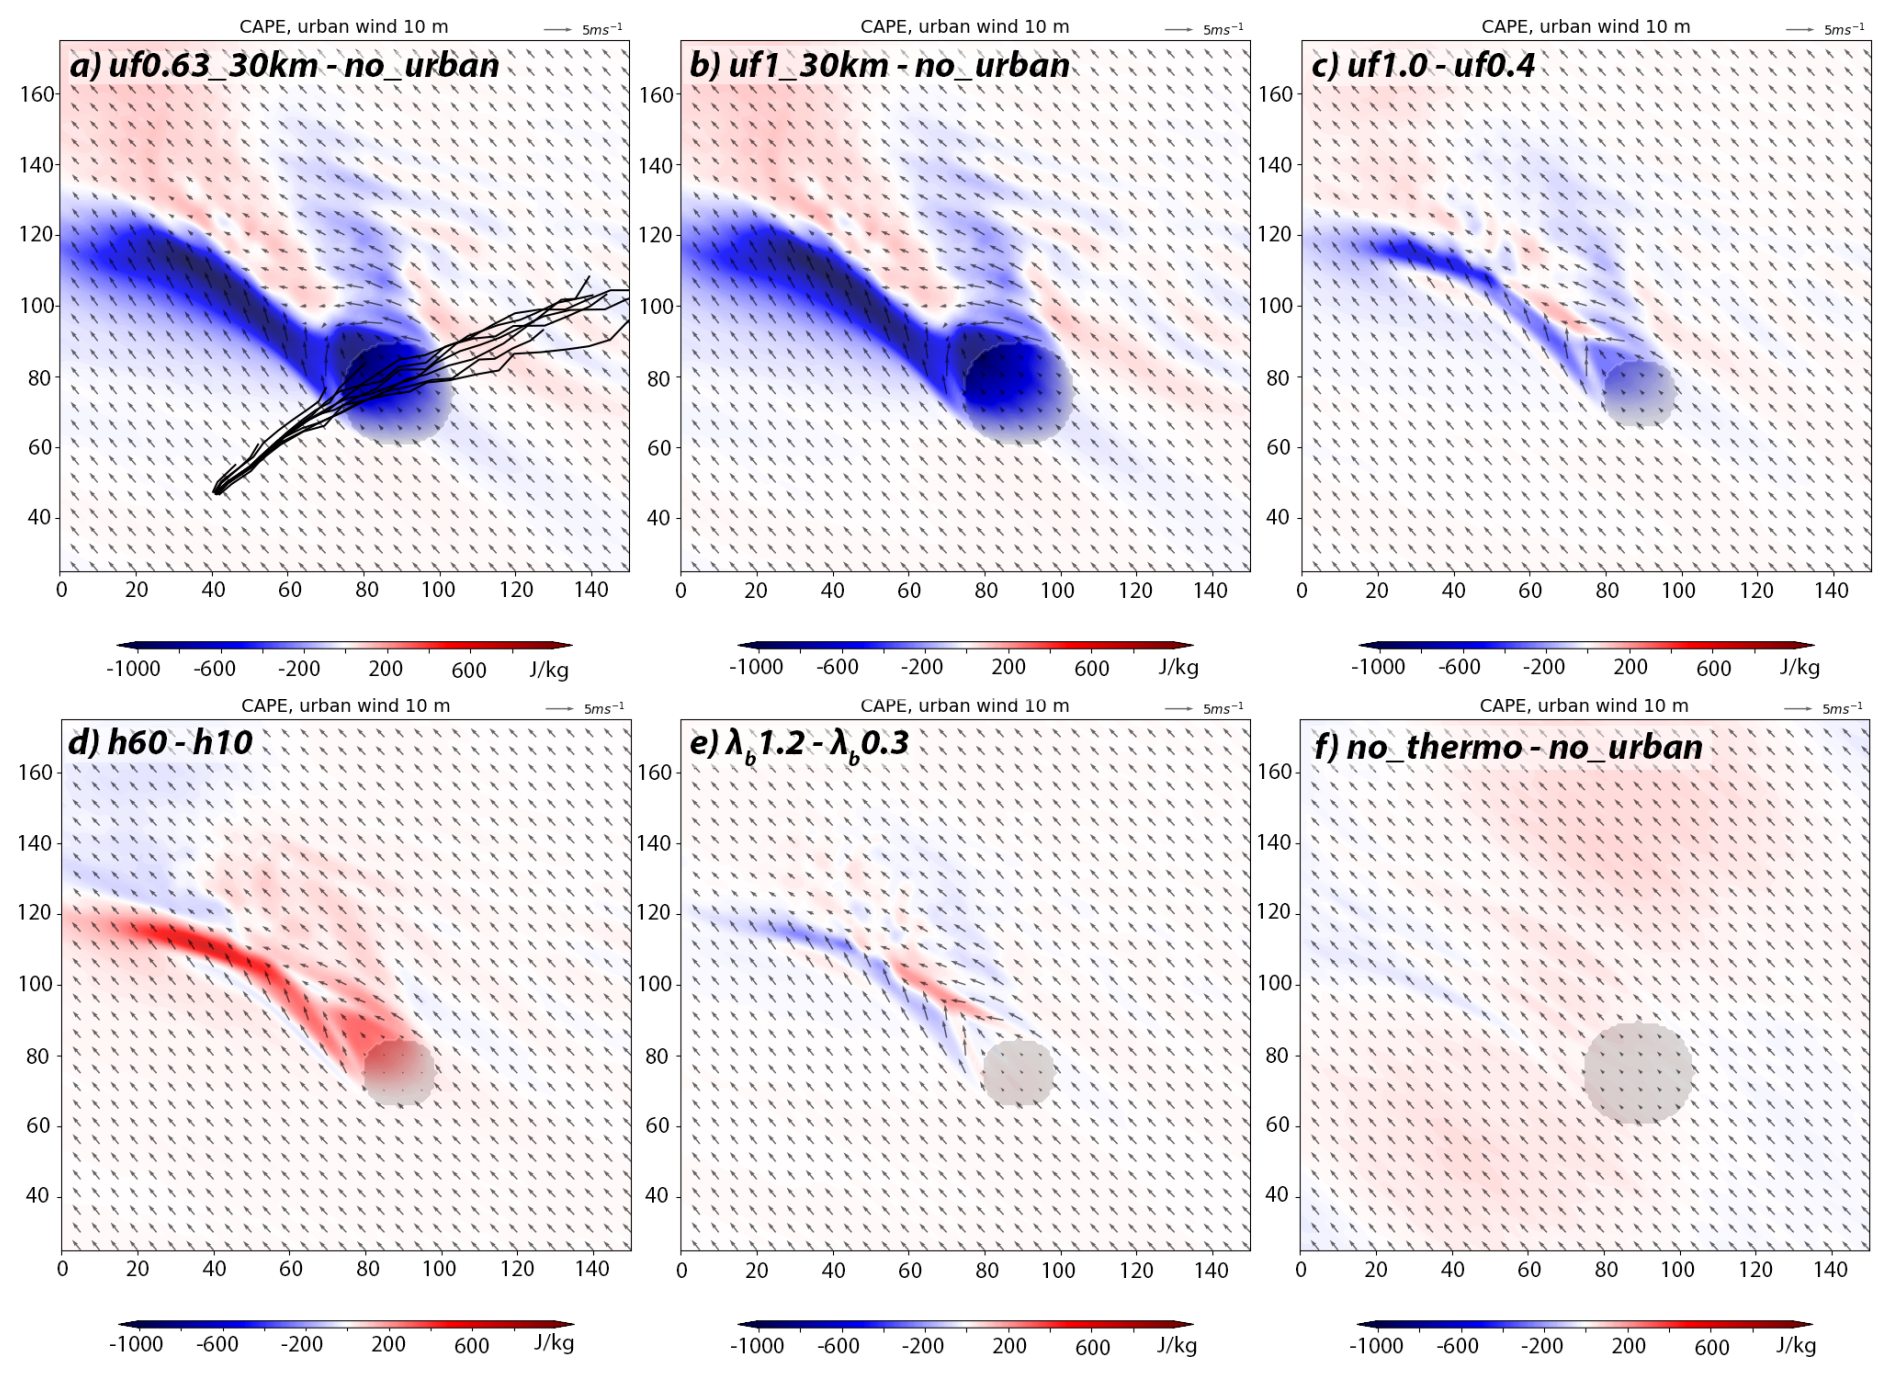
Surface Based Convective Available Potential Energy (SB CAPE) is markedly reduced by urban land use along a wake downstream of the city (Fig. 12a, b). The simulated storms cross the southern lobe of the urban plume with reduced SB CAPE (Fig. 12a). Note that the spatial spread of the supercell tracks over the city is about 5 km, and all tracks pass through areas with similar urban-modified environmental characteristics. The reduction in SB CAPE reaches up to 1000 J kg−1 and coincides with the wake of higher temperature and lower moisture observed in Fig. 9. Urban fraction contributes to a decrease in SB CAPE of about 200 J kg−1 (Fig. 12c), while taller buildings increase SB CAPE by up to 400 J kg−1 (Fig. 12d). Building density has no significant effect on SB CAPE (Fig. 12e), consistent with the results previously discussed for other near-surface variables. In the no_thermo experiment, SB CAPE is unaffected by the presence of the buildings (Fig. 12f).
The same sensitivity of SB CAPE to urban morphological parameters observed for moisture suggests that the decrease in moisture more than offsets the temperature increase. Indeed, the Skew-T comparisons among the uf1_30km and no_urban experiments in Fig. 13 show that the drier, deeper and warmer PBL in the urban simulations (dashed lines) drives a reduction of CAPE area. While the UHI drives the generation of the downwind pressure minimum, the UDI drives the formation of the wake with reduced SB CAPE.
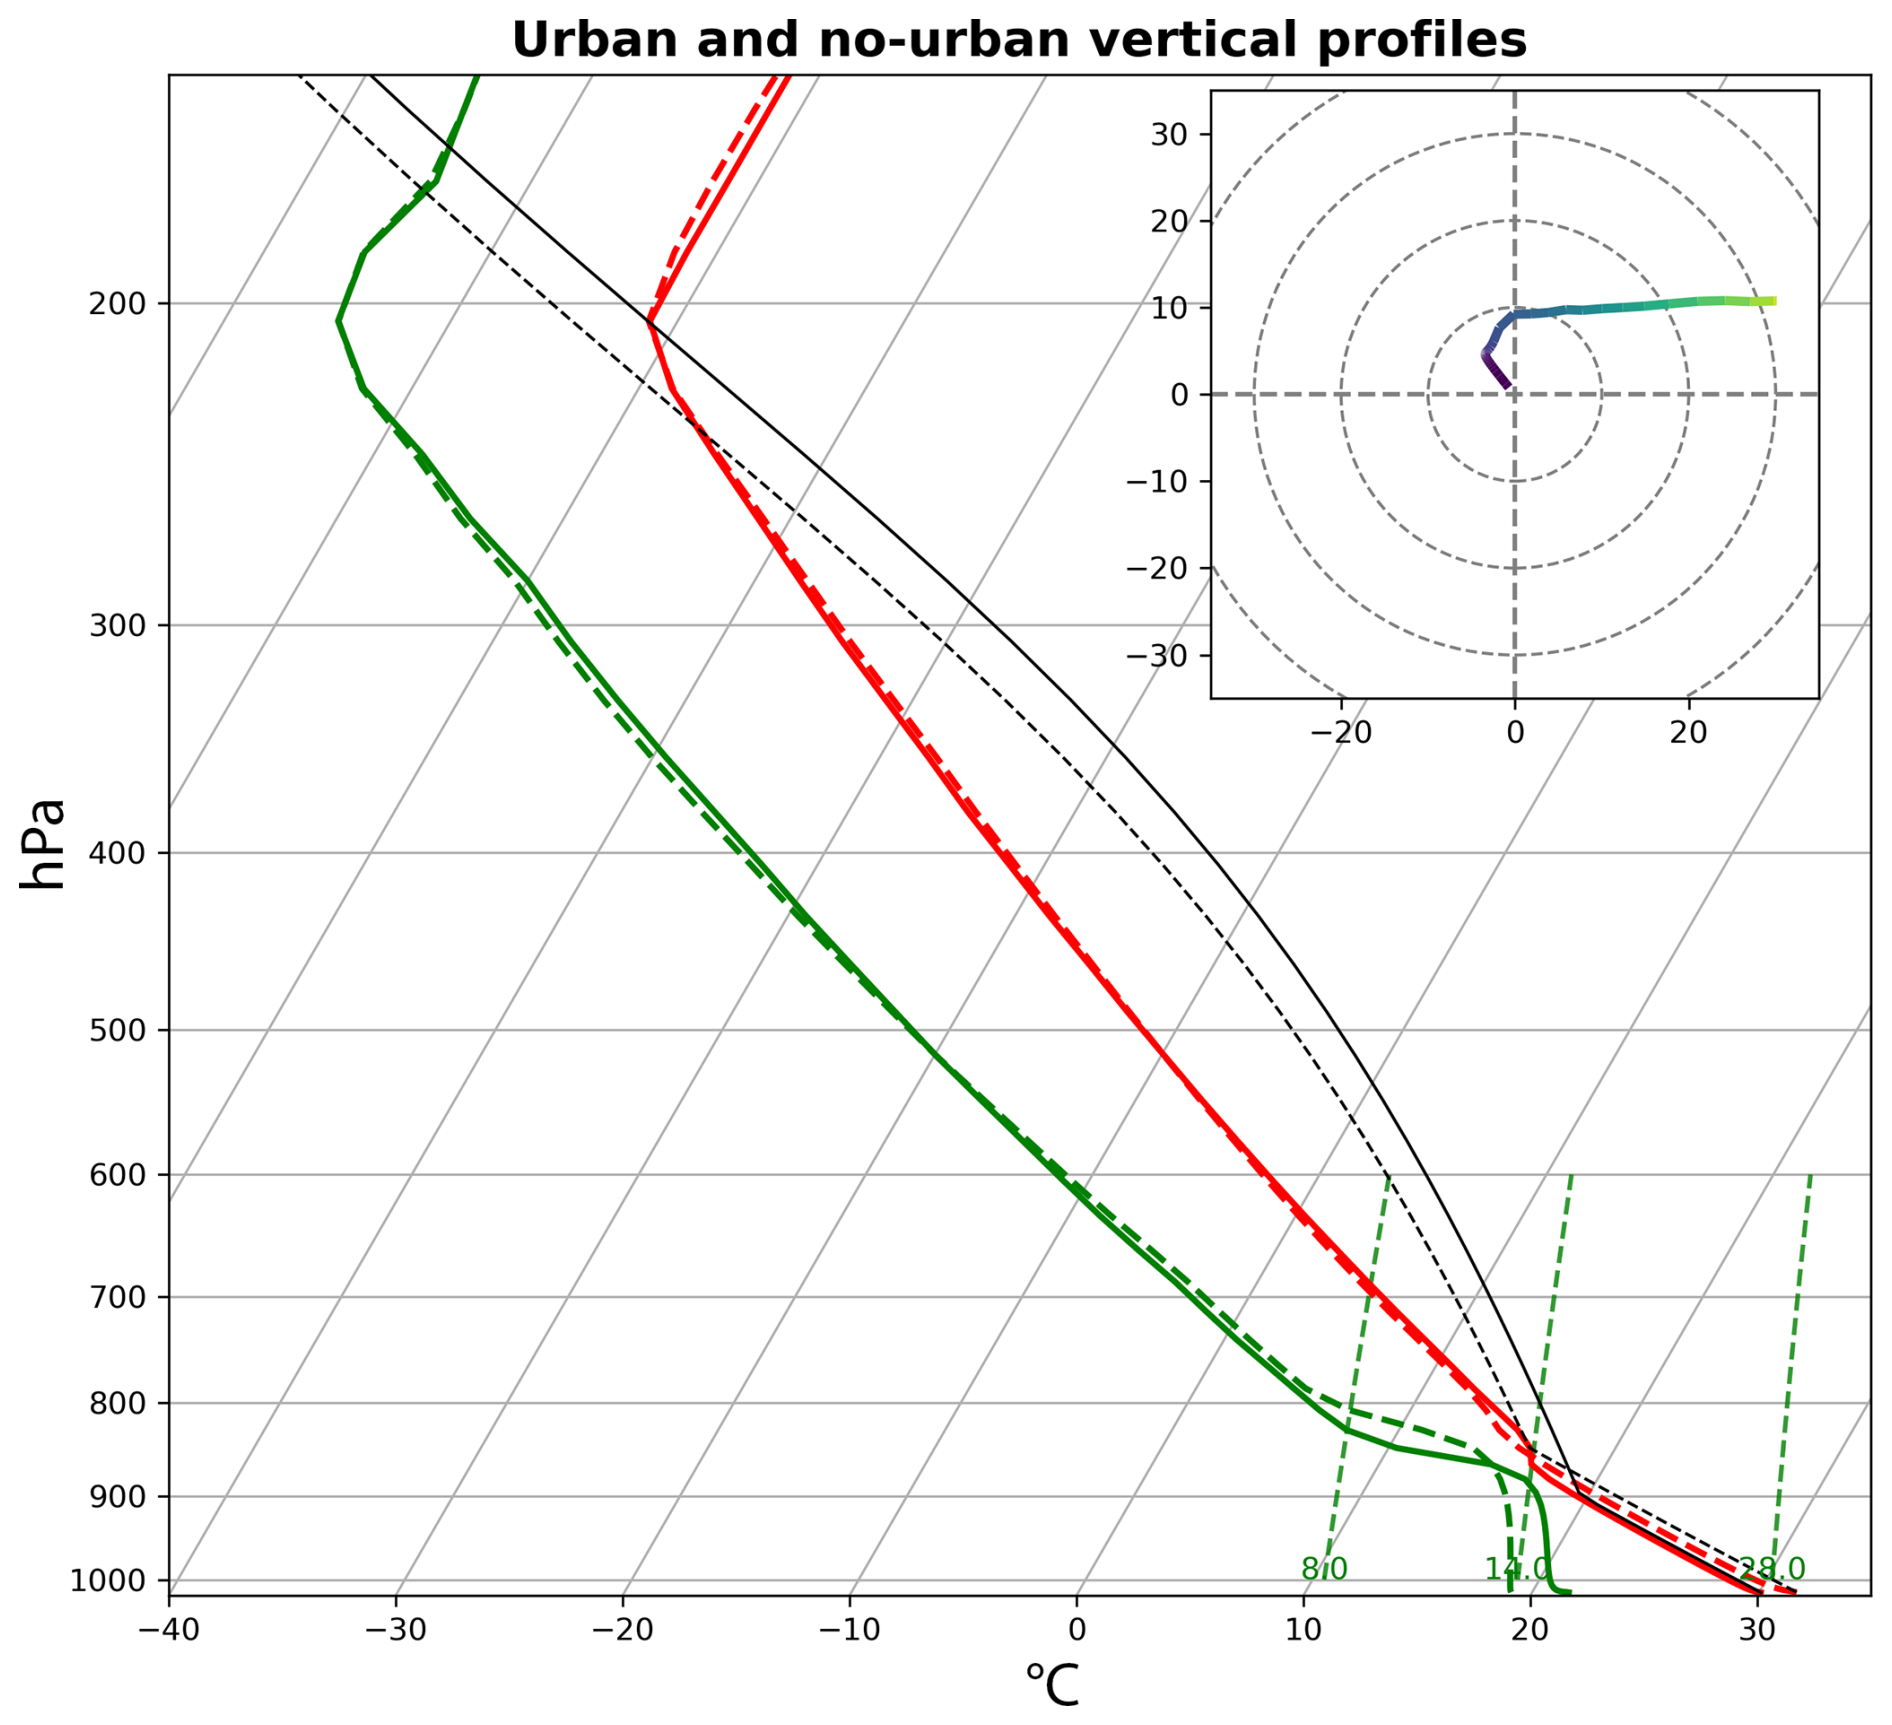
Figure 13Ensemble mean Skew-T profile taken over the city center in the uf1_30km experiment (dashed lines) and in the no_urban case (solid lines) at 17:30 LT (right before the storm hit the city). Red lines are temperature, green lines are dew point temperature and black lines are surface based parcel profiles. In the upper-right part of the figure the ensemble mean hodograph in the uf1_30km experiment is shown. A spatial average considering grid-points within 5 km from the urban center has been performed.
4.3 Vertical Velocities at 950 hPa
To assess the city's capacity to trigger convection, the differences in ensemble means of vertical velocity at 950 hPa are analyzed at 16:00 LT, before storm initiation. Upstream and over the city, no remarkable vertical velocities are induced by urban land use (Fig. 14a, b). In contrast, downstream of the city, a line of intensified vertical velocity extends up to 60 km from the city. In the uf1_30km experiment, the intensified vertical velocity reaches locally up to 1 m s−1. This line coincides with the surface wind convergence. A higher urban fraction produces stronger vertical velocities (Fig. 14c), while taller buildings reduce their intensity (Fig. 14d). A more compact city slightly intensifies vertical velocities downstream (Fig. 14e), whereas vertical velocities are not produced in the no_thermo experiment (Fig. 14f).
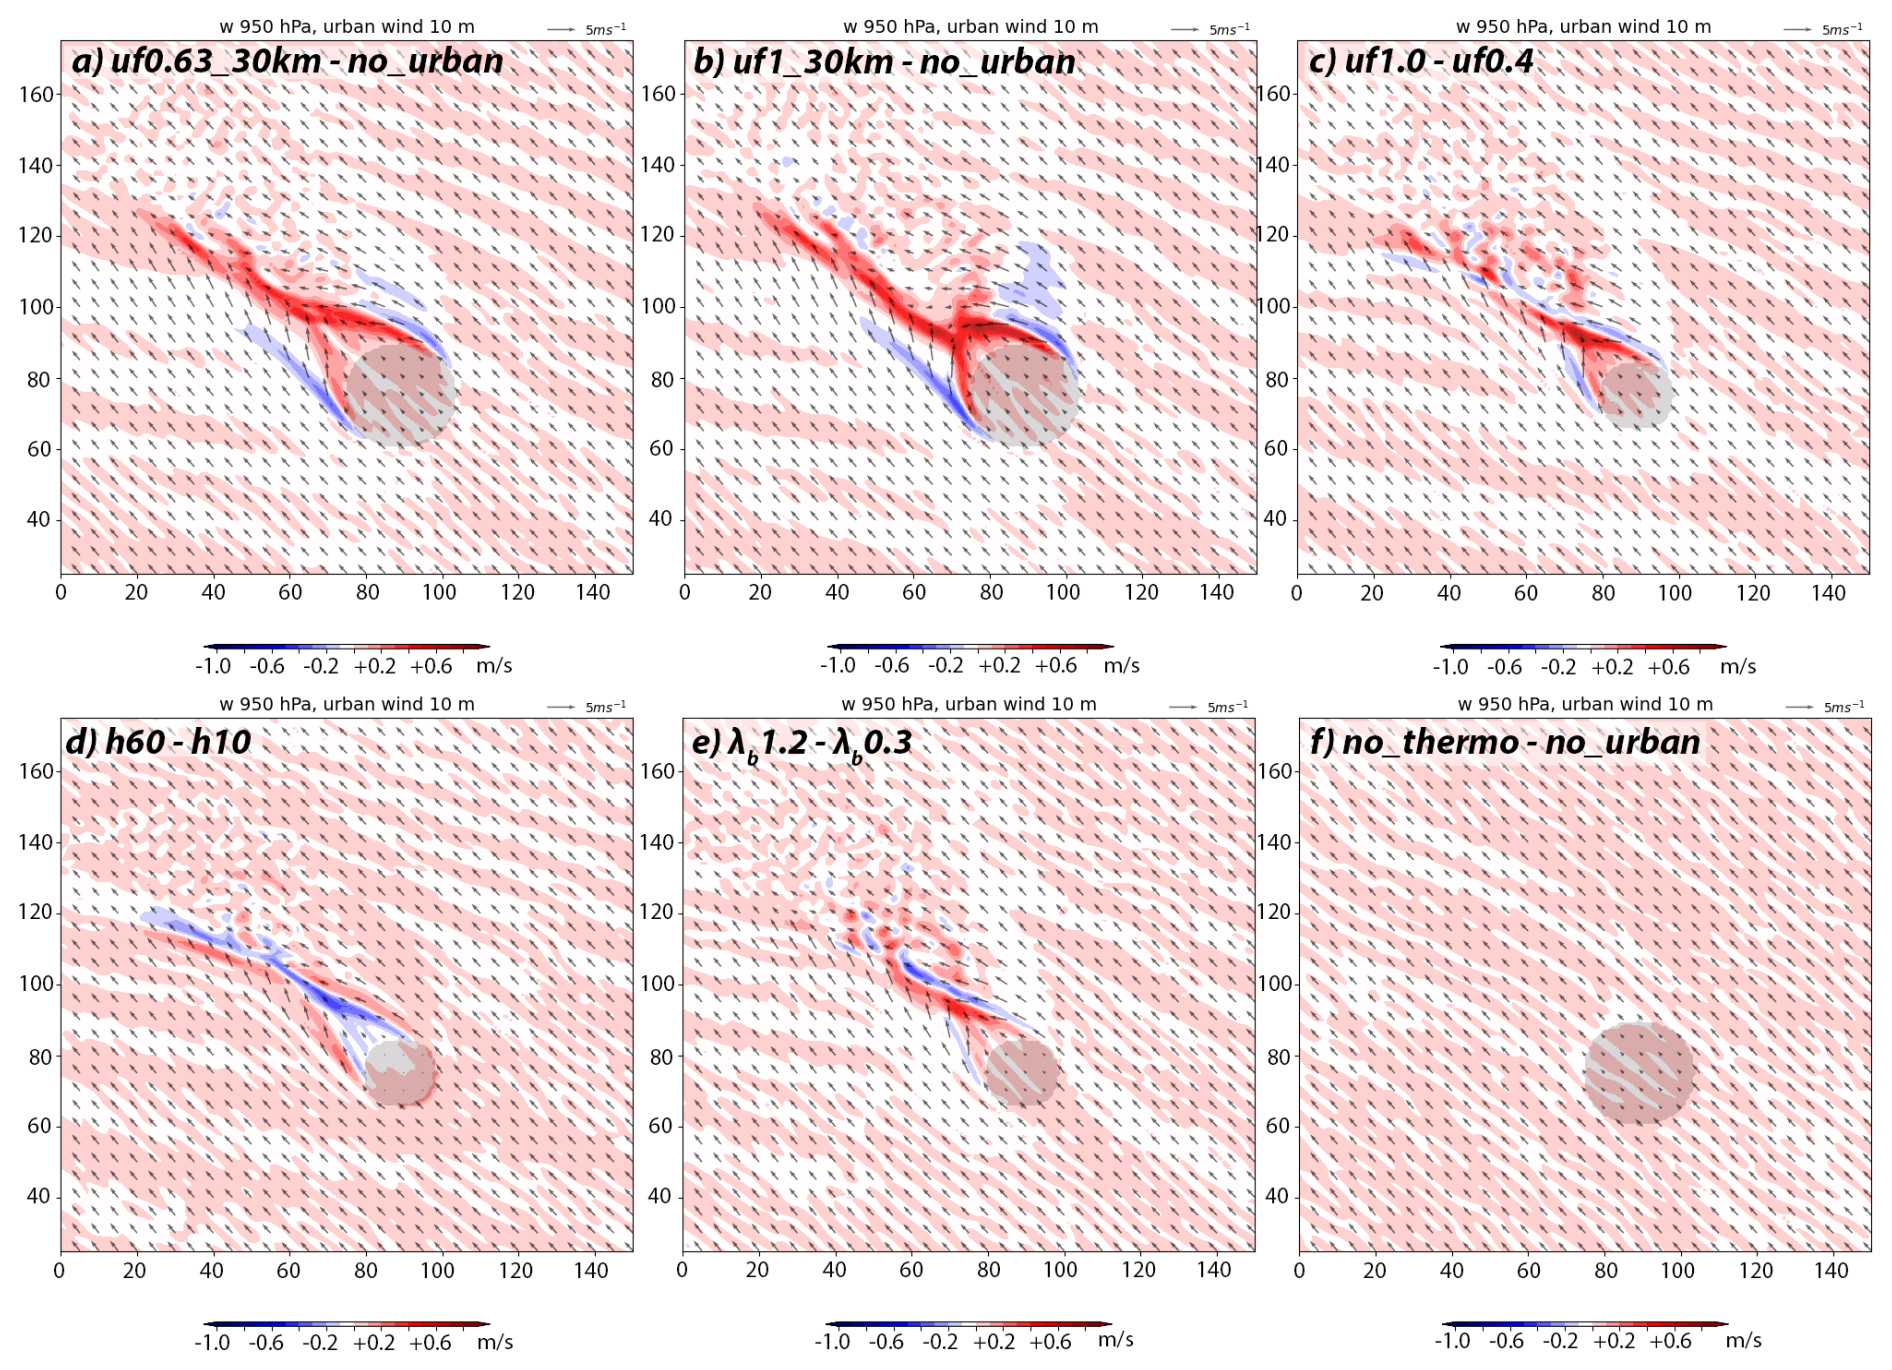
The intensification of vertical velocities is related to the intensity of the UHI. A stronger UHI leads to a deeper pressure minimum, more vigorous surface wind convergence, and stronger vertical velocities. For example, in the simulation with taller buildings, vertical velocities are weaker (Fig. 14d) because both the pressure minimum (Fig. 10d) and the UHI (Fig. 9d) are weaker. In the no_thermo experiment, vertical velocities are absent (Fig. 14f) because neither a pressure minimum (Fig. 10f) nor a UHI (Fig. 9f) develops. Furthermore, building heights do not induce significant vertical velocities. In the no_thermo experiment 20 m tall buildings are present but there are no vertical velocities (Fig. 14f). Moreover, in the experiment with 60 m tall buildings (h60) vertical velocities are weaker along the convergence and more positive, i.e., closer to zero, where there is subsidence in the edges of the urban plume (Fig. 14d). This result explains why low-level vertical velocities in the simulated supercell do not increase with increasing building height, as discussed in Sect. 3.3 (Table 11).
4.4 Wind Shear: SRH 0–3 km
In the uf0.63_30km and uf1_30km experiments, SRH 0–3 km is reduced by up to 100 J kg−1 (about 50 % less than in the no_urban simulations) south of the convergence line discussed in Sect. 4.3, and increased north of it with a similar magnitude (Fig. 15a). The increase (reduction) of SRH north (south) of the convergence line is due to the greater (smaller) veering of the wind caused by a stronger (weaker) surface easterly wind component (Fig. 9a) and a stronger pressure minimum. Thus, the modifications of SRH are ultimately induced by the pressure minimum generated by the UHI. An higher urban fraction amplifies this SRH pattern (Fig. 15c). In contrast, taller buildings cause the opposite pattern, i.e., higher SRH values south of the convergence line, due to the weaker pressure minimum. In the building density and no_thermo experiments, the SRH is almost unperturbed, except for slightly higher values over the city (Fig. 15e, f). The increase of SRH over the city results from reduced surface winds (Fig. 9e, f), consistent with the findings of Reames and Stensrud (2018). The spatial patterns in SRH 0–1 km are similar to those exhibited in SRH 0–3 km.
4.5 Further insights into the storm-urban plume interaction
The thermal bubble that initiates the storm was positioned to steer the storm toward the urban center (Fig. 6). However, the wind profile pushes the urban plume northwestward, so that the strongest urban perturbations are not located over the city, but downwind of it (Figs. 12, 15, 14), as previously observed. Thus, the storm is not interacting with the most intense urban perturbations in the simulations discussed so far.
To verify the effect of a more direct interaction between the storm and the urban plume, the storm_shifted experiment was run, in which the storm is shifted 22 km northwestward and the city considered is 30 km wide with an urban fraction of 1.0. The results are displayed in Fig. 16a. In that case, the storm dissipates even more quickly, and the generation of new convective cells is observed northeast of the city. Hence, the results are not different from those obtained in the uf1_30km experiment. Even though the storm interacts with a stronger positive perturbation of SRH, the negative perturbation of CAPE is even more pronounced, causing the storm to dissipate faster.
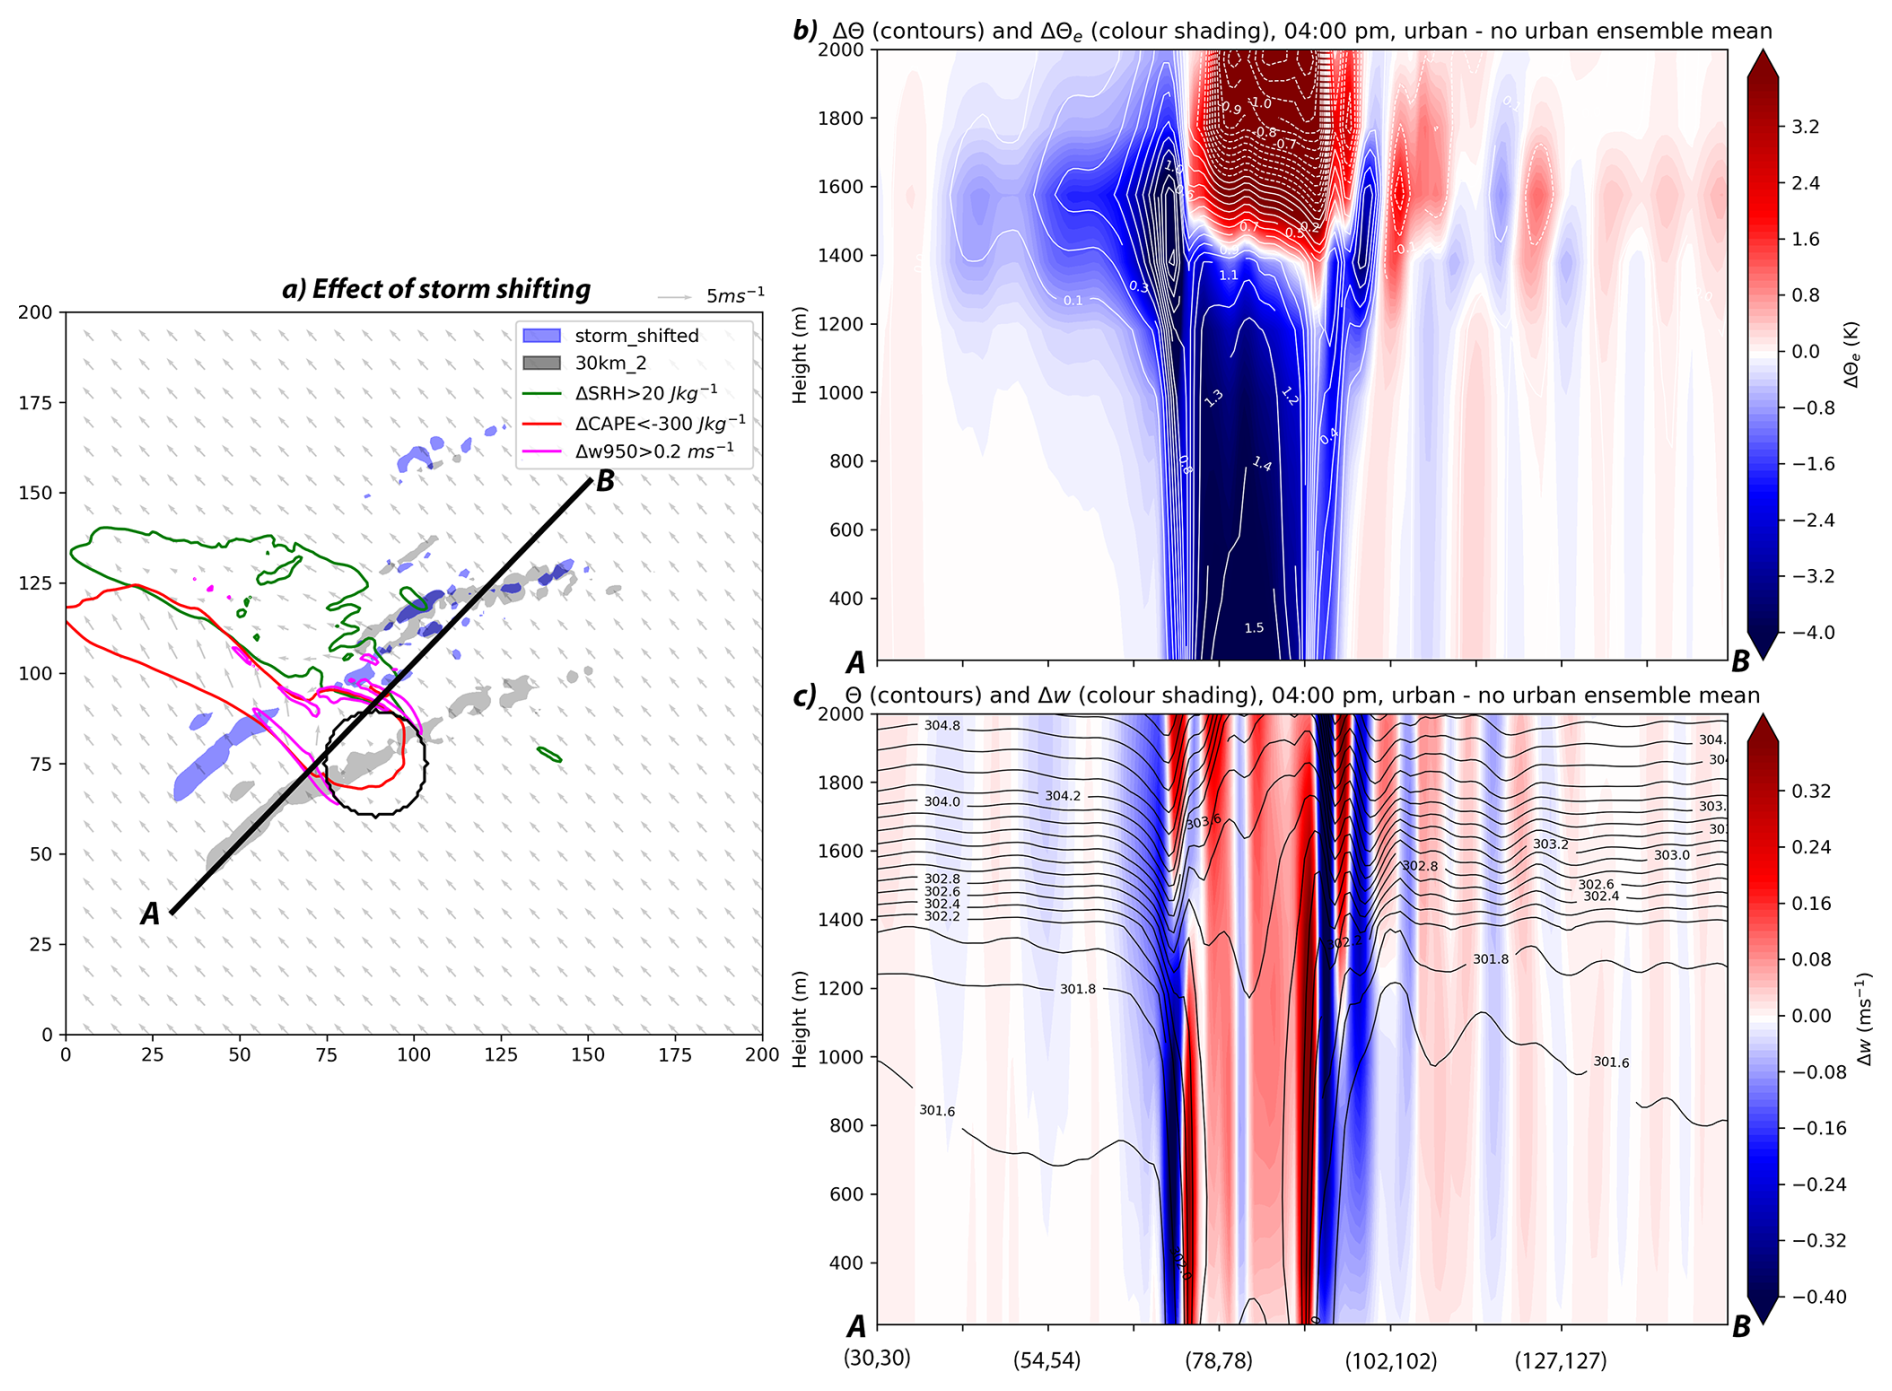
Figure 16(a) Ensemble mean of UH values exceeding 80 J kg−1 in the uf1_30km simulations (black shading), and the storm_shift experiment (blue shading). The ensemble mean difference in CAPE smaller than −300 J kg−1 (red contour), in SRH bigger than 20 J kg−1 (green contour) and in w950 greater than 0.2 m s−1 (magenta contour) between the storm_shifted experiment and the no_urban experiment is indicated with a red contour. The ensemble mean of 10 m wind field from the uf1_30km experiment at 16:00 LT is shown with grey arrows. The city location is outlined with a black contour. (b) The ensemble mean of the difference in equivalent potential temperature Θe (colour shading) and of potential temperature Θ (contour lines) between the uf1_30km experiment and the no_urban one along the cross section AB in panel (a) is shown. Panel (c) as in panel (b) but the ensemble mean Θ (contour lines) and the ensemble mean differences in vertical velocities (colour shading) are shown.
Another interesting observation is that, in some ensemble members (e.g., Fig. 7b), storm dissipation occurs before the storm actually reaches the negative SB CAPE perturbation, raising doubts as to whether this is the actual mechanism driving the dissipation. Investigating the urban-induced perturbations along a cross-section taken along the storm's path (line AB in Fig. 16a) reveals that the area of low equivalent potential temperature (Θe) over the city, driven by the moisture reduction, extends upstream (with respect to storm motion, i.e., toward point A) at the top of the boundary layer (around 1500 m, Fig. 16b). In that area, an increase in potential temperature Θ is also present (Fig. 16b), associated with regions of subsidence (Fig. 16c). These features suggest enhanced inhibition (due to higher Θ), entrainment of more stable air (due to lower Θe), and subsidence at the top of the boundary layer upstream of the city; this likely promotes early storm dissipation. The early dissipation occurs only in a few ensemble members, where CAPE was already reduced in the no_urban experiment due to ensemble stochasticity. Hence, storm dissipation is primarily driven by the UDI, which reduces CAPE and Θe, but regions of subsidence associated with UHI-induced vertical motions may favour this process.
In the current study, the ensembles of idealized numerical experiments consistently show a weakening of a supercell moving into a city due to the urban land use, especially down-track of the city. This weakening is significant primarily in medium- to large-sized cities with a high urban fraction (Fig. 5). For smaller cities, the effect is less evident and not statistically significant, with some ensemble members showing that the supercell is even intensified. The weakening of the supercell is caused by the UDI, which drives a substantial reduction in SB CAPE of up to 1000 J kg−1 in the presence of a large city (Fig. 12). This reduction occurs in the wake downstream of the city (relative to the surface winds; Fig. 17a). Some previous studies found higher CAPE values in urban areas (Moraglia et al., 2024), while others noticed that urban land use can reduce CAPE (e.g., Yang et al., 2021b; Reames and Stensrud, 2018; Yang et al., 2014), with reduced moisture availability suggested as a possible explanation (Wang et al., 2012; Holley et al., 2014). To the authors' knowledge, this is the first time that an urban-induced reduction of CAPE has been directly linked to an urban-induced weakening of storms. Our conclusions differ markedly from those of Naylor and Mulholland (2023); Naylor et al. (2024), who did not consider the UDI in their idealized setup. This factor proves crucial in shaping supercell dynamics in our simulations.
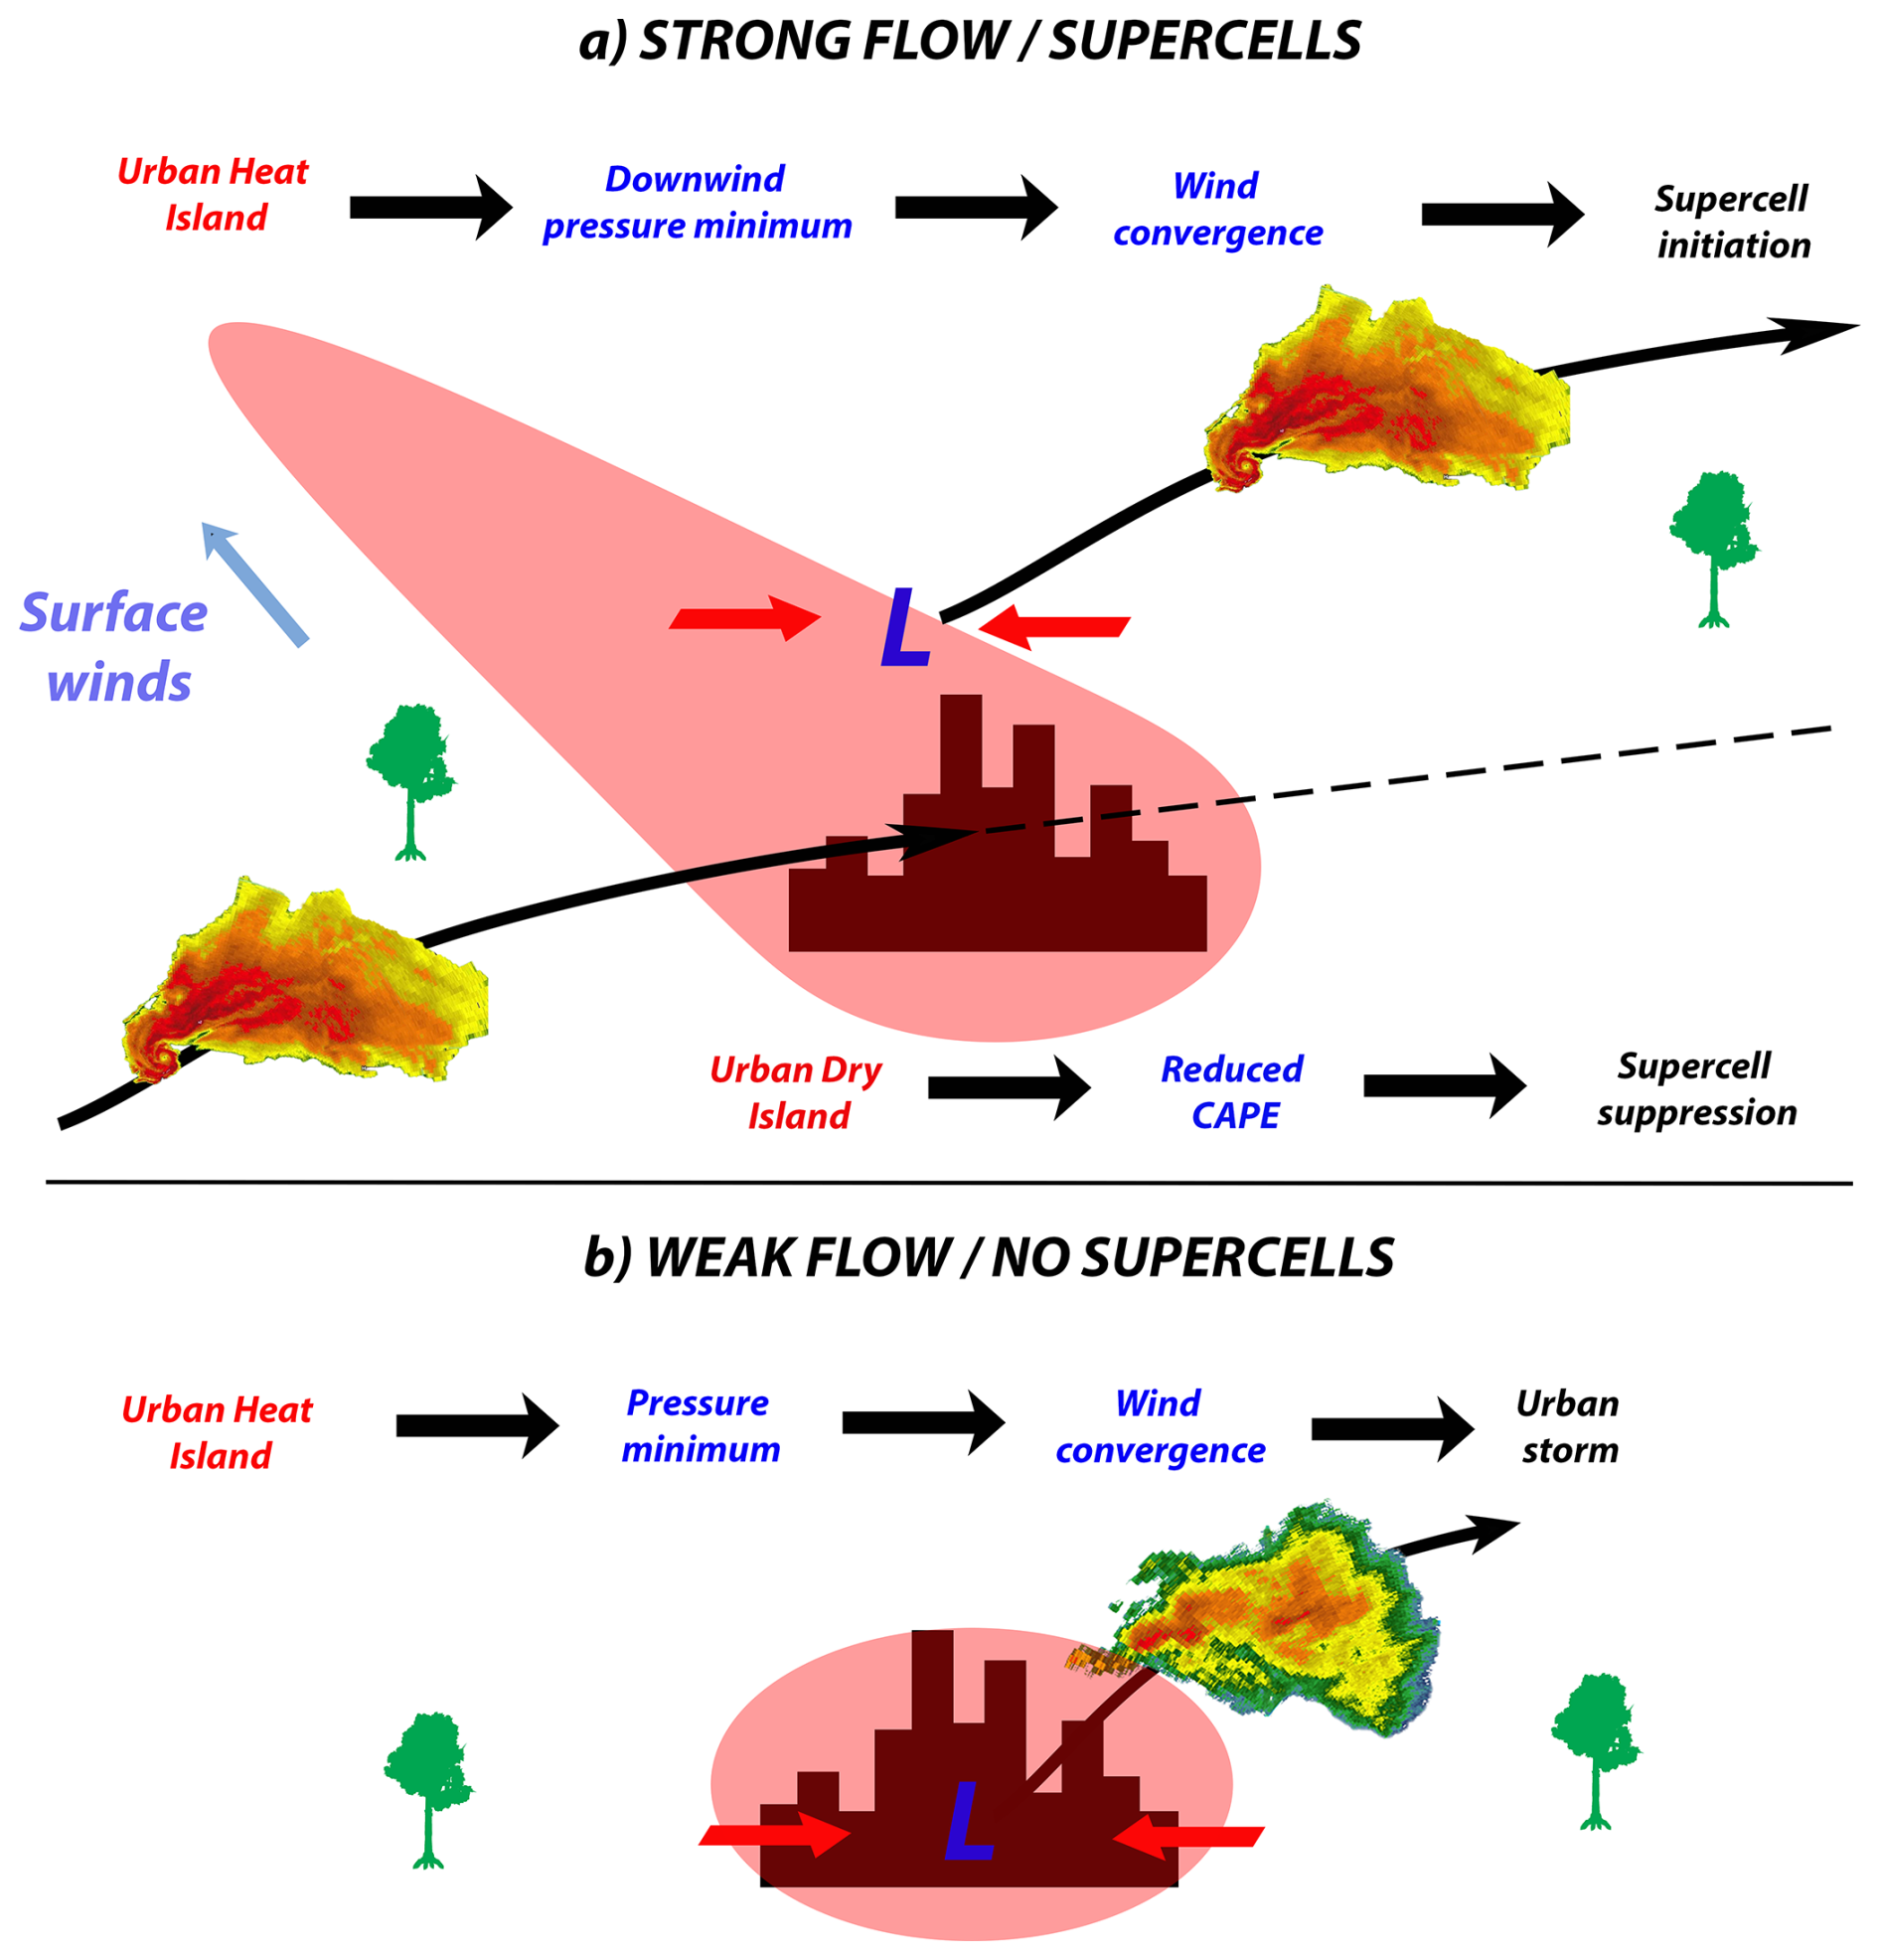
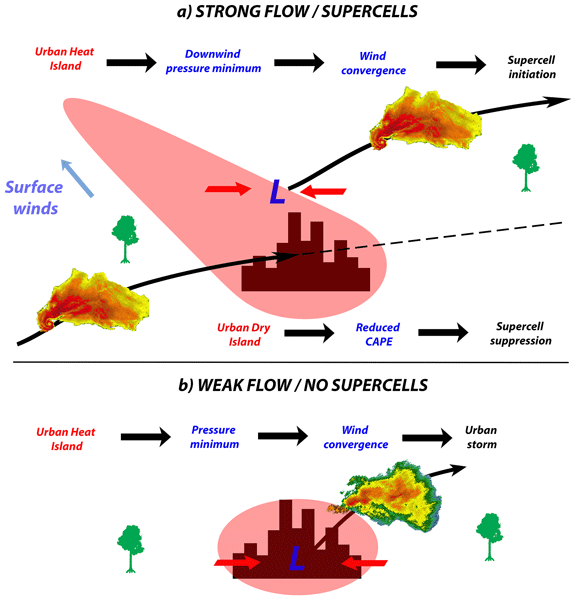
Figure 17(a) Summary of the results obtained in this study regarding the interaction between supercell storms and a city: the UHI and UDI (red shading), city (black histogram), supercell (yellowish-reddish shading with hook-echo shape), pressure minumum (letter L) and wind convergence (red arrows) are shown. Panel (b) as in panel (a), but for a weak flow situation without supercells.
With a sufficiently large city and a high urban fraction, a new urban-induced supercell develops in 8 out of 11 ensemble members downstream of the city, while the initial incoming supercell is dissipated by the UDI (e.g., Fig. 7). This new urban-induced supercell is triggered by a convergence line downstream of the city, generated by a pressure minimum of about 1 hPa (Fig. 17a). The UHI thermodynamically induces a pressure minimum, as it was already suggested by Rozoff et al. (2003), which in turn produces the convergence line (Fig. 10). The connection between the pressure minimum and the UHI is supported by a quantitative analysis of pressure perturbations (Fig. 11) and by an ad hoc experiment called no_thermo. Although in our experiments the generation of the urban-induced supercell occurs only with a 30 km-wide city and an urban fraction of 1.0, it could also occur with smaller cities and lower urban fractions. The key requirement may simply be a sufficiently strong UHI combined with an environment conducive to supercells. In our numerical simulations, the threshold for the development of an urban-induced supercell corresponds to a UHI of 1.5 K, which is not particularly high.
The urban-induced reductions in moisture and CAPE obtained in our simulations are larger than those published so far. The simulated reduction of relative humidity (13 %) is in line with the annual mean reductions observed in Moscow (9 %, Lokoshchenko, 2017) and Beijing (∼12 %, Luan et al., 2022), whereas the reduction of specific humidity (∼ 2 g kg−1) is about 0.6 g kg−1 larger than the peak summer reduction of 1.4 g kg−1 found by Meili et al. (2022) over 1089 stations worldwide and 29 years. The difference is larger for CAPE: our reduction of up to 1000 J kg−1 is about twice the ∼ 450 J kg−1 obtained by Reames and Stensrud (2018), and 1 order of magnitude larger than the 40–100 J kg−1 reported by simulations averaged over several summers (Wang et al., 2012; Yang et al., 2014) or over a 4 d period (Yang et al., 2021b). A plausible explanation is that most previous studies consider seasonal or multi-year averages, which smooth out the diurnal and seasonal cycles of UDIs (Huang and Song, 2023): in terms of specific humidity, UDIs are strongest in the warm season and in the late afternoon (Meili et al., 2022), when severe storms are more frequent, so that individual events may exhibit larger moisture reductions than long-term averages. In addition, our idealized city was designed to represent an extreme case (30 km wide, with a high urban fraction and no water bodies), whereas Dallas–Fort Worth, the city considered by Reames and Stensrud (2018), includes several rivers and lakes that may attenuate the UDI. Finally, we cannot exclude that BEP-BEM contributes to enhancing the urban drying.
The analysis was conducted under a fixed environment. We cannot exclude the possibility that a wide variety of interactions, some of which may include storm invigoration, could occur in different environments, depending on the trajectory of the storm, the topology of the city-induced perturbations, and the ground-relative flow. For instance, with a strongly veered environment that leads to a southeastward propagating storm, a storm may traverse the lobe with positive SRH perturbations, potentially leading to a storm intensification. Interestingly, this seems the case of Lin et al. (2021), who found a supercell intensification induced by the urban land use. Looking to their Fig. 8 seems that the supercell is initiated in the region with urban-induced wind convergence north of town, as in our case (Fig. 14a). Their supercell storm could be the equivalent of our idealized urban-induced supercell (Fig. 7), but with a southward propagation.
There is some observational evidence supporting these numerical results. The radar-based climatological study of Kingfield et al. (2018) found that, for four Great Plains cities in the United States, reflectivity values of approaching storms were higher upwind than downwind. The opposite pattern was observed, however, when selecting an urban-favorable subset of nonsupercells occurring during summer under weak synoptic forcing. Similarly, the radar-based study of Lorenz et al. (2019) found that storms striking Berlin, Germany, were more frequently weakened than intensified. Thus, in strongly forced environments, it is not uncommon for approaching storms to be dissipated or weakened by cities, as is observed in our numerical simulations. This scenario has received relatively little attention in the literature, as most studies have focused on the potential of cities to generate urban storms and enhance precipitation (e.g., Shen and Yang, 2023; Shepherd et al., 2002). The latter outcome is likely common in weakly forced synoptic environments and can also occur at times under strongly forced conditions, with the generation of severe storms downstream urban areas (e.g., Lin et al., 2021; Reames and Stensrud, 2018). However, the weakening of approaching severe storms by urban land use is an equally important outcome that should be highlighted.
An additional relevant difference from previous studies is that the effect of building height on storms is negligible in our experiments, even with 60 m tall buildings. In these cases, the pressure minimum is still induced by the UHI (Fig. 11), and the vertical velocities generated by 60 m tall buildings are much weaker than those associated with the UHI-induced pressure minimum (Fig. 14d). Furthermore, building height is not correlated with higher values of low-level vertical velocities in the simulated supercell (Table 11). These results are consistent with the recently published work of Torelló-Sentelles et al. (2025), who found that the enhanced vertical velocities observed over some real cities in their simulations were primarily driven by thermodynamic processes rather than by dynamical roughness effects. Thus, there is growing agreement that the dynamical influence of buildings on convective storms may be marginal in a strongly synoptically forced environment. Nevertheless, the building-barrier effect could still play a role in other strongly forced situations not explored in these idealized simulations, such as QLCS events with intense outflows (e.g., De Martin et al., 2025) or tornadic events with more intense surface flows. In general, under such conditions, the influence of buildings may be more significant.
The marginal effect of buildings on convective storms is likely valid for most atmospheric environments (Torelló-Sentelles et al., 2025). If building height has little impact on storms under moderate surface flows, its influence should be even less relevant in weakly forced environments. For this reason, we argue that our conceptual model can be extended to such environments. Under weak flow conditions, the UHI-induced pressure minimum is not advected downstream but remains centered over the urban area, as also suggested by some recent case study analysis (Swain et al., 2025; Kawabata et al., 2025; Forster et al., 2024; Seino et al., 2018). Consequently, storms can be triggered over the urban area in such situations.
The simulations carried out in this work permit to provide a tentative answer to the questions originally posed in the Introduction.
- Question 1:
Can a city modify a supercell?
A statistically significant weakening of the approaching supercell is observed. In contrast, in some ensemble members, a new supercell is triggered downstream when a sufficiently large city is included in the domain, highlighting the dual effect of cities on supercell storms.
- Question 2:
What are the physical processes that cause those modifications?
Most of the observed modifications are attributed to thermodynamic changed in the PBL induced by urban surfaces. The UDI weakens an approaching storm by reducing CAPE. At the same time, the UHI generates a pressure minimum, capable of inducing downstream wind convergence that can trigger a new urban-induced supercell when the UHI is sufficiently intense. The effect of building heights on supercell dynamics is negligible.
Even though these results were obtained from a specific atmospheric profile, they are consistent with radar climatologies of urban storms (Lorenz et al., 2019; Kingfield et al., 2018). A further interesting outcome of this work is the simulated supercell's sensitivity to surface conditions. Relatively small differences in temperature (1 K) and moisture (1 g kg−1) are sufficient to alter supercell behavior markedly. A direct implication of this result is that operational weather-forecasting models must be driven by up-to-date land-use data. For instance, changes in vegetation caused by drought, if not assimilated into the models, can lead to significantly inaccurate forecasts (see also Zhang et al., 2025).
Several limitations remain that should be addressed in future work. Although the building parametrization employed is highly sophisticated (Martilli et al., 2002) and has been shown to be reliable (Zonato et al., 2021), it does not explicitly resolve the effect of buildings on the atmosphere. This approach remains appropriate for the mesoscale focus of this study; however, small-scale urban processes – which may, in some situations, strongly influence urban storms (e.g., under shallow surface-based inflow layers) – are not explicitly represented. Large Eddy Simulations (LES) should be conducted (as done by Rozoff et al., 2023 for hurricane winds) to assess the importance of these processes for convective storms and to test whether the results of this study hold under that approach. Furthermore, some studies showed that urban aerosols can significantly influence storm development (Liu and Niyogi, 2019; Fan et al., 2020; Lin et al., 2021), suggesting that the effect of urban aerosols on idealized supercells may be worthy of investigation. Another aspect not considered here includes the effects of urban land use on nocturnal events: while the UHI is stronger during the night, nocturnal storms are usually elevated, suggesting that urban-storm interactions may differ from those during the daytime. More generally, exploring the sensitivity of these results to other environmental conditions is a relevant direction for future work. Lastly, idealized simulations of a QLCS, rather than a supercell, interacting with a city should also carried out to evaluate whether building effects on the gust front may dominate over the UHI and UDI in such cases.
The simulations were performed with the Weather Research and Forecasting (WRF) model version 4.6.0 (Skamarock et al., 2019), which is freely available at https://github.com/wrf-model/WRF (last access: 12 October 2026; https://doi.org/10.5065/D6MK6B4K, NCAR, 2026). All the material needed to reproduce the simulations is archived on Zenodo at https://doi.org/10.5281/zenodo.23111214 (De Martin, 2026): the WRF namelist, the input sounding, the modified parameter tables (URBPARM_LCZ.TBL and MPTABLE.TBL), the additional input files required by the idealized set-up (surface_file, city_file and bubble_file), and the modified WRF source files (solve_em.F, module_initialize_ideal.F, module_sf_bep_bem.F and module_sf_noahmpdrv.F). The repository also includes the versions of module_sf_noahmpdrv.F and bl_ysu.f90 used for the no_thermo experiment. The Fortran program used to compute the dynamic and buoyancy pressure perturbations (ppert.f90) is also included in the archive. The revised SPOUT Python code and the Jupyter notebooks used for the analysis are available in the same Zenodo archive. Owing to their size, the full model outputs are available from the corresponding author upon request; they can, however, be reproduced with the material provided.
The supplement related to this article is available online at https://doi.org/10.5194/wcd-7-2015-2026-supplement.
The study was conceptualized by FDM, AZ, and SDS. The software was provided by AZ, while the formal analysis was conducted by FDM, CR, and SA. Computational resources were provided by CR and SA, while SDS supervised the work and secured funding. FDM wrote the original draft, which was edited by CR, AZ, SA, and SDS.
The contact author has declared that none of the authors has any competing interests.
Publisher's note: Copernicus Publications remains neutral with regard to jurisdictional claims made in the text, published maps, institutional affiliations, or any other geographical representation in this paper. The authors bear the ultimate responsibility for providing appropriate place names. Views expressed in the text are those of the authors and do not necessarily reflect the views of the publisher.
FDM acknowledges the I-CHANGE project, funded by the European Union’s Horizon 2020 research and innovation programme under grant agreement No. 101037193. SDS acknowledges the TRIGGER project, funded by the European Union's Horizon Europe research and innovation programme under grant agreement No. 101057739. We acknowledge high-performance computing support from the Derecho system (https://doi.org/10.5065/qx9a-pg09) provided by the NSF National Center for Atmospheric Research (NCAR), sponsored by the National Science Foundation. Rich Rotunno, George Bryan, Alberto Martilli, Jason Keeler, Eric Hendricks, Wesley Terwey, and Patrick Hawbecker are gratefully acknowledged for fruitful discussions on the setup of the simulations. Three anonymous reviewers are acknowledged for their insightful comments. We acknowledge the use of ChatGPT for code debugging and minor text revisions.
This research has been supported by the EU's Horizon 2020 (grant no. 101037193) and the HORIZON EUROPE Framework Programme, HORIZON EUROPE Innovative Europe (grant no. 101057739).
This material is based upon work supported by the NSF National Center for Atmospheric Research, which is a major facility sponsored by the National Science Foundation under Cooperative Agreement No. 1852977.
This paper was edited by Johannes Dahl and reviewed by three anonymous referees.
Andrews, M. S., Gensini, V. A., Haberlie, A. M., Ashley, W. S., Michaelis, A. C., and Taszarek, M.: Climatology of the Elevated Mixed Layer over the Contiguous United States and Northern Mexico Using ERA5: 1979–2021, J. Climate, 37, 1833–1851, https://doi.org/10.1175/JCLI-D-23-0517.1, 2024. a
Argüeso, D., Di Luca, A., and Evans, J. P.: Precipitation over urban areas in the western Maritime Continent using a convection-permitting model, Clim. Dynam., 47, 1143–1159, 2016. a
Basara, J. B., Hall Jr., P. K., Schroeder, A. J., Illston, B. G., and Nemunaitis, K. L.: Diurnal cycle of the Oklahoma City urban heat island, J. Geophys. Res.-Atmos., 113, D20109, https://doi.org/10.1029/2008JD010311, 2008. a
Berner, J., Shutts, G., Leutbecher, M., and Palmer, T.: A spectral stochastic kinetic energy backscatter scheme and its impact on flow-dependent predictability in the ECMWF ensemble prediction system, J. Atmos. Sci., 66, 603–626, https://doi.org/10.1175/2008JAS2677.1, 2009. a
Bornstein, R. and LeRoy, M.: Urban barrier effects on convective and frontal thunderstorms, in: Extended Abstracts, Fourth Conf. on Mesoscale Processes, Boulder, CO, 25–29 June 1990, American Meteorological Society, Boston, MA, 120–121, 1990. a
Bornstein, R. and Lin, Q.: Urban heat islands and summertime convective thunderstorms in Atlanta: Three case studies, Atmos. Environ., 34, 507–516, https://doi.org/10.1016/S1352-2310(99)00374-X, 2000. a
Bougeault, P. and Lacarrere, P.: Parameterization of orography-induced turbulence in a mesobeta–scale model, Mon. Weather Rev., 117, 1872–1890, https://doi.org/10.1175/1520-0493(1989)117<1872:POOITI>2.0.CO;2, 1989. a
Boyer, C. H., Keeler, J. M., and Rakoczy, B. C.: An Idealized Parameter Study of Destabilization and Convection Initiation in Coastal Regions. Part I: Calm or Offshore Synoptic-Scale Flow, J. Atmos. Sci., 82, 519–539, https://doi.org/10.1175/JAS-D-23-0180.1, 2025. a
Britter, R. E. and Hanna, S. R.: Flow and dispersion in urban areas, Annu. Rev. Fluid Mech., 35, 469–496, https://doi.org/10.1146/annurev.fluid.35.101101.161147, 2003. a
Changnon, S. A. and Ackerman, B.: Summary of METROMEX, Volume 1: Weather anomalies and impacts, Bulletin (Illinois State Water Survey), no. 62, 240 pp., https://www.ideals.illinois.edu/items/103902 (last access: 12 October 2026), 1977. a
Ching, J., Mills, G., Bechtel, B., See, L., Feddema, J., Wang, X., Ren, C., Brousse, O., Martilli, A., Neophytou, M., Mouzourides, P., Stewart, I., Hanna, A., Ng, E., Foley, M., Alexander, P., Aliaga, D., Niyogi, D., Shreevastava, A., Bhalachandran, P., Masson, V., Hidalgo, J., Fung, J., Andrade, M., Baklanov, A., Dai, W. , Milcinski, G., Demuzere, M., Brunsell, N., Pesaresi, M., Miao, S., Mu, Q., Chen, F., and Theeuwes, N.: WUDAPT: An urban weather, climate, and environmental modeling infrastructure for the anthropocene, B. Am. Meteorol. Soc., 99, 1907–1924, 2018. a
Coffer, B. E., Parker, M. D., Peters, J. M., and Wade, A. R.: Supercell Low-Level Mesocyclones: Origins of Inflow and Vorticity, Mon. Weather Rev., 151, 2205–2232, https://doi.org/10.1175/MWR-D-22-0269.1, 2023. a
Dahl, J. M. L. and Fischer, J.: The Origin of Western European Warm-Season Prefrontal Convergence Lines, Weather Forecast., 31, 1417–1431, https://doi.org/10.1175/WAF-D-15-0161.1, 2016. a
De Martin, F.: Idealized simulations urban storms, Version v1.1, Zenodo [code], https://doi.org/10.5281/zenodo.23111214, 2026. a
De Martin, F., Zonato, A., and Di Sabatino, S.: Effects of the urban land use on a severe convective windstorm, Q. J. Roy. Meteor. Soc., 151, e5058, https://doi.org/10.1002/qj.5058, 2025. a, b, c, d, e
Dou, J., Wang, Y., Bornstein, R., and Miao, S.: Observed Spatial Characteristics of Beijing Urban Climate Impacts on Summer Thunderstorms, J. Appl. Meteorol. Clim., 54, 94–105, https://doi.org/10.1175/JAMC-D-13-0355.1, 2015. a, b
Dou, J., Bornstein, R., Sun, J., and Miao, S.: Impacts of urban heat island intensities on a bifurcating thunderstorm over Beijing, Urban Climate, 55, 101955, https://doi.org/10.1016/j.uclim.2024.101955, 2024. a, b
Dudhia, J.: Numerical Study of Convection Observed during the Winter Monsoon Experiment Using a Mesoscale Two-Dimensional Model, J. Atmos. Sci., 46, 3077–3107, https://doi.org/10.1175/1520-0469(1989)046<3077:NSOCOD>2.0.CO;2, 1989. a
Emanuel, K.: On the Physics of High CAPE, J. Atmos. Sci., 80, 2669–2683, https://doi.org/10.1175/JAS-D-23-0060.1, 2023. a, b
Fan, J., Zhang, Y., Li, Z., Hu, J., and Rosenfeld, D.: Urbanization-induced land and aerosol impacts on sea-breeze circulation and convective precipitation, Atmos. Chem. Phys., 20, 14163–14182, https://doi.org/10.5194/acp-20-14163-2020, 2020. a, b
Fan, J., Wang, J., and Lin, Y.: Urbanization may enhance tornado potential: A single case report, Frontiers in Earth Science, 11, 1148506, https://doi.org/10.3389/feart.2023.1148506, 2023. a
Forster, A., Augros, C., and Masson, V.: Urban influence on convective precipitation in the Paris region: Hectometric ensemble simulations in a case study, Q. J. Roy. Meteor. Soc., 150, 3028–3051, https://doi.org/10.1002/qj.4749, 2024. a
Hao, L., Sun, G., Huang, X., Tang, R., Jin, K., Lai, Y., Chen, D., Zhang, Y., Zhou, D., Yang, Z.-L., Wang, L., Dong, G., and Li, W.: Urbanization alters atmospheric dryness through land evapotranspiration, npj Climate and Atmospheric Science, 6, 149, https://doi.org/10.1038/s41612-023-00479-z, 2023. a
Heimann, D. and Kurz, M.: The Munich hailstorm of July 12, 1984: a discussion of the synoptic situation, Beiträge zur Physik der Atmosphäre, 58, 528–544, 1985. a
Holley, D. M., Dorling, S. R., Steele, C. J., and Earl, N.: A climatology of convective available potential energy in Great Britain, Int. J. Climatol., 34, 3811–3824, https://doi.org/10.1002/joc.3976, 2014. a
Homeyer, C. R., Bunkers, M. J., Allen, J. T., and Murphy, A. M.: United States Supercell Storms and Their Severity: A 14-yr Radar-Based Climatology, J. Appl. Meteorol. Clim., J. Appl. Meteor. Climatol., 64, 959–970, https://doi.org/10.1175/JAMC-D-24-0185.1, 2025. a
Hong, S.-Y., Noh, Y., and Dudhia, J.: A New Vertical Diffusion Package with an Explicit Treatment of Entrainment Processes, Mon. Weather Rev., 134, 2318–2341, https://doi.org/10.1175/MWR3199.1, 2006. a
Huang, X. and Song, J.: Urban moisture and dry islands: spatiotemporal variation patterns and mechanisms of urban air humidity changes across the globe, Environ. Res. Lett., 18, 103003, https://doi.org/10.1088/1748-9326/acf7d7, 2023. a, b, c
Janjić, Z. I.: The step-mountain eta coordinate model: Further developments of the convection, viscous sublayer, and turbulence closure schemes, Mon. Weather Rev., 122, 927–945, https://doi.org/10.1175/1520-0493(1994)122<0927:TSMECM>2.0.CO;2, 1994. a
Jiménez, P. A., Dudhia, J., González-Rouco, J. F., Navarro, J., Montávez, J. P., and García-Bustamante, E.: A Revised Scheme for the WRF Surface Layer Formulation, Mon. Weather Rev., 140, 898–918, https://doi.org/10.1175/MWR-D-11-00056.1, 2012. a
Kamath, H. G., Singh, M., Malviya, N., Martilli, A., He, L., Aliaga, D., He, C., Chen, F., Magruder, L. A., Yang, Z.-L., and Niyogi, D.: GLObal Building heights for Urban Studies (UT-GLOBUS) for city-and street-scale urban simulations: development and first applications, Scientific Data, 11, 886, https://doi.org/10.1038/s41597-024-03719-w, 2024. a
Kawabata, T., Saya, A., Nishi, A., Seino, N., Hayashi, S., Ito, J., Ikuta, Y., and Seko, H.: Simulating a Thunderstorm using a High-Resolution Ensemble and an Urban Canopy Model: A Test Case for RDP Paris, SOLA, 21, 397–403, https://doi.org/10.2151/sola.2025-048, 2025. a
Kingfield, D. M., Calhoun, K. M., de Beurs, K. M., and Henebry, G. M.: Effects of city size on thunderstorm evolution revealed through a multiradar climatology of the central United States, J. Appl. Meteorol. Clim., 57, 295–317, https://doi.org/10.1175/JAMC-D-16-0341.1, 2018. a, b
Lin, Y., Min, Q., Zhuang, G., Wang, Z., Gong, W., and Li, R.: Spatial features of rain frequency change and pollution and associated aerosols, Atmos. Chem. Phys., 11, 7715–7726, https://doi.org/10.5194/acp-11-7715-2011, 2011. a
Lin, Y., Fan, J., Jeong, J.-H., Zhang, Y., Homeyer, C. R., and Wang, J.: Urbanization-induced land and aerosol impacts on storm propagation and hail characteristics, J. Atmos. Sci., 78, 925–947, https://doi.org/10.1175/JAS-D-20-0106.1, 2021. a, b, c, d
Liu, J. and Niyogi, D.: Meta-analysis of urbanization impact on rainfall modification, Scientific Reports, 9, 7301, https://doi.org/10.1038/s41598-019-42494-2, 2019. a, b
Lokoshchenko, M. A.: Urban heat island and urban dry island in Moscow and their centennial changes, J. Appl. Meteorol. Clim., 56, 2729–2745, 2017. a, b, c
Lorenz, J. M., Kronenberg, R., Bernhofer, C., and Niyogi, D.: Urban rainfall modification: Observational climatology over Berlin, Germany, J. Geophys. Res.-Atmos., 124, 731–746, https://doi.org/10.1029/2018JD028858, 2019. a, b
Luan, Q., Cao, Q., Huang, L., Liu, Y., and Wang, F.: Identification of the urban dry islands effect in Beijing: Evidence from satellite and ground observations, Remote Sensing, 14, 809, https://doi.org/10.3390/rs14040809, 2022. a, b, c
Luo, Z., Liu, J., Zhang, Y., Zhou, J., Shao, W., Yu, Y., and Jia, R.: Seasonal variation of dry and wet islands in Beijing considering urban artificial water dissipation, npj Climate and Atmospheric Science, 4, 58, https://doi.org/10.1016/j.jhydrol.2021.126618, 2021a. a, b
Luo, Z., Liu, J., Zhang, Y., Zhou, J., Yu, Y., and Jia, R.: Spatiotemporal characteristics of urban dry/wet islands in China following rapid urbanization, J. Hydrol., 601, 126618, https://doi.org/10.1016/j.jhydrol.2021.126618, 2021b. a
Manzato, A., Serafin, S., Miglietta, M. M., Kirshbaum, D., and Schulz, W.: A pan-Alpine climatology of lightning and convective initiation, Mon. Weather Rev., 150, 2213–2230, https://doi.org/10.1175/MWR-D-21-0149.1, 2022. a
Markowski, P. M. and Dotzek, N.: A numerical study of the effects of orography on supercells, Atmos. Res., 100, 457–478, https://doi.org/10.1016/j.atmosres.2010.12.027, 2011. a, b, c
Martilli, A., Clappier, A., and Rotach, M. W.: An urban surface exchange parameterisation for mesoscale models, Bound.-Lay. Meteorol., 104, 261–304, https://doi.org/10.1023/A:1016099921195, 2002. a, b
Meili, N., Paschalis, A., Manoli, G., and Fatichi, S.: Diurnal and seasonal patterns of global urban dry islands, Environ. Res. Lett., 17, 054044, https://doi.org/10.1088/1748-9326/ac68f8, 2022. a, b, c, d
Mlawer, E. J., Taubman, S. J., Brown, P. D., Iacono, M. J., and Clough, S. A.: Radiative transfer for inhomogeneous atmospheres: RRTM, a validated correlated-k model for the longwave, J. Geophys. Res.-Atmos., 102, 16663–16682, https://doi.org/10.1029/97JD00237, 1997. a
Moraglia, G., Pryor, S., and Crippa, P.: Quantifying the impacts of an urban area on clouds and precipitation patterns: A modeling perspective, J. Geophys. Res.-Atmos., 129, e2024JD041402, https://doi.org/10.1029/2024JD041402, 2024. a
Morrison, H., Thompson, G., and Tatarskii, V.: Impact of Cloud Microphysics on the Development of Trailing Stratiform Precipitation in a Simulated Squall Line: Comparison of One- and Two-Moment Schemes, Mon. Weather Rev., 137, 991–1007, https://doi.org/10.1175/2008MWR2556.1, 2009. a
Naylor, J.: Idealized simulations of city-storm interactions in a two-dimensional framework, Atmosphere, 11, 707, https://doi.org/10.3390/atmos11070707, 2020. a
Naylor, J. and Mulholland, J.: The impact of vertical wind shear on the outcome of interactions between squall lines and cities, J. Geophys. Res.-Atmos., 128, e2022JD037237, https://doi.org/10.1029/2022JD037237, 2023. a, b
Naylor, J., Berry, M. E., and Gosney, E. G.: Idealized Simulations of a Supercell Interacting with an Urban Area, Meteorology, 3, 97–113, https://doi.org/10.3390/meteorology3010005, 2024. a, b
NCAR: Weather Research and Forecasting (WRF) Model, version 4.6.0, NCAR/UCAR [code], https://doi.org/10.5065/D6MK6B4K, 2026. a
Niu, G.-Y., Yang, Z.-L., Mitchell, K. E., Chen, F., Ek, M. B., Barlage, M., Kumar, A., Manning, K., Niyogi, D., Rosero, E., Tewari, M., and Xia, Y.: The community Noah land surface model with multiparameterization options (Noah-MP): 1. Model description and evaluation with local-scale measurements, J. Geophys. Res.-Atmos., 116, https://doi.org/10.1029/2010JD015139, 2011. a
Nowotarski, C. J., Markowski, P. M., Richardson, Y. P., and Bryan, G. H.: Properties of a Simulated Convective Boundary Layer in an Idealized Supercell Thunderstorm Environment, Mon. Weather Rev., 142, 3955–3976, https://doi.org/10.1175/MWR-D-13-00349.1, 2014. a
Oke, T. R.: The energetic basis of the urban heat island, Q. J. Roy. Meteor. Soc., 108, 1–24, https://doi.org/10.1002/qj.49710845502, 1982. a
Oke, T. R.: The urban energy balance, Prog. Phys. Geog., 12, 471–508, 1988. a
Pappaccogli, G., Giovannini, L., Zardi, D., and Martilli, A.: Sensitivity analysis of urban microclimatic conditions and building energy consumption on urban parameters by means of idealized numerical simulations, Urban Climate, 34, 100677, https://doi.org/10.1016/j.uclim.2020.100677, 2020. a
Platonov, V., Varentsov, M., Yarinich, Y. I., Shikhov, A., and Chernokulsky, A.: A large mid-latitude city intensifies severe convective events: Evidence from long-term high-resolution simulations, Urban Climate, 54, 101837, https://doi.org/10.1016/j.uclim.2024.101837, 2024. a
Reames, L. J. and Stensrud, D. J.: Influence of a Great Plains urban environment on a simulated supercell, Mon. Weather Rev., 146, 1437–1462, https://doi.org/10.1175/MWR-D-17-0284.1, 2018. a, b, c, d, e, f, g
Romine, G. S., Schwartz, C. S., Berner, J., Fossell, K. R., Snyder, C., Anderson, J. L., and Weisman, M. L.: Representing forecast error in a convection-permitting ensemble system, Mon. Weather Rev., 142, 4519–4541, https://doi.org/10.1175/MWR-D-14-00100.1, 2014. a
Rotunno, R. and Klemp, J. B.: The influence of the shear-induced pressure gradient on thunderstorm motion, Mon. Weather Rev., 110, 136–151, https://doi.org/10.1175/1520-0493(1982)110<0136:TIOTSI>2.0.CO;2, 1982. a
Rozoff, C. M., Cotton, W. R., and Adegoke, J. O.: Simulation of St. Louis, Missouri, land use impacts on thunderstorms, J. Appl. Meteorol. Clim., 42, 716–738, https://doi.org/10.1175/1520-0450(2003)042<0716:SOSLML>2.0.CO;2, 2003. a, b
Rozoff, C. M., Nolan, D. S., Bryan, G. H., Hendricks, E. A., and Knievel, J. C.: Large-eddy simulations of the tropical cyclone boundary layer at landfall in an idealized urban environment, J. Appl. Meteorol. Clim., 62, 1457–1478, https://doi.org/10.1175/JAMC-D-23-0024.1, 2023. a
Sabatino, S. D., Barbano, F., Brattich, E., and Pulvirenti, B.: The multiple-scale nature of urban heat island and its footprint on air quality in real urban environment, Atmosphere, 11, 1186, https://doi.org/10.3390/atmos11111186, 2020. a
Salamanca, F., Krpo, A., Martilli, A., and Clappier, A.: A new building energy model coupled with an urban canopy parameterization for urban climate simulations – part I. formulation, verification, and sensitivity analysis of the model, Theor. Appl. Climatol., 99, 331–344, https://doi.org/10.1007/s00704-009-0142-9, 2010. a
Seino, N., Oda, R., Sugawara, H., and Aoyagi, T.: Observations and simulations of the mesoscale environment in TOMACS urban heavy rain events, J. Meteorol. Soc. Jpn., Ser. II, 96A, 221–245, https://doi.org/10.2151/jmsj.2018-029, 2018. a
Shen, Y. and Yang, L.: Divergent urban signatures in rainfall anomalies explained by pre-storm environment contrast, Geophys. Res. Lett., 50, e2022GL101658, https://doi.org/10.1029/2022GL101658, 2023. a, b, c
Shepherd, J. M.: Impacts of urbanization on precipitation and storms: Physical insights and vulnerabilities, Climate Vulnerability, 5, 109–125, https://doi.org/10.1016/B978-0-12-384703-4.00503-7, 2013. a
Shepherd, J. M., Pierce, H., and Negri, A. J.: Rainfall modification by major urban areas: Observations from spaceborne rain radar on the TRMM satellite, J. Appl. Meteorol., 41, 689–701, https://doi.org/10.1175/1520-0450(2002)041<0689:RMBMUA>2.0.CO;2, 2002. a
Skamarock, W. C., Klemp, J. B., Dudhia, J., Gill, D. O., Liu, Z., Berner, J., Wang, W., Powers, J. G., Duda, M. G., Barker, D. M., and Huang, X.-Y.: A description of the advanced research WRF version 4, NCAR tech. note ncar/tn–556+str, 145 pp., https://doi.org/10.5065/1dfh-6p97, 2019. a, b
Swain, M., Peña, J. C., Bornstein, R. D., and González-Cruz, J. E.: Coastal and anthropogenic heat impacts on PBL processes during extreme summer thunderstorm precipitation in New York City, Urban Climate, 62, 102534, https://doi.org/10.1016/j.uclim.2025.102534, 2025. a
Terwey, W. D. and Rozoff, C. M.: Objective convective updraft identification and tracking: Part 1. Structure and thermodynamics of convection in the rainband regions of two hurricane simulations, J. Geophys. Res.-Atmos., 119, 6470–6496, https://doi.org/10.1002/2013JD020904, 2014. a, b
Thielen, J. and Gadian, A.: Influence of topography and urban heat island effects on the outbreak of convective storms under unstable meteorological conditions: a numerical study, Meteorol. Appl., 4, 139–149, https://doi.org/10.1017/S1350482797000303, 1997. a
Torelló-Sentelles, H., Koukoula, M., Villarini, G., Marra, F., and Peleg, N.: When storms slow down: urban effects on rainfall accumulation and flood hazard, npj Natural Hazards, 2, 106, https://doi.org/10.1038/s44304-025-00158-4, 2025. a, b
Tuckman, P. and Emanuel, K.: Origins of Extreme CAPE around the World, J. Geophys. Res.-Atmos., 129, e2024JD041833, https://doi.org/10.1029/2024JD041833, 2024. a
Virtanen, P., Gommers, R., Oliphant, T. E., Haberland, M., Reddy, T., Cournapeau, D., Burovski, E., Peterson, P., Weckesser, W., Bright, J., van der Walt, S. J., Brett, M., Wilson, J., Millman, K. J., Mayorov, N., Nelson, A. R. J., Jones, E., Kern, R., Larson, E., Carey, C. J., Polat, İ., Feng, Y., Moore, E. W., VanderPlas, J., Laxalde, D., Perktold, J., Cimrman, R., Henriksen, I., Quintero, E. A., Harris, C. R., Archibald, A. M., Ribeiro, A. H., Pedregosa, F., van Mulbregt, P., and SciPy 1.0 Contributors: SciPy 1.0: Fundamental Algorithms for Scientific Computing in Python, Nat. Methods, 17, 261–272, https://doi.org/10.1038/s41592-019-0686-2, 2020. a
Wang, J., Feng, J., Yan, Z., Hu, Y., and Jia, G.: Nested high-resolution modeling of the impact of urbanization on regional climate in three vast urban agglomerations in China, J. Geophys. Res.-Atmos., 117, https://doi.org/10.1029/2012JD018226, 2012. a, b
Wang, Z., Song, J., Chan, P. W., and Li, Y.: The urban moisture island phenomenon and its mechanisms in a high-rise high-density city, Int. J. Climatol., 41, E150–E170, https://doi.org/10.1002/joc.6672, 2021. a
Weisman, M. L. and Klemp, J. B.: The dependence of numerically simulated convective storms on vertical wind shear and buoyancy, Mon. Weather Rev., 110, 504–520, https://doi.org/10.1175/1520-0493(1982)110<0504:TDONSC>2.0.CO;2, 1982. a, b
Wurman, J., Alexander, C., Robinson, P., and Richardson, Y.: Low-level winds in tornadoes and potential catastrophic tornado impacts in urban areas, B. Am. Meteorol. Soc., 88, 31–46, https://doi.org/10.1175/BAMS-88-1-31, 2007. a
Yang, L., Tian, F., Smith, J. A., and Hu, H.: Urban signatures in the spatial clustering of summer heavy rainfall events over the Beijing metropolitan region, J. Geophys. Res.-Atmos., 119, 1203–1217, https://doi.org/10.1002/2013JD020762, 2014. a, b
Yang, L., Li, Q., Yuan, H., Niu, Z., and Wang, L.: Impacts of urban canopy on two convective storms with contrasting synoptic conditions over Nanjing, China, J. Geophys. Res.-Atmos., 126, e2020JD034509, https://doi.org/10.1029/2020JD034509, 2021a. a, b
Yang, L., Ni, G., Tian, F., and Niyogi, D.: Urbanization Exacerbated Rainfall Over European Suburbs Under a Warming Climate, Geophys. Res. Lett., 48, e2021GL095987, https://doi.org/10.1029/2021GL095987, 2021b. a, b, c
Yang, L., Yang, Y., Shen, Y., Yang, J., Zheng, G., Smith, J., and Niyogi, D.: Urban development pattern’s influence on extreme rainfall occurrences, Nat. Commun., 15, 3997, https://doi.org/10.1038/s41467-024-48533-5, 2024. a
Yang, Z.-L., Niu, G.-Y., Mitchell, K. E., Chen, F., Ek, M. B., Barlage, M., Longuevergne, L., Manning, K., Niyogi, D., Tewari, M., and Xia, Y.: The community Noah land surface model with multiparameterization options (Noah-MP): 2. Evaluation over global river basins, J. Geophys. Res.-Atmos., 116, https://doi.org/10.1029/2010JD015140, 2011. a
Zhang, Y., Miao, S., Dai, Y., and Bornstein, R.: Numerical simulation of urban land surface effects on summer convective rainfall under different UHI intensity in Beijing, J. Geophys. Res.-Atmos., 122, 7851–7868, https://doi.org/10.1002/2017JD026614, 2017. a
Zhang, Z., He, C., Chen, F., Miguez-Macho, G., Liu, C., and Rasmussen, R.: US Corn Belt enhances regional precipitation recycling, P. Natl. Acad. Sci. USA, 122, e2402656121, https://doi.org/10.1073/pnas.2402656121, 2025. a
Zhou, B., Simon, J. S., and Chow, F. K.: The convective boundary layer in the terra incognita, J. Atmos. Sci., 71, 2545–2563, 2014. a
Zhou, B., Rybski, D., and Kropp, J. P.: The role of city size and urban form in the surface urban heat island, Scientific reports, 7, 4791, https://doi.org/10.1038/s41598-017-04242-2, 2017. a
Zonato, A., Martilli, A., Gutierrez, E., Chen, F., He, C., Barlage, M., Zardi, D., and Giovannini, L.: Exploring the effects of rooftop mitigation strategies on urban temperatures and energy consumption, J. Geophys. Res.-Atmos., 126, e2021JD035002, https://doi.org/10.1029/2021JD035002, 2021. a, b, c, d, e
Lower values of soil moisture caused the development of an excessively dry PBL that suppressed deep moist convection.
Note that the thermal inversion and moisture decrease associated with an EML are usually located at an elevation higher than the LCL. We place them at the LCL because the daytime growth of the PBL lifts the hygrothermal discontinuity to a more realistic elevation.
Θ shows a positive trend. This is because the cold pools weaken as the storm weakens, leading to less pronounced negative Θ anomalies associated with downdrafts – i.e., a relative increase in Θ.
Note, however, that a positive trend in vertical vorticity at 850 and 700 hPa is observed in the city region, with statistical significance at 850 hPa.
The temporary reduction of UH over the city may be associated with a transition phase of the simulated supercell. During this stage, the storm may be more sensitive to environmental differences. However, since the only environmental differences in our experiments are urban-induced, this effect is expected to have a limited impact on the results.
- Abstract
- Introduction
- Method
- Results: Supercell sensitivity to the urban morphological parameters
- Results: Sensitivity of the pre-storm environment to the urban morphological parameters
- Discussion
- Conclusions
- Code and data availability
- Author contributions
- Competing interests
- Disclaimer
- Acknowledgements
- Financial support
- Review statement
- References
- Supplement
- Abstract
- Introduction
- Method
- Results: Supercell sensitivity to the urban morphological parameters
- Results: Sensitivity of the pre-storm environment to the urban morphological parameters
- Discussion
- Conclusions
- Code and data availability
- Author contributions
- Competing interests
- Disclaimer
- Acknowledgements
- Financial support
- Review statement
- References
- Supplement