
the Creative Commons Attribution 4.0 License.
the Creative Commons Attribution 4.0 License.
 | 29 Oct 2026
Climate change effects on analogues of contrasting extratropical cyclones over the UK, Ireland and France
Farrell Morgan
Ben Harvey
Kevin Hodges
Oscar Martínez-Alvarado

Extreme extratropical cyclones present major socio-economic risks in the mid-latitudes and are sensitive to anthropogenic climate change. Robust projections of the aggregate properties of extreme cyclones based on climate-model output have emerged in recent years. However, such projections group together cyclones with a range of contrasting dynamical characteristics potentially obscuring climate change effects on particular types of cyclones. Here, we adopt the cyclone track analogue approach to examine the influence of climate change on four contrasting historical cyclones impacting the UK, Ireland and France: the Great Storm in October 1987, Martin in December 1999, Ophelia in October 2017, and Arwen in November 2021. Analogues are identified in the recently-produced CANARI large ensemble simulations for both the present climate (1980–2010) and a high-emission future scenario (SSP3–7.0, 2070–2100).
Averaged across the four cases, the overall number of analogue cyclones decreases in future while the intensity of the most extreme cyclones increase, in both precipitation rate and lower-tropospheric wind speed, aligning well with consensus cyclone projections. However, the four cases exhibit contrasting responses, indicating that cyclone-specific changes under anthropogenic warming can diverge from the aggregate signal. For example, there is a marked future increase in the number of cyclones with a path similar to the Great Storm. Such changes are likely driven by regional variations in the conditions for baroclinic growth. Since individual cyclones are typically associated with distinct meteorological hazards, accounting for cyclone-specific responses is critical for assessing regional impacts and developing adaptation strategies.
- Article
(12587 KB) - Full-text XML
- BibTeX
- EndNote


Extratropical cyclones transport momentum, moisture and energy from subtropical to higher latitudes. They are responsible for most of the weather variability in the mid-latitudes and are often associated with meteorological hazards such as damaging winds (Owen et al., 2021; Browning, 2004) and flooding events (Hawcroft et al., 2012; Pfahl et al., 2017). Given these important societal impacts and in order to help shape practical adaptation responses to climate change, it is vital to improve our understanding of the likely changes that these phenomena will experience as the climate warms not only globally but at the regional and local levels.
Several studies have investigated how anthropogenic climate change will influence the behaviour of cyclones (Bengtsson et al., 2009; Priestley and Catto, 2022; Lehmann et al., 2014). The frequency, preferred pathways, and intensity of cyclones are expected to respond primarily to changes in the meridional temperature gradients in both the lower and upper troposphere (Shaw et al., 2016). Additional influences include adjustments to the vertical temperature profile and diabatic heating rates (Catto et al., 2011). The multi-model mean of successive generations of the Coupled Model Intercomparison Project (CMIP) broadly agree on the large-scale spatial pattern of these changes in the North Atlantic (Harvey et al., 2020); however, substantial inter-model differences remain (Zappa and Shepherd, 2017). A common signal is a summer reduction in cyclone activity, particularly across southern parts of Europe, and a winter tripole pattern marked by increased storminess over the British and Irish Isles but reduced activity in the Mediterranean and Norwegian Sea regions (Zappa et al., 2013; Priestley et al., 2020).
Evidence also suggests that the dynamical intensity, i.e. the cyclone intensity measured by a dynamical variable such as minimum sea-level pressure (SLP) (Bengtsson et al., 2009; Mizuta et al., 2011) or relative vorticity (Priestley and Catto, 2022), of the most extreme cyclones will increase under climate change. Nevertheless, the magnitude of change remains uncertain and depends strongly on the choice of intensity metric used (Ulbrich et al., 2009). The meteorological hazards associated with extreme cyclones are also projected to increase. Extreme wind speeds are projected to intensify, particularly along both cold and warm conveyor belt airstreams (Sinclair et al., 2020; Dolores-Tesillos et al., 2022; Priestley and Catto, 2022; Gentile et al., 2023, 2025). Similarly, extreme precipitation associated with cyclones is expected to intensify, with projected increases of 20 %–50 % for the most intense events (Sinclair et al., 2020). However, considerable uncertainty remains in future projections of cyclone trends due to competing thermodynamic influences on North Atlantic baroclinicity (Shaw et al., 2016), poor representation of mesoscale and diabatic processes in global climate models (GCMs) (Schemm, 2023), distinguishing natural variability from the forced signal (Deser et al., 2012) and scenario uncertainty (Hawkins and Sutton, 2009).
Although examining general trends in this way is important for obtaining a broad appreciation of the likely changes cyclones will undergo in the future, there is a gap in understanding how specific types of impactful cyclones will be affected by climate change. This is because broad-scale trends in cyclone frequency and intensity cannot fully capture local variations or the unique combinations of processes that may shape individual cyclones. Specific cyclones, and specific impacts, often arise from complex and non-linear interactions between large-scale dynamics and mesoscale features, including local topography, ocean circulation, and diabatic feedbacks (Ginesta et al., 2024). As a result, general assessments of cyclone trends may mask divergent responses of different cyclone types, or driving mechanisms, to climate change.
To address this gap, in this study we investigate climate change effects on four contrasting extratropical cyclones that have impacted the UK, Ireland and France. These cyclones are contrasting in the sense that their paths exhibit characteristics that are different from each other and from the conceptual cyclone-development path, i.e. a cyclone developing in the central Atlantic and propagating eastwards with a northwards tilt. Our investigation is based on a recently developed approach, the cyclone analogue methodology (Ginesta et al., 2024), albeit with some adaptations to make it more suitable to the aims of this study. The method of cyclone track analogues involves finding cyclone events with comparable paths in climate simulations under present-day conditions and in projections of the future climate. These cyclones with similar paths are termed analogues (Ginesta et al., 2024). This approach simultaneously enables analysis of the impact of climate change on the frequency and intensity of cyclones with similar tracks, whilst providing an understanding of the meteorological conditions contributing to the event (Ginesta et al., 2024). Ginesta et al. (2024) applied the cyclone track analogues approach to the study of explosive European cyclones Alex, Xynthia and Eunice, finding a decline in the overall number of analogues in the future, alongside an increase in the number of explosive analogues. They also noted an increase in precipitation and wind severity over land, signalling increased meteorological hazards.
This study is situated within the CANARI (Climate Change in the Arctic–North Atlantic Region and Impacts on the UK) research programme aimed at improving our understanding of the impacts on the UK due to changes in the Arctic–North Atlantic region as the climate warms (Schiemann et al., 2026a). As part of CANARI a new large ensemble of climate simulations, the CANARI Large Ensemble (hereafter CANARI LE), has been produced (Schiemann et al., 2026a). This study utilises the CANARI LE to examine the influence of climate change on four contrasting historical high-impact cyclones impacting the UK, Ireland and France, assessed through the following research questions:
-
How well does the CANARI LE simulate analogues of the four case study cyclones?
-
How does the frequency of the cyclone analogues change in future?
-
How do the dynamical intensity and meteorological hazards associated with the cyclone analogues change in future?
-
What are the underlying dynamical factors causing these projected changes?
The rest of the paper is organised as follows: Sect. 2 summarises each of the four historical cyclones examined, highlighting their contrasting characteristics. Section 3 describes the data and methods used, emphasising the differences between our methodology and that of Ginesta et al. (2024). Section 4 provides a general assessment of the representation of extratropical cyclones in the CANARI LE. Section 5 analyses biases and future changes in the frequency of cyclone analogues in the CANARI LE. Section 6 provides a comparative composite analysis for key intensity metrics and dynamical drivers in the present-day and future simulations. Section 7 summarises the projected changes for each case-study cyclone, highlighting the implications of cyclone-specific responses for adaptation and mitigation strategies.
In this section, the four historical cyclones under investigation are described together with a brief overview of their impacts and synoptic conditions.
2.1 Martin
Storm Martin was the last of three cyclones hitting central Europe in December 1999, just one day after cyclone Lothar, claiming more than 100 lives and USD 6 billion of economic losses (Ulbrich et al., 2001; Bresch et al., 2000). Martin impacted France and while it did not hit the UK directly, winds along the south coast of England still reached around 30 m s−1 (Bresch et al., 2000). Martin formed as a surface low over the North Atlantic on 25 December. It then propagated north-eastwards along an upper-level trough's eastern flank. Interaction with an upper-level depression moving eastward from Newfoundland caused Martin to move rapidly across the Atlantic. At 15:00 UTC on 27 December, a central pressure of 965 hPa was recorded just before the cyclone made landfall south of Brittany (Fig. 1a). Martin was responsible for flooding along the Atlantic coast and extreme gusts over 40 m s−1, causing disruption to transport and electricity grids which lasted for days.
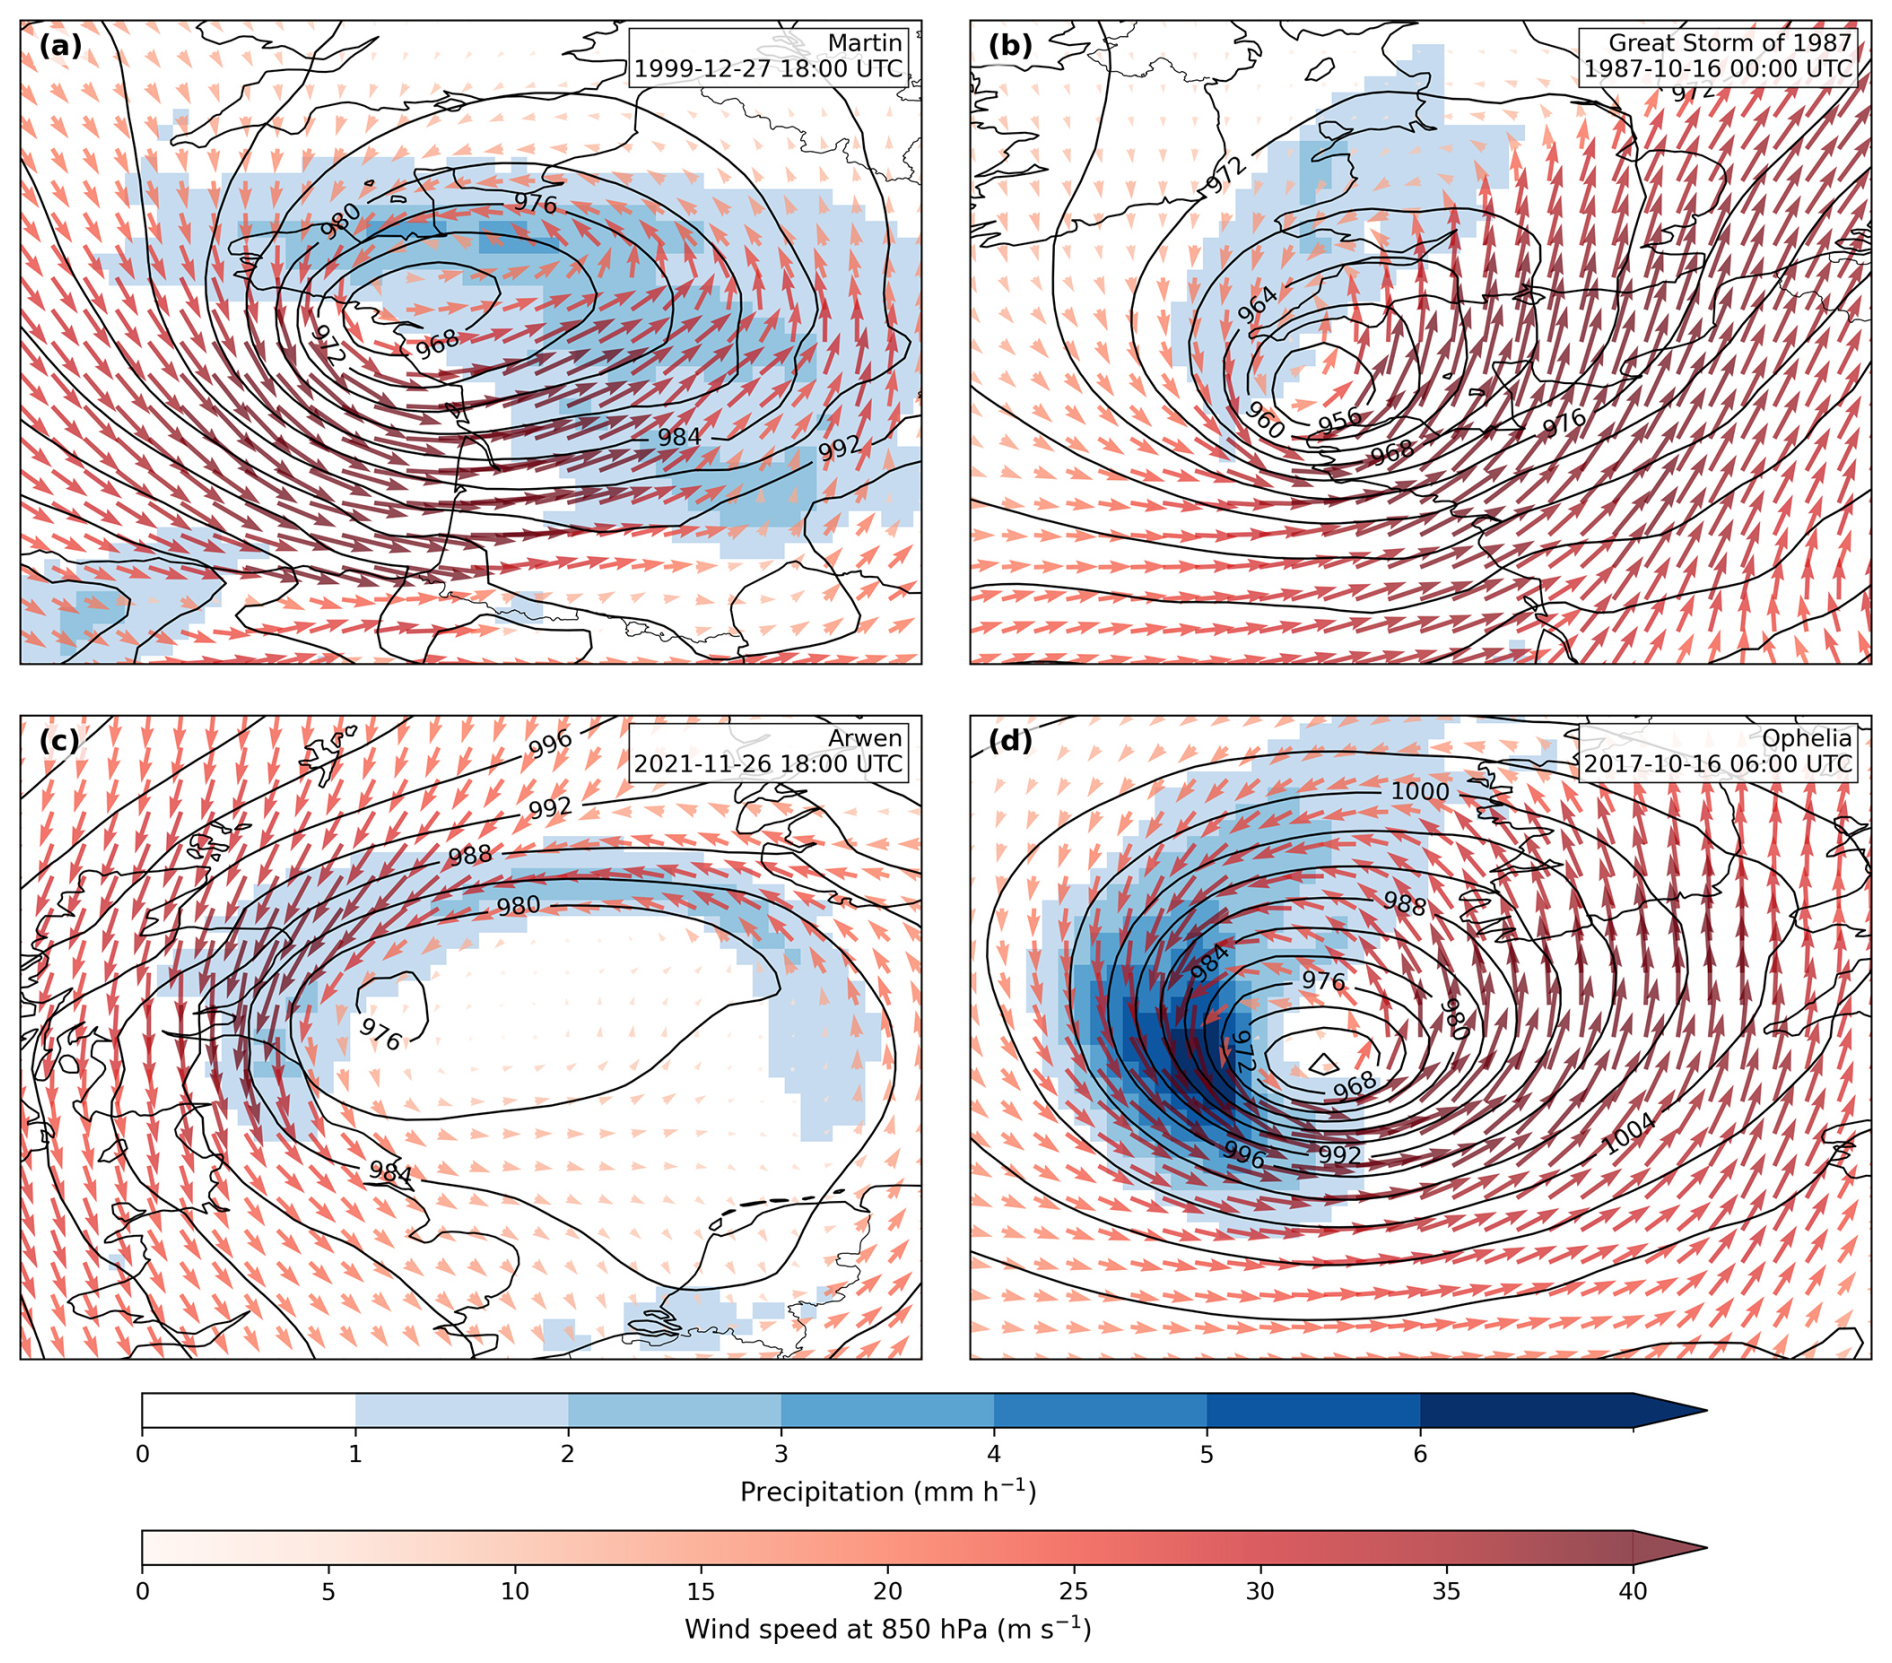
Figure 1Sea-level pressure (hPa; black contours), 6-h mean precipitation rate (mm h−1; shading for values ≥1 mm h−1), and 850-hPa wind (m s−1); coloured wind vectors for (a) Storm Martin, (b) the Great Storm of 1987, (c) Storm Arwen, and (d) cyclone Ophelia from ERA5 reanalysis. The times shown correspond approximately to the hour of peak intensity for each cyclone, as measured by T42 850 hPa relative vorticity.
The most unusual aspect of Martin's development was the vertical alignment between the the low- and upper-level jets. This is a rare phenomenon, forming alongside an anomalously zonal and strong upper-level jet. This likely caused the formation of a baroclinic critical region of enhanced interaction between surface and upper-level features (Rivière et al., 2010). Additionally, there was a broad band of very high baroclinicity over the central North Atlantic, and an airmass of anomalously high equivalent potential temperature south of the track, both of which likely enhanced cyclone intensification (Ulbrich et al., 2001).
2.2 The Great Storm of 1987
The Great Storm of 1987 is often considered to be the most impactful cyclone to affect the south of England since 1703 (Burt and Mansfield, 1988). On the night of 15–16 October 1987 a vigorous depression crossed southern England causing severe damage (Fig. 1b). Pressure dropped to 956 hPa and wind gusts over 60 m s−1 were observed after midnight off the coast of Brittany and even well inland gusts exceeded 40 m s−1 (Burt and Mansfield, 1988). The Great Storm was also the first storm in which the sting-jet phenomenon, a localised region of descending winds with the potential to cause strong near-surface winds and wind gusts, was identified (Browning, 2004; Clark et al., 2005; Clark and Gray, 2018). The socio-economic impacts due to the extreme winds associated with the Great Storm include at least 18 people losing their lives, millions of trees blown over and an economic loss of millions of pounds (Burt and Mansfield, 1988). Similar to Martin, there was a band of exceptionally high baroclinicity over the central North Atlantic (Ulbrich et al., 2001). Additionally, a particularly strong jet stream, located much farther south than normal, increased the speed of the cyclone over the North Atlantic before the cyclone tracked northwards over southern England. The cyclone then deepened again as it moved between Scotland and Norway, causing severe gales over the North Sea and Norway.
2.3 Arwen
Storm Arwen was one of the most damaging winter cyclones of the last decade, causing heavy snowfall and wind gusts over 40 m s−1 as it crossed the UK overnight on 26–27 November 2021 (Fig. 1c). Arwen originated as a trough over the Great Lakes region of North America on 22 November, before the developing system propagated eastward across Greenland and changed direction, tracking almost directly south over the north of the UK (Smart et al., 2021). This trajectory likely exacerbated damages to infrastructure because strong winds associated with severe cyclones are typically westerly, and there was low preparedness for extreme northerly winds (Met Office, 2021). As a result, over one million homes experienced a loss of power. Significant coastal flooding was avoided due to low astronomical tides; however future analogues may see significant impacts related to storm surges. The insured industry loss has been estimated as less than EUR 200 million (PERILS, 2026).
2.4 Ophelia
Ophelia was a post-tropical cyclone (PTC) associated with distinct atmospheric conditions and meteorological hazards (Gray, 1979; Sainsbury et al., 2020). PTCs rarely make landfall in Europe but can be associated with disproportionately high impacts: they originate as tropical cyclones (TCs) and undergo extratropical transition (ET) as they move poleward into baroclinic environments, a process that can strongly perturb the mid-latitude flow and amplify high-impact weather downstream (Ali et al., 2025; Bieli et al., 2020; Keller et al., 2019; Sainsbury et al., 2020). Storm Ophelia developed and intensified unusually far east in the subtropical North Atlantic, supported by anomalously warm sea-surface temperatures (Met Éireann, 2018). During its evolution, Ophelia remained nearly stationary, becoming embedded within a mid-to-upper-level trough, then accelerated northeast, completing ET around midnight on 15–16 October (Guisado-Pintado and Jackson, 2018). It then made landfall in Ireland on 16 October 2017 (Fig. 1d). Gusts exceeding 53 m s−1 were recorded off County Cork, Ireland. Impacts also included thunderstorms, flooding, and extensive power outages (Met Éireann, 2018; Guisado-Pintado and Jackson, 2019) and insured property market loss of EUR 60 million (PERILS, 2017).
3.1 Datasets
This study utilises the CANARI LE (Schiemann et al., 2026a), a 40-member ensemble using the HadGEM3-GC3.1-MM global coupled model (Williams et al., 2018) as used in CMIP6 and covering years 1950–2100. The atmosphere component uses the N216 grid (60 km grid spacings in the mid latitudes) and the ocean component uses the ORCA ° grid. The climate forcing applied is the historical CMIP6 protocol for years 1950–2014 followed by the SSP3-7.0 scenario for years 2015–2100. The SSP3-7.0 scenario combines the SSP3 narrative of regional rivalry, slow economic growth, and high aerosol emissions with moderate-to-high greenhouse gas emissions. Recent criticisms have suggested that future emissions are unlikely to follow the highest pathway of SSP5-8.5 in light of recent mitigation efforts (Shiogama et al., 2023). Therefore the future projections in this study arguably represent a plausible worst case scenario of climate change.
Evaluations of HadGEM3-GC3.1-MM indicate that the model simulates many aspects of cyclone behaviour realistically, including jet structure, cyclone track frequency, genesis rates, and intensity (Palmer et al., 2023; Priestley et al., 2020), but also exhibits common biases associated with GCMs, such as blocking errors and a northward displacement of summer cyclones (Williams et al., 2018). Schiemann et al. (2026a) evaluate the model's historical ensemble performance against ERA5 reanalysis (Hersbach et al., 2020), finding that the model reproduces the mean eddy-driven jet well, including its tilt. This is a feature often misrepresented in GCMs but critical for capturing cyclone paths. The model also captures mean cyclone intensity well, with only a small negative bias over the North Atlantic sub-polar gyre relative to ERA5 (Schiemann et al., 2026a). Additionally, a performance-based assessment of CMIP6 models for Europe, showed that the model satisfactorily represented many components of the atmosphere realistically including blocking and cyclone track frequency (Palmer et al., 2023). Overall, HadGEM3-GC3.1-MM has been shown to represent cyclones well in historical simulations, giving confidence in its projections of future cyclone analogues.
The ERA5 global reanalysis dataset, produced by the European Centre for Medium-Range Weather Forecasts (Hersbach et al., 2020), is used to verify the performance of the CANARI LE in simulating North Atlantic cyclone tracks. Reanalysis products are often used to verify the performance of models in this way as they provide a coherent spatial and temporal structure, representing a best estimate for the atmospheric state since 1950 (Priestley et al., 2020). There are various other reanalysis products available; however, modern reanalyses typically compare well to each other in the Northern Hemisphere (e.g. Hodges et al., 2011). It has been found, for instance, that ERA5, the Climate Forecast System Reanalysis (Saha et al., 2010) and its operational successor, the Climate Forecast System version 2 (Saha et al., 2014), are all capable to reproduce similar storm tracks with a cyclone matching success rate of 92.3 % over the Northern Hemisphere (Gramcianinov et al., 2020). Furthermore, the differences between reanalysis products are significantly less than the differences between GCMs (Ulbrich et al., 2009).
3.2 Methods
3.2.1 Cyclone tracking
For cyclone identification and tracking, this study follows the methods used in Hoskins and Hodges (2002) based on the TRACK algorithm (Hodges, 1994, 1995, 1999). Cyclones are identified and tracked using 6 h 850 hPa relative vorticity (RV) throughout the year. To identify cyclones in the 850 hPa RV field, this is first truncated at total wave number 42 (triangular truncation T42), by expanding in spherical harmonics, to remove small-scale noise while retaining synoptic-scale features. The large scale background is also removed by setting the total wave numbers 0–5 to zero, and a spectral tapering is applied to further reduce spurious oscillations (Hoskins and Hodges, 2002). Cyclones are first identified as grid point maxima, which are then used as starting points for a steepest ascent maximisation applied to the B-spline interpolated filtered RV field to find the off-grid maxima. The tracking itself is performed by first initialising a set of tracks using the identified maxima and a nearest neighbour method. The initial set of tracks is then refined to produce the smoothest set of tracks using the minimisation of a cost function for track smoothness, subject to adaptive constraints on the track smoothness displacement distance in a time step suitably chosen for extratropical cyclones (Hodges, 1999). The minimization proceeds forwards and backwards in time. Once the tracks have been identified, other variables are added to them, including mean sea level pressure minima using a steepest descent minimization, B-spline interpolation and 5° search radius as well as maximum 10 m winds and 850 hPa winds using a grid point search within a 5° radius. The area average precipitation is also added over a 5° spherical region. Finally the tracks are filtered to retain those that last longer than 2 d and travel further than 1000 km.
3.2.2 Cyclone track analogues
This study uses the method of cyclone track analogues of Ginesta et al. (2024) to find similar cyclone tracks to Martin, the Great Storm, Arwen and Ophelia. The method is applied to the 75 years of ERA5 (1950–2014) and across 1200 simulated years of present and future climate from the CANARI LE, from 1980 to 2010 in the present-day climate period, and from 2070 to 2100 in the future climate period. To ensure that only cyclones with similar development stages are considered, a filtering procedure is applied based on the following criteria:
-
An initial filter is applied so that tracks must have at least 4 data points (24 h) preceding the time of track-maximum RV. Additionally, the weakest tracks, defined as those with a maximum RV of less than are removed.
-
Tracks are then selected if they reach maximum RV within a 300 km radius of the target cyclone's position of maximum RV. These cyclones are termed candidate cyclones.
-
The average distance between each candidate track in the CANARI LE and the historical cyclone in ERA5 is computed across the 4 data points preceding maximum RV plus the time of maximum RV. Candidate tracks with an average distance less than 500 km are defined as analogue tracks, approximately corresponding to the 25 %–35 % of cyclones with the most similar paths during the development stage. The choice of the 500 km threshold represents a balance between identifying cyclone tracks that closely resemble the historical cyclone whilst maintaining a sufficiently large sample size to enable statistical analysis. Sensitivity experiments, varying the threshold from 300 to 700 km in 50 km increments, does not significantly impact the results.
-
Extreme analogues are then defined as analogue tracks with a maximum RV greater than or equal to the 90th percentile of all Northern Hemisphere tracks in ERA5 during 1980–2010 (). By applying a constant threshold across all three datasets (ERA5 and CANARI present and future) we ensure that the definition of an extreme storm does correspond to an impactful storm in the real world. This choice also allows the quantification of biases between ERA5 and the CANARI LE in terms of the number of storms surpassing this threshold. We find that the difference in percentile values between datasets is not large: The chosen value corresponds to the 83rd percentile when only ERA5 cyclones within the North-Atlantic–Europe (NAE) region are considered, and to the 86th percentile when CANARI LE NAE cyclones in both the present and future periods are considered (see Fig. 4).
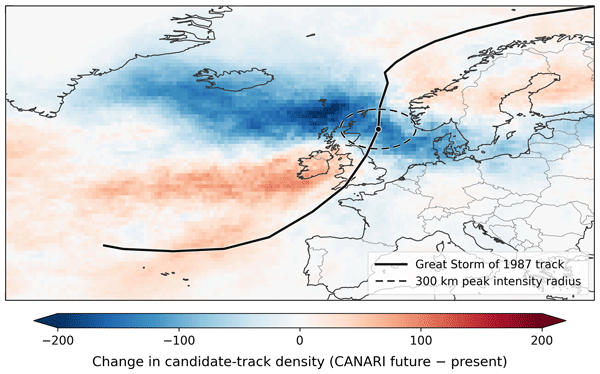
The approach used here closely follows the method of Ginesta et al. (2024); however, there are important methodological differences. Critically, analogues are defined in terms of a fixed average distance threshold (500 km) valid in both datasets (ERA5 and the CANARI-LE) and both periods (present-day and future climate) instead of the percentile-based distance threshold used in Ginesta et al. (2024), which varies with the time period considered. This allows for the separate analysis of changes in candidate cyclones and analogue cyclones, enabling future changes in analogue frequency to be decomposed into changes in regional track densities as well as changes in the path of cyclones impacting that region. For example, Fig. 2 shows the track density of candidate cyclones of the Great Storm. There is a clear reduction in the number of candidate cyclones in the future, following regional cyclone track density trends. Under the percentile-based distance threshold of Ginesta et al. (2024), therefore, the number of analogues of the Great Storm would also reduce in future, by the same fraction. However, when using a fixed distance threshold, we find an increase in the number of analogues of the Great Storm (see Sect. 5) due to a strong increase in the fraction of cyclones approaching from a similar direction. This is evident in the candidate track density as the north-south dipole over the UK and Ireland (Fig. 2).
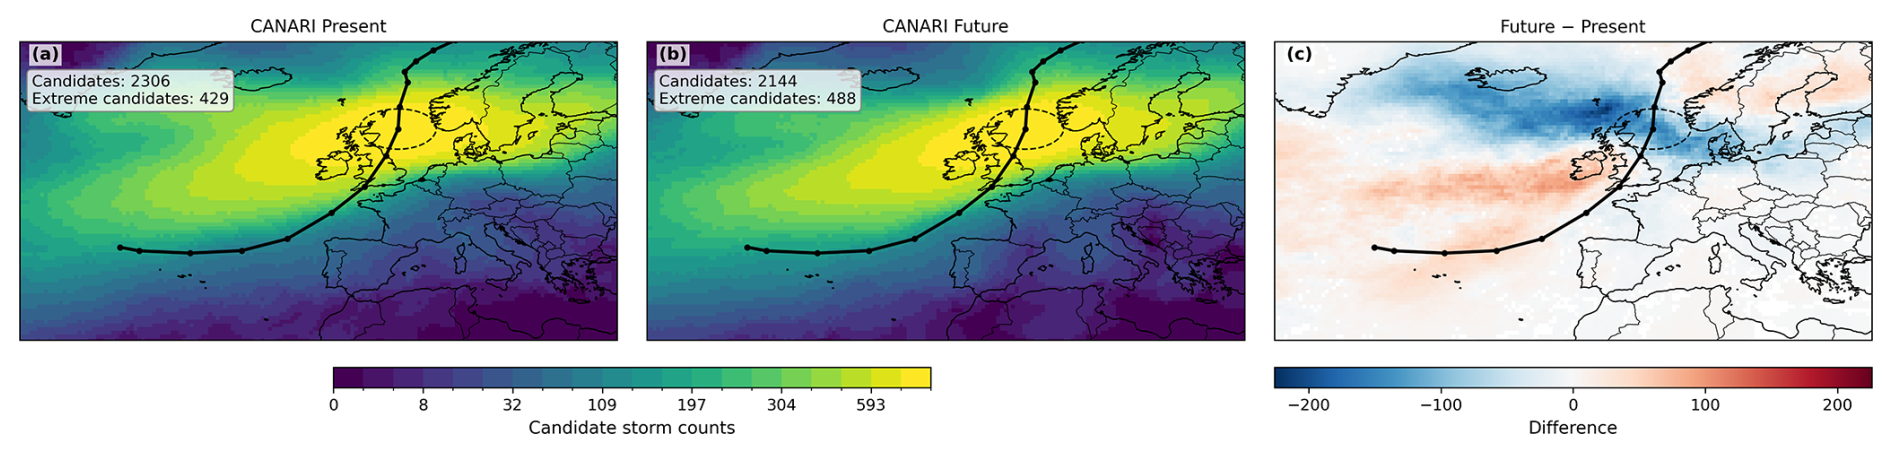
Figure 2Candidate-track density for the Great Storm of 1987 in (a) the CANARI LE present climate (1980–2010), (b) the CANARI LE future climate (2070–2100), and (c) their difference (future–present). Panels (a), (b) show candidate-cyclone counts on a non-linear scale, while panel (c) uses a linear scale. The black line marks the path of the Great Storm of 1987, and the dashed circle denotes the 300 km radius around the location of maximum 850-hPa relative vorticity used to identify candidate cyclones. Track-density counts are computed by assigning each grid cell contributions from cyclones passing within 300 km of that grid point. The legend shows the total number of candidate cyclones and extreme candidate cyclones in the present and future climates.
Further, to enable the analysis of post tropical analogues of cyclone Ophelia, an additional filter is imposed so that analogues of Ophelia must originate in the sub-tropical North Atlantic, defined here as 0–60° W and 25–35° N. This is to avoid cyclones originating from different geographical regions being included as cyclone Ophelia analogues. This is important as PTCs have distinct cyclone characteristics, forming under different large-scale conditions conducive for ET (Sainsbury et al., 2020).
As changes in future cyclone trends are sensitive to the choice of intensity metric used (Priestley and Catto, 2022), a range of metrics are employed to quantify changes in intensity. Dynamical intensity is measured by RV; meteorological hazards are assessed via wind speed at 850 hPa (WS850) and precipitation rate (PR). Rather than assessing the modelled surface effects, we assess the potential hazards that the target storm analogues represent even if they had followed a slightly different path. Consistent with this perspective and following Hart et al. (2017), WS850 is used as an estimator of maximum wind speed within the boundary layer, in turn used to estimate maximum surface wind gusts (Brasseur, 2001). Manning et al. (2022, 2023) make use of this approach when wind gust data are not available. Rather than lack of data, the use of WS850 in this work is motivated by the aim of assessing the potential of a storm to lead to impacts regardless of small differences in position: WS850 is a wind-related variable which is less affected by orographic effects than, for example, 10 m wind gusts. PR is averaged across 6 h to reduce the high spatial and temporal variability associated with this variable. Changes in WS850 and PR are explored by averaging composite fields within a 5° radius of the historical cyclone's position of maximum RV. To assess the drivers of changes in intensity and meteorological hazards, composite fields are created in present and future simulations for each analogue at the time of maximum RV of each track. Low-level Eady growth rate (EGR) between 850 and 500 hPa is used to determine changes in baroclinicity, quantifying the large-scale conditions for the potential growth of cyclones (Eady, 1949). Wind speeds in the upper troposphere are analysed to explore changes in the position and strength of the jet stream. To account for height variations, wind speeds are averaged between the 200, 250, and 300 hPa layers, and jet occurrence is defined as exceeding 30 m s−1, as in Koch et al. (2006) and Ginesta et al. (2024).
To provide confidence in the results of the track analogue methodology, we first briefly examine the representation of North Atlantic extra-tropical cyclones in the CANARI LE. Since the track analogue methodology focusses on cyclone tracks at the time of maximum intensity, we examine how closely the statistics of such points from the historical simulations resemble ERA5, and how they change in the future simulations. Figure 3a shows the spatial density of cyclone tracks at their time of maximum intensity. In ERA5, most cyclones reach peak intensity within a band extending from the east coast of North America to northern Europe, with a pronounced density maximum south of Greenland. The CANARI LE overestimates the total number of cyclones over the region by 2.9 %. The largest local biases, however, are 10 %–15 % and negative, to south of Greenland and to the north of the UK. This spatial pattern is broadly consistent with the cyclone-track density biases reported for other CMIP6 models relative to ERA5 (Priestley et al., 2023). In contrast, the biases over the primary target regions of this study, namely around the UK, Ireland and France, are considerably smaller, providing confidence in the suitability of the CANARI LE for simulating analogues of the four historical cyclones.
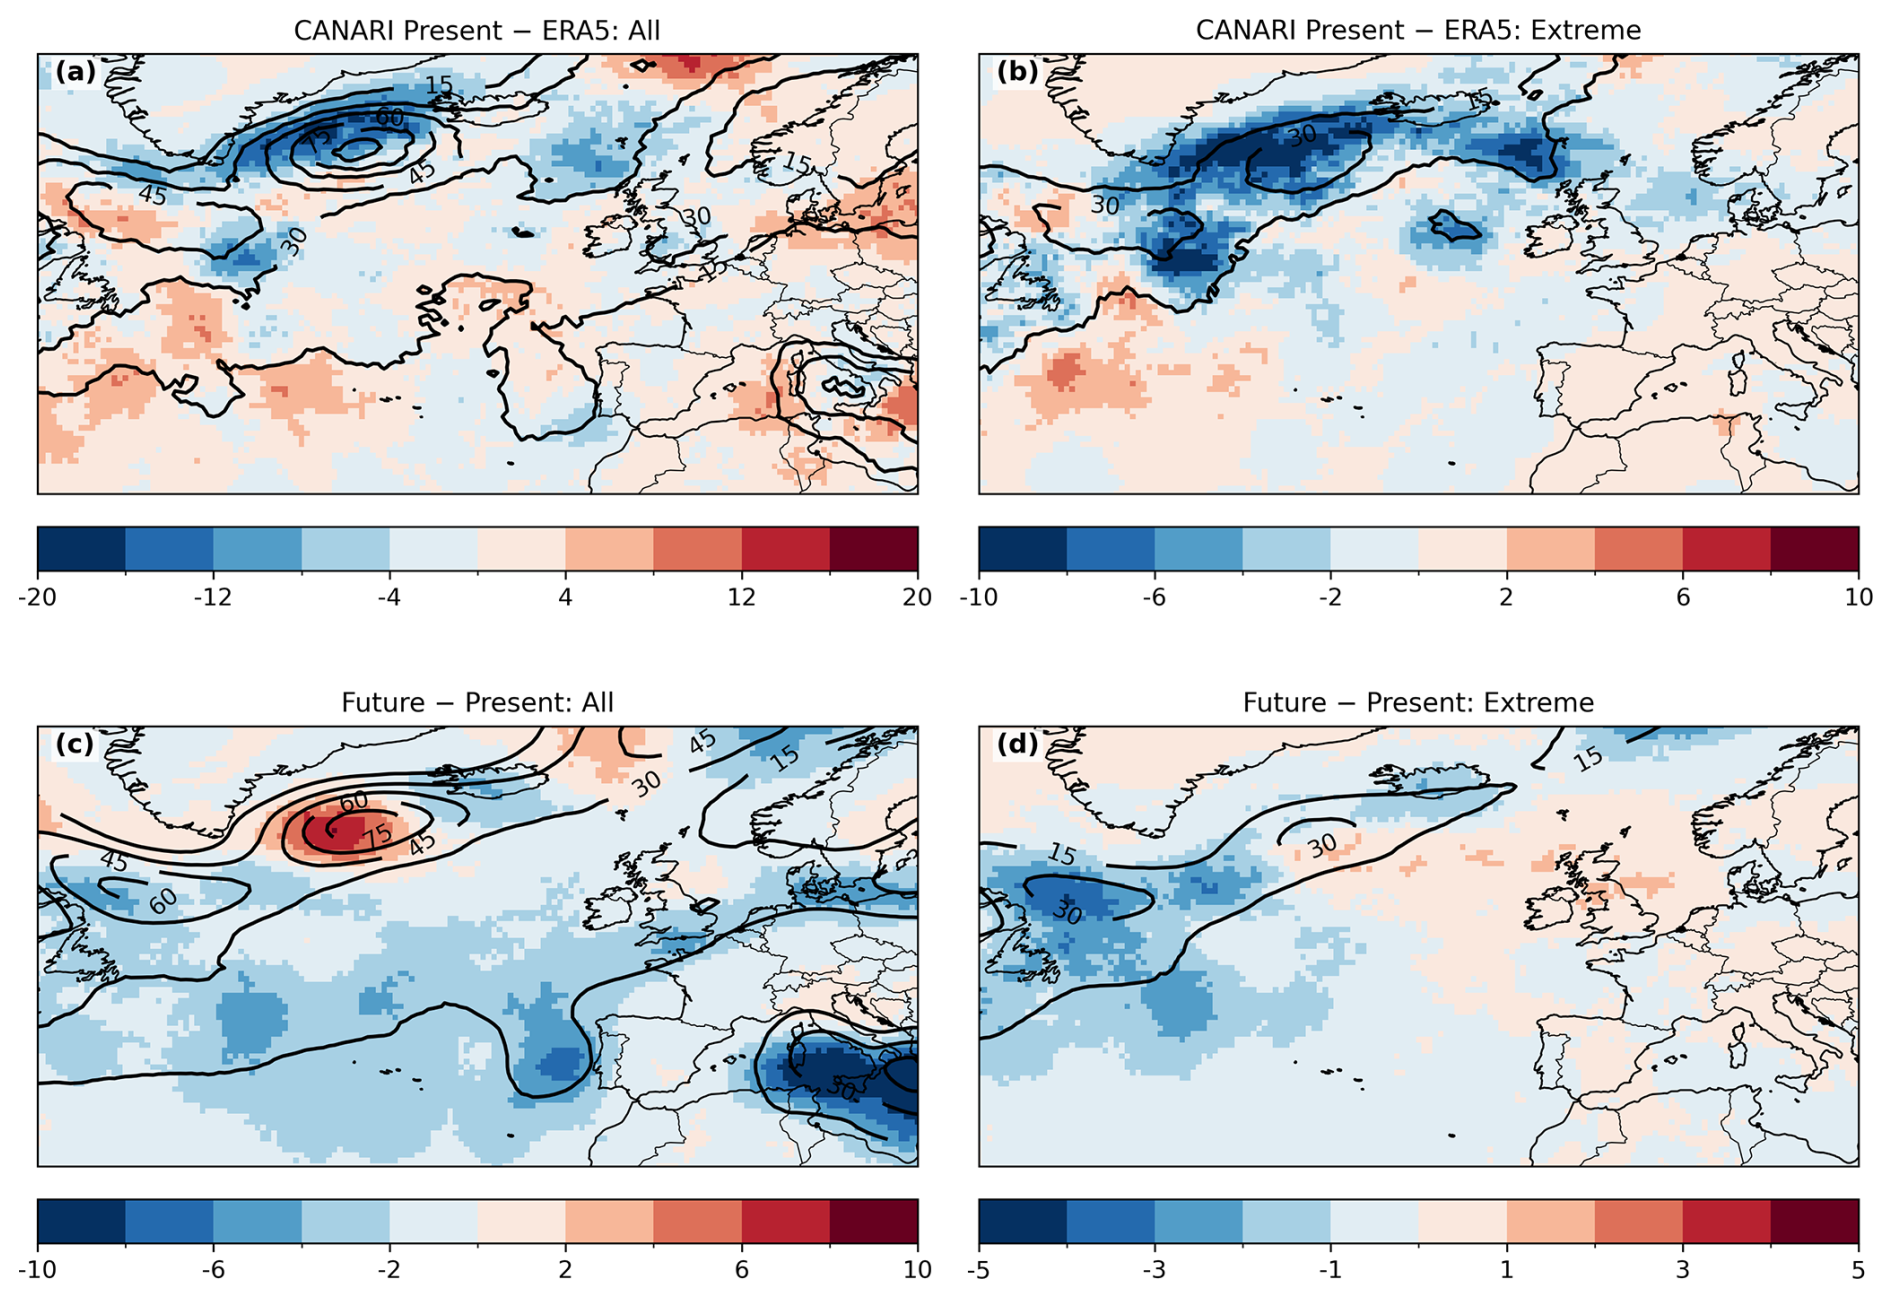
Figure 3Counts of cyclone tracks within 300 km of each grid point at their time of maximum intensity (units: tracks per decade). (a, b) ERA5 (contours; 1980–2010) and the difference to the CANARI present ensemble mean (shading; 1980–2010). (c, d) CANARI present ensemble mean (contours; 1980–2010) and the difference to the CANARI future ensemble mean (shading; 2070–2100). Panels (a), (c) show all tracks with track-maximum and panels (b), (d) show just “extreme” tracks with track-maximum .
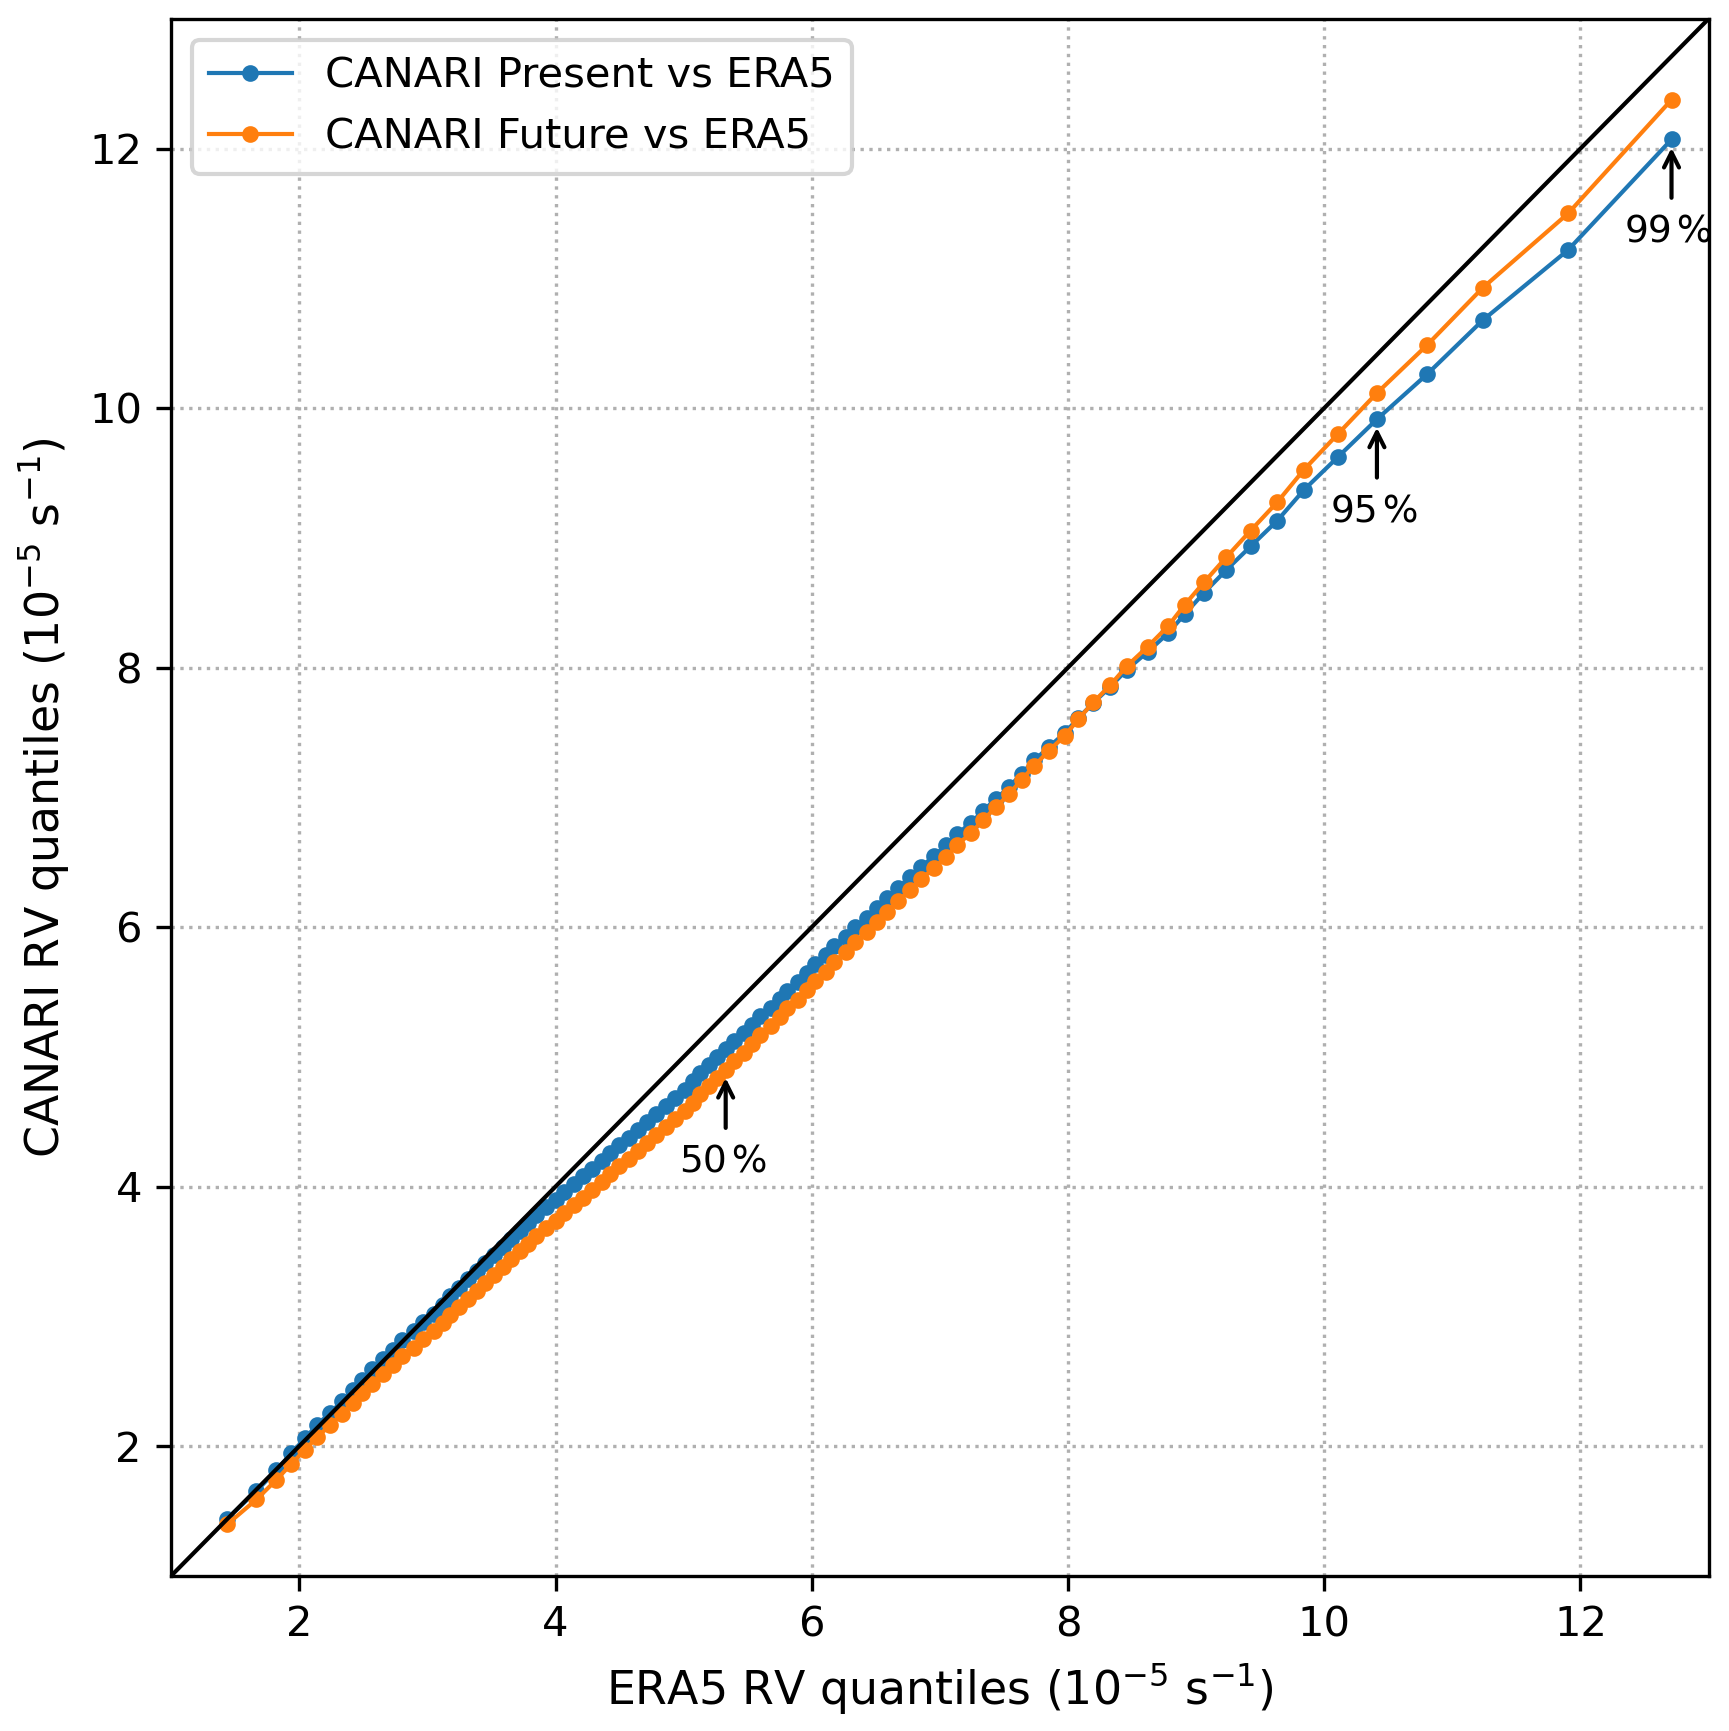
Figure 4Comparison of the distribution of track-maximum relative vorticity in ERA5 (x-axis; 1980–2010) and the CANARI present (blue; 1980–2010) and future (orange; 2070–2100) for all cyclones that reach peak intensity within the North-Atlantic-European region displayed in Fig. 3 (60° W–20° E, 30–70° N) between the months of September and April.
Figure 3b shows the density of extreme cyclones at peak intensity, where extremes are defined as cyclones with a track-maximum relative vorticity exceeding (see Sect. 3.2.2). Averaged over the region, the CANARI LE underestimates the number of extreme cyclones by 14.4 % relative to ERA5. The spatial pattern of extreme cyclone peaks broadly resembles that in Fig. 3a; however, the negative biases are larger south of Greenland and across much of the North Atlantic. This is consistent with the intensity biases identified across the sub-polar gyre in Schiemann et al. (2026a). In contrast, the target regions of this study exhibit only a modest negative bias, of the order of 1–4 cyclones per decade, indicating that the representation of extreme cyclone activity in these areas is considerably closer to ERA5 than over the open ocean.
To examine the distributions of cyclone intensity in more detail, Fig. 4 compares quantiles of track-maximum RV for North Atlantic extratropical cyclones in ERA5 and the CANARI present (orange) and future simulations (blue). There is close agreement between the CANARI LE and ERA5, indicating that the CANARI LE simulates cyclone intensity distributions well. However, there is a slight tendency towards weaker intensities relative to ERA5 at the upper tail, indicating that the CANARI LE underestimates the strength of the most extreme cyclones. The target regions over southern UK and the North Sea exhibit similar intensity biases (not shown). This behaviour is consistent with the tendency of global climate models to underestimate the intensity of the most extreme cyclones (Priestley and Catto, 2022), potentially arising from the misrepresentation of dynamical processes at cyclone scales, such as baroclinic energy conversion and diabatic heating (Colle et al., 2013). Large-scale circulation biases are also likely to contribute, as they shape the background environment in which cyclones develop; for example, Zappa et al. (2013) linked cyclone intensity biases to the tilt of the North Atlantic jet stream.
Taken together, this comparative analysis and evaluations from Priestley et al. (2020) and Palmer et al. (2023) support the use of the CANARI LE for analysing the frequency of extreme cyclones affecting the UK, Ireland and France, particularly because biases associated with extreme cyclones are small over the target region.
To identify future changes in cyclone statistics, Fig. 3c and d show the change in density of cyclones at peak intensity between the present and future simulations, for all and extreme cyclones respectively. Over the entire region, the number of cyclones decreases by 10.7 % [95 % confidence interval from ensemble bootstrap resampling: −11.1 % to −10.2 %]. There is an increase in cyclone density south and downstream of Greenland, consistent with a poleward expansion of the tropical circulation, strengthened jet speeds, and interactions with regional orography (Harvey et al., 2020; Priestley and Catto, 2022). A slight positive signal of 1 %–2 % appears over parts of the North Sea, plausibly linked to an extension of cyclone tracks and enhanced baroclinicity associated with changes in sea surface currents (Bengtsson et al., 2009; Woollings et al., 2012). In contrast, the British and Irish Isles exhibit a 3 %–5 % reduction in cyclone density, similar to much of the surrounding region. This is likely caused by reductions in lower-tropospheric temperature gradients under amplified high-latitude warming (Gertler and O'Gorman, 2019; Hay et al., 2023; Li et al., 2014; Butler et al., 2010).
Extreme cyclones show a contrasting response, with reductions in cyclone density over the western North Atlantic but increased cyclone density over Ireland, the UK and much of Europe of the order of 1–3 cyclones per decade (Fig. 3d). This likely reflects enhanced temperature gradients in the upper troposphere (Mizuta et al., 2011) and/or stronger diabatic feedbacks in cyclone cores (Pfahl et al., 2017).
Similarly, Fig. 4 (blue line) shows that the intensity distribution shifts towards fewer weak-to-intermediate cyclones and a larger proportion of the most intense cyclones, consistent with broader projections of fewer cyclones overall but greater intensity among the strongest cyclones (Priestley and Catto, 2022; Sinclair et al., 2020).
In this section, the ability of the CANARI LE to simulate analogues of the four historical study storms is assessed relative to the period 1950–2014 in ERA5. The influence of climate change on the frequency of simulated analogues is assessed by comparing analogue rates in present-day (1980–2010) and future (2070–2100) periods. Figure 5 shows the paths for all cyclone analogues and extreme analogue subsets for each historical cyclone in ERA5 reanalysis, CANARI LE present and CANARI LE future.

Figure 5The full track of the case study cyclones (top to bottom) Martin, the Great Storm of 1987, Arwen and Ophelia (black lines) and their analogues (grey lines) from (a, d, g, j) ERA5, (b, e, h, k) the present-day CANARI LE, and (c, f, i, l) the future CANARI LE. Extreme analogues are marked red. The dashed circles indicate the 300 km radius used to identify the position of cyclones at peak intensity. The legends show analogue and extreme analogue rates per decade, with confidence intervals (95 %) constructed from a bootstrap resampling of the CANARI LE members.
Analogue cyclones are identified throughout the year in both ERA5 and the CANARI LE. The seasonality in both sets is qualitatively similar with most analogue cyclones occurring in the DJF season. The exception is the Great Storm of 1987 for which ERA5 analogues appear evenly distributed throughout the year. The same behaviour is found in the CANARI LE present period, but not in the future period which exhibits a marked clustering towards DJF (not shown). However, the number of analogues is not sufficiently large to make a quantitative assessment and therefore this aspect is not investigated further.
5.1 Martin
Across the 74-year period of ERA5, 14 analogues of cyclone Martin were identified, representing a rate of 1.89 cyclones per decade. Of the identified analogues, only cyclone Martin is considered extreme, reflecting the low-likelihood of Martin-like paths occurring and the unusual large-scale conditions which caused it (Sect. 2). In the CANARI LE simulations of the present climate, 99 analogues are identified across 1200 simulated years, a frequency of 0.83 analogues per decade. This represents a notable negative bias in the frequency of analogues identified in CANARI LE relative to ERA5, which may be associated with the negative biases found over the sub-polar gyre in Schiemann et al. (2026a). However, the ratio of extreme cyclones in the CANARI LE present is similar to that in ERA5, with 8 of the 99 analogues classified as extreme, corresponding to a relative contribution of 8.1 %.
In simulations of the future climate, the analogue rate decreased from 0.83 to 0.75 analogues per decade (10.0 %). This does not represent a significant reduction in the ensemble mean frequency (according to a Welch's two-sample t-test at the 5 % level), because the change is small relative to the variability across ensemble members. However, there is a significant decrease in the number of candidate cyclones reaching peak intensity within 300 km of cyclone Martin's position of peak intensity, from 6.5 to 5.0 cyclones per decade (29.3 %). Therefore, whilst there is a large reduction in the total number of cyclones impacting the region in the future climate, a larger proportion follow a path similar to cyclone Martin.
Despite the reduced number of total analogues, the number of extreme analogues increased from 8 to 16 in future, corresponding to a relative increase in the frequency of extreme analogues, from 8.1 % to 17.8 %, with most of this increase occurring between the months of November and January (not shown).
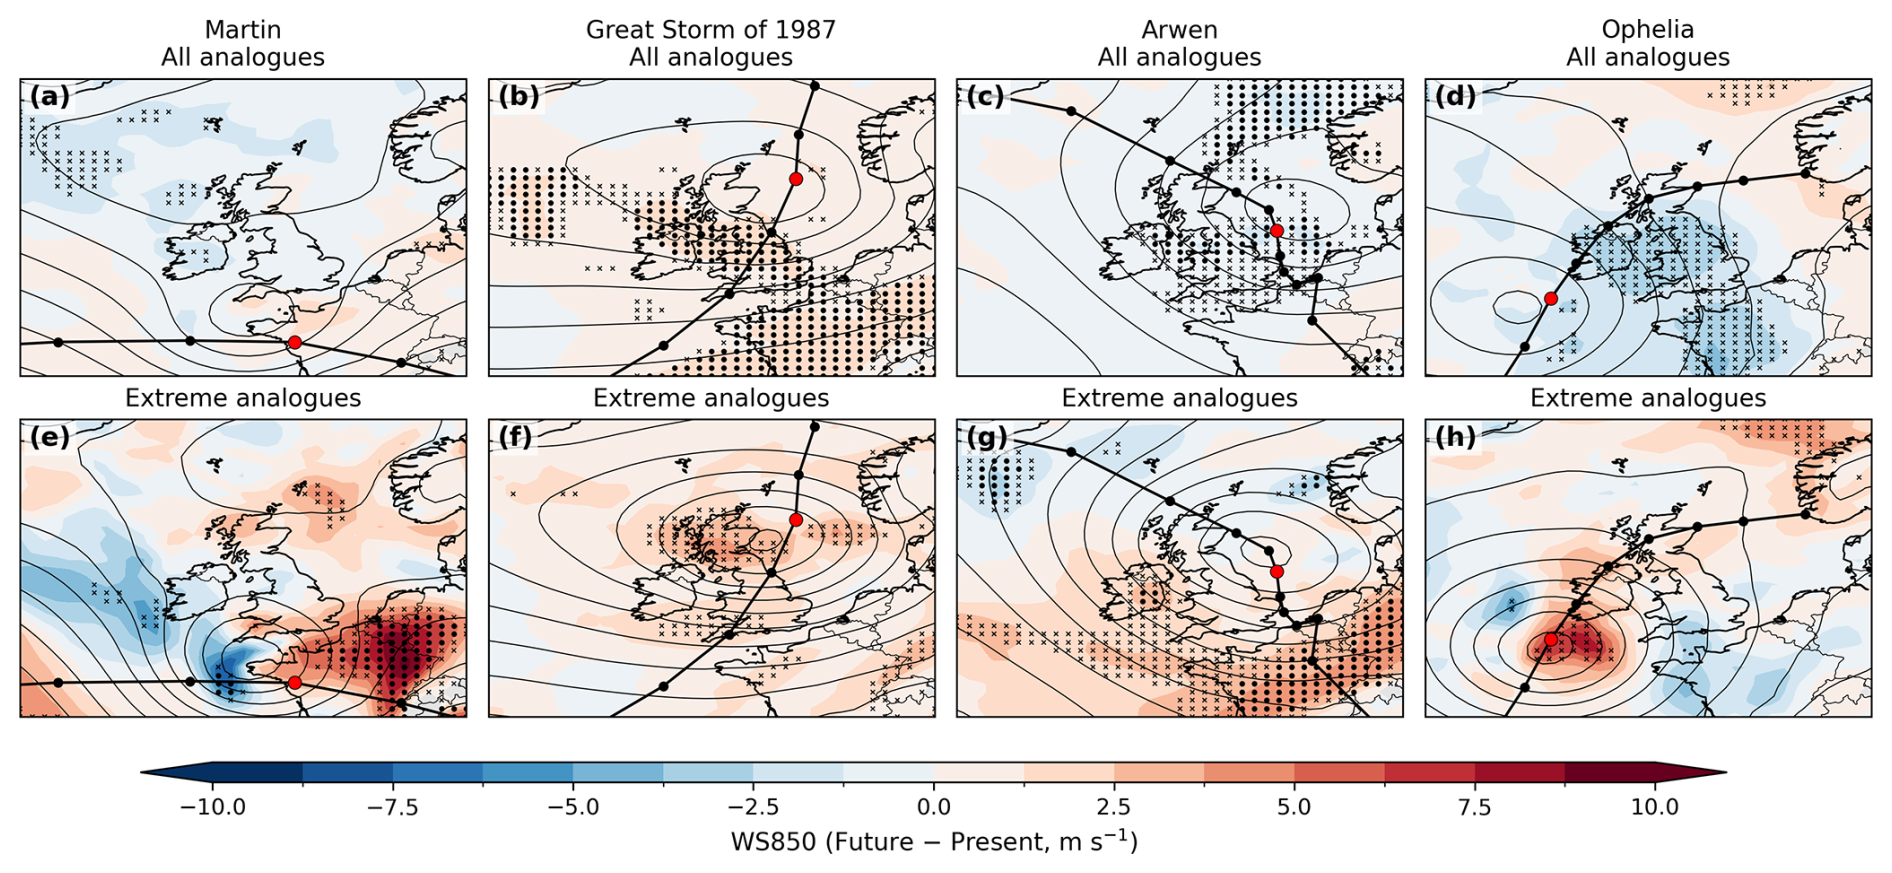
Figure 6Composite difference plots (CANARI future–present) of wind speed at 850 hPa (shading, m s−1) for (a, e) Martin, (b, f) Great Storm of 1987, (c, g) Arwen, and (d, h) Ophelia analogues and extreme analogues at their time of maximum intensity. Black contours show the CANARI present composite SLP (intervals of 4 hPa). Stippling denotes significant regions according to the Benjamini–Hochberg false discovery rate procedure (Benjamini and Hochberg, 1995) with αFDR=0.10 (Wilks, 2016) while the grid-points marked with crosses indicate local significance at the α=0.05 level, both based on a Welch's two-sample t-test. Historical tracks are shown as black lines with the positions of maximum intensity marked by red circles.
5.2 Great Storm of 1987
In ERA5, 27 analogues were identified, equivalent to 3.6 cyclones per decade. Consistent with cyclone Martin, the present-day CANARI LE simulations contain fewer analogues per decade than ERA5, with a rate of 2.5 analogues per decade. Five of the 27 analogues were considered extreme in ERA5 (18.5 %) and a similar ratio of extreme cyclones was identified in the present-day CANARI LE simulations (17.3 %).
The frequency of candidate cyclones decreases significantly in the future climate from 19.2 to 17.9 cyclones per decade (5.6 %). However, the frequency of analogue cyclones is projected to increase sharply, from 2.5 to 2.9 cyclones per decade (16.5 %). The frequency of extreme analogues increases by 52.3 %, and their relative contribution rises from 17.3 % to 30.4 %. The reason for an increase in the number of analogue storms despite a decrease in the number of candidate storms is evident from Fig. 2. There is a strong reduction in the number of south-eastward propagating candidate cyclones in the region, but a large increase in the number of north-eastward propagating candidate cyclones. A plausible interpretation is that these contrasting changes reflect competing thermodynamic influences: reduced baroclinicity at high-latitudes, associated with Arctic amplification and acting to suppress cyclogenesis for cyclones approaching from the north-west (Shaw et al., 2016), and regional changes in horizontal temperature gradients in the mid-latitudes, such as SST gradients in the North Atlantic (Inatsu et al., 2003), favouring baroclinic development and intensifying cyclogenesis for cyclones approaching from the south-west.
5.3 Arwen
In ERA5, 17 analogues were identified, equivalent to 2.3 cyclone analogues per decade. In contrast with the previous cases, the present-day CANARI LE simulations overestimate the number of analogues relative to ERA5, with a rate of 4.3 analogues per decade. Three of the 17 analogues were considered extreme in ERA5 (17.6 %) and a slightly smaller fraction of cyclones considered extreme were identified in CANARI present (11.2 %).
The frequency of analogues decreases significantly in the future climate from 4.3 to 2.9 per decade (46.7 %). This substantial reduction in the number of analogues is associated with both a decrease in the total number of candidate cyclones (7.1 %) and a decrease in the fraction of candidate cyclones cyclones following the southward path of Arwen. The frequency of extreme analogues decreases by 37.9 %, but their relative contribution remains similar (from 11.2 % to 10.2 %), suggesting that the reduction of analogue rate is similar for both moderate and extreme cyclones.
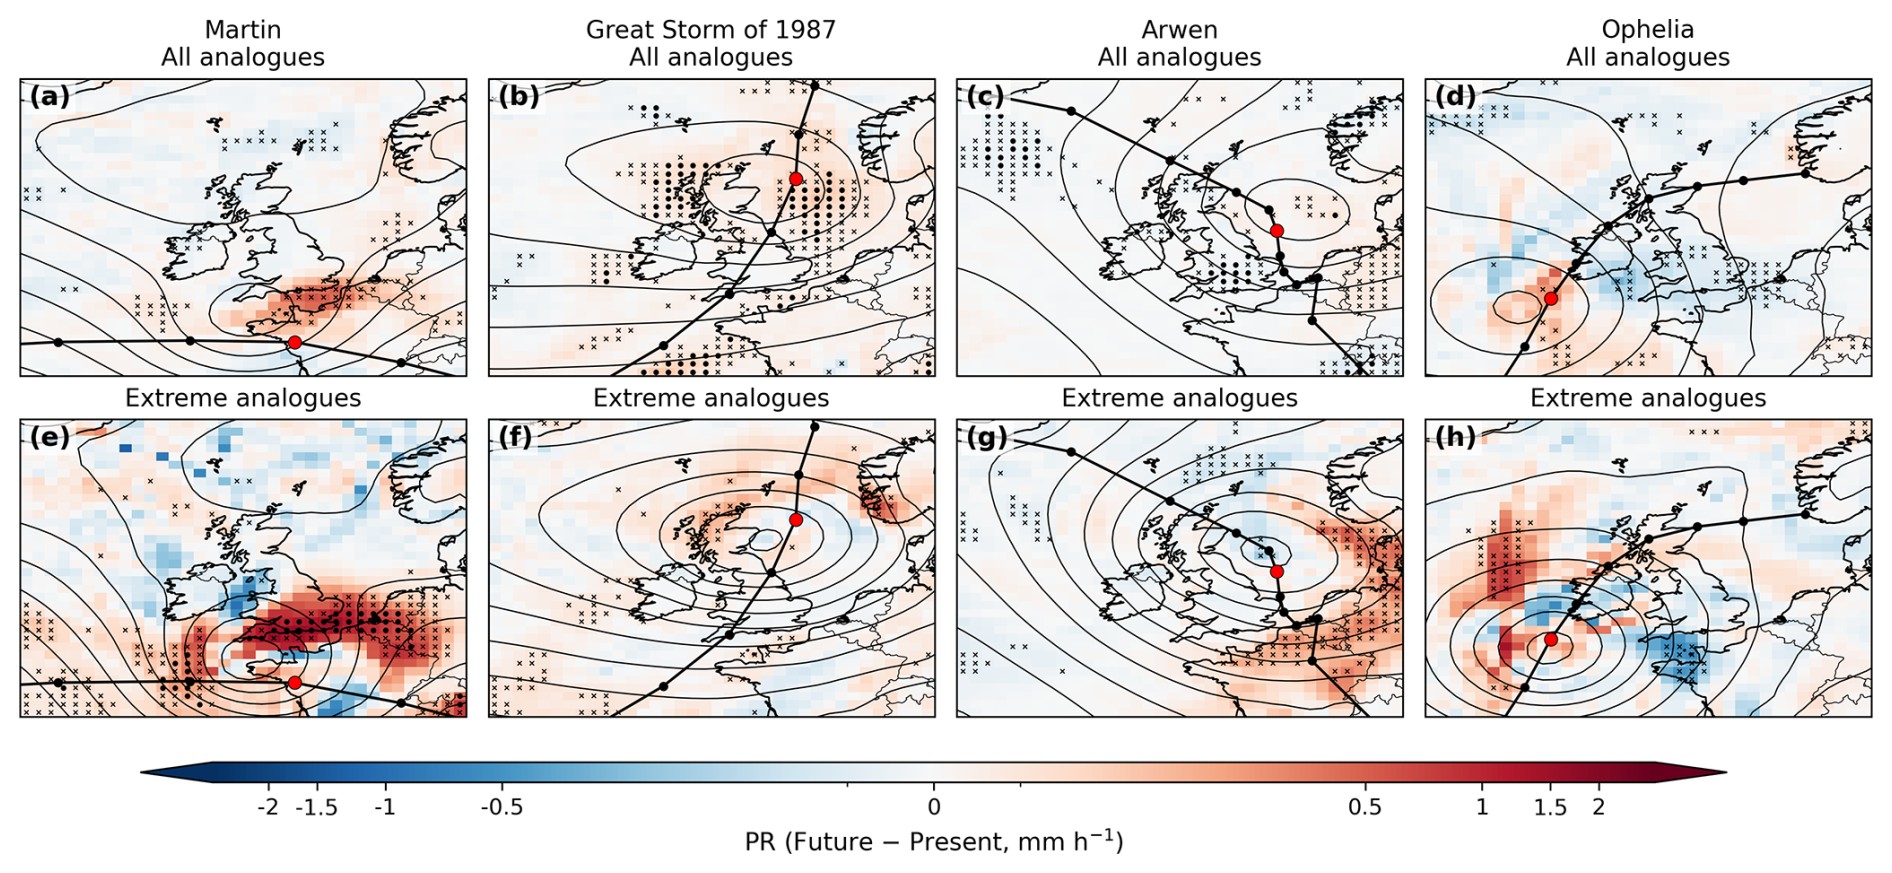
Figure 7As Fig. 6 but for 6-h mean precipitation rate (mm h−1) at the time of maximum intensity.
5.4 Ophelia
In ERA5, five analogues were identified, corresponding to 0.8 cyclones per decade, two of which were extreme. This low-frequency reflects the low-likelihood of post-tropical cyclones making landfall in Europe for this type of east Atlantic cyclone (Sainsbury et al., 2020). There were slightly fewer analogues in the present-day CANARI LE simulations, with a frequency of 0.6 cyclones per decade.
In the future simulations, the analogue frequency increases by 8.9 %, whereas the frequency of extreme analogues increases by 50.0 %, indicating that the likelihood of extreme PTCs impacting the UK may increase; however, this increase is of a similar size to the model bias for extreme cyclones, indicating that although the model captures a clear climate change signal, the strength of this signal is uncertain.
In this section, future changes in analogue dynamical intensity and associated hazards are assessed via track statistics measuring maximum cyclone-associated hazards along each cyclone track, and composite maps generated by averaging gridded fields from all analogue tracks at their time of maximum intensity. Hazards are assessed using wind speed at 850 hPa and precipitation rate. Further, each cyclone set is examined via composites of EGR and jet speed to identify dynamical processes contributing to the future changes in cyclone analogues.
6.1 Relative vorticity
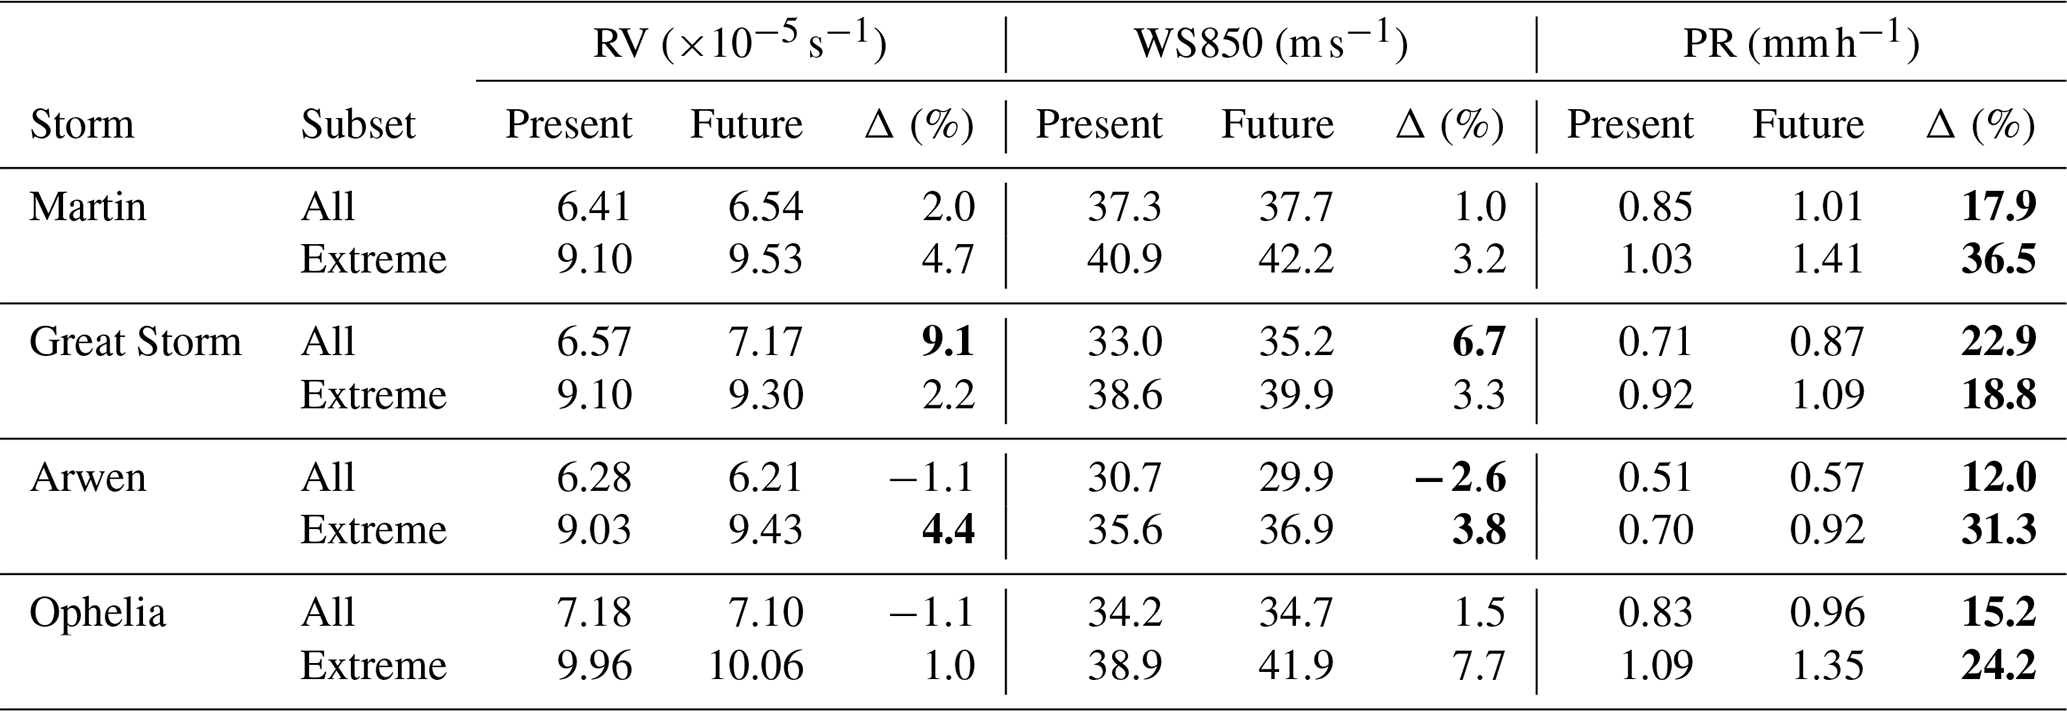
The change in mean track-maximum RV between present and future climates ranges from −1.1 % and +9.1 % across the four historical cyclones (Table 1). Arwen and Ophelia analogues both decrease by 1.1 % whereas Martin increases by 2.0 % and the Great Storm shows a large statistically significant increase of 9.1 %. This indicates that both the sign and magnitude of intensity changes are cyclone-specific. However, a larger sample size is required to robustly assess the significance of cyclone-specific responses to climate change. In contrast, all extreme analogue sets intensify (1.0 %–4.7 %), consistent with the generally robust response of the strongest cyclones to warming. For example, Sinclair et al. (2020) found a 2.8 % increase in mean 850 hPa track-maximum RV of the 200 strongest cyclones under a +4 °C SST aqua-planet experiment. Notably, extreme Arwen analogues increase significantly (4.4 %) despite the weakening of the mean of all the analogues.
Table 1Mean intensity and cyclone-associated hazard metrics for present-day and future CANARI LE analogues and extreme analogues. Values shown are track-maximum relative vorticity (RV, s−1), the track-maximum value of the maximum 850 hPa wind speed within 5° of each track point (WS850, m s−1), and the track-maximum value of the mean precipitation rate within 5° of each track point (PR, mm h−1). Differences (Δ) are expressed as future–present percentage changes relative to the present value. Bold values denote non-zero differences at the 5 % significance level according to a two-sided Welch's t-test.
6.2 Wind speed at 850 hPa
In agreement with the robust future increases in RV for the Great Storm analogues, there is a significant increase in the track-maximum WS850 of 6.7 % (Table 1) as well as the mean WS850 in the composite sense (Fig. 6). The composite increases are predominantly located near the cyclone centre and in the warm sector. In contrast, Arwen analogues exhibit significant reductions in WS850, located around the cyclone centre, whilst Martin and Ophelia show little change in track-maximum WS850. However, for Ophelia, the area of high wind speed is reduced further downstream and southward of Ophelia's cyclone centre. By contrast, the extreme analogues all exhibit higher track-maximum wind speeds of 3.2 %–7.7 % (Table 1).
6.3 Precipitation rate
In contrast to wind speed changes, all analogue sets exhibit robust increases in track-maximum precipitation (Table 1) with the all-storms subsets increasing by 12.0 %–22.9 % and the extreme analogues increasing by 18.8 %–36.5 %. These values are broadly consistent with Bengtsson et al. (2009) who found increases in cumulative precipitation of 11 % for all North Atlantic cyclones and larger increases of 27 % for extreme cyclones using a high-resolution GCM. The magnitude of PR increases across the analogue sets broadly covaries with changes in track-maximum RV reported in the previous section. For example, Arwen analogues show modest increases in PR (12.0 %) consistent with observed reductions in intensity, whereas the Great Storm exhibits the largest (22.9 %).
The composite analysis shows increases are generally concentrated in the cyclone core and along the eastern flanks (Fig. 7). However, the imperfect alignment of analogue tracks and the high spatial and temporal variability of PR obscures sharply defined frontal structures. Extreme analogue composites suggest enhanced PR associated with the cold front for Arwen, but predominantly along the warm front for the other three cyclones. While out of this work's scope, further research is required to determine the nature of the described PR changes (e.g. whether these changes are mainly thermodynamic, dynamic or both) and to expand this research to consider not only the time of maximum intensity but the storms' life cycle as a whole.
6.4 Changes in baroclinicity
To examine the underlying dynamical changes responsible for the changing weather hazards, the EGR 24 h prior to maximum RV are assessed via composite analysis (Fig. 8). Martin and the Great Storm developed under exceptionally high baroclinic conditions in the central North Atlantic, exceeding the 95th percentile of wintertime baroclinicity for 1957/58–1997/98 (Ulbrich et al., 2001). For future analogues, baroclinicity may be even higher in this region, likely due to changes in SST gradients (Woollings et al., 2012), indicating that conditions favouring exceptionally intense analogue development may become more likely. For example, long-term climate projections from Hand et al. (2019) show a similar changing pattern of SST gradients and noted high correspondence with storminess over the eastern part of the North Atlantic and Europe.
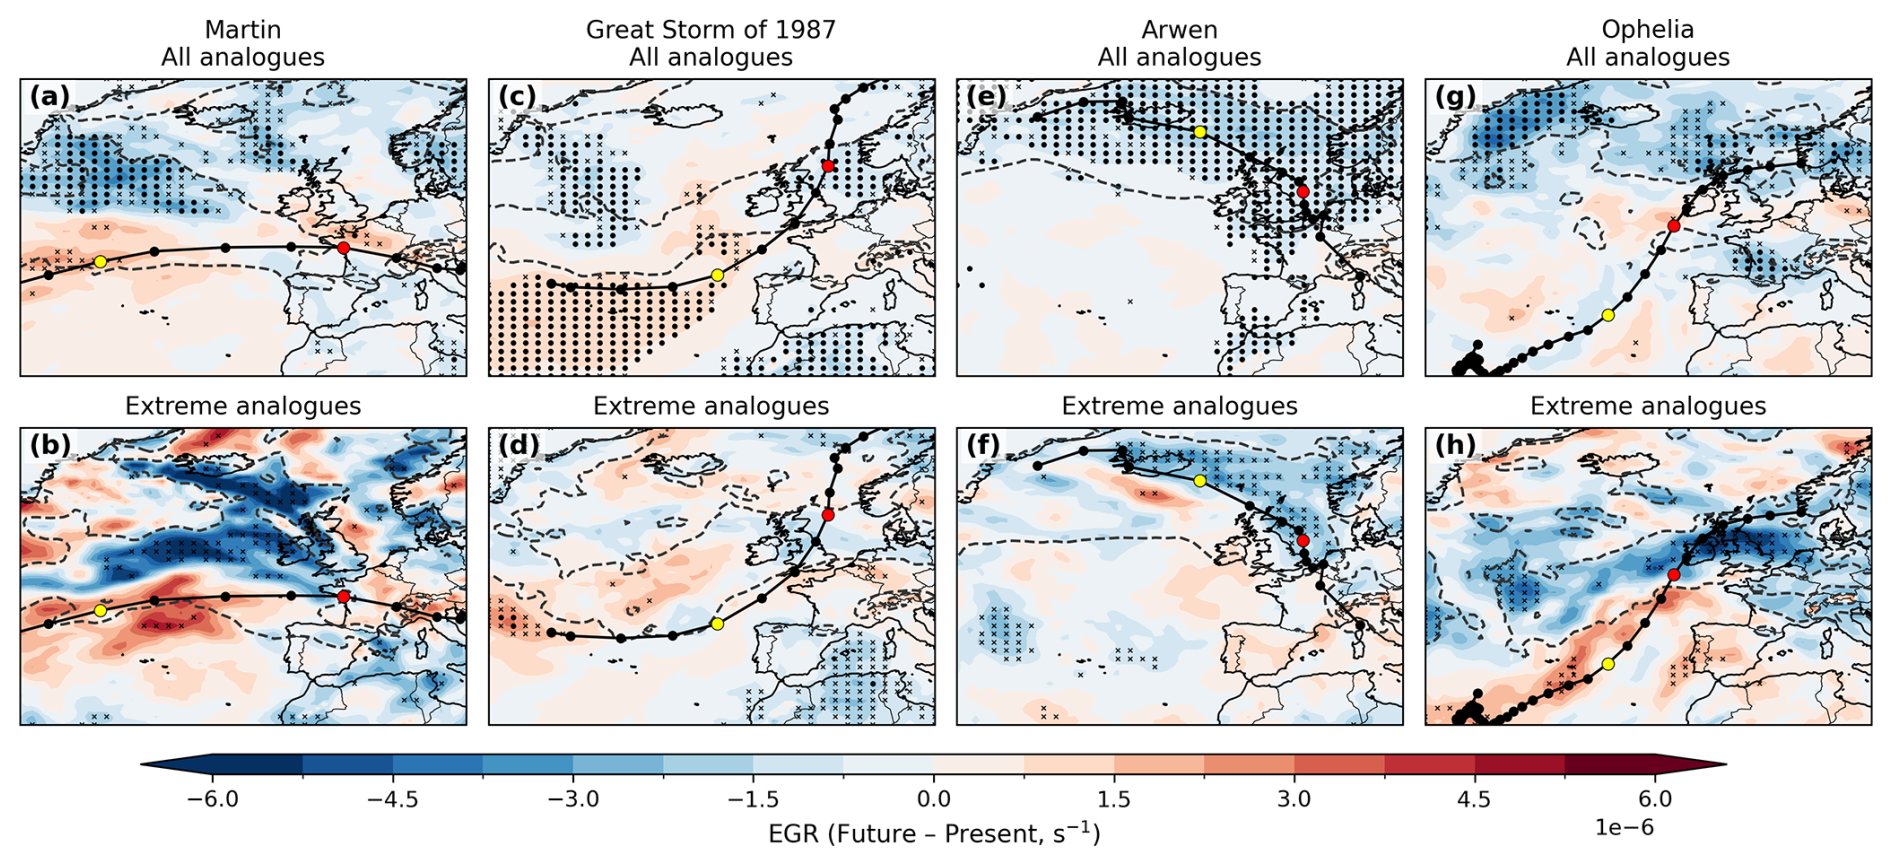
Figure 8As Fig. 6 but for Eady growth rate (EGR, s−1) 24 h prior to the time of maximum intensity. Dashed contours show the CANARI present composite EGR and yellow circles indicate the track position 24 h prior to the time of maximum intensity.
Regions of high baroclinicity for Ophelia analogues are displaced southward, suggesting that ET may occur further offshore than in the historical case, which underwent ET shortly before landfall in Ireland. In contrast, Arwen exhibits a significant reduction in baroclinicity south of Greenland and over the Greenland, Norway and North Seas, consistent with the projected decreases in analogue frequency and intensity. This region of reduced baroclinicity is evident across all cyclones and is likely associated with weakened lower-tropospheric temperature gradients under Arctic amplification.
6.5 Changes in the strength and position of the jet stream
Changes in upper-tropospheric wind at the time of maximum intensity are also assessed in Fig. 9. Each case is located on the left exit region of a strong jet stream feature, and these features strengthen for all future analogue composites, with mean wind speeds within a 5° radius of the historical cyclone centre increasing by 3.1 %–9.2 % across analogue sets. Extreme analogues exhibit larger increases of 8.1 %–19.5 %, indicating that jet strength exerts a key influence on cyclone intensity, consistent with Mizuta et al. (2011), who found a strong correspondence between regions of jet intensification and intensified cyclone development under anthropogenic climate change.
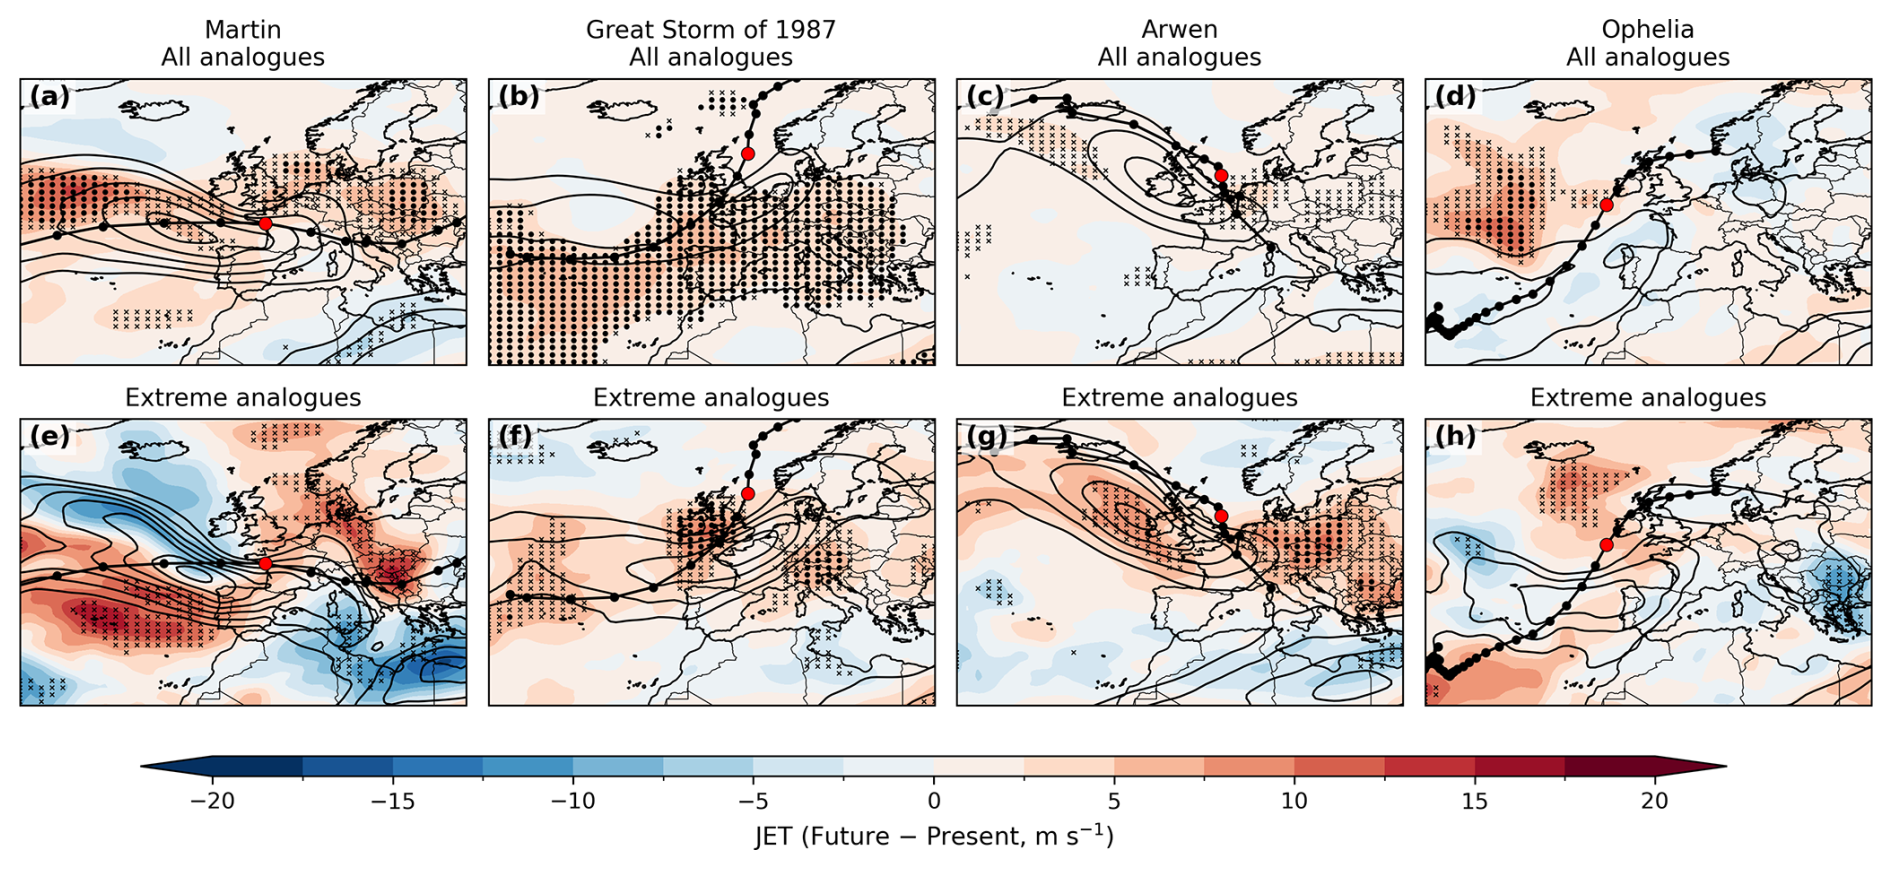
Figure 9As Fig. 6 but for average wind speed between 400–250 hPa (m s−1) with the CANARI present composite shown by black contours.
Additionally, Arwen, the Great Storm and Martin show a future eastward extension of the jet. In the historical composites, the surface lows are positioned poleward and eastward of the jet streak, consistent with the left-exit region. This suggests that downstream jet changes may enhance vertical motion via increased upper-level divergence, potentially contributing to the projected increases in cyclone intensity. This jet configuration also indicates a more advanced cyclone stage, and may be linked to shifts in frontal structure and location, as noted in Ginesta et al. (2024).
The influence of climate change on four impactful European cyclones with contrasting characteristics have been assessed. Storms exhibiting comparable tracks and stages of development were identified and classified as analogues for both the present-day climate (1980–2010) and the future SSP3-7.0 scenario (2070–2100) from the CANARI LE simulations, following the methodology of Ginesta et al. (2024) with adjustments. Within this set, cyclones exceeding the 90th percentile of track-maximum RV were further defined as extreme analogues. The findings indicate that in the future climate the frequency and intensity of these analogues will likely exhibit divergent responses to warming.
Storm Martin was an exceptional event forming under rare large-scale conditions with no other extreme cyclone of its kind with a comparable track in ERA5. In the future climate, analogues are projected to become even less frequent, but the number of extreme analogues increases. Furthermore, the intensity of future analogues are projected to increase significantly in terms of PR, and positive signals of RV and WS850. Changes in intensity are likely driven by increased wind speeds in the upper troposphere and increased baroclinicity over the central North Atlantic basin. These factors indicate that the occurrence of extreme analogue cyclones will not become less likely. When they do occur in future, they will be more intense and accompanied by significantly more precipitation, presenting a greater meteorological hazard.
Fewer cyclones reach peak intensity in a similar location to the Great Storm in the future climate. Despite this, the number of analogues increases significantly due to a large increase in the number of cyclones following a similar path. Moreover, all cyclone metrics investigated here (RV, WS850, PR) indicate a significant increase in intensity and associated meteorological hazards. Increases in PR are located along the cold front with increases in wind speed located in the warm sector. Significant increases in baroclinicity over the North Atlantic indicate that changing SST gradients may correspond with increases in intensity. The jet streak is also displaced southward and downstream in the future, potentially enhancing baroclinic growth due to upper-level forcing. This suggests that modifications of both the lower- and upper-level temperature gradients increase both the frequency and intensity of future analogues of the Great Storm in a warmer climate.
Storm Arwen was characterised by anomalously strong northerly winds associated with its distinct southward track, likely contributing to the severe impacts, as infrastructure and preparedness in the affected regions are primarily geared towards damaging westerly, rather than northerly, wind events (Smart et al., 2021). In the future period, both the number of analogues and extreme analogues of Arwen decrease significantly. On average, the future analogues are also weaker, with statistically significant reductions in WS850 and RV. In contrast, the subset of extreme analogues shows a robust increase in intensity: RV increases significantly, WS850 increases in the warm sector, and substantial increases in PR are projected. Large reductions in baroclinicity southwards and eastwards of Greenland, consistent with projected reductions in high-latitude lower-troposphere temperature gradient in a warmer climate, appear to suppress cyclogenesis and mean cyclone intensity. The increase in intensity of the extreme analogues which do occur likely reflects the downstream enhancement of the jet streak, enhancing air ascent and promoting increases in intensity. Together, these results suggest that future Arwen analogues, with damaging northerly winds, are likely to become less frequent in a warmer climate but that the most extreme analogues may be more intense, sensitive to the competing influences of weakened low-level and strengthened upper-level temperature gradients at high latitudes in the North Atlantic basin.
Finally, in the future climate, substantially fewer candidate cyclones reach peak intensity in a location comparable to Ophelia, and changes in analogue counts show only a weak positive signal. This likely reflects competing influences, with an overall reduction in TC frequency partially offset by increases in TC intensity, yielding only modest changes in the occurrence of PTCs. This is consistent with evidence that tropical cyclones are expected to intensify under warming (Cheung and Chu, 2023), implying that when PTCs such as Ophelia occur they may be associated with more severe impacts. However, the low frequency of PTC occurrences limit the statistical significance of these projections. Further, tropical cyclones are typically poorly represented in GCMs (Knutson et al., 2020), warranting cautious interpretation.
Since the storms investigated by Ginesta et al. (2024) and those included in this work are different, we do not attempt to perform a direct comparison between these two pieces of work. However, we can still contrast and compare the conclusions that are drawn from each study. There is a noticeable difference in the number of analogues identified in ERA5 in this work and by Ginesta et al. (2024). The number of ERA5 analogues in Ginesta et al. (2024) range from about 5 (Xynthia) to about 18 analogues per decade (Eunice); the number of ERA5 analogues in this work range from less than 1 (Ophelia) to about 4 analogues per decade (Great Storm). However, the number of analogues identified in the present period of each large ensemble, namely the CESM-LE and the CANARI-LE, is very similar: The number of CESM-present analogues range from 1 (Xynthia) to about 7 analogues per decade (Eunice); the number of CANARI-LE analogues range from about 1 (Martin) to about 4 analogues per decade (Arwen). This results in a reduction in the assessed bias in the numbers of analogues between Ginesta et al. (2024) and the present study. The bias in the ratio of explosive cyclones, in Ginesta et al. (2024), or extreme cyclones, in this work, to all analogues is similar in both the CESM-LE and the CANARI-LE at about 50 % mean absolute relative error. This lends confidence to the estimation of changes in extreme cyclones between the present and a future climate in both pieces of work. However, this is an aspect that highlights the value of the methodology being applied to contrasting storms: Alex, Eunice and Xynthia in the CESM-LE displayed a reduction in total analogue number but an increase in the proportion of explosive storms (Ginesta et al., 2024); Martin in the CANARI-LE exhibits a similar behaviour; however, while both the Great Storm and Ophelia also display an increase in the proportion of extreme analogues, they also exhibit an increase in total analogue number, albeit weak in the case of Ophelia. Furthermore, Arwen represents a counterexample to the general trend in that it exhibits a reduction both in total analogue number and in the proportion of extreme analogues.
To answer the research questions set out in the introduction:
How well does the CANARI LE simulate analogues of the four case study cyclones? The CANARI LE is capable of simulating analogues of the four case study cyclones, including those with atypical paths and post-tropical origins. However, in most cases the model underestimates analogue frequency compared with reanalysis, except for analogues of Arwen. Negative biases are more pronounced in winter, indicating that winter-time biases in the CANARI LE are a limiting factor in the representation of cyclone analogues.
How does the frequency of the cyclone analogues change in future? All candidate cyclones show a clear signal of decreased frequency and increased intensity. This aligns well with previous studies analysing future cyclone trends, typically projecting increases in intensity and associated meteorological hazards. However, there is substantial variation in the magnitudes of these changes between the four cyclone cases examined, highlighting significant regional changes in a warmer climate. This poses a challenge for policymakers to prepare for extreme cyclone events.
How do the intensity and meteorological hazards associated with the cyclone analogues change in future? Changes in the frequency and intensity of cyclone analogues exhibit greater inter-case variability than candidate cyclones, reflecting important changes of cyclone trajectories in a warmer climate. Of particular note is the significant change in the paths of cyclones reaching peak intensity in the North Sea. For example, both the Great Storm and Arwen reach peak intensity in this region, yet their analogue responses differ markedly: Arwen analogues show a robust decrease in both frequency and intensity, whereas Great Storm analogues show significant increases in intensity and a net increase in frequency. This arises because there are fewer candidate cyclones in the region overall, but a larger proportion follow the north-eastward path of the Great Storm and fewer follow the south-eastward path of Arwen. This is an important finding as each cyclone is associated with distinct meteorological hazards, requiring different adaptation measures. Arwen was associated with strong northerly winds, with the unusual direction exacerbating damages (Smart et al., 2021), while the Great Storm brought strong south westerly winds and the potential for heavy rain associated with the transport of warm, moist air from lower latitudes. This contrast highlights how aggregate cyclone-track trends alone may be insufficient to inform adaptation and risk-management strategies.
What are the underlying dynamical factors causing these projected changes? The strong correspondence between changes in EGR during the development stage of the analogue cyclones and changes in their frequency and intensity suggests that much of the inter-case variability is baroclinically driven. Composite analysis reveals a consistent dipole in baroclinicity, with reductions at higher latitudes (to the south and east of Greenland) and increases at lower latitudes (over the central North Atlantic). We propose that regional modifications to the lower-tropospheric temperature gradient, arising from Arctic amplification and evolving SST gradients in the central North Atlantic region (Inatsu et al., 2003) increase the frequency and intensity of Great Storm analogues while reducing those of Arwen. Together, these results indicate that future UK-impacting cyclones may be accompanied by substantial changes in cyclone propagation direction linked to regional modifications of the lower-tropospheric temperature gradient.
These findings highlight marked regional variability and show that cyclone-specific responses can diverge from the aggregate signal under anthropogenic climate change. However, an aspect that has not been explored in the present analysis is that of the influence on analogue occurrence from large-scale modes of variability, such as El Niño–Southern Oscillation or the North Atlantic Oscillation, to determine whether there are any changes in these relationships attributable to climate change. Beyond this, further work is required, for example analysing a wider range of cyclones, to understand the full range of responses of specific cyclone types in the future climate and to understand the relative roles of different dynamical drivers, such as diabatic effects. Demonstrating how extreme events may recur under climate change, and with greater severity as indicated here, can strengthen the case for investing in protective and adaptive measures to reduce future risks (Shepherd, 2016). In this context, these cyclones provide useful reference points for guiding resilience planning and improving preparedness for similar events in the future.
The TRACK software is openly available from https://gitlab.act.reading.ac.uk/track/track/-/releases (last access: 26 October 2026). The ERA5 dataset is publicly available online at https://doi.org/10.24381/cds.bd0915c6 (Copernicus Climate Change Service, 2023). The CANARI LE dataset is publicly available through the Centre for Environmental Data Analysis archive https://doi.org/10.5285/4B62FAFC68AE4C3784FB2819F652C537 (Schiemann et al., 2026b).
FM: Conceptualization; Data curation; Formal analysis; Investigation; Methodology; Software; Validation; Visualization; Writing – original draft; Writing – review and editing; BH: Conceptualization; Funding acquisition; Methodology; Project administration; Resources; Software; Supervision; Writing – review and editing; KH: Data curation; Methodology; Software; Writing – review and editing; OMA: Conceptualization; Funding acquisition; Methodology; Project administration; Resources; Supervision; Writing – review and editing
The contact author has declared that none of the authors has any competing interests.
Publisher's note: Copernicus Publications remains neutral with regard to jurisdictional claims made in the text, published maps, institutional affiliations, or any other geographical representation in this paper. The authors bear the ultimate responsibility for providing appropriate place names. Views expressed in the text are those of the authors and do not necessarily reflect the views of the publisher.
This work was part-funded by the NERC Climate change in the Arctic–North Atlantic region and impacts on the UK (CANARI) programme, grant number NE/W004984/1. In addition, Oscar Martínez-Alvarado received financial support from UK Research and Innovation (UKRI) via the International Science Partnerships Fund (ISPF) under Grant number [22/CC/11103] at the Co-Centre for Climate + Biodiversity + Water.
This research has been supported by the Natural Environment Research Council, National Centre for Atmospheric Science (grant no. NE/W004984/1). Oscar Martínez-Alvarado received financial support from UK Research and Innovation (UKRI) via the International Science Partnerships Fund (ISPF) under Grant number [22/CC/11103] at the Co-Centre for Climate + Biodiversity + Water.
This paper was edited by Sebastian Schemm and reviewed by three anonymous referees.
Ali, H., Wong, L. C. Y., Prein, A. F., and Fowler, H. J.: Characteristics of precipitation associated with post-tropical cyclones in the North Atlantic, Wea. Climate Extremes, 47, 100742, https://doi.org/10.1016/j.wace.2024.100742, 2025. a
Bengtsson, L., Hodges, K. I., and Keenlyside, N.: Will extratropical storms intensify in a warmer climate?, J. Climate, 22, 2276–2301, https://doi.org/10.1175/2008JCLI2678.1, 2009. a, b, c, d
Benjamini, Y. and Hochberg, Y.: Controlling the false discovery rate: a practical and powerful approach to multiple testing, J. R. Stat. Soc., 57, 289–300, 1995. a
Bieli, M., Sobel, A. H., Camargo, S. J., Murakami, H., and Vecchi, G. A.: Application of the cyclone phase space to extratropical transition in a global climate model, J. Adv. Model. Earth Sy., 12, e2019MS001878, https://doi.org/10.1029/2019MS001878, 2020. a
Brasseur, O.: Development and application of a physical approach to estimating wind gusts, Mon. Weather Rev., 129, 5–25, 2001. a
Bresch, D. N., Bispig, M., and Lemcke, G.: Storm over Europe. An underestimated risk, Tech. rep., Swiss Re Publishing, https://web.archive.org/web/20190429110918id_/https://media.swissre.com/documents/storm_over_europe_en.pdf (last access: 26 October 2026) 2000. a, b
Browning, K. A.: The sting at the end of the tail: damaging winds associated with extratropical cyclones, Q. J. Roy. Meteor. Soc., 130, 375–399, https://doi.org/10.1256/qj.02.143, 2004. a, b
Burt, S. D. and Mansfield, D. A.: The great storm of 15–16 October 1987, Weather, 43, 90–110, https://doi.org/10.1002/j.1477-8696.1988.tb03885.x, 1988. a, b, c
Butler, A. H., Thompson, D. W., and Heikes, R.: The steady-state atmospheric circulation response to climate change–like thermal forcings in a simple general circulation model, J. Climate, 23, 3474–3496, https://doi.org/10.1175/2010JCLI3228.1, 2010. a
Catto, J. L., Shaffrey, L. C., and Hodges, K. I.: Northern Hemisphere extratropical cyclones in a warming climate in the HiGEM high-resolution climate model, J. Climate, 24, 5336–5352, https://doi.org/10.1175/2011JCLI4181.1, 2011. a
Cheung, H. M. and Chu, J. E.: Global increase in destructive potential of extratropical transition events in response to greenhouse warming, npj Climate Atmos. Sci., 6, 137, https://doi.org/10.1038/s41612-023-00470-8, 2023. a
Clark, P. A. and Gray, S. L.: Sting jets in extratropical cyclones: a review, Q. J. Roy. Meteor. Soc., 144, 943–969, 2018. a
Clark, P. A., Browning, K. A., and Wang, C.: The sting at the end of the tail: model diagnostics of fine-scale three-dimensional structure of the cloud head, Q. J. Roy. Meteor. Soc., 131, 2263–2292, https://doi.org/10.1256/qj.04.36, 2005. a
Colle, B. A., Zhang, Z., Lombardo, K. A., Chang, E., Liu, P., and Zhang, M.: Historical evaluation and future prediction of eastern North American and western Atlantic extratropical cyclones in the CMIP5 models during the cool season, J. Climate, 26, 6882–6903, https://doi.org/10.1175/JCLI-D-12-00498.1, 2013. a
Copernicus Climate Change Service: ERA5 hourly data on pressure levels from 1940 to present, Copernicus Climate Change Service (C3S) Climate Data Store (CDS) [data set], https://doi.org/10.24381/cds.bd0915c6, 2023. a
Deser, C., Knutti, R., Solomon, S., and Phillips, A. S.: Communication of the role of natural variability in future North American climate, Nat. Clim. Change, 2, 775–779, https://doi.org/10.1038/nclimate1562, 2012. a
Dolores-Tesillos, E., Teubler, F., and Pfahl, S.: Future changes in North Atlantic winter cyclones in CESM-LE – Part 1: Cyclone intensity, potential vorticity anomalies, and horizontal wind speed, Weather Clim. Dynam., 3, 429–448, https://doi.org/10.5194/wcd-3-429-2022, 2022. a
Eady, E. T.: Long waves and cyclone waves, Tellus, 1, 33–52, https://doi.org/10.1111/j.2153-3490.1949.tb01265.x, 1949. a
Gentile, E. S., Zhao, M., and Hodges, K.: Poleward intensification of midlatitude extreme winds under warmer climate, npj Climate Atmos. Sci., 6, 219, https://doi.org/10.1038/s41612-023-00540-x, 2023. a
Gentile, E. S., Harris, L., Zhao, M., Hodges, K., Tan, Z., Cheng, K.-Y., and Zhou, L.: Response of extreme north Atlantic midlatitude cyclones to a warmer climate in the GFDL X-SHiELD kilometer-scale global storm-resolving model, Geophys. Res. Lett., 52, e2024GL112570, https://doi.org/10.1029/2024GL112570, 2025. a
Gertler, C. G. and O'Gorman, P. A.: Changing available energy for extratropical cyclones and associated convection in Northern Hemisphere summer, P. Natl. Acad. Sci. USA, 116, 4105–4110, https://doi.org/10.1073/pnas.1812312116, 2019. a
Ginesta, M., Flaounas, E., Yiou, P., and Faranda, D.: Anthropogenic climate change will intensify European explosive storms analogous to Alex, Eunice, and Xynthia, J. Climate, 37, 5427–5452, https://doi.org/10.1175/JCLI-D-23-0761.1, 2024. a, b, c, d, e, f, g, h, i, j, k, l, m, n, o, p, q, r, s
Gramcianinov, C., Campos, R., De Camargo, R., Hodges, K., Soares, C. G., and da Silva Dias, P.: Analysis of Atlantic extratropical storm tracks characteristics in 41 years of ERA5 and CFSR/CFSv2 databases, Ocean Eng., 216, 108111, https://doi.org/10.1016/j.oceaneng.2020.108111, 2020. a
Gray, W. M.: Tropical Cyclone Origin, Movement and Intensity Characteristics Based on Data Compositing Techniques, Tech. Rep. Paper 79-6, Colorado State University, Dept. of Atmospheric Science, 1979. a
Guisado-Pintado, E. and Jackson, D. W.: Multi-scale variability of storm Ophelia 2017: the importance of synchronised environmental variables in coastal impact, Sci. Total Environ., 630, 287–301, https://doi.org/10.1016/j.scitotenv.2018.02.188, 2018. a
Guisado-Pintado, E. and Jackson, D. W.: Coastal impact from high-energy events and the importance of concurrent forcing parameters: the cases of storm Ophelia (2017) and storm Hector (2018) in NW Ireland, Front. Earth Sci., 7, 190, https://doi.org/10.3389/feart.2019.00190, 2019. a
Hand, R., Keenlyside, N. S., Omrani, N.-E., Bader, J., and Greatbatch, R. J.: The role of local sea surface temperature pattern changes in shaping climate change in the North Atlantic sector, Clim. Dynam., 52, 417–438, https://doi.org/10.1007/s00382-018-4151-1, 2019. a
Hart, N. C., Gray, S. L., and Clark, P. A.: Sting-jet windstorms over the North Atlantic: climatology and contribution to extreme wind risk, J. Climate, 30, 5455–5471, 2017. a
Harvey, B. J., Cook, P., Shaffrey, L. C., and Schiemann, R.: The response of the Northern Hemisphere storm tracks and jet streams to climate change in the CMIP3, CMIP5, and CMIP6 climate models, J. Geophys. Res.-Atmos., 125, e2020JD032701, https://doi.org/10.1029/2020JD032701, 2020. a, b
Hawcroft, M. K., Shaffrey, L. C., Hodges, K. I., and Dacre, H. F.: How much Northern Hemisphere precipitation is associated with extratropical cyclones?, Geophys. Res. Lett., 39, L24809, https://doi.org/10.1029/2012GL053866, 2012. a
Hawkins, E. and Sutton, R.: The potential to narrow uncertainty in regional climate predictions, B. Am. Meteorol. Soc., 90, 1095–1108, https://doi.org/10.1175/2009BAMS2607.1, 2009. a
Hay, S., Priestley, M. D., Yu, H., Catto, J. L., and Screen, J. A.: The effect of Arctic sea-ice loss on extratropical cyclones, Geophys. Res. Lett., 50, e2023GL102840, https://doi.org/10.1029/2023GL102840, 2023. a
Hersbach, H., Bell, B., Berrisford, P., Hirahara, S., Horányi, A., Muñoz-Sabater, J., Nicolas, J., Peubey, C., Radu, R., Schepers, D., and Simmons, A.: The ERA5 global reanalysis, Q. J. Roy. Meteor. Soc., 146, 1999–2049, https://doi.org/10.1002/qj.3803, 2020. a, b
Hodges, K. I.: A general method for tracking analysis and its application to meteorological data, Mon. Weather Rev., 122, 2573–2586, https://doi.org/10.1175/1520-0493(1994)122<2573:AGMFTA>2.0.CO;2, 1994. a
Hodges, K. I.: Feature tracking on the unit-sphere, Mon. Weather Rev., 123, 3458–3465, https://doi.org/10.1175/1520-0493(1995)123<3458:FTOTUS>2.0.CO;2, 1995. a
Hodges, K. I.: Adaptive constraints for feature tracking, Mon. Weather Rev., 127, 1362–1373, https://doi.org/10.1175/1520-0493(1999)127<1362:ACFFT>2.0.CO;2, 1999. a, b
Hodges, K. I., Lee, R. W., and Bengtsson, L.: A comparison of extratropical cyclones in recent reanalyses: ERA-Interim, NASA MERRA, NCEP CFSR, and JRA-25, J. Climate, 24, 4888–4906, https://doi.org/10.1175/2011JCLI4097.1, 2011. a
Hoskins, B. J. and Hodges, K. I.: New perspectives on the Northern Hemisphere winter storm tracks, J. Atmos. Sci., 59, 1041–1061, https://doi.org/10.1175/1520-0469(2002)059<1041:NPOTNH>2.0.CO;2, 2002. a, b
Inatsu, M., Mukougawa, H., and Xie, S.-P.: Atmospheric response to zonal variations in midlatitude SST: transient and stationary eddies and their feedback, J. Climate, 16, 3314–3329, https://doi.org/10.1175/1520-0442(2003)016<3314:ARTZVI>2.0.CO;2, 2003. a, b
Keller, J. H., Grams, C. M., Riemer, M., Archambault, H. M., Bosart, L., Doyle, J. D., Evans, J. L., Galarneau, T. J. J., Griffin, K., Harr, P. A., and Kitabatake, N.: The extratropical transition of tropical cyclones. Part II: Interaction with the midlatitude flow, downstream impacts, and implications for predictability, Mon. Weather Rev., 147, 1077–1106, https://doi.org/10.1175/MWR-D-17-0329.1, 2019. a
Knutson, T., Camargo, S. J., Chan, J. C., Emanuel, K., Ho, C. H., Kossin, J., Mohapatra, M., Satoh, M., Sugi, M., Walsh, K., and Wu, L.: Tropical cyclones and climate change assessment: Part II: Projected response to anthropogenic warming, B. Am. Meteorol. Soc., 101, E303–E322, https://doi.org/10.1175/BAMS-D-18-0194.1, 2020. a
Koch, P., Wernli, H., and Davies, H. C.: An event based jet stream climatology and typology, Int. J. Climatol., 26, 283–301, https://doi.org/10.1002/joc.1255, 2006. a
Lehmann, J., Coumou, D., Frieler, K., Eliseev, A. V., and Levermann, A.: Future changes in extratropical storm tracks and baroclinicity under climate change, Environ. Res. Lett., 9, 084002, https://doi.org/10.1088/1748-9326/9/8/084002, 2014. a
Li, M., Woollings, T., Hodges, K., and Masato, G.: Extratropical cyclones in a warmer, moister climate: a recent Atlantic analogue, Geophys. Res. Lett., 41, 8594–8601, https://doi.org/10.1002/2014GL062186, 2014. a
Manning, C., Kendon, E. J., Fowler, H. J., Roberts, N. M., Berthou, S., Suri, D., and Roberts, M. J.: Extreme windstorms and sting jets in convection-permitting climate simulations over Europe, Clim. Dynam., 58, 2387–2404, 2022. a
Manning, C., Kendon, E. J., Fowler, H. J., and Roberts, N. M.: Projected increase in windstorm severity and contribution from sting jets over the UK and Ireland, Wea. Climate Extremes, 40, 100562, https://doi.org/10.1016/j.wace.2023.100562, 2023. a
Met Office: Storm Arwen, 26–27 November 2021, Tech. rep., Met Office, https://www.metoffice.gov.uk/binaries/content/assets/metofficegovuk/pdf/weather/learn-about/uk-past-events/interesting/2021/2021_07_storm_arwen.pdf (last access: 30 December 2025), 2021. a
Met Éireann: An Analysis of Storm Ophelia which struck Ireland on 16 October 2017, Tech. rep., Met Éireann, Irish Meteorological Service, last https://www.met.ie/cms/assets/uploads/2018/10/Ophelia.pdf (last access: 30 December 2025), 2018. a, b
Mizuta, R., Matsueda, M., Endo, H., and Yukimoto, S.: Future change in extratropical cyclones associated with change in the upper troposphere, J. Climate, 24, 6456–6470, https://doi.org/10.1175/2011JCLI3969.1, 2011. a, b, c
Owen, L. E., Catto, J. L., Stephenson, D. B., and Dunstone, N. J.: Compound precipitation and wind extremes over Europe and their relationship to extratropical cyclones, Wea. Climate Extremes, 33, 100342, https://doi.org/10.1016/j.wace.2021.100342, 2021. a
Palmer, T. E., McSweeney, C. F., Booth, B. B. B., Priestley, M. D. K., Davini, P., Brunner, L., Borchert, L., and Menary, M. B.: Performance-based sub-selection of CMIP6 models for impact assessments in Europe, Earth Syst. Dynam., 14, 457–483, https://doi.org/10.5194/esd-14-457-2023, 2023. a, b, c
PERILS: Eur 49M Ireland, GBP 10M UK – Insured market loss for Ex-Hurricane Ophelia, Press release, https://www.perils.org/files/News/2017/Loss-Annoucements/Ophelia/PERILS-Press-Release-Ex-Hurricane-Ophelia-27-Nov-2017.pdf (last access: 15 May 2026), 2017. a
PERILS: Losses, https://www.perils.org/losses?year=&classification=1012&status=#event-losses, last access: 15 May 2026. a
Pfahl, S., O'Gorman, P. A., and Fischer, E. M.: Understanding the regional pattern of projected future changes in extreme precipitation, Nat. Clim. Change, 7, 423–427, https://doi.org/10.1038/nclimate3287, 2017. a, b
Priestley, M. D. K. and Catto, J. L.: Future changes in the extratropical storm tracks and cyclone intensity, wind speed, and structure, Weather Clim. Dynam., 3, 337–360, https://doi.org/10.5194/wcd-3-337-2022, 2022. a, b, c, d, e, f, g
Priestley, M. D., Ackerley, D., Catto, J. L., Hodges, K. I., McDonald, R. E., and Lee, R. W.: An overview of the extratropical storm tracks in CMIP6 historical simulations, J. Climate, 33, 6315–6343, 2020. a, b, c, d
Priestley, M. D., Ackerley, D., Catto, J. L., and Hodges, K. I.: Drivers of biases in the CMIP6 extratropical storm tracks. Part I: Northern Hemisphere, J. Climate, 36, 1451–1467, https://doi.org/10.1175/JCLI-D-20-0976.1, 2023. a
Rivière, G., Arbogast, P., Maynard, K., and Joly, A.: The essential ingredients leading to the explosive growth stage of the European wind storm Lothar of Christmas 1999, Q. J. Roy. Meteor. Soc., 136, 638–652, https://doi.org/10.1002/qj.585, 2010. a
Saha, S., Moorthi, S., Pan, H., Wu, X., Wang, J., Nadiga, S., Tripp, P., Kistler, R., Woollen, J., Behringer, D., Liu, H., Stokes, D., Grumbine, R., Gayno, G., Wang, J., Hou, Y., Chuang, H., Juang, H. H., Sela, J., Iredell, M., Treadon, R., Kleist, D., Van Delst, P., Keyser, D., Derber, J., Ek, M., Meng, J., Wei, H., Yang, R., Lord, S., van den Dool, H., Kumar, A., Wang, W., Long, C., Chelliah, M., Xue, Y., Huang, B., Schemm, J., Ebisuzaki, W., Lin, R., Xie, P., Chen, M., Zhou, S., Higgins, W., Zou, C., Liu, Q., Chen, Y., Han, Y., Cucurull, L., Reynolds, R. W., Rutledge, G., and Goldberg, M. : The NCEP climate forecast system reanalysis, B. Am. Meteorol. Soc., 91, 1015–1058, 2010. a
Saha, S., Moorthi, S., Wu, X., Wang, J., Nadiga, S., Tripp, P., Behringer, D., Hou, Y., Chuang, H., Iredell, M., Ek, M., Meng, J., Yang, R., Mendez, M. P., van den Dool, H., Zhang, Q., Wang, W., Chen, M., and Becker, E.: The NCEP climate forecast system version 2, J. Climate, 27, 2185–2208, 2014. a
Sainsbury, E. M., Schiemann, R. K., Hodges, K. I., Shaffrey, L. C., Baker, A. J., and Bhatia, K. T.: How important are post tropical cyclones for European windstorm risk?, Geophys. Res. Lett., 47, e2020GL089853, https://doi.org/10.1029/2020GL089853, 2020. a, b, c, d
Schemm, S.: Toward eliminating the decades old “too zonal and too equatorward” storm track bias in climate models, J. Adv. Model. Earth Sy., 15, e2022MS003482, https://doi.org/10.1029/2022MS003482, 2023. a
Schiemann, R. K. H., Lister, G., Hatcher, R., Hodson, D., Lawrence, B., Shaffrey, L., Cole, J., Dittus, A., Mecking, J., Robson, J., Wilson, S., Aksenov, Y., Blaker, A. T., Harvey, B., Martínez-Alvarado, O., Osprey, A., Rynders, S., Ahmadi, S., Aylmer, J., Baker, L., Case, D., Gentile, E. S., George, S., Hodges, K., Karlowska, E., Lang, C., Lu, H., O'Callaghan, N., Osmolska, W., Osprey, S., Phillips, T., Schröder, D., Smith, R., Turner, A. G., Woolnough, S., Andrews, M., Coward, A., Hardiman, S., Harle, J., Rostron, J. W., Sexton, D. M. H., Sinha, B., Williams, J., and Wilson, C.: The CANARI HadGEM3 Large Ensemble: Design, and evaluation of historical experiments, EGUsphere [preprint], https://doi.org/10.5194/egusphere-2026-2281, 2026a. a, b, c, d, e, f, g
Schiemann, R. K. H., Lister, G., Hatcher, R., Hodson, D., Lawrence, B., Shaffrey, L. C., Cole, J., Dittus, A., Mecking, J., Robson, J., Wilson, S., Aksenov, Y., Blaker, A., Harvey, B., Martinez-Alvarado, O., Osprey, A., Rynders, S., Ahmadi, S., Aylmer, J., Baker, L., Case, D., Gentile, E. S., George, S., Hodges, K., Karlowska, E., Lang, C., Lu, H., O'Callaghan, N., Osmolska, W., Osprey, S., Phillips, T., Schröder, D., Smith, R., Turner, A. G., Woolnough, S., Andrews, M., Coward, A., Hardiman, S., Harle, J., Rostron, J., Sexton, D., Sinha, B., Williams, J., and Wilson, C.: CANARI LE Priority Variables from the HadGEM3.1 large ensemble of climate model simulations for the CANARI project (v1), CEDA Archive [data set], https://doi.org/10.5285/4B62FAFC68AE4C3784FB2819F652C 537, 2026b. a
Shaw, T. A., Baldwin, M., Barnes, E. A., Caballero, R., Garfinkel, C. I., Hwang, Y. T., Li, C., O'Gorman, P. A., Rivière, G., Simpson, I. R., and Voigt, A.: Storm track processes and the opposing influences of climate change, Nat. Geosci., 9, 656–664, https://doi.org/10.1038/ngeo2783, 2016. a, b, c
Shepherd, T. G.: A common framework for approaches to extreme event attribution, Curr. Climate Change Rep., 2, 28–38, https://doi.org/10.1007/s40641-016-0033-y, 2016. a
Shiogama, H., Fujimori, S., Hasegawa, T., Hayashi, M., Hirabayashi, Y., Ogura, T., Iizumi, T., Takahashi, K., and Takemura, T.: Important distinctiveness of SSP3–7.0 for use in impact assessments, Nat. Clim. Change, 13, 1276–1278, https://doi.org/10.1038/s41558-023-01883-2, 2023. a
Sinclair, V. A., Rantanen, M., Haapanala, P., Räisänen, J., and Järvinen, H.: The characteristics and structure of extra-tropical cyclones in a warmer climate, Weather Clim. Dynam., 1, 1–25, https://doi.org/10.5194/wcd-1-1-2020, 2020. a, b, c, d
Smart, D., Lee, S. H., and Graham, E.: Some aspects of the unusual climatology of Storm Arwen, Weather, 77, 31–33, https://doi.org/10.1002/wea.4138, 2021. a, b, c
Ulbrich, U., Fink, A. H., Klawa, M., and Pinto, J. G.: Three extreme storms over Europe in December 1999, Weather, 56, 70–80, https://doi.org/10.1002/j.1477-8696.2001.tb06540.x, 2001. a, b, c, d
Ulbrich, U., Leckebusch, G. C., and Pinto, J. G.: Extra-tropical cyclones in the present and future climate: a review, Theor. Appl. Climatol., 96, 117–131, https://doi.org/10.1007/s00704-008-0083-8, 2009. a, b
Wilks, D.: “The stippling shows statistically significant grid points”: how research results are routinely overstated and overinterpreted, and what to do about it, B. Am. Meteorol. Soc., 97, 2263–2273, 2016. a
Williams, K. D., Copsey, D., Blockley, E. W., Bodas Salcedo, A., Calvert, D., Comer, R., Davis, P., Graham, T., Hewitt, H. T., Hill, R., and Hyder, P.: The Met Office global coupled model 3.0 and 3.1 (GC3.0 and GC3.1) configurations, J. Adv. Model. Earth Sy., 10, 357–380, https://doi.org/10.1002/2017MS001115, 2018. a, b
Woollings, T., Gregory, J., Pinto, J., Reyers, M., and Brayshaw, D. J.: Response of the North Atlantic storm track to climate change shaped by ocean–atmosphere coupling, Nat. Geosci., 5, 313–317, https://doi.org/10.1038/ngeo1438, 2012. a, b
Zappa, G. and Shepherd, T. G.: Storylines of atmospheric circulation change for European regional climate impact assessment, J. Climate, 30, 6561–6577, https://doi.org/10.1175/JCLI-D-16-0807.1, 2017. a
Zappa, G., Shaffrey, L. C., Hodges, K. I., Sansom, P. G., and Stephenson, D. B.: A multimodel assessment of future projections of North Atlantic and European extratropical cyclones in the CMIP5 climate models, J. Climate, 26, 5846–5862, https://doi.org/10.1175/JCLI-D-12-00573.1, 2013. a, b
- Abstract
- Introduction
- Background on the four case-study cyclones
- Data and methods
- Evaluation of extratropical cyclone frequency and intensity in the CANARI LE
- Evaluation of the analogue cyclones in the CANARI LE
- Assessment of changes in dynamical intensity, weather hazards and dynamical drivers
- Discussion
- Conclusions
- Code and data availability
- Author contributions
- Competing interests
- Disclaimer
- Acknowledgements
- Financial support
- Review statement
- References