the Creative Commons Attribution 4.0 License.
the Creative Commons Attribution 4.0 License.
 | 10 May 2022
Orographic resolution driving the improvements associated with horizontal resolution increase in the Northern Hemisphere winter mid-latitudes
Federico Fabiano
Irina Sandu
In recent years much attention has been devoted to the investigation of the impact of increasing the horizontal resolution of global climate models. In the present work, a set of atmosphere-only idealized sensitivity simulations with EC-Earth3 has been designed to disentangle the relative roles of increasing the resolution of the resolved orography and of the atmospheric grid. Focusing on the Northern Hemisphere winter, it is shown that if the grid is refined while keeping the resolved orography unchanged, model biases are reduced only on some specific occasions. Conversely, increasing the resolved (or mean) orography is found to clearly reduce several important systematic model errors, including synoptic transient eddies, the North Atlantic jet stream variability, and atmospheric blocking frequency and duration. From an analysis of the radiation budget it is concluded that the large changes in radiative fluxes caused by the resolution increase – something commonly observed in climate models – have a relevant impact on the atmospheric circulation, partially offsetting the benefits obtained from the increase in orographic resolution. These findings point to the necessity of always tuning climate models to fully exploit the benefits of high horizontal resolution.
- Article
(10312 KB) - Full-text XML
-
Supplement
(14751 KB) - BibTeX
- EndNote


Global climate models (GCMs) have been shown to be powerful tools for understanding Earth's climate variability and for estimating its future evolution. Consequently, a considerable effort has been undertaken in the last few decades to improve their reliability and accuracy. Continuous scientific development, which has resulted in improved parameterization schemes and novel numerical techniques, combined with supercomputing technologies and capabilities has allowed for notable steps forward in both the quality of the simulated present-day climate and the reliability of future projections. The increased computational power has for example allowed scientists to (1) include additional components to better represent the Earth system (e.g. Flato, 2011), (2) increase the ensemble size to better sample unforced variability (e.g. Kay et al., 2015; Wyser et al., 2021), and (3) increase model horizontal and vertical resolution to increase the fidelity of climate simulations by more explicitly representing key processes for the atmospheric or oceanic circulations (e.g. Haarsma et al., 2016).
This latter point has been explored by several modelling initiatives, such as the Athena (Jung et al., 2012), the UPSCALE (Mizielinski et al., 2014) or the Climate SPHINX (Davini et al., 2017b) projects, which all aimed at exploring the benefits of an increased horizontal resolution. More recently, the community-wide effort made in the framework of the HighResMIP project (Haarsma et al., 2016) further demonstrated the capability of high-resolution models to improve several characteristics of the mean climate and its variability (e.g. Roberts et al., 2020; Fabiano et al., 2020; Bellucci et al., 2021; Zhang et al., 2021). More generally, recent outcomes from the Coupled Model Intercomparison Project Phase 6 (CMIP6; Eyring et al., 2016) also highlighted that – on average – higher-resolution GCMs outperform lower-resolution ones (e.g. Davini and d'Andrea, 2020; Fabiano et al., 2021; Priestley et al., 2020; Schiemann et al., 2020).
The model effective resolution, i.e. the smallest scale reasonably represented by a numerical model, is considerably larger than the model mesh. Sampling theory already predicts that two grid increments are required to correctly represent data, but due to numerical diffusion and aliasing and anti-aliasing filters, the model effective resolution is estimated to be between 3 and 5 times the grid spacing (Klaver et al., 2020). Since increasing horizontal resolution implies smaller numerical truncation errors when solving the equations of motion, a finer grid positively affects the dynamics, thus leading to better-resolved atmospheric eddies at a finer scale – as can be seen for tropical cyclones (Roberts et al., 2015; Vidale et al., 2021).
However, while the dynamical aspects of a GCM certainly take advantage of a finer grid, numerical schemes and physical parameterizations might respond in a less coherent way to a resolution increase: many aspects of the radiation budget and hydrological cycle are also affected by the model horizontal resolution (Vannière et al., 2019; Bador et al., 2020). For instance, time steps are decreased when moving to higher resolution to accommodate numerical instabilities, implying indirect changes in convective-adjustment timescales (Nordeng, 1994) or in the radiation scheme (Hogan and Hirahara, 2016). Furthermore, aspects of the dynamical core such as the advection scheme might not be perfectly conserving, so unexpected sources or sinks of heat may be present (Lucarini and Ragone, 2011; Mauritsen et al., 2012; Hobbs et al., 2016); the magnitude of these errors might be sensitive to the model grid (Polichtchouk et al., 2019).
One often neglected aspect is that studies which investigate the role of horizontal resolution do not perform re-tuning of the model at higher resolution (e.g. Haarsma et al., 2016). Climate model tuning is a fundamental aspect of model development, which relies on adjusting parameters from sub-grid parameterizations (usually involving clouds and convection) aimed at reducing model systematic errors (Hourdin et al., 2017). It is therefore hard to disentangle the contribution from the tuned/untuned parameterizations and the actual grid refinement: in the few circumstances when this has been done, the role of tuning has been shown to be non-negligible for several radiative and hydrological fields (Terai et al., 2018).
Another model feature which is significantly affected by horizontal resolution is the level of detail at which the model orography is resolved. Differently to convection, which only becomes resolved at the kilometre scale, orographic effects are partially resolved and partially parameterized from resolutions of hundreds of kilometres to kilometre-scale resolutions due to the fact that the orographic effects encompass a variety of scales across this resolution range. Orography is well-known to considerably impact the Northern Hemisphere winter circulation from daily to climate timescales (Held et al., 2002; Sandu et al., 2016; Pithan et al., 2016; van Niekerk et al., 2017). This is due both to the direct forcing on the planetary waves induced by the large-scale orographic barriers such as Rocky Mountains or Tibetan Plateau (Brayshaw et al., 2009; White et al., 2021) and to the small-scale processes, such as turbulent orographic form drag, blocking of the flow at low levels and breaking of orographically generated gravity waves in the upper troposphere and stratosphere (Lott and Miller, 1997; Beljaars et al., 2004; Sandu et al., 2019). However, the representation of orographic processes in weather and climate models remains uncertain to date, in particular due to the difficulties in constraining orographic drag processes and the parameterizations used to represent them (Sandu et al., 2019). Thus, many questions related to orographic processes and their impacts on the atmospheric flow remain open.
In this study, one of these aspects is explored: to what extent the increased fidelity of the higher-horizontal-resolution climate simulations is due to the fact that more orographic effects become explicitly resolved. Following Kanehama et al. (2019), who explored this question for weather timescales, hereafter the term “atmospheric resolution” will be used to refer to the grid spacing at which the atmosphere and land surface are discretized. Similarly, the term “orographic resolution” will be used to refer to the resolution of the grid box mean (or resolved) orography. This allows the creation of a clear distinction between the model grid spacing and the level of detail of the orography.
Kanehama et al. (2019) demonstrated that – in the absence of orographic drag parameterizations – increases in orographic resolution are responsible for most of the improvement in the Northern Hemisphere winter medium-range forecast skill obtained when increasing the horizontal resolution of a numerical weather prediction system. Previous evidence also suggests that at climate timescales the orographic resolution may be responsible for an important part of the benefits of the increase in the horizontal resolution (Jung et al., 2012; Berckmans et al., 2013). Increasing the resolution of the resolved orography increases the level of detail at which mountains are represented within the model: for example, the maximum height of the orographic barriers is elevated, so orographic-induced drag is larger and zonal winds are slowed down (White et al., 2021). All these changes, which are not directly dependent on the model atmospheric resolution, might have a large impact on several aspects of the mid-latitude climate variability (e.g. jet stream dynamics, atmospheric blocking, transient eddy activity). Those aspects have never been explored in a comprehensive way. Given the considerable efforts to increase horizontal resolutions of GCMs in recent years, it is important to assess in a more quantitative manner to what extent the orographic resolution increase is responsible for the improvements obtained when increasing the horizontal resolution of the atmospheric component of GCMs.
This study thus aims to investigate the relative roles of the orographic and atmospheric resolution in shaping the simulated climate, extending and deepening the analysis developed at the weather timescale by Kanehama et al. (2019) to a climate framework. It will thus try to shed light on the impact on both the mean climate and its variability, with a special focus on the Northern Hemisphere winter mid-latitude dynamics. This is done with a set of idealized atmosphere-only simulations carried out with the EC-Earth3 GCM at three different horizontal resolutions (from ∼ 80 to ∼ 25 km).
Section 2 will include the presentation of the experimental setup and of the diagnostics used to investigate the mid-latitude climate. Sections 3 and 4 will include the analysis of the mean climate and of the mid-latitude variability respectively. Finally, Sect. 5 will investigate the role of the radiative budget in the framework of the results found, and Sect. 6 will present the final discussion and conclusions.
2.1 Experimental setup
A set of sensitivity experiments has been performed with the atmosphere-only configuration of the EC-Earth3 Earth System Model (Döscher et al., 2022). The atmospheric component of EC-Earth3 is based on the Integrated Forecasting System (IFS) cy36r4 developed by the European Centre for Medium-Range Weather Forecasts (ECMWF). The CMIP6 configuration of the model has been used, with the default CMIP6 resolution (TL255, which corresponds roughly to an 80 km grid spacing) and with two higher horizontal resolutions (TL511 and TL799, about 40 and 25 km respectively). The vertical resolution, which consists of 91 vertical levels (with the model top at 1 Pa), is kept the same in all simulations.
All the sensitivity experiments are atmosphere-only. In order to reduce as much as possible the possible sources of forced variability, sea surface temperature (SST) and sea-ice concentration (SIC) boundary conditions are provided as climatological cycles derived from the years 1985–2015 of the input4MIPs data. Similarly, greenhouse gases, ozone and aerosol concentrations are fixed to the year 2000 of the CMIP6 historical forcing (Eyring et al., 2016). Each integration lasts 31 years: 30 years is considered for the analysis, allowing for a 1-year spin-up. The TL799 experiments are performed for only 24 years due to their larger computational cost. However, considering only a 23-year time window for all experiments does not affect the results (not shown). It is important to point out that no extra tuning has been performed for the higher-resolution configurations, while the low-resolution TL255 configuration had been tuned prior to performing the EC-Earth3 CMIP6 simulations.
Orographic parameterizations of sub-grid orographic processes are known to have a considerable impact on Northern Hemisphere circulation. Two parameterizations are used in the IFS, namely the turbulent orographic form drag (TOFD; Beljaars et al., 2004) and the sub-grid-scale orography (SSO; Lott and Miller, 1997). The TOFD scheme represents the form drag due to orographic features with horizontal scales less than 5 km, while the SSO scheme represents drag to orographic features with horizontal scales larger than 5 km, associated with gravity wave breaking and with low-level flow blocking. Both schemes decelerate the zonal flow; however, since they depend on the strength of the zonal wind, they indirectly interact with each other (Sandu et al., 2016) and with the resolved orography (van Niekerk et al., 2018). Therefore, their interaction will be resolution dependent – since mean wind will be different in each configuration. Consequently, in order to disentangle the impact of the resolved orography on the Northern Hemisphere winter circulation, both the TOFD and the SSO schemes are turned off in all the sensitivity experiments.
This follows what was done in Kanehama et al. (2019) in order to avoid interactions between resolved and unresolved orographic processes. As expected, turning off the two parameterizations leads to a considerable deterioration of the mean climate, causing an increase in the jet speed at both low and upper levels. This corroborates previous studies which have demonstrated the major role played by these schemes for a realistic representation of the Northern Hemisphere circulation (Palmer et al., 1986; Pithan et al., 2016; van Niekerk et al., 2017, 2018; Sandu et al., 2019; White et al., 2021).
In this setup, five experiments were performed:
-
three control runs at TL255, TL511 and TL799 (labelled ctrl hereafter);
-
two runs at TL511 and TL799 with the mean orography at TL255 resolution (labelled orog255 hereafter).
For the TL255-ctrl configuration, in order to have an estimate of the internal variability over the 30-year period, three ensemble members starting from different initial conditions have been run. The differences between the three members have been shown to be generally small compared to the differences between TL255-ctrl and the other experiments (not shown). In order to reduce the atmospheric noise as much as possible, when analysing the TL255-ctrl, the ensemble mean of the three integrations is used. Finally, one additional run at TL255 with the TOFD and SSO schemes active (labelled ctrl-param hereafter) has been performed. This is the same configuration as the one used for the CMIP6 integrations (Döscher et al., 2022).
Although a proper comparison with reanalysis datasets is not possible, due to the idealized character of the experiments, the ECMWF ERA5 reanalysis (Hersbach et al., 2020) has been used as a reference to estimate the model biases. The time window considered is 1986–2015, which covers the window used for the SST and SIC forcing.
Multiple physical and dynamical fields, with both monthly and daily frequency, have been analysed, focusing on the extended winter season from December to March (DJFM). Only radiative budgets have been estimated on the yearly timescale.
In Sect. 6, a brief analysis of the atmosphere-only simulations from a set of GCMs participating in the HighResMIP project (Haarsma et al., 2016) is carried out: data from CNRM-CM6 (Voldoire et al., 2019), EC-Earth3P (Haarsma et al., 2020), ECMWF-IFS (Roberts et al., 2018), HadGEM3-GC31 (Williams et al., 2018), IPSL-CM6A (Boucher et al., 2020) and MPI-ESM1.2 (Gutjahr et al., 2019) are used. All models have nominal resolutions ranging from 250 to 25 km, and for each model at least two versions are available, one at standard resolution and one at higher resolution; some models provide additional intermediate resolutions as well. All the models have been tuned in their low-resolution configuration version, and the high-resolution version is obtained by just increasing the grid space horizontal resolution, with no specific tuning.
In order to compare outputs of simulations performed at different resolutions, all data are interpolated on a common 2.5∘ × 2.5∘ grid with a bilinear remapping method.
2.2 Derivation of atmospheric and orographic resolution impacts
In order to summarize the discussion regarding the impact of the atmospheric and orographic resolution increases, a compact presentation of the five experiments has been adopted in several of the figures presented in Sects. 3 and 4.
By comparing the orog255 experiments at different resolutions (TL511 and TL799) with TL255-ctrl, it is possible to estimate the net impact of the increase in atmospheric resolution while keeping constant the mean resolved orography. The impact of the “atmospheric resolution increase” is thus computed as the average of the differences between the TL799-orog255 and TL255-ctrl experiments and between the TL511-orog255 and TL255-ctrl experiments.
Similarly, by comparing the ctrl and orog255 experiments (at both TL511 and TL799), it is possible to estimate the direct contribution of the better-resolved mean orography. The impact of the “orographic resolution increase” is thus computed as the average of the differences between the TL799-ctrl and TL799-orog255 experiments and between the TL511-ctrl and TL511-orog255 experiments.
As expected, the signals obtained for the TL799 experiments are on average larger than the ones obtained for the TL511 experiments, but for most fields the two responses are consistent. Averaging the responses at TL511 and TL799 overcomes eventual issues arising from the limited length of the simulations by providing a more robust statistical sample.
2.3 Climate variability diagnostics
In order to assess the impact of the atmospheric and orographic resolutions on the Northern Hemisphere winter circulation, different diagnostics are used. These metrics, which focus on several aspects of the synoptic-scale climate variability, are presented in the following paragraphs.
2.3.1 Jet latitude index
The variability of the North Atlantic eddy-driven jet stream is estimated through the jet latitude index (JLI) developed by Woollings et al. (2010). The index describes the daily position of the low-level jet over the Atlantic Ocean, and it is defined as the daily latitude of the maximum of the zonal wind at 850 hPa between 15 and 75∘ N, zonally averaged between 60 and 0∘ W. In order to filter out high-frequency variability, a 10 d Lanczos filter with a 31 d bandwidth is used.
2.3.2 Atmospheric blocking indices
Atmospheric blocking is a recurrent weather pattern that typically occurs in the Northern Hemisphere at the exit of the Atlantic and Pacific jet stream (Tibaldi and Molteni, 1990; Davini et al., 2012), whose accurate simulation still represents a serious challenge for state-of-the-art GCMs (e.g. Davini and d'Andrea, 2020; Schiemann et al., 2020). In order to objectively recognize blocking events, several blocking indices have been developed (see Woollings et al., 2018). Those indices can be approximately clustered in mainly two families: those based on the reversal of some absolute field (e.g. Masato et al., 2011) and those based on the anomaly of some field exceeding a defined threshold (e.g. Schwierz et al., 2004). In the present work two indices, both based on the geopotential height at 500 hPa (Z500) – one from each category – have been adopted.
Most of the analysis is carried out with a 2-D index based on the reversal of the meridional gradient of geopotential height, as done by Davini et al. (2012) (REV index hereafter). Two meridional geopotential height gradients at southern (GHGS) and northern (GHGN) latitudes are defined:
where ϕ0 ranges from 30 to 75∘ N and λ0 ranges from 0 to 360∘. ; . Instantaneous blocking for the reversal index (REV hereafter) is thus identified when
A second 2-D index based on the geopotential height anomaly from the mean flow has been computed adapting the definition given by Schwierz et al. (2004), as also done by Woollings et al. (2018) (ANO index hereafter). Daily Z500 anomalies are computed for each grid point as the difference with respect to the climatological mean for each dataset. Instantaneous blocking is detected as areas where daily Z500 anomalies exceed the 90th percentile of the Z500 anomaly distribution over 50–80∘ N.
For both ANO and REV indices further spatial and temporal constraints are introduced; this ensures that blocking covers a sufficient area and persists for at least 5 d. Those constraints are applied according to Davini et al. (2012), thus defining the blocking events (BEs). The percentage of days per season in which BEs occur (i.e. the number of blocked days) defines the blocking frequency climatology. Similarly, it is possible to define the BE duration as the average persistence of BEs for each grid point. A complete description of the REV blocking climatology and of the blocking detection scheme and its caveats and benefits may be found in Davini et al. (2012).
2.3.3 High-frequency variability
High-frequency variability is key to investigating the behaviour of transient eddies at mid-latitudes. Here it is measured by applying a bandpass Fourier filtering between 2 and 6 d; filtered variables are hereafter indicated with a prime. Transient eddy activity is evaluated by using the standard deviation of the bandpass-filtered daily geopotential height at 500 hPa. In analogy, the upper tropospheric transient eddy kinetic energy is computed using the bandpass-filtered zonal and meridional wind.
2.3.4 Barotropic and baroclinic energy conversion
Two more diagnostics are used to evaluate the transfer of energy from the mean flow to the eddies and vice versa. The role of the eddy forcing on the large-scale flow is analysed using the scalar product E⋅D, which is a measure of barotropic exchange of kinetic energy between the transient eddies and the large-scale flow (Cai and Mak, 1990). E is defined as the horizontal part of the local Eliassen–Palm vector (Trenberth, 1986), which is very similar to the Hoskins E vector (Hoskins et al., 1983) and is computed evaluating the bandpass-filtered u and v as
Conversely, D is the deformation of the mean field, where Dx is the stretching deformation and Dy the shear deformation (Cai and Mak, 1990; Black and Dole, 2000):
E⋅D is usually computed in the upper troposphere (i.e. 250 hPa) where it reaches its highest values. Positive values of the E⋅D scalar (also known as barotropic energy conversion) indicate regions where the mean flow is feeding the synoptic eddies, while negative values point to regions where the mean flow is fed by the eddies. Large negative values are commonly seen in the exit region of the storm track, where the eddies are “barotropizing” the flow, while smaller positive values are found in the entrance region of the storm track (Black and Dole, 2000)
Similarly to the barotropic conversion, a baroclinic conversion energy term is introduced. It is defined following Riviere and Joly (2006) as
which is the product between the meridional potential temperature gradient and the high-frequency meridional heat fluxes divided by a static stability parameter S, here defined as
where p0 is the reference pressure (i.e. 1000 hPa), cv and cp are the atmospheric specific heat at constant volume and pressure respectively, and R is the gas constant for dry air. The baroclinic conversion term F, usually evaluated in the lower troposphere (i.e. 850 hPa), is mainly characterized by positive values, highlighting areas where the available potential energy of the mean flow is transferred to the eddies, namely in the core of the storm tracks (Cai and Mak, 1990; Riviere and Joly, 2006).
2.4 Statistical significance and performance diagnostics
In order to assess whether the changes induced by orographic and atmospheric resolution changes are significant or not, a Welch t test (at a 95 % or 99 % significance level) has been used assuming independence between consecutive winters.
Finally, aiming at objectively measuring the model improvements associated with orographic or atmospheric resolution, two scalar diagnostics are extensively used in the paper: (1) the pattern correlation improvement (PCI) and (2) the relative RMSE improvement (RRI), where RMSE stands for root mean square error. PCI is defined as the area-weighted (or pressure-weighted) Pearson correlation coefficient between the TL255-ctrl systematic error (i.e. TL255-ctrl minus ERA5 climatology) and the changes induced by the atmospheric or orographic resolution. RRI is the area-weighted (or pressure-weighted) relative RMSE change following the increase in orographic/atmospheric resolution compared to the RMSE of the TL255-ctrl against the ERA5 reanalysis. For both diagnostics, a negative number implies a resolution-induced change which reduces the model bias, while a number close to zero (or one that is positive) might suggest an unmodified (or a deteriorated) model bias.
The impact of the atmospheric and orographic resolutions is firstly explored in terms of key characteristics of the mean climate during the Northern Hemisphere winter season (DJFM). The TL255-ctrl experiment shows moderate biases in zonally averaged temperature and wind, as shown by Fig. 1. It should be noted that this experiment is missing the sub-grid orographic parameterizations, and hence these biases are larger than in the default EC-Earth3 configuration (not shown). The TL255-ctrl experiment is characterized by an overly intense temperature gradient at upper levels and by a too weak gradient at lower levels (Fig. 1a), which is reflected in a too strong jet stream, especially in the upper troposphere, in both the hemispheres (Fig. 1d). Additionally, the stratospheric polar vortex is overestimated by several m s−1. The unequal distribution of meridional temperature gradients is a recurrent problem that has already been seen in previous versions of EC-Earth (Davini et al., 2017a).
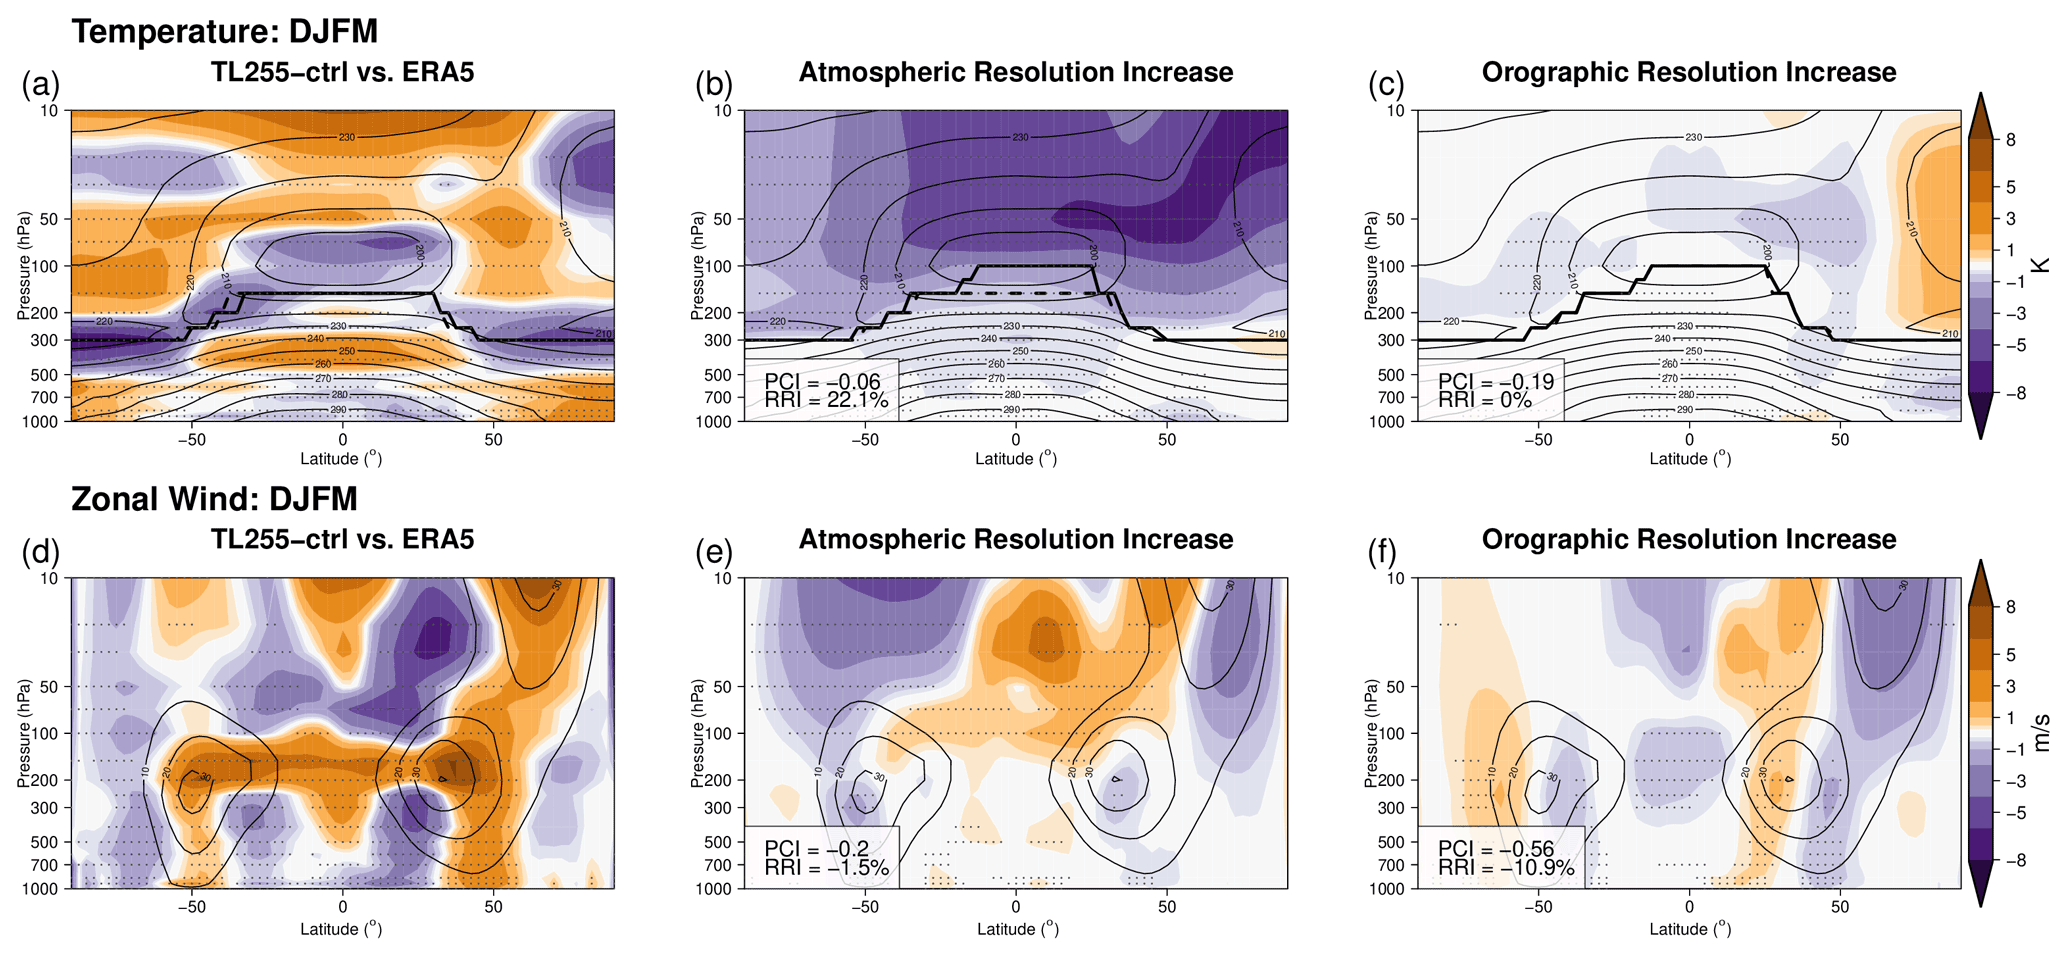
Figure 1DJFM zonal mean temperature (a–c) and zonal wind (d–f): (a, d) EC-Earth3 TL255-ctrl bias with respect to ERA5, (b, e) changes induced by the atmospheric resolution increase and (c, f) changes induced by the orographic resolution increase. Shading shows differences and contours the TL255-ctrl field. Please note the irregular colour-bar spacing. In (a)–(c) black lines show the tropopause height for reference (dashed) and changes (solid). Stippling indicates significance with a Welch t test at the 1 % level. In (b), (c), (e) and (f) the PCI and RRI (see text for details) are reported at the bottom left of each panel: large negative values imply reduced bias.
As shown by Fig. 1b, c, e and f, the impact of the atmospheric resolution increase is completely different from the impact of the orographic resolution increase. In the zonal average, the most impressive change is the cooling of the stratosphere following the atmospheric resolution increase (Fig. 1b), which is associated with an increase in the tropopause height, possibly caused by changes in the representation of gravity waves and by errors in vertical advection (Polichtchouk et al., 2019). The changes in the tropospheric jets are however limited, mainly showing a small deceleration of both the Northern Hemisphere and Southern Hemisphere jets (Fig. 1e). Conversely, the orographic resolution increase has a small impact on the tropical stratospheric temperature but drives a warming of the polar stratosphere, likely associated with larger orographic wave activity propagating upward (Fig. 1c). The jet streams are deflected, showing a poleward displacement in the Southern Hemisphere and an equatorial displacement in the Northern Hemisphere (Fig. 1f), which likely depends on the specific structure of the continental landmass in the two hemispheres. However, this reduces the temperature and wind biases in both hemispheres, as confirmed by the PCI and RRI values.
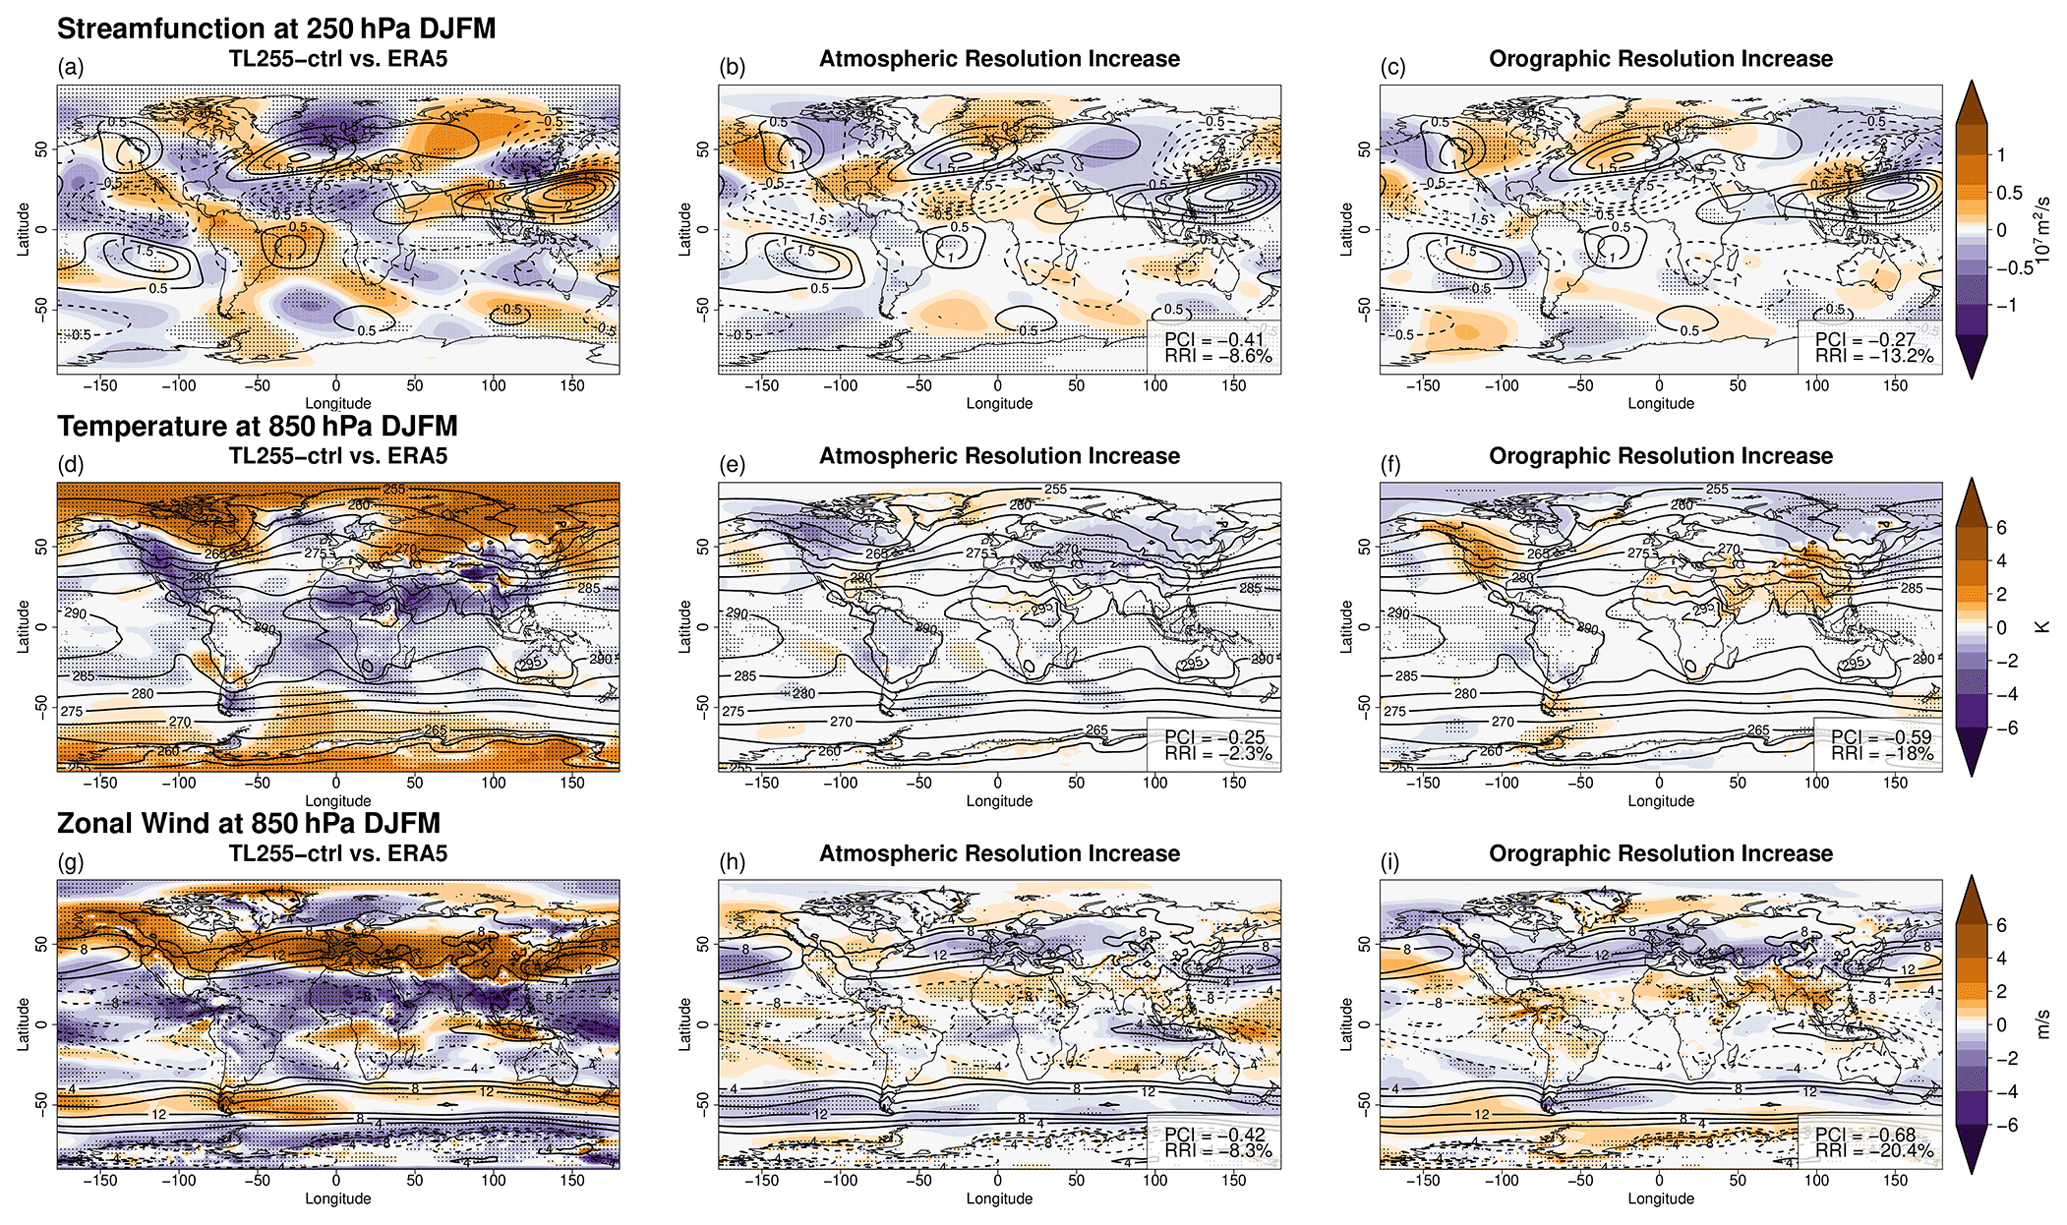
Figure 2DJFM mean asymmetric component of the 250 hPa streamfunction (a–c), 850 hPa air temperature (d–f) and 850 hPa zonal wind (g–i) for (a, d, g) EC-Earth3 TL255-ctrl bias with respect to ERA5, (b, e, h) changes induced by the atmospheric resolution increase and (c, f, i) changes induced by the orographic resolution increase. Shading shows differences and contours the TL255-ctrl field. Please note the irregular colour-bar spacing. Stippling indicates significance with a Welch t test at the 1 % level. In (b), (c), (e), (f), (h) and (i) the PCI and RRI (see text for details) are reported at the bottom right of each panel: large negative values imply reduced bias.
The discussed changes in temperature and wind have a complex longitudinal structure which is illustrated in Fig. 2, where the upper-level streamfunction and the lower-level temperature and zonal winds are shown. The streamfunction changes are generally larger in the Northern Hemisphere, for both the atmospheric and the orographic resolution increases; this is expected considering that the larger orographic barriers are found in the Northern Hemisphere. However, the way in which the orographic and atmospheric resolutions impact the flow is very different. While both signals project on a strengthening of the Atlantic Ridge, they have an opposite response over the Pacific and North America. This can be better appreciated by looking at the 850 hPa temperature and zonal wind changes.
Indeed, the impact of the increased resolution of the mean orography generally follows the expected theory associated with vorticity conservation where the orographic barrier induces a deflection of the flow (Valdes and Hoskins, 1991; Brayshaw et al., 2009; White et al., 2017). The higher and more detailed structure of the Rocky Mountains and Tibetan Plateau induces a stationary wave pattern (Fig. 2c), associated with a warming on the windward side of the mountain chains (Fig. 2f) and decreasing the jet speed especially over the Atlantic sector; interestingly, the Pacific jet stream is deflected equatorward (Fig. 2i). Overall, this goes in the direction of reducing the systematic model errors seen for the TL255-ctrl (Fig. 2a, d, g). The same general result holds for the Southern Hemisphere (summertime) circulation, where the increased height of the Andes produces a poleward shift of the jet stream (Fig. 2i), partially compensating for the bias in the TL255-ctrl experiment (Fig. 2g).
The impacts of the atmospheric resolution increase are more difficult to understand. It leads to a cooling of the continental landmass (Fig. 2e) and a moderate decrease in the jet streams in their exit regions (Fig. 2h), associated with a wavy response in the streamfunction which is characterized by a southwest–northeast-oriented pattern over the North Pacific (Fig. 2b). However, the temperature, wind and streamfunction responses do not always reduce the biases seen for the TL255-ctrl experiment (Fig. 2a, d, g). Indeed, improvements are obtained over large parts of the North Atlantic and Eurasia, but the wave-2 pattern over the North Pacific and North America is almost out of phase with the TL255-ctrl systematic error. More generally, the complicated patterns of these responses show how hard it is to understand the origin of the changes induced by the increase in the atmospheric resolution.
Given the wide impact on the mean climate, it is also interesting to analyse the consequences of the atmospheric and orographic resolution increases on the Northern Hemisphere winter mid-latitude climate variability. A key characteristic that is worth investigating is the North Atlantic jet stream variability, which can be assessed by examining the jet latitude index (JLI), shown in Fig. 3.
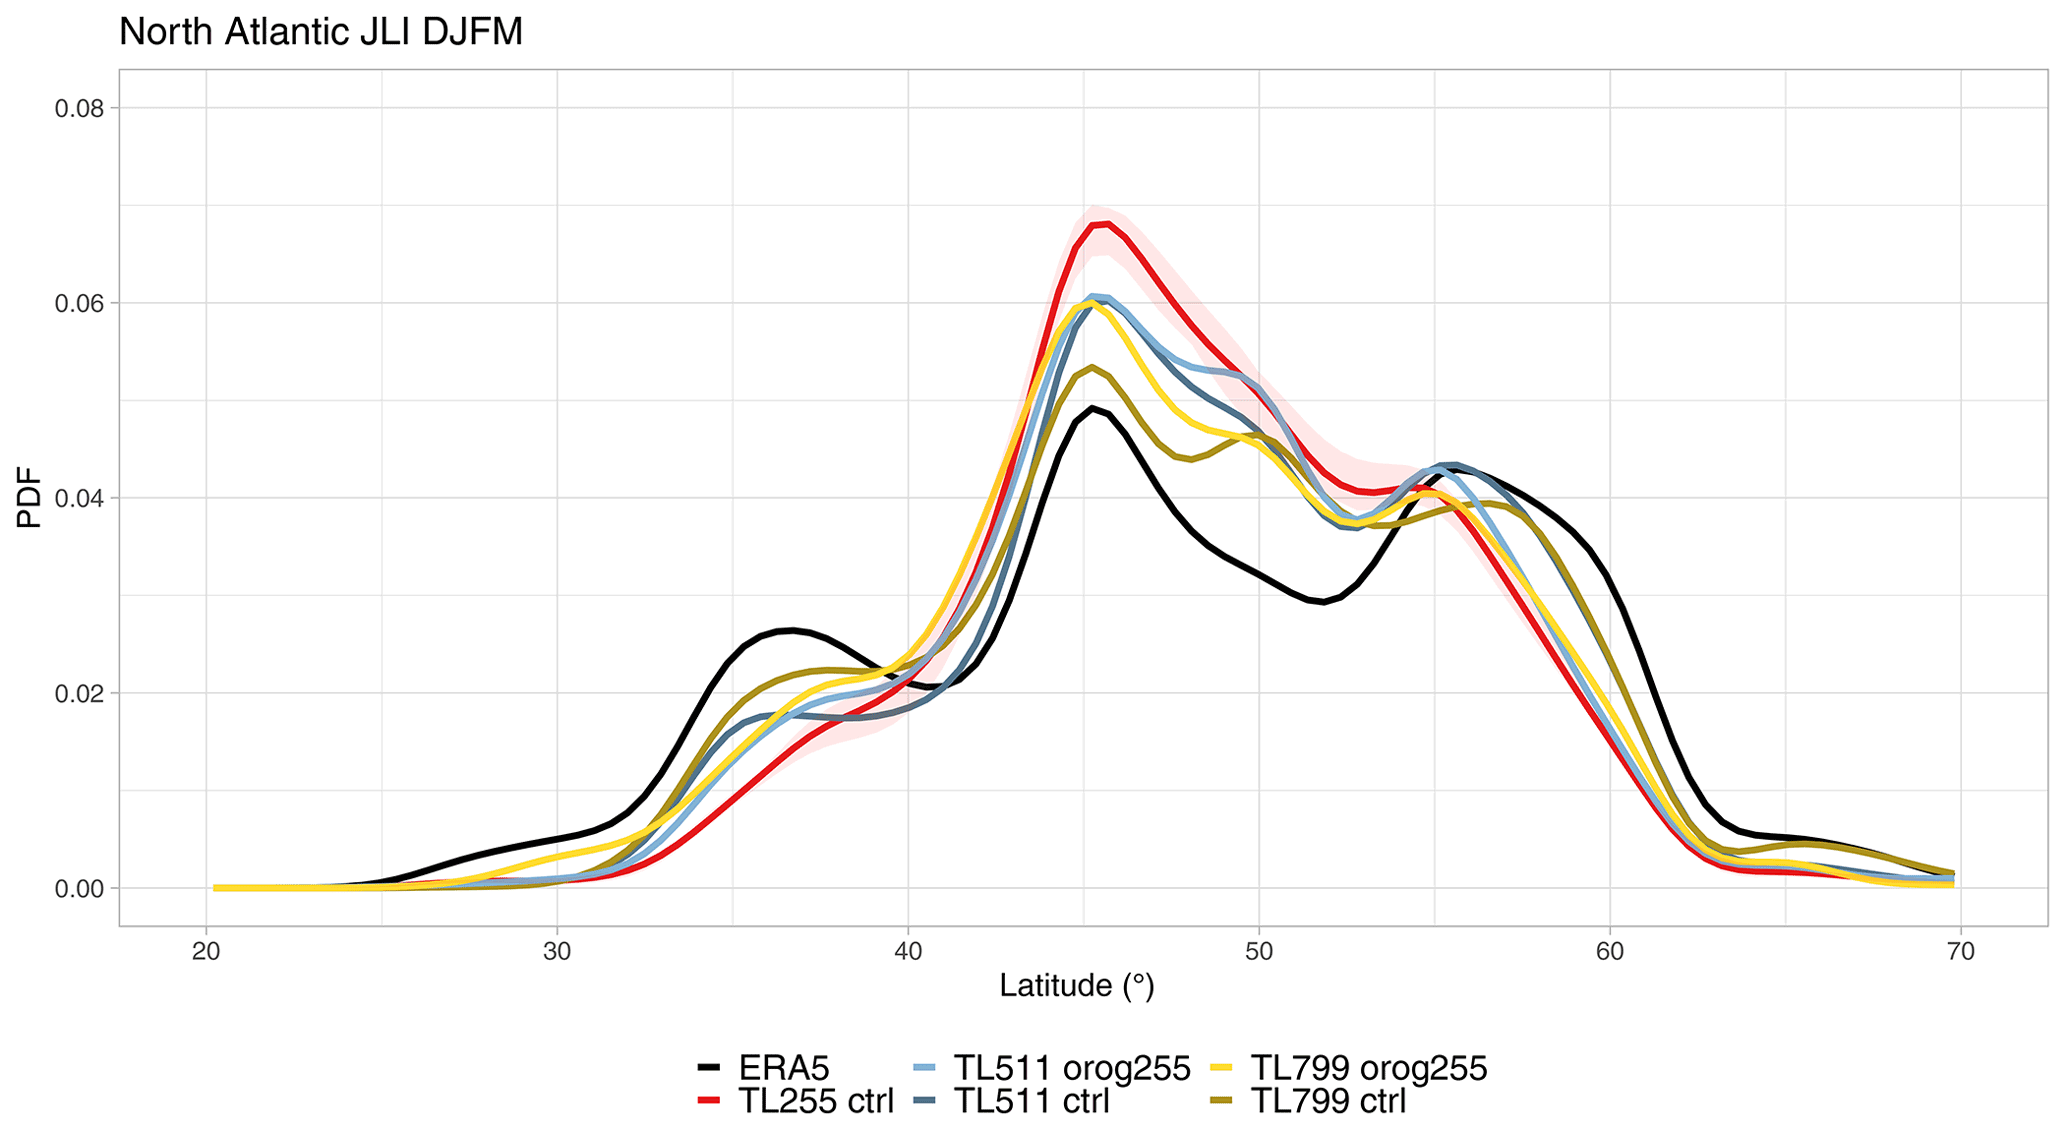
Figure 3DJFM jet latitude index distribution for the different EC-Earth3 experiments, for ERA5 (black), TL255 (red), TL511 (blue) and TL799 (yellow). Lighter colours indicate orog255 experiments. For the TL255-ctrl run, the ribbons show the spread among the three integrations, with the ensemble mean in bold. Distributions are obtained from daily data by a kernel density estimation based on Gaussian smoothing with a bandwidth parameter of 1.25∘.
This shows the usual trimodal peak which is characterized by a more frequent central peak around 45∘ N, an equatorward peak around 35∘ N and a poleward one around 55∘ N. While the central peak is associated with the zonal flow over the North Atlantic Basin, the equatorward and poleward peaks are associated with cyclonic (i.e. negative North Atlantic Oscillation) and anticyclonic Rossby wave breaking respectively (Woollings et al., 2010). A typical bias in climate models is to have a weak trimodality (e.g. Anstey et al., 2013; Kwon et al., 2018), usually associated with a too strong and poleward-displaced jet, which favours jet pulsing as the dominant mode of variability rather than jet wobbling (Barnes and Polvani, 2013). As with many other GCMs, the TL255-ctrl run also shows a preponderant central peak and underestimated frequencies for the equatorward and poleward peaks. As can be seen in Fig. 3, the atmospheric resolution increase provides a moderate reduction in the JLI bias: it reduces the frequency of the central peak, and it slightly increases that of the equatorward one. Increasing the orographic resolution provides a larger improvement: on top of similar changes (but with larger magnitude) for the equatorward and central peaks, it also increases the frequency of the poleward peak. As expected, the TL799-ctrl simulation is the most realistic, having a reduced overall bias (albeit a remaining overestimation of the JLI around the 45∘ N central peak and an apparent spurious fourth peak at 50∘ N are still seen). Overall, Fig. 3 further shows how, in terms of Atlantic jet variability, at least half of the improvements associated with the increased horizontal resolution are due to the change in orographic resolution.
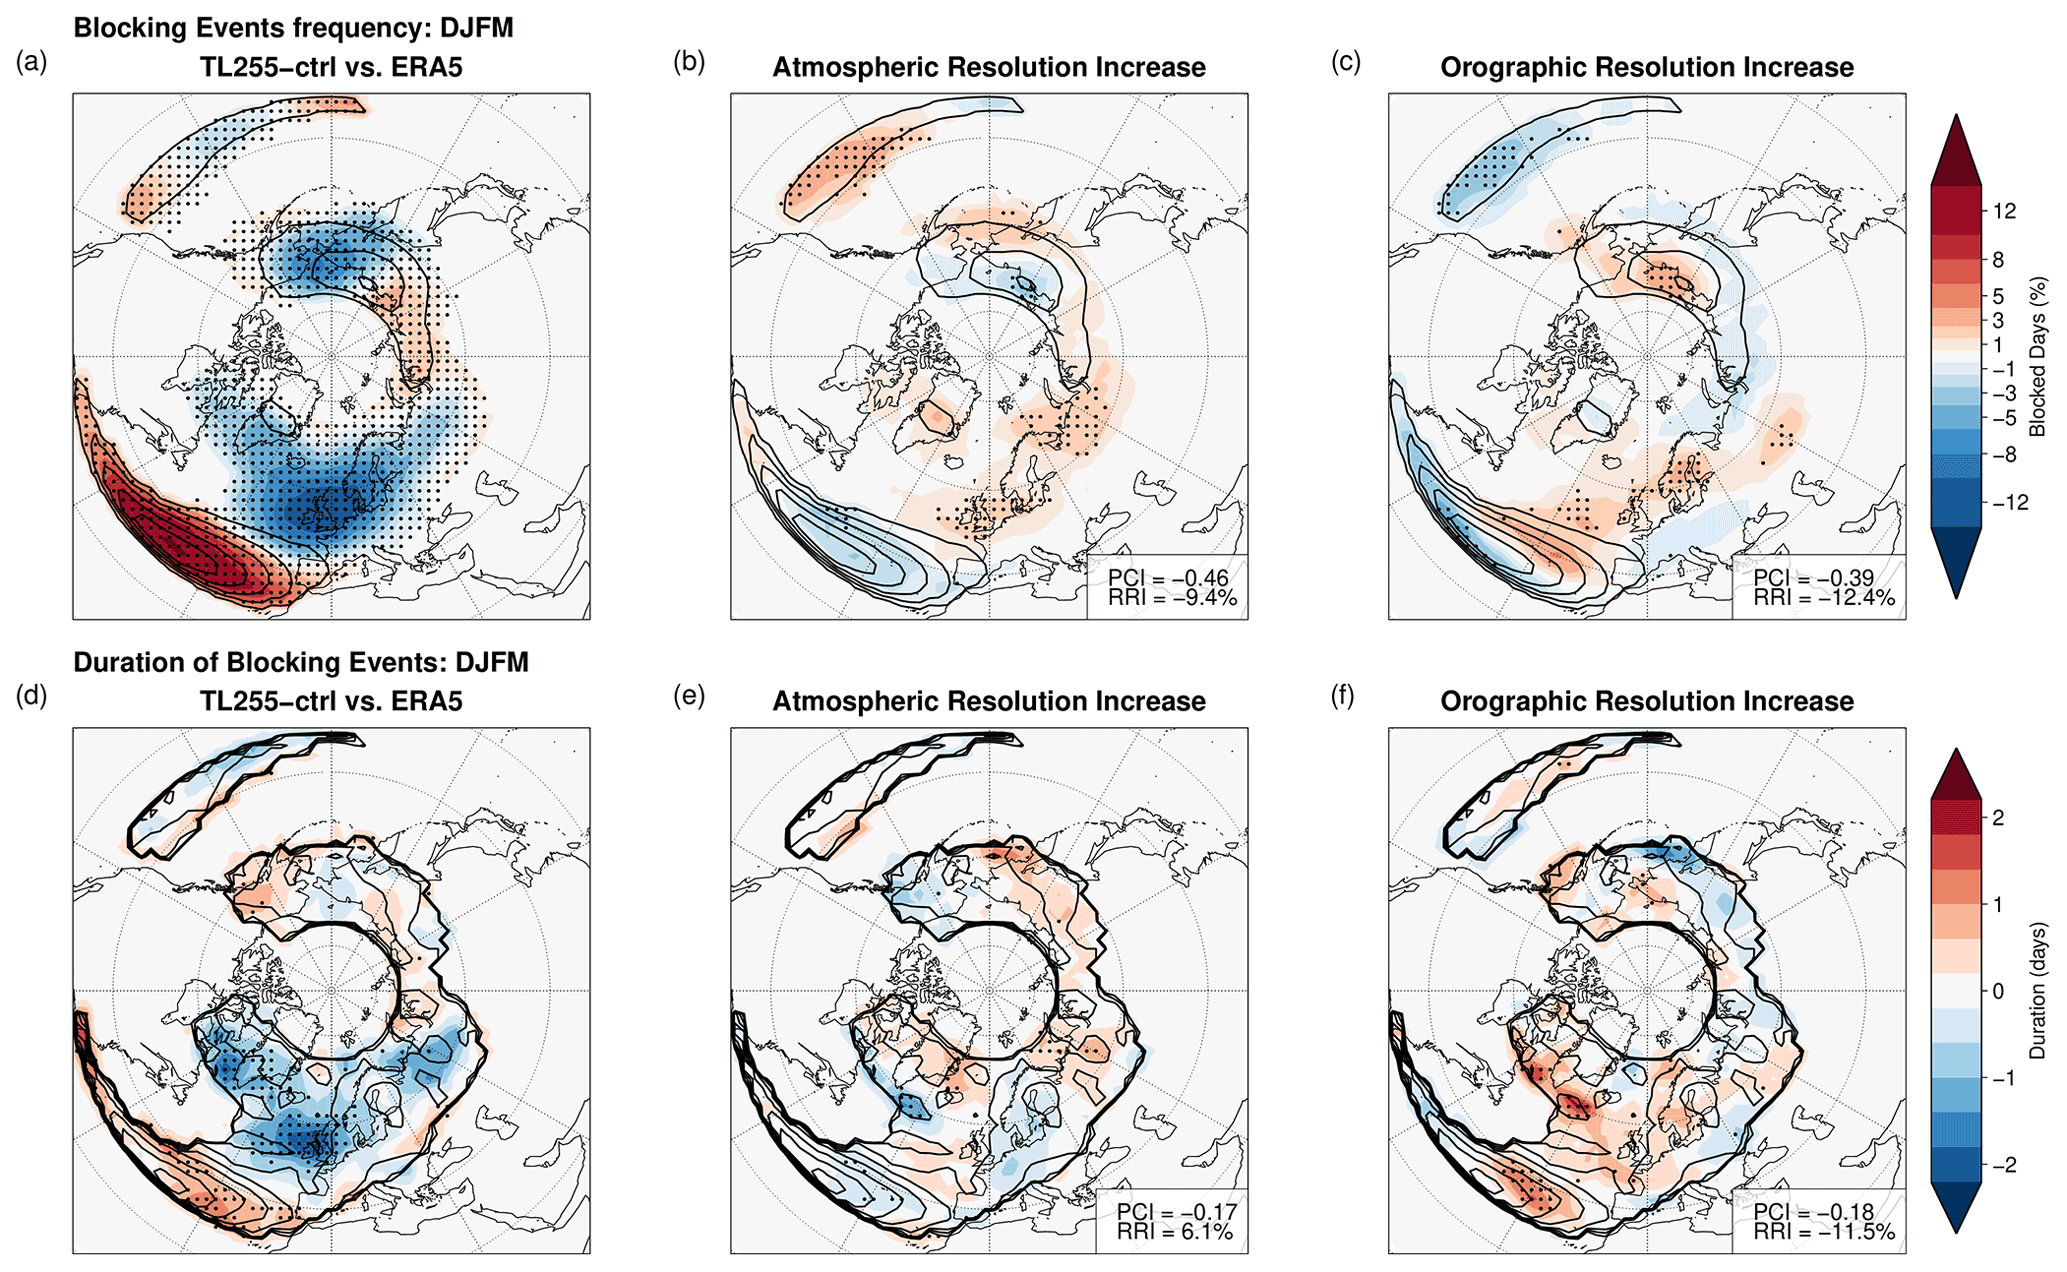
Figure 4DJFM blocking event (BE) frequency (a–c) and BE duration (d–f) for (a, d) EC-Earth3 TL255-ctrl bias with respect to ERA5, (b, e) changes induced by the atmospheric resolution increase and (c, f) changes induced by the orographic resolution increase. Shading shows differences and contours the TL255-ctrl field. For BE frequency, please note the irregular colour-bar spacing. For BE frequency, contours mark every 5 %. For blocking duration, contours mark every 0.5 d. Stippling indicates significance with a Welch t test at the 5 % level. In (b), (c), (e) and (f) the PCI and RRI (see text for details) are reported at the bottom left of each panel: large negative values imply reduced bias.
Another important element of the Northern Hemisphere mid-latitude circulation is atmospheric blocking. Euro-Atlantic blocking activity is partially associated with the Atlantic jet variability (Hannachi et al., 2012; Kwon et al., 2018) but especially over central Europe is substantially independent from it (Davini et al., 2014; Madonna et al., 2017). Most interestingly, state-of-the-art GCMs typically underestimate the frequency of blocking events over both the Euro-Atlantic and the North Pacific sectors (Davini and d'Andrea, 2020). Figure 4a – where the TL255-ctrl bias for the REV blocking index is shown – confirms this view, showing a massive underestimation of blocking frequencies over the central European sector and a marked overestimation at low latitudes over the Azores. This is a typical configuration associated with a too zonal flow over the North Atlantic sector, where the anticyclonic wave breaking activity is constrained at lower latitudes by an overly strong waveguide. As expected this bias is exacerbated by the absence of the orographic wave parameterizations, which considerably alleviate the systematic error (blocking climatology for the TL255-ctrl run is shown in Fig. S1 in the Supplement).
Both the atmospheric and the orographic resolution increases lead to larger blocking frequencies, especially at high latitudes. Over the North Pacific sector the impact of mean orography provides a clearer benefit than the atmospheric resolution increase, but over the Euro-Atlantic sector – also considering that the regions attaining a 95 % statistical significant level are limited – the reduction in the bias driven by mean orography resolution is similar to the one of the atmospheric resolution. This is confirmed by the PCI and RRI figures, which point to a reduction of about 10 % of the model RMSE in both cases.
An interesting feature to investigate is the blocking duration, which for a long time has been assumed to be related to the transient eddy forcing (e.g. Shutts, 1983). The increase in atmospheric resolution should help improve the representation of these aspects since the size of the eddies which are resolved at TL799 is about 4 times smaller than at TL255. However, as seen in Fig. 4e, the change in atmospheric resolution has a negligible impact on the blocking duration. Conversely, increasing the mean orography leads to a clearer impact on the duration of blocking events with a widespread increase over the Euro-Atlantic sector. It is thus reasonable to assume that the longer blocking duration is the result of the eddy–mean flow interactions operating over the North Atlantic, which are influenced by the Atlantic jet structure produced by the orographic resolution increase over the Rocky Mountains.
Given that blocking is quite sensitive to the index adopted, Fig. S2 shows the same analysis carried out in Fig. 4 making use of the ANO index. Despite a radically different climatology, the negative bias is still observed over the Euro-Atlantic sector. Interestingly, the orographic resolution increase produces a widespread but not significant increase in terms of blocking event frequency and duration, while marginal changes are observed when increasing the atmospheric resolution.
This analysis – even if it confirms the beneficial impact of increased orographic resolution with both the ANO and the REV indices, especially on blocking duration – puts forward further evidence for the sensitivity to the blocking index and to the requirement of long integration to assess robustly the impact of any model change on atmospheric blocking.

Figure 5DJFM mean transient eddies' standard deviation (a–c), low tropospheric baroclinic energy conversion (d–f) and upper-level barotropic energy conversion (g–i) for (a, d, g) EC-Earth3 TL255-ctrl bias with respect to ERA5, (b, e, f) changes induced by the atmospheric resolution increase and (c, f, i) changes induced by the orographic resolution increase. Shading shows differences and contours the TL255-ctrl field. Stippling indicates significance with a Welch t test at the 5 % level. In (b), (c), (e), (f), (h) and (i) the PCI and RRI (see text for details) are reported at the bottom left of each panel: large negative values imply reduced bias.
Given the above-discussed changes in blocking duration, it is interesting to analyse the transient eddy activity, which is shown in Fig. 5a, b and c. The TL255-ctrl experiment has a large positive bias (Fig. 5a), having storm tracks extended too far downstream over Europe and North America, almost continuously developing over Asia, and slightly displaced poleward. This effect – which is often seen in climate models – is exacerbated in our TL255-ctrl simulation by the absence of the orographic parameterizations, which plays a notable role in slowing down the westerly mid-latitude flow (Pithan et al., 2016; White et al., 2021). Increasing the mean orography (Fig. 5c) results in a bias reduction which, albeit of smaller amplitude, mirrors the patterns of the positive bias in transient eddy activity found for the TL255-ctrl experiment (Fig. 5a). The increase in the atmospheric resolution (Fig. 5b) has a moderate impact on the transient eddy activity over the Pacific and shows a complex signal over the Atlantic. A small decrease in the bias is seen on the eastern side of the basin, but it does not extend downstream over the Eurasian continent. The transient eddy activity increases over the North American continent, a region where the model bias is already positive in the TL255-ctrl experiment. These results suggest that the increase in blocking duration (seen in Fig. 4f) might be associated with a weakening of the transient eddy forcing due to the increase in orographic resolution.
The changes to the transient eddies can be partially explained by examining the baroclinic energy conversion, which is a measure of the energy extracted from the mean meridional temperature gradients and transferred to baroclinic eddies. Its pattern roughly matches the meridional heat fluxes and the Eady growth rate since it relies on the same terms (not shown). The TL255-ctrl experiment is characterized by an underestimation of the baroclinic conversion term in the two storm tracks (Fig. 5d), which is consistent with the underestimated meridional temperature gradient in the lower troposphere seen in Fig. 2. Overall – although with moderated statistical significance – the increase in atmospheric resolution does not affect Pacific baroclinicity, but it increases it over the North American continent, in line with the storm track strengthening over that region (Fig. 5e). The orographic resolution increase improves the baroclinic conversion term over the Pacific storm track and partially also over the Atlantic (Fig. 5f).
The barotropic energy conversion term shows different TL255-ctrl bias in the two oceanic basins: over the Atlantic it is characterized by a dipole, with a “barotropization” of the mean flow by the eddies occurring too far equatorward and too far eastward (Fig. 5g). As mentioned in Sect. 2, this term describes where the jet stream is feeding the eddies (when it is positive) or where the mean flow is extracting energy from the eddies (when it is negative). The TL255-ctrl bias suggests that transient eddies favour a southward displacement of the final part of the Atlantic jet, leading to an incorrect tilt of the North Atlantic jet stream, which tends to be too strong and too zonal (as seen in Fig. 2h, which in turn affects the blocking frequency as seen in Fig. 4). While the increase in atmospheric resolution does not change the behaviour of the eddies in the Atlantic (it actually worsens the simulation of the eddy extraction of energy over the North American continent), the orographic resolution increase partially reduces the model bias, reducing the barotropic conversion at lower latitudes and increasing it at higher ones, which displaces the Atlantic jet poleward and increases its southwest–northeast tilt (Fig. 5h, i). Nonetheless, it should be remarked that few regions attain a 95 % statistical significance.
A summary of the influence of resolution on eddy dynamics can be extracted looking at the PCI and RRI diagnostics of Fig. 5, which are considerably larger when increasing the orographic resolution (showing a reduction in the RMSE of about 20 %) than when increasing the atmospheric resolution.
Globally, it can be stated that large-scale changes introduced by the increase in resolved orography modify the way eddies and the mean flow interact. Although the stationary wave pattern over the Atlantic is similarly modified when both the atmospheric and the orographic resolution are increased (Fig. 2b, c), the high-frequency variability reacts in a significantly different way. This further highlights how finer atmospheric resolution alone (without an increase in the orographic resolution) is not able to improve the representation of eddy dynamics.
Overall, the analysis presented in the previous sections showed that while the increase in orographic resolution improves the representation of the Northern Hemisphere winter mean climate and variability, the effect of the increase in atmospheric resolution is more complex and provides contrasting results. This is summarized in Fig. 6, where the radar chart shows the root mean square error (RMSE) for a set of variables both for the entire globe during the Northern Hemisphere winter season (Fig. 6a) and for the mid-latitudes (Fig. 6b). Here the RMSE has been normalized by the RMSE of the TL255-ctrl experiment so that this experiment has an RMSE of 1 for each variable. The larger the distance from the centre of the chart, the larger the RMSE: a perfect match with the ERA5 reanalysis (i.e. RMSE = 0) would fall in the centre of the chart. An estimate of the internal variability is provided by the three ensemble members for TL255-ctrl. In addition to the previously discussed experiments, Fig. 6 also shows the TL255-ctrl-param experiment, which outperforms all the other configurations, especially in the Northern Hemisphere mid-latitudes, as expected given the importance of orographic parameterizations in current GCMs.
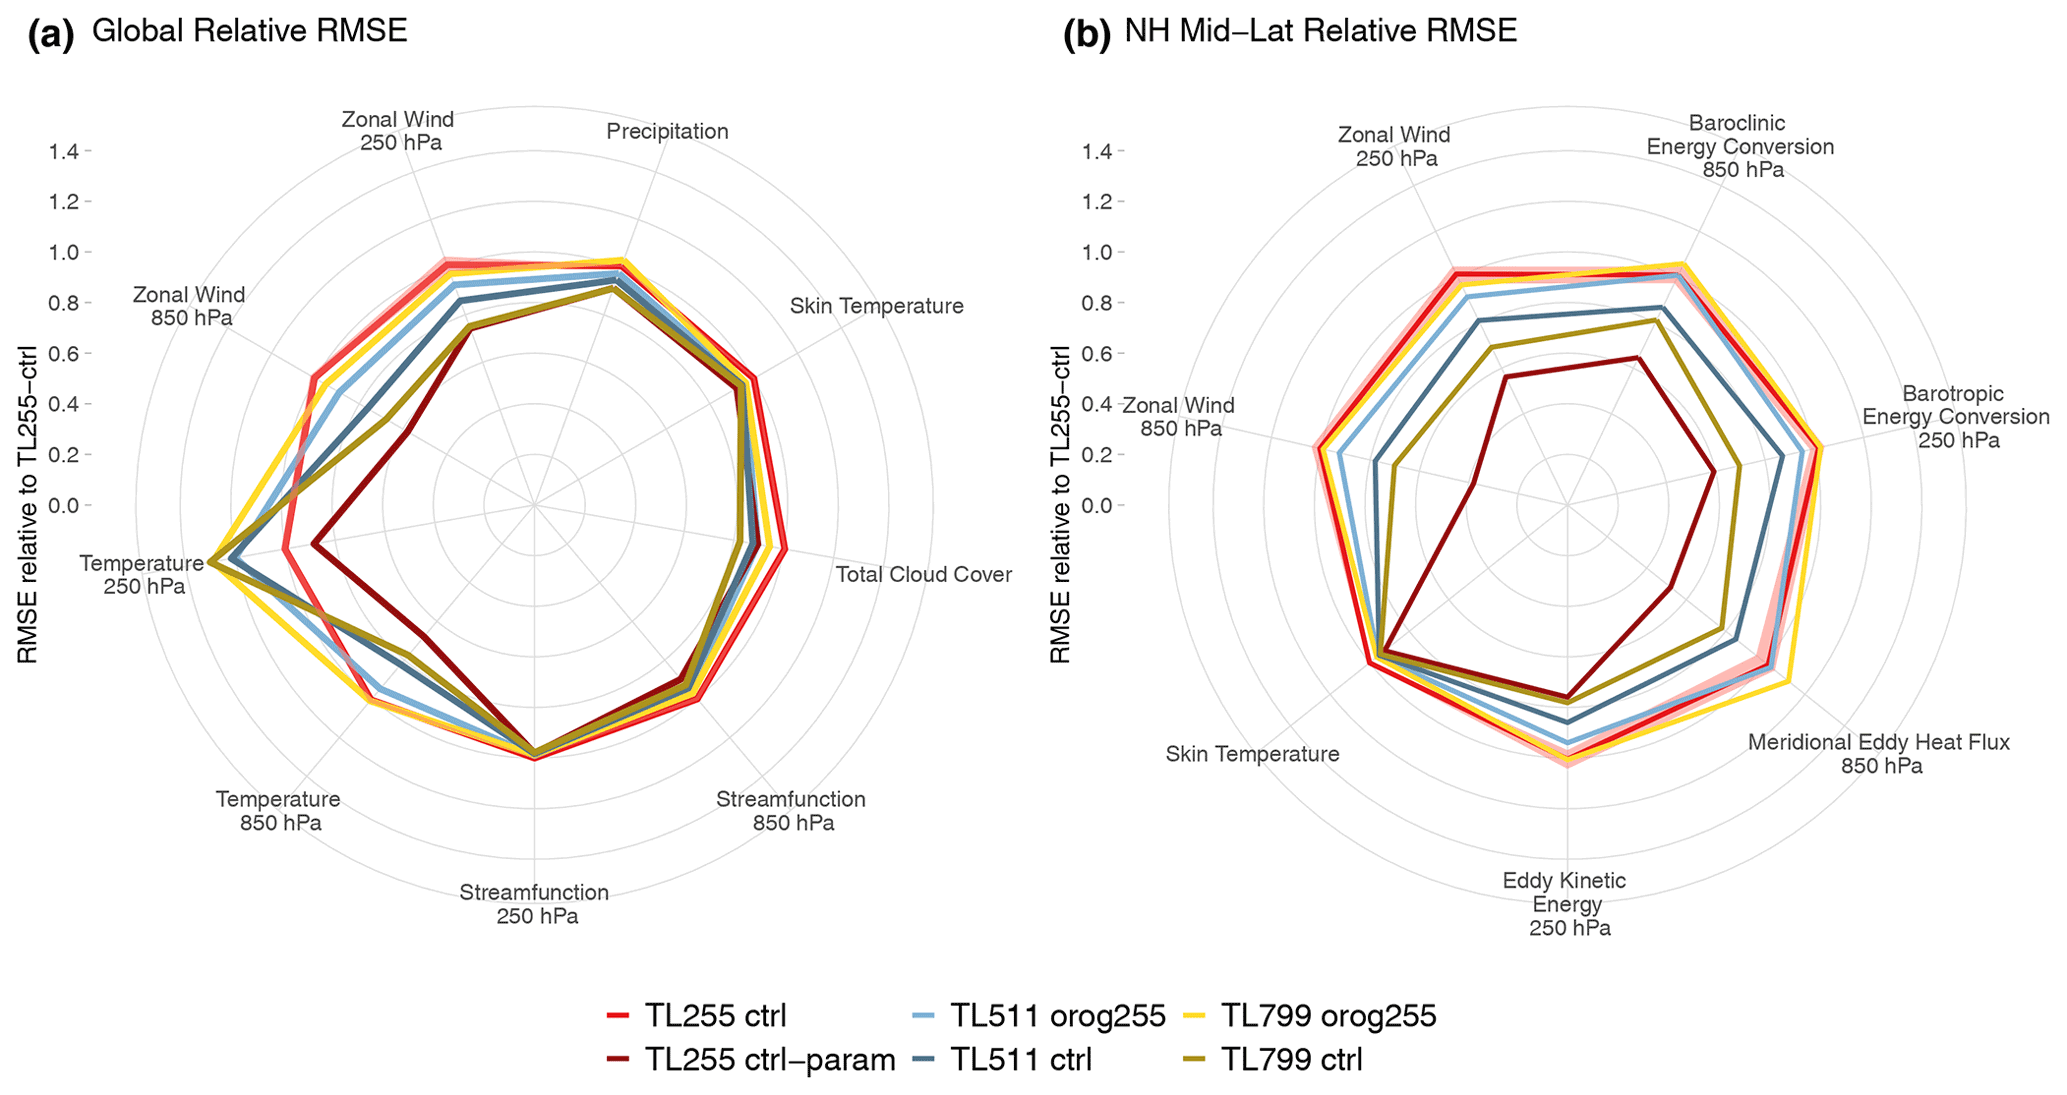
Figure 6Radar chart showing the DJFM RMSE against ERA5 relative to the EC-Earth3 TL255-ctrl experiment for (a) a set of globally averaged fields and (b) a set of Northern Hemisphere mid-latitude (30–75∘ N) fields. Since the TL255-ctrl experiment is the reference (red), its values are always 1. TL511 is shown in blue and TL799 in yellow, with lighter colours indicating orog255 experiments. For the TL255-ctrl run the three integrations available are shown, with the ensemble mean in bold. Values closer to the centre of the plot imply smaller RMSE. Please note that (a) and (b) include different variables.
Figure 6 illustrates that the best results – among the experiments without orographic parameterizations – are obtained for the TL799-ctrl experiment, which improves significantly for almost every variable analysed, with a reduction in the RMSE of about 30 % (when compared to TL255-ctrl). Only the upper tropospheric air temperature shows a net worsening, associated with the cold stratospheric bias seen in Fig. 1b. TL511-ctrl lags behind TL799-ctrl but still shows evident improvement in both the global and in the Northern Hemisphere mid-latitude RMSE. Conversely, the changes in both TL799-orog255 and TL511-orog255 with respect to TL255-ctrl are much smaller in almost all the metrics considered. This suggests that most of the improvements seen in these circulation aspects, which also include specific dynamical and high-frequency measures such as barotropic energy conversion, eddy kinetic energy or meridional heat fluxes, are driven by the increase in the orographic resolution rather than by a refinement of the atmospheric resolution.
One interesting result, highlighted by Fig. 6, is that for several fields TL799-orog255 has a larger RMSE than TL511-orog255, and sometimes both are worse than TL255-ctrl. This is further reinforced by the analysis of the specific changes associated with atmospheric resolution increase in a few selected fields (Fig. S3): both PCI and RRI are always larger (implying larger improvement) for TL511-orog255 than for TL799-orog255, meaning that a finer atmospheric grid deteriorates the climate simulation. Conversely, the impact of mean resolved orography is larger for TL799 than for TL511 (Fig. S4), suggesting that finer orographic resolution improves the integrations. Overall, this is partially counterintuitive since there is no dynamical argument for which an atmosphere simulated on a finer horizontal grid, which has smaller truncation errors and finer-scale resolved eddies, should lead to a deterioration of fundamental aspects of the atmospheric circulation.
These findings can be explained taking into consideration that – as commonly done in resolution comparisons (e.g. Haarsma et al., 2016) – tuning has been performed only for the TL255 configuration. Conversely, TL511 and TL799 have not been re-tuned. Indeed, one major target of model tuning is the model top-of-atmosphere (TOA) radiative balance; this is usually achieved modifying parameters associated with convection or cloud microphysics (Mauritsen et al., 2012; Hourdin et al., 2017; Döscher et al., 2022), so tuning operations have an important impact on the hydrological cycle, on cloud dynamics and – consequently – on the radiative budget. It is thus possible that the lack of a proper model tuning at high resolution has a two-fold impact on the atmospheric circulation: (1) it could lead to changes in clouds distribution which might affect the meridional temperature distribution (and consequently also mean wind profiles), and (2) it could affect convection and precipitation, leading to changes in tropical Rossby wave source and propagation which can dynamically force the mid-latitude climate. Both changes will be reflected by a different radiative budget, especially in tropical regions.

Figure 7Global yearly averaged mean (a) net TOA radiation, (b) outgoing long-wave radiation at the TOA, (c) outgoing short-wave radiation at the TOA, (d) atmosphere imbalance, (e) total cloud cover and (f) total precipitation in the EC-Earth3 runs. TL511 is shown in blue and TL799 in yellow, with lighter colours indicating orog255 experiments.
Figure 7 shows the global yearly averaged TOA radiation (the net fluxes and the outgoing long-wave and short-wave radiation), the atmospheric imbalance (i.e. generated by systematic biases in the energy and mass conservation of the model, which leads to heat sources and sinks within the atmosphere, e.g. Berrisford et al., 2011), and total cloud cover and precipitation in the different EC-Earth3 experiments. Simulations with different atmospheric resolution present notable differences in all the variables considered, as commonly seen when horizontal resolution is increased (Davini et al., 2017b; Vannière et al., 2019). Larger changes with respect to the TL255-ctrl experiment are seen for the TL799 than for the TL511 experiments, suggesting that the more the horizontal resolution is increased, the more the radiative balance is modified. Changes in these metrics with respect to TL255-ctrl are seen also in the orog255 integrations. These are however similar or slightly smaller to those seen for the ctrl integrations, suggesting that they are mostly driven by the increase in atmospheric rather than in orographic resolution. Finally, as it may be expected, the activation of the orographic parameterizations has a negligible impact on these global averages (compare TL255-ctrl and TL255-ctrl-param).
Increasing the resolution from TL255 to TL511 leads to an increase of almost 1 W m−2 in the net TOA radiation (Fig. 7a). However, since the atmospheric imbalance (Fig. 7d) increases by a larger value (about 1.2 W m−2), this implies that the net surface fluxes are slightly reduced, and a minor decrease in surface temperature is observed (not shown). The change in net radiation at the TOA is mainly associated with a reduction in the short-wave radiation reflected back to space, which suggests an overall decrease in Earth's albedo (Fig. 7c). The decrease in short-wave outgoing radiation is only partially compensated for by the increase in the outgoing long-wave radiation (OLR, Fig. 7b). Considering that (1) OLR is mainly driven by characteristics of tropical convection and (2) OLR is not influenced at all by the orographic resolution (ctrl and orog255 experiments at TL511 and TL799 show the same OLR for a given resolution), the changes in OLR are likely due to the dependence of the convection (and precipitation rate) on the atmospheric resolution. Indeed, these are two aspects strictly connected with the model tuning since parameters such as the entrainment rate for organized convection or the precipitation conversion rate are typically adjusted in this process (e.g. Döscher et al., 2022).
The total cloud cover decreases by 1 % at TL511 and by 2 % at TL799 compared to TL255-ctrl, suggesting that the reduced radiation reflected back to space is due to the decreased cloud amount (Fig. 7e). Similarly, significant changes are observed for precipitation, showing increased rainfall at both TL511 and TL799 compared to TL255-ctrl (Fig. 7f). For both cloud cover and precipitation, changes in the tropical region are larger (not shown). More generally, the changes seem to be quite linear, always being larger for the TL799 than the TL511 experiment.
A more detailed spatial analysis shows considerable changes in the tropical areas (Figs. S3 and S4), characterized by a moderate decrease in cloudiness. However, the changes are very complex, being likely associated with a redistribution of convection along the Equator. Less precipitation and convection are seen in the higher-resolution experiments over the Maritime Continent, while increased precipitation and convection are seen over the Western Pacific, the Indian Ocean and the Amazon. A reduction in cloud cover is also seen over the Peruvian coast, suggesting less stratocumulus there.
It is possible to conclude that changes in tropical convection, clouds and precipitation, which can be diagnosed through the deterioration of the radiative budget (which shows larger radiative imbalance as long as the model grid is moved away from the tuned configuration), counteract any potential improvements provided by the refinement of the atmospheric grid. However, when the model horizontal resolution is increased, these mixed effects are counterbalanced by the orographic resolution changes, which are more effective at higher resolution and thus provide a net improvement in the simulation.
In this study, the role of the resolution of the mean orography in shaping the Northern Hemisphere winter mid-latitude flow has been investigated with a set of idealized sensitivity experiments carried out with the atmospheric component of the EC-Earth3 climate model. This has shown that (in the absence of orographic drag parameterizations) most of the benefits in the Northern Hemisphere winter mid-latitudes induced by the increase in the horizontal resolution are actually caused by the changes in the mean resolved orographic resolution. Such improvements are evident in almost all the variables analysed, from the large-scale mean state up to high-frequency variability. This corroborates the results for medium-range forecast timescales (Kanehama et al., 2019).
Indeed, the orographic resolution impact is quite clear and supports previous theoretical studies with simplified setups and models (e.g. Brayshaw et al., 2009). The large orographic barriers in the Northern Hemisphere interact with the flow, deviating and decelerating it, giving rise to weaker (and – over the Atlantic – more tilted) eddy-driven jet streams. Increasing the atmospheric resolution alone has mixed impacts so that it does not necessarily reduce systematic model biases, especially over the Pacific Basin.
The setup of the presented experiments followed the typical approach of the initiatives aiming at assessing the impact of horizontal resolution increases in GCMs, such as the PRIMAVERA H2020 project or the HighResMIP project: EC-Earth3 was tuned only once at the standard resolution (TL255), and no re-tuning was performed for different resolutions (TL511, TL799). However, increasing the atmospheric resolution caused large changes in the radiative budget at the TOA, suggesting that the lack of a proper re-tuning of the finer-resolution configurations can be considered the mechanism responsible for the minor improvements observed when the atmospheric resolution is increased. Indeed, the sensitivity of physical parameterizations (such as convection and microphysics schemes) to grid spacing and time stepping might have serious consequences on the final simulated precipitation and cloud structure. These changes – which can be seen by altered radiative fluxes – might substantially impact meridional temperature gradients and Rossby waves source and propagation (which ultimately shape the structure of the mid-latitude jet streams), partially offsetting the benefits that high atmospheric resolution provides, such as a better representation of synoptic fronts and tropical cyclones. Indeed, current experiments showed that when going from TL255 to TL511, both atmospheric grid refinement and mean resolved orography have a positive impact but that at TL799 – while orography provides further benefits – the lack of tuning offsets the potential improvements due to the atmospheric resolution increase.
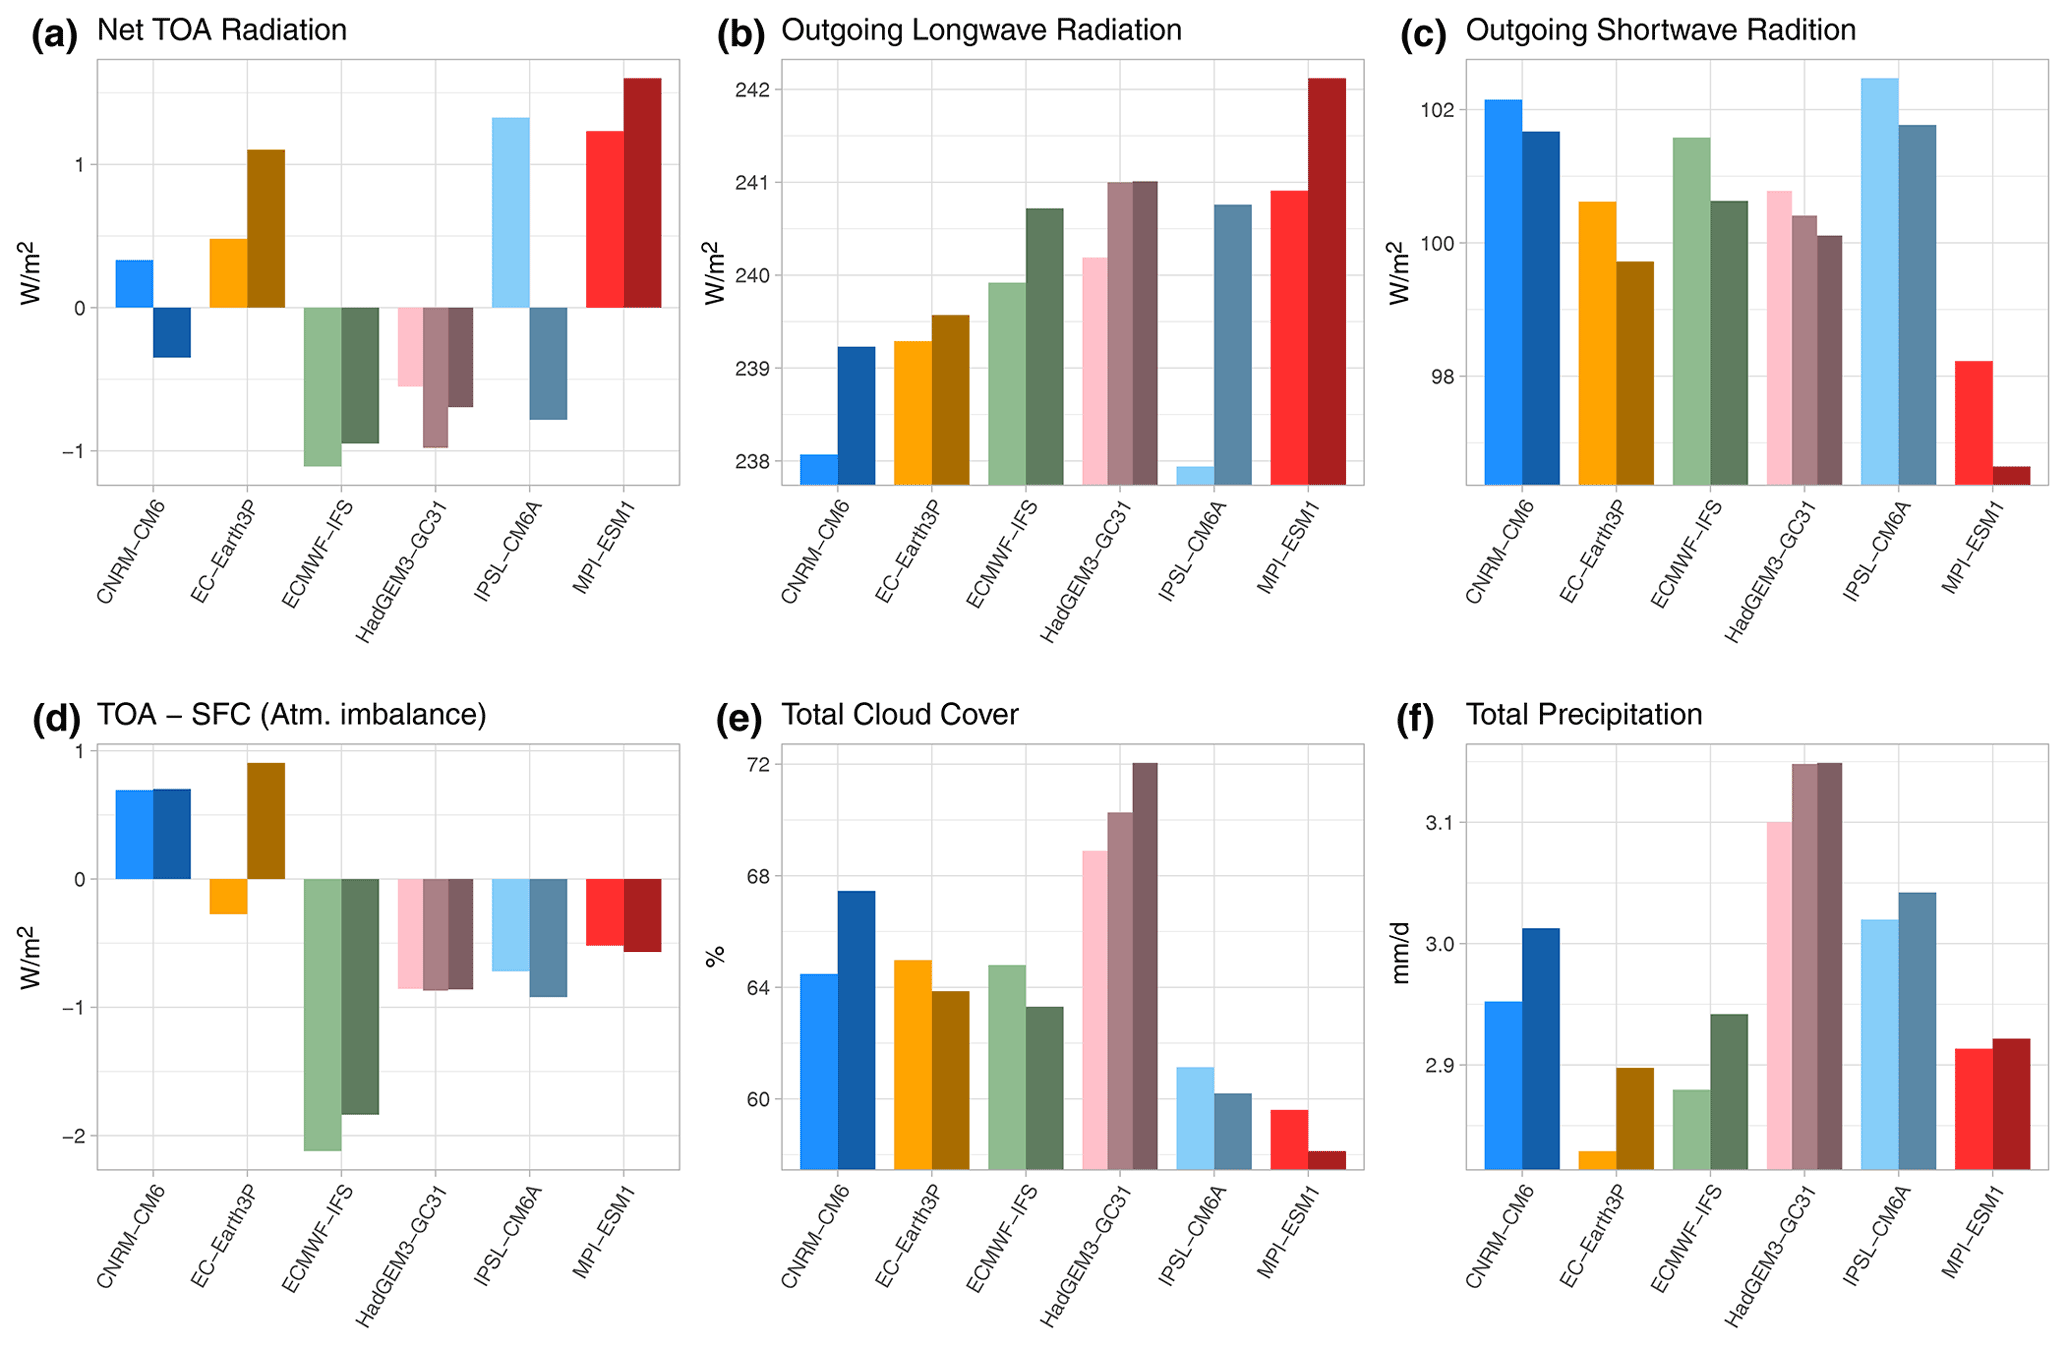
Figure 8Global yearly averaged mean (a) net TOA radiation, (b) outgoing long-wave radiation, (c) outgoing short-wave radiation, (d) atmosphere imbalance, (e) total cloud cover and (f) total precipitation in HighResMIP atmosphere-only simulations. Darker colours indicate higher horizontal resolutions.
Although in the present work the relevance of mean orography resolution has been demonstrated only for EC-Earth3, given their fundamental dynamical character, these findings are likely valid for other GCMs. Most importantly, it is not only the orography-related conclusion that might be extended to other climate models. The analysis of the radiative budget of a selection of models from the HighResMIP project shows that similar significant changes in the radiative fluxes, as well as in cloud cover and precipitation, are seen when the horizontal resolution is increased (Vannière et al., 2019). A simple summary is shown in Fig. 8, where the same variables plotted in Fig. 7 are presented for a set of the HighResMIP models. While EC-Earth3P – the older EC-Earth3 version which took part in HighResMIP – shows the largest sensitivity in the atmospheric imbalance, all the GCMs show significant changes in the net TOA fluxes (between 0.5 and 2 W m−2) and changes in total cloud cover and precipitation of up to several percent (Moreno-Chamarro et al., 2022).
It is therefore likely that a significant part of the benefits of the atmospheric resolution increase in HighResMIP might have been lost due to changes in tropical convection, clouds and precipitation which can influence the mid-latitude circulation. We therefore strongly encourage that further initiatives such as HighResMIP should be based on a tuned version of the high-resolution configuration, making sure that convection and cloud microphysics parameterizations are correctly constrained to produce reliable globally averaged radiative fluxes. This is clearly a costly exercise in terms of computational resources, but a basic tuning of the atmospheric-only configuration at the top-of-the-atmosphere radiative fluxes could easily produce a smaller imbalance in the radiative fluxes and a more correct representation of the thermal structure of the troposphere. This will eventually add to the robust positive effects of the orographic resolution increases.
Although the role of the sub-grid orographic parameterizations, namely the TOFD and SSO schemes, was not the focus of this study, these schemes are known to result in huge improvements in the winter mid-latitude flow: indeed, a TL255 experiment with orographic parameterizations outperforms a TL799 run in many aspects (Fig. 6) without altering the radiative budget (Fig. 7). It is therefore crucial to pursue the development of such orographic schemes since they could provide relevant benefits to the representation of the climate mean state and variability at a negligible computational cost. In this direction, the authors plan to investigate in future work with further targeted experiments the impact of TOFD and SSO schemes, as well as of changes therein, in climate simulations.
EC-Earth3 integrations are part of the REFORGE ECMWF special project and are accessible upon request to the authors.
The supplement related to this article is available online at: https://doi.org/10.5194/wcd-3-535-2022-supplement.
PD and IS designed the experiments. PD performed the integrations, conducted most of the data analyses and wrote the paper. FF performed the analysis on the HighResMIP data. All the authors contributed to the discussion and commented on and organized the paper.
The contact author has declared that neither they nor their co-authors have any competing interests.
Publisher's note: Copernicus Publications remains neutral with regard to jurisdictional claims in published maps and institutional affiliations.
Paolo Davini thanks ECMWF for providing computing time in the framework of the special project SPITDAV2. Federico Fabiano has been supported by the European Commission (grant no. PRIMAVERA 641727).
This research has been supported by the European Commission (grant no. PRIMAVERA 641727).
This paper was edited by Michael Riemer and reviewed by Rachel White and one anonymous referee.
Anstey, J. A., Davini, P., Gray, L. J., Woollings, T. J., Butchart, N., Cagnazzo, C., Christiansen, B., Hardiman, S. C., Osprey, S. M., and Yang, S.: Multi-model analysis of Northern Hemisphere winter blocking: Model biases and the role of resolution, J. Geophys. Res.-Atmos., 118, 3956–3971, 2013. a
Bador, M., Boé, J., Terray, L., Alexander, L. V., Baker, A., Bellucci, A., Haarsma, R., Koenigk, T., Moine, M.-P., Lohmann, K., Putrasahan, D. A., Roberts, C., Roberts, M., Scoccimarro, E., Schiemann, R., Seddon, J., Senan, R., Valcke, S., and Vanniere, B.: Impact of higher spatial atmospheric resolution on precipitation extremes over land in global climate models, J. Geophys. Res.-Atmos., 125, e2019JD032184, https://doi.org/10.1029/2019JD032184, 2020. a
Barnes, E. A. and Polvani, L.: Response of the midlatitude jets, and of their variability, to increased greenhouse gases in the CMIP5 models, J. Climate, 26, 7117–7135, 2013. a
Beljaars, A. C., Brown, A. R., and Wood, N.: A new parametrization of turbulent orographic form drag, Q. J. Roy. Meteor. Soc., 130, 1327–1347, 2004. a, b
Bellucci, A., Athanasiadis, P. J., Scoccimarro, E., Ruggieri, P., Gualdi, S., Fedele, G., Haarsma, R. J., Garcia-Serrano, J., Castrillo, M., Putrahasan, D., Sanchez-Gomez, E., Moine, M.-P., Roberts, C. D., Roberts, M. J., Seddon, J., and Vidale, P. L.: Air-Sea interaction over the Gulf Stream in an ensemble of HighResMIP present climate simulations, Clim. Dynam., 56, 2093–2111, 2021. a
Berckmans, J., Woollings, T., Demory, M.-E., Vidale, P.-L., and Roberts, M.: Atmospheric blocking in a high resolution climate model: influences of mean state, orography and eddy forcing, Atmos. Sci. Lett., 14, 34–40, 2013. a
Berrisford, P., Kållberg, P., Kobayashi, S., Dee, D., Uppala, S., Simmons, A., Poli, P., and Sato, H.: Atmospheric conservation properties in ERA-Interim, Q. J. Roy. Meteor. Soc., 137, 1381–1399, 2011. a
Black, R. X. and Dole, R. M.: Storm tracks and barotropic deformation in climate models, J. Climate, 13, 2712–2728, 2000. a, b
Boucher, O., Servonnat, J., Albright, A. L., Aumont, O., Balkanski, Y., Bastrikov, V., Bekki, S., Bonnet, R., Bony, S., Bopp, L., Braconnot, P., Brockmann, P., Cadule, P., Caubel, A., Cheruy, F., Codron, F., Cozic, A., Cugnet, D., D'Andrea, F., Davini, P., de Lavergne, C., Denvil, S., Deshayes, J., Devilliers, M., Ducharne, A., Dufresne, J.-L., Dupont, E., Éthé, C., Fairhead, L., Falletti, L., Flavoni, S., Foujols, M.-A., Gardoll, S., Gastineau, G., Ghattas, J., Grandpeix, J.-Y., Guenet, B., Guez, L. E., Guilyardi, E., Guimberteau, M., Hauglustaine, D., Hourdin, F., Idelkadi, A., Joussaume, S., Kageyama, M., Khodri, M., Krinner, G., Lebas, N., Levavasseur, G., Lévy, C., Li, L., Lott, F., Lurton, T., Luyssaert, S., Madec, G., Madeleine, J.-B., Maignan, F., Marchand, M., Marti, O., Mellul, L., Meurdesoif, Y., Mignot, J., Musat, I., Ottlé, C., Peylin, P., Planton, Y., Polcher, J., Rio, C., Rochetin, N., Rousset, C., Sepulchre, P., Sima, A., Swingedouw, D., Thiéblemont, R., Traore, A. K., Vancoppenolle, M., Vial, J., Vialard, J., Viovy, N., and Vuichard, N.: Presentation and evaluation of the IPSL-CM6A-LR climate model, J. Adv. Model. Earth Syst., 12, e2019MS002010, https://doi.org/10.1029/2019MS002010, 2020. a
Brayshaw, D., Hoskins, B., and Blackburn, M.: The basic ingredients of the North Atlantic storm track. Part I: land-sea contrast and orography, J. Atmos. Sci., 66, 2539–2558, 2009. a, b, c
Cai, M. and Mak, M.: Symbiotic relation between planetary and synoptic-scale waves, J. Atmos. Sci., 47, 2953–2968, 1990. a, b, c
Davini, P. and d'Andrea, F.: From CMIP3 to CMIP6: Northern Hemisphere atmospheric blocking simulation in present and future climate, J. Climate, 33, 10021–10038, 2020. a, b, c
Davini, P., Cagnazzo, C., Gualdi, S., and Navarra, A.: Bidimensional diagnostics, variability and trends of Northern Hemisphere blocking, J. Climate, 25, 6996–6509, 2012. a, b, c, d
Davini, P., Cagnazzo, C., Fogli, P. G., Manzini, E., Gualdi, S., and Navarra, A.: European blocking and Atlantic jet stream variability in the NCEP/NCAR reanalysis and the CMCC-CMS climate model, Clim. Dynam., 43, 71–85, 2014. a
Davini, P., Corti, S., D'Andrea, F., Rivière, G., and von Hardenberg, J.: Improved winter European atmospheric blocking frequencies in high-resolution global climate simulations, J. Adv. Model. Earth Syst., 9, 2615–2634, 2017a. a
Davini, P., von Hardenberg, J., Corti, S., Christensen, H. M., Juricke, S., Subramanian, A., Watson, P. A. G., Weisheimer, A., and Palmer, T. N.: Climate SPHINX: evaluating the impact of resolution and stochastic physics parameterisations in the EC-Earth global climate model, Geosci. Model Dev., 10, 1383–1402, https://doi.org/10.5194/gmd-10-1383-2017, 2017b. a, b
Döscher, R., Acosta, M., Alessandri, A., Anthoni, P., Arsouze, T., Bergman, T., Bernardello, R., Boussetta, S., Caron, L.-P., Carver, G., Castrillo, M., Catalano, F., Cvijanovic, I., Davini, P., Dekker, E., Doblas-Reyes, F. J., Docquier, D., Echevarria, P., Fladrich, U., Fuentes-Franco, R., Gröger, M., v. Hardenberg, J., Hieronymus, J., Karami, M. P., Keskinen, J.-P., Koenigk, T., Makkonen, R., Massonnet, F., Ménégoz, M., Miller, P. A., Moreno-Chamarro, E., Nieradzik, L., van Noije, T., Nolan, P., O'Donnell, D., Ollinaho, P., van den Oord, G., Ortega, P., Prims, O. T., Ramos, A., Reerink, T., Rousset, C., Ruprich-Robert, Y., Le Sager, P., Schmith, T., Schrödner, R., Serva, F., Sicardi, V., Sloth Madsen, M., Smith, B., Tian, T., Tourigny, E., Uotila, P., Vancoppenolle, M., Wang, S., Wårlind, D., Willén, U., Wyser, K., Yang, S., Yepes-Arbós, X., and Zhang, Q.: The EC-Earth3 Earth system model for the Coupled Model Intercomparison Project 6, Geosci. Model Dev., 15, 2973–3020, https://doi.org/10.5194/gmd-15-2973-2022, 2022. a, b, c, d
Eyring, V., Bony, S., Meehl, G. A., Senior, C. A., Stevens, B., Stouffer, R. J., and Taylor, K. E.: Overview of the Coupled Model Intercomparison Project Phase 6 (CMIP6) experimental design and organization, Geosci. Model Dev., 9, 1937–1958, https://doi.org/10.5194/gmd-9-1937-2016, 2016. a, b
Fabiano, F., Christensen, H., Strommen, K., Athanasiadis, P., Baker, A., Schiemann, R., and Corti, S.: Euro-Atlantic weather Regimes in the PRIMAVERA coupled climate simulations: impact of resolution and mean state biases on model performance, Clim. Dynam., 54, 5031–5048, 2020. a
Fabiano, F., Meccia, V. L., Davini, P., Ghinassi, P., and Corti, S.: A regime view of future atmospheric circulation changes in northern mid-latitudes, Weather and Clim. Dynam., 2, 163–180, 2021. a
Flato, G. M.: Earth system models: an overview, WIRES Climate Change, 2, 783–800, 2011. a
Gutjahr, O., Putrasahan, D., Lohmann, K., Jungclaus, J. H., von Storch, J.-S., Brüggemann, N., Haak, H., and Stössel, A.: Max Planck Institute Earth System Model (MPI-ESM1.2) for the High-Resolution Model Intercomparison Project (HighResMIP), Geosci. Model Dev., 12, 3241–3281, https://doi.org/10.5194/gmd-12-3241-2019, 2019. a
Haarsma, R., Acosta, M., Bakhshi, R., Bretonnière, P.-A., Caron, L.-P., Castrillo, M., Corti, S., Davini, P., Exarchou, E., Fabiano, F., Fladrich, U., Fuentes Franco, R., García-Serrano, J., von Hardenberg, J., Koenigk, T., Levine, X., Meccia, V. L., van Noije, T., van den Oord, G., Palmeiro, F. M., Rodrigo, M., Ruprich-Robert, Y., Le Sager, P., Tourigny, E., Wang, S., van Weele, M., and Wyser, K.: HighResMIP versions of EC-Earth: EC-Earth3P and EC-Earth3P-HR – description, model computational performance and basic validation, Geosci. Model Dev., 13, 3507–3527, https://doi.org/10.5194/gmd-13-3507-2020, 2020. a
Haarsma, R. J., Roberts, M. J., Vidale, P. L., Senior, C. A., Bellucci, A., Bao, Q., Chang, P., Corti, S., Fučkar, N. S., Guemas, V., von Hardenberg, J., Hazeleger, W., Kodama, C., Koenigk, T., Leung, L. R., Lu, J., Luo, J.-J., Mao, J., Mizielinski, M. S., Mizuta, R., Nobre, P., Satoh, M., Scoccimarro, E., Semmler, T., Small, J., and von Storch, J.-S.: High Resolution Model Intercomparison Project (HighResMIP v1.0) for CMIP6, Geosci. Model Dev., 9, 4185–4208, https://doi.org/10.5194/gmd-9-4185-2016, 2016. a, b, c, d, e
Hannachi, A., Woollings, T., and Fraedrich, K.: The North Atlantic jet stream: A look at preferred positions, paths and transitions, Q. J. Roy. Meteor. Soc., 138, 862–877, 2012. a
Held, I. M., Ting, M., and Wang, H.: Northern winter stationary waves: theory and modeling, J. Climate, 15, 2125–2144, 2002. a
Hersbach, H., Bell, B., Berrisford, P., Hirahara, S., Horányi, A., Muñoz-Sabater, J., Nicolas, J., Peubey, C., Radu, R., Schepers, D., Simmons, A., Soci, C., Abdalla, S., Abellan, X., Balsamo, G., Bechtold, P., Biavati, G., Bidlot, J., Bonavita, M., De Chiara, G., Dahlgren, P., Dee, D., Diamantakis, M., Dragani, R., Flemming, J., Forbes, R., Fuentes, M., Geer, A., Haimberger, L., Healy, S., Hogan, R. J., Hólm, E., Janisková, M., Keeley, S., Laloyaux, P., Lopez, P., Lupu, C., Radnoti, G., de Rosnay, P., Rozum, I., Vamborg, F., Villaume, S., and Thépaut, J.-N.: The ERA5 global reanalysis, Q. J. Roy. Meteor. Soc., 146, 1999–2049, 2020. a
Hobbs, W., Palmer, M. D., and Monselesan, D.: An energy conservation analysis of ocean drift in the CMIP5 global coupled models, J. Climate, 29, 1639–1653, 2016. a
Hogan, R. J. and Hirahara, S.: Effect of solar zenith angle specification in models on mean shortwave fluxes and stratospheric temperatures, Geophys. Res. Lett., 43, 482–488, 2016. a
Hoskins, B., James, I., and White, G.: The shape, propagation and mean-flow interaction of large-scale weather systems, J. Atmos. Sci., 40, 1595–1612, 1983. a
Hourdin, F., Mauritsen, T., Gettelman, A., Golaz, J.-C., Balaji, V., Duan, Q., Folini, D., Ji, D., Klocke, D., Qian, Y., Rauser, F., Rio, C., Tomassini, L., Watanabe, M., and Williamson, D.: The art and science of climate model tuning, B. Am. Meteorol. Soc., 98, 589–602, 2017. a, b
Jung, T., Miller, M., Palmer, T., Towers, P., Wedi, N., Achuthavarier, D., Adams, J., Altshuler, E. L., Cash, B. A., Kinter III, J. L., Marx, L., Stan, C., and Hodges, K. I.: High-resolution global climate simulations with the ECMWF model in Project Athena: Experimental design, model climate, and seasonal forecast skill, J. Climate, 25, 3155–3172, 2012. a, b
Kanehama, T., Sandu, I., Beljaars, A., van Niekerk, A., and Lott, F.: Which orographic scales matter most for medium-range forecast skill in the Northern Hemisphere winter?, J. Adv. Model. Earth Syst., 11, 3893–3910, 2019. a, b, c, d, e
Kay, J. E., Deser, C., Phillips, A., Mai, A., Hannay, C., Strand, G., Arblaster, J. M., Bates, S. C., Danabasoglu, G., Edwards, J., Holland, M., Kushner, P., Lamarque, J.-F., Lawrence, D., Lindsay, K., Middleton, A., Munoz, E., Neale, R., Oleson, K., Polvani, L., and Vertenstein, M.: The Community Earth System Model (CESM) large ensemble project: A community resource for studying climate change in the presence of internal climate variability, B. Am. Meteorol. Soc., 96, 1333–1349, 2015. a
Klaver, R., Haarsma, R., Vidale, P. L., and Hazeleger, W.: Effective resolution in high resolution global atmospheric models for climate studies, Atmos. Sci. Lett., 21, e952, https://doi.org/10.1002/asl.952, 2020. a
Kwon, Y.-O., Camacho, A., Martinez, C., and Seo, H.: North Atlantic winter eddy-driven jet and atmospheric blocking variability in the Community Earth System Model version 1 Large Ensemble simulations, Clim. Dynam., 51, 3275–3289, 2018. a, b
Lott, F. and Miller, M. J.: A new subgrid-scale orographic drag parametrization: Its formulation and testing, Q. J. Roy. Meteor. Soc., 123, 101–127, 1997. a, b
Lucarini, V. and Ragone, F.: Energetics of climate models: Net energy balance and meridional enthalpy transport, Rev. Geophys., 49, RG1001, https://doi.org/10.1029/2009RG000323, 2011. a
Madonna, E., Li, C., Grams, C. M., and Woollings, T.: The link between eddy-driven jet variability and weather regimes in the North Atlantic-European sector, Q. J. Roy. Meteor. Soc., 143, 2960–2972, 2017. a
Masato, G., Hoskins, B., and Woollings, T.: Wave-breaking characteristics of Mid-latitude Blocking, Q. J. Roy. Meteor. Soc., 138, 1285–1296, https://doi.org/10.1002/qj.990, 2011. a
Mauritsen, T., Stevens, B., Roeckner, E., Crueger, T., Esch, M., Giorgetta, M., Haak, H., Jungclaus, J., Klocke, D., Matei, D., Mikolajewicz, U., Notz, D., Pincus, R., Schmidt, H., and Tomassini, L.: Tuning the climate of a global model, J. Adv. Model. Earth Syst., 4, M00A01, https://doi.org/10.1029/2012MS000154, 2012. a, b
Mizielinski, M. S., Roberts, M. J., Vidale, P. L., Schiemann, R., Demory, M.-E., Strachan, J., Edwards, T., Stephens, A., Lawrence, B. N., Pritchard, M., Chiu, P., Iwi, A., Churchill, J., del Cano Novales, C., Kettleborough, J., Roseblade, W., Selwood, P., Foster, M., Glover, M., and Malcolm, A.: High-resolution global climate modelling: the UPSCALE project, a large-simulation campaign, Geosci. Model Dev., 7, 1629–1640, https://doi.org/10.5194/gmd-7-1629-2014, 2014. a
Moreno-Chamarro, E., Caron, L.-P., Loosveldt Tomas, S., Vegas-Regidor, J., Gutjahr, O., Moine, M.-P., Putrasahan, D., Roberts, C. D., Roberts, M. J., Senan, R., Terray, L., Tourigny, E., and Vidale, P. L.: Impact of increased resolution on long-standing biases in HighResMIP-PRIMAVERA climate models, Geosci. Model Dev., 15, 269–289, https://doi.org/10.5194/gmd-15-269-2022, 2022. a
Nordeng, T. E.: Extended versions of the convective parametrization scheme at ECMWF and their impact on the mean and transient activity of the model in the tropics, Research Department Technical Memorandum, 206, 1–41, https://doi.org/10.21957/e34xwhysw, 1994. a
Palmer, T., Shutts, G., and Swinbank, R.: Alleviation of a systematic westerly bias in general circulation and numerical weather prediction models through an orographic gravity wave drag parametrization, Q. J. Roy. Meteor. Soc., 112, 1001–1039, 1986. a
Pithan, F., Shepherd, T. G., Zappa, G., and Sandu, I.: Climate model biases in jet streams, blocking and storm tracks resulting from missing orographic drag, Geophys. Res. Lett., 43, 7231–7240, 2016. a, b, c
Polichtchouk, I., Stockdale, T., Bechtold, P., Diamantakis, M., Malardel, S., Sandu, I., Vana, F., and Wedi, N.: Control on stratospheric temperature in IFS: resolution and vertical advection, ECMWF Technical Memoranda, 847, https://doi.org/10.21957/cz3t12t7e, 2019. a, b
Priestley, M. D., Ackerley, D., Catto, J. L., Hodges, K. I., McDonald, R. E., and Lee, R. W.: An overview of the extratropical storm tracks in CMIP6 historical simulations, J. Climate, 33, 6315–6343, 2020. a
Riviere, G. and Joly, A.: Role of the low-frequency deformation field on the explosive growth of extratropical cyclones at the jet exit. Part II: Baroclinic critical region, J. Atmos. Sci., 63, 1982–1995, 2006. a, b
Roberts, C. D., Senan, R., Molteni, F., Boussetta, S., Mayer, M., and Keeley, S. P. E.: Climate model configurations of the ECMWF Integrated Forecasting System (ECMWF-IFS cycle 43r1) for HighResMIP, Geosci. Model Dev., 11, 3681–3712, https://doi.org/10.5194/gmd-11-3681-2018, 2018. a
Roberts, M. J., Vidale, P. L., Mizielinski, M. S., Demory, M.-E., Schiemann, R., Strachan, J., Hodges, K., Bell, R., and Camp, J.: Tropical cyclones in the UPSCALE ensemble of high-resolution global climate models, J. Climate, 28, 574–596, 2015. a
Roberts, M. J., Camp, J., Seddon, J., Vidale, P. L., Hodges, K., Vanniere, B., Mecking, J., Haarsma, R., Bellucci, A., Scoccimarro, E., Caron, L., Chauvin, F., Terray, L., Valcke, S., Moine, M., Putrasahan, D., Roberts, C., Senan, R., Zarzycki, C., and Ullrich, P.: Impact of model resolution on tropical cyclone simulation using the HighResMIP–PRIMAVERA multimodel ensemble, J. Climate, 33, 2557–2583, 2020. a
Sandu, I., Bechtold, P., Beljaars, A., Bozzo, A., Pithan, F., Shepherd, T. G., and Zadra, A.: Impacts of parameterized orographic drag on the Northern Hemisphere winter circulation, J. Adv. Model. Earth Syst., 8, 196–211, https://doi.org/10.1002/2015MS000564, 2016. a, b
Sandu, I., van Niekerk, A., Shepherd, T. G., Vosper, S. B., Zadra, A., Bacmeister, J., Beljaars, A., Brown, A. R., Dörnbrack, A., McFarlane, N., Pithan, F., and Svensson, G.: Impacts of orography on large-scale atmospheric circulation, npj Climate and Atmospheric Science, 2, 1–8, 2019. a, b, c
Schiemann, R., Athanasiadis, P., Barriopedro, D., Doblas-Reyes, F., Lohmann, K., Roberts, M. J., Sein, D. V., Roberts, C. D., Terray, L., and Vidale, P. L.: Northern Hemisphere blocking simulation in current climate models: evaluating progress from the Climate Model Intercomparison Project Phase 5 to 6 and sensitivity to resolution, Weather Clim. Dynam., 1, 277–292, https://doi.org/10.5194/wcd-1-277-2020, 2020. a, b
Schwierz, C., Croci-Maspoli, M., and Davies, H.: Perspicacious indicators of atmospheric blocking, Geophys. Res. Lett, 31, L06125, https://doi.org/10.1029/2003GL019341, 2004. a, b
Shutts, G.: The propagation of eddies in diffluent jetstreams: eddy vorticity forcing of blocking flow fields., Q. J. Roy. Meteor. Soc., 109, 737–761, 1983. a
Terai, C. R., Caldwell, P. M., Klein, S. A., Tang, Q., and Branstetter, M. L.: The atmospheric hydrologic cycle in the ACME v0. 3 model, Clim. Dynam., 50, 3251–3279, 2018. a
Tibaldi, S. and Molteni, F.: On the operational predictability of blocking, Tellus, 42A, 343–365, 1990. a
Trenberth, K. E.: An assessment of the impact of transient eddies on the zonal flow during a blocking episode using localized Eliassen-Palm flux diagnostics, J. Atmos. Sci., 43, 2070–2087, 1986. a
Valdes, P. J. and Hoskins, B. J.: Nonlinear orographically forced planetary waves, J. Atmos. Sci., 48, 2089–2106, 1991. a
van Niekerk, A., Scinocca, J. F., and Shepherd, T. G.: The modulation of stationary waves, and their response to climate change, by parameterized orographic drag, J. Atmos. Sci., 74, 2557–2574, 2017. a, b
van Niekerk, A., Sandu, I., and Vosper, S. B.: The circulation response to resolved versus parametrized orographic drag over complex mountain terrains, J. Adv. Model. Earth Syst., 10, 2527–2547, 2018. a, b
Vannière, B., Demory, M.-E., Vidale, P. L., Schiemann, R., Roberts, M. J., Roberts, C. D., Matsueda, M., Terray, L., Koenigk, T., and Senan, R.: Multi-model evaluation of the sensitivity of the global energy budget and hydrological cycle to resolution, Clim. Dynam., 52, 6817–6846, 2019. a, b, c
Vidale, P. L., Hodges, K., Vannière, B., Davini, P., Roberts, M. J., Strommen, K., Weisheimer, A., Plesca, E., and Corti, S.: Impact of stochastic physics and model resolution on the simulation of tropical cyclones in climate GCMs, J. Climate, 34, 4315–4341, 2021. a
Voldoire, A., Saint-Martin, D., Sénési, S., Decharme, B., Alias, A., Chevallier, M., Colin, J., Guérémy, J.-F., Michou, M., Moine, M.-P., Nabat, P., Roehrig, R., Salas y Mélia, D., Séférian, R., Valcke, S., Beau, I., Belamari, S., Berthet, S., Cassou, C., Cattiaux, J., Deshayes, J., Douville, H., Ethé, C., Franchistéguy, L., Geoffroy, O., Lévy, C., Madec, G., Meurdesoif, Y., Msadek, R., Ribes, A., Sanchez-Gomez, E., Terray, L., and Waldman, R.: Evaluation of CMIP6 deck experiments with CNRM-CM6-1, J. Adv. Model. Earth Syst., 11, 2177–2213, 2019. a
White, R., Battisti, D., and Roe, G.: Mongolian mountains matter most: Impacts of the latitude and height of Asian orography on Pacific wintertime atmospheric circulation, J. Climate, 30, 4065–4082, 2017. a
White, R., Wallace, J., and Battisti, D.: Revisiting the Role of Mountains in the Northern Hemisphere Winter Atmospheric Circulation, J. Atmos. Sci., 78, 2221–2235, 2021. a, b, c, d
Williams, K., Copsey, D., Blockley, E., Bodas-Salcedo, A., Calvert, D., Comer, R., Davis, P., Graham, T., Hewitt, H., Hill, R., Hyder, P., Ineson, S., Johns, T. C., Keen, A. B., Lee, R. W., Megann, A., Milton, S. F., Rae, J. G. L., Roberts, M. J., Scaife, A. A., Schiemann, R., Storkey, D., Thorpe, L., Watterson, I. G., Walters, D. N., West, A., Wood, R. A., Woollings, T., and Xavier, P. K.: The Met Office global coupled model 3.0 and 3.1 (GC3.0 and GC3.1) configurations, J. Adv. Model. Earth Syst., 10, 357–380, 2018. a
Woollings, T., Hannachi, A., and Hoskins, B.: Variability of the North Atlantic eddy-driven jet stream, Q. J. Roy. Meteor. Soc., 136, 856–868, 2010. a, b
Woollings, T., Barriopedro, D., Methven, J., Son, S.-W., Martius, O., Harvey, B., Sillmann, J., Lupo, A. R., and Seneviratne, S.: Blocking and its response to climate change, Current Climate Change Reports, 4, 287–300, 2018. a, b
Wyser, K., Koenigk, T., Fladrich, U., Fuentes-Franco, R., Karami, M. P., and Kruschke, T.: The SMHI Large Ensemble (SMHI-LENS) with EC-Earth3.3.1, Geosci. Model Dev., 14, 4781–4796, https://doi.org/10.5194/gmd-14-4781-2021, 2021. a
Zhang, W., Villarini, G., Scoccimarro, E., Roberts, M., Vidale, P. L., Vanniere, B., Caron, L.-P., Putrasahan, D., Roberts, C., Senan, R., and Moine, M.-P.: Tropical cyclone precipitation in the HighResMIP atmosphere-only experiments of the PRIMAVERA Project, Clim. Dynam., 57, 253–273, https://doi.org/10.1007/s00382-021-05707-x, 2021. a