the Creative Commons Attribution 4.0 License.
the Creative Commons Attribution 4.0 License.
 | 01 Jul 2022
The response of tropical cyclone intensity to changes in environmental temperature
James M. Done
Gary M. Lackmann
Andreas F. Prein
Theory indicates that tropical cyclone (TC) intensity should respond to environmental temperature changes near the surface and in the TC outflow layer. While the sensitivity of TC intensity to sea surface temperature is well understood, less is known about the role of upper-level stratification. In this paper, we combine historical data analysis and idealised modelling to explore the extent to which historical low-level warming and upper-level stratification can explain observed trends in the TC intensity distribution. Observations and modelling agree that historical global environmental temperature changes coincide with higher lifetime maximum intensities. Observations suggest the response depends on the TC intensity itself. Hurricane-strength storms have intensified at twice the rate of weaker storms per unit surface and upper-tropospheric warming, and we find faster warming of low-level temperatures in hurricane environments than the tropical mean. Idealised simulations respond in the expected sense to various imposed changes in the near-surface temperature and upper-level stratification representing present-day and end-of-century thermal profiles and agree with TCs operating as heat engines. Removing upper-tropospheric warming or stratospheric cooling from end-of-century experiments results in much smaller changes in potential intensity or realised intensity than between present day and the end of the century. A larger proportional change in thermodynamic disequilibrium compared to thermodynamic efficiency in our simulations suggests that disequilibrium, not efficiency, is responsible for much of the intensity increase from present day to the end of the century. The limited change in efficiency is attributable to nearly constant outflow temperature in the simulated TCs among the experiments. Observed sensitivities are generally larger than modelled sensitivities, suggesting that observed TC intensity change responds to a combination of the temperature change and other environmental factors.
- Article
(4762 KB) - Full-text XML
- BibTeX
- EndNote


Understanding how tropical cyclones (TCs) and their impacts respond to climate change is of critical scientific and societal importance (e.g. Knutson et al., 2020). However, TC response to environmental change is complex and multi-faceted. Here, we use observations and idealised models to examine the TC intensity response to changes in the environmental near-surface and upper-level temperatures.
Historical global surface temperature trend analyses show significant warming since the mid-1970s, attributed to anthropogenic forcing (Meehl et al., 2004, 2012). Yet trends in the vertical thermal structure and their attribution are less well understood (O'Gorman and Singh, 2013; Prein et al., 2017). Since the mid-1970s most datasets show that the troposphere has warmed, while the lower stratosphere has cooled (e.g. Thompson et al., 2012; Philipona et al., 2018). However, analysing these trends is particularly challenging in the global tropics because of sparse long-term historical upper-air records and the potential for artificial trends driven by observing system changes (e.g. Thorne et al., 2011). Indeed, Vecchi et al. (2013) showed marked differences in the magnitude of the thermal changes among a collection of observational and reanalysis datasets.
Uncertainty in temperature trends also arises from the complexity of the driving mechanisms and their representation in reanalyses (Emanuel et al., 2013; Vecchi et al., 2013) and general circulation models (GCMs). A historical warming maximum in the upper troposphere can be explained through moist adiabatic ascent above warming oceans and has been attributed to increasing greenhouse gas forcing (Santer et al., 2005, 2008). A shift in the moist adiabat corresponds to larger warming aloft than at the surface. For the lower stratosphere, a strengthened Brewer–Dobson circulation has been proposed as a mechanism contributing to the cooling (Butchart, 2014). Here, cooling occurs through enhanced adiabatic cooling and reduced ozone concentration due the to upwelling of ozone-poor tropospheric air. At the same time, observed step changes in cooling have been attributed to the volcanic eruptions of El Chichón in 1982 and Mt. Pinatubo in 1991 (Fujiwara et al., 2015). Ramaswamy et al. (2006) isolated the role of changes in ozone, carbon dioxide, aerosols, and solar radiation in observed lower-stratospheric cooling, concluding that anthropogenic factors were the driver of overall cooling between the late 1970s and the early 2000s.
The representation of these complex mechanisms differs among GCMs and may contribute to the wide range in the magnitude of GCM-simulated profile changes (Cordero and Forster, 2006; Santer et al., 2008; Gettelman et al., 2010; Hill and Lackmann, 2011; Hardiman et al., 2014). GCMs are generally unable to reproduce observed profile change at the uppermost tropospheric levels (Po-Chedley and Fu, 2012; Mitchell et al., 2013), though whether this is due to model or observational error remains unclear. This large spread among models and disagreement with observations may limit our ability to project TC intensity. Emanuel et al. (2013) conclude that tropopause layer cooling contributed to increased TC potential intensity in the North Atlantic basin and that improved process representation of profile changes in GCMs is critically needed to improve TC projections.
As the thermal profile has changed, so has the distribution of global TC intensity (e.g. Kossin et al., 2013; Sobel et al., 2016). A recent analysis of a homogeneous historical TC intensity record from 1979 to 2017 revealed a statistically robust increase in global lifetime maximum intensity (Kossin et al., 2020). The observed intensity distribution has not simply shifted to higher intensities but has become increasingly bimodal (Holland and Bruyère, 2014; Lee et al., 2016; Jewson and Lewis, 2020).
These changes in the TC intensity distribution may be attributable to a variety of environmental and internal processes, including both natural and anthropogenic effects. Changes in vertical wind shear (Ting et al., 2019), humidity (Dai, 2006), temperature (at the sea surface, near surface, and in the TC outflow layer), and the nature of incipient disturbances may all contribute to TC intensity change. It is also understood that the observational datasets used in these analyses have limitations (e.g. Landsea et al., 2006; Klotzbach and Landsea, 2015), although recent efforts have reduced these uncertainties (e.g. Knutson et al., 2019; Kossin et al., 2020; Emanuel, 2021). TC intensity sensitivity to the underlying sea surface temperature (SST), or more accurately the thermal disequilibrium between the SST and the near-surface atmosphere, is relatively well understood (Emanuel, 1987; Elsner et al., 2008; Strazzo et al., 2015; Gilford et al., 2017). Global average TC intensity scales by 2.5 % per kelvin SST warming (Knutson et al., 2019). Yet the magnitude and mechanistic response of TC intensity to changes in upper-level stratification and TC outflow layer temperatures are less well understood.
A Carnot heat engine has been used to link TC intensity with near-surface and TC outflow layer temperatures (Emanuel, 1986, 1991, 2006; Ramsay, 2013; Pauluis and Zhang, 2017). This maximum potential intensity (PI) theory suggests that TC intensity changes in response to SSTs that drive atmosphere–ocean disequilibrium and to the engine's efficiency (the temperature difference between the surface and the level of the TC outflow) (e.g. Emanuel, 1988; Holland, 1997). Specifically, the square of PI is proportional to the product of the thermodynamic efficiency and the thermodynamic disequilibrium. Changes in disequilibrium, rather than efficiency, have been shown to dominate PI variations for seasonal variations (Gilford et al., 2017) and interannual to decadal variations (Rousseau-Rizzi and Emanuel, 2021). In idealised axisymmetric simulations under radiative–convective equilibrium, PI increased by about 1 m s−1 per kelvin of lower-stratospheric cooling and by about 1.5 to 2 m s−1 per kelvin of surface warming (Ramsay, 2013). But the relative importance of disequilibrium and efficiency likely varies by basin (Gilford et al., 2017). SST and outflow temperature are strongly linked when the outflow is confined to the troposphere, thereby limiting TC intensification associated with ocean warming (Shen et al., 2000; Hill and Lackmann, 2011; Tuleya et al., 2016). However, there is greater potential for larger efficiency changes when the outflow extends above the tropopause and occurs in the cooling lower stratosphere.
The realised response of the TCs themselves may be quite different from the response of PI (e.g. Vecchi et al., 2013). This could be due to the different TC outflow layer temperatures in the PI algorithm versus the actual storm. But perhaps more important are environmental factors such as wind shear and humidity acting in combination with internal processes such as asymmetries in the distribution of moist entropy (Riemer et al., 2010; Alland et al., 2021a, b; Wadler et al., 2021) or in the distribution of convection (Rogers et al., 2013; Zawislak et al., 2016; Alvey et al., 2020) that can limit the TC intensity response. Furthermore, the realised response of TCs appears to depend on the TC intensity itself. Indeed, the highest sensitivity to surface warming resides in the strongest storms (e.g. Elsner et al., 2008; Knutson et al., 2010).
We hypothesise that observed environmental temperature changes exert predictable influences on TC intensity. Furthermore, we explore whether historic near-surface and upper-level temperature changes are sufficient to explain past trends in the TC intensity distribution. Our approach blends historical data analysis with idealised numerical modelling. Observational analyses bring together a global homogenised radiosonde temperature dataset with a homogeneous TC intensity record to minimise contamination by artificial trends. Naturally, observed trends in TC intensity are not due to changes in temperature alone and respond to changes in other environmental factors. Our goal is to isolate the influence of temperature change on TC intensity. We focus on a global-scale analysis over a 37-year historical period – scales at which TC intensity should be more strongly constrained by thermodynamic change than by other environmental or geographic factors (Deser et al., 2012). Idealised numerical modelling further isolates and quantifies the TC intensity response to observed trends and future changes in environmental temperatures.
The next section describes the observation datasets and analysis procedures and the numerical model experiments. Results of the observational analysis and idealised numerical model experiments are presented in Sect. 3. A synthesis and concluding discussion are provided in Sect. 4.
2.1 Historical temperature and TC datasets
We use multiple temperature and TC datasets to characterise historical trends and the relationships between TC intensity and thermal structure. Temperature data are compared across radiosonde soundings and two reanalysis datasets and related to two historical TC datasets.
Global radiosonde data are obtained from the Radiosonde Observation Correction Using Reanalyses (RAOBCORE) v1.5.1, available on a grid, at 16 pressure levels, and twice daily (Haimberger, 2007; Haimberger et al., 2012). RAOBCORE was developed to be suitable for climate applications and was created by applying a time series homogenisation to the Integrated Global Radiosonde Archive (IGRA; Durre et al., 2006). This procedure uses temperature differences between radiosonde observations and background forecasts from the European Centre for Medium-Range Weather Forecasts (ECMWF) reanalysis (ERA-40; Uppala et al., 2005) to correct discontinuities tied to observing system changes and remove persistent biases. These corrections are particularly important for lower-stratospheric temperatures where measurements are susceptible to radiation errors (Sherwood et al., 2005). Haimberger et al. (2008) showed that RAOBCORE compares favourably with satellite-derived estimates of temperature trends in the upper troposphere and lower stratosphere, consistent with theoretical and model expectations. Sounding profiles are sufficiently numerous to characterise the thermal structure from the 925 hPa level up to 50 hPa. While sounding locations in TC genesis regions are sparse, their spatial representativeness for temperature scales with the large radius of deformation at low latitudes. In addition, we only use stations that have at least 70 % complete records over the period 1981 to 2017 and do not contain breakpoints. Breakpoints are detected following the methods described in Prein and Heymsfield (2020). Briefly, four different breakpoint detection algorithms are applied, and time series for which more than two algorithms identified a breakpoint in the same year were excluded.
The two reanalysis datasets analysed here, both produced by the ECMWF, are the Interim reanalysis (ERA-I; Dee et al., 2011; accessed from European Centre for Medium-Range Weather Forecasts, 2009) and the more recent ERA5 (Hersbach et al., 2020; accessed from European Centre for Medium-Range Weather Forecasts, 2019). These reanalyses differ in important ways that may affect trends in near-surface temperatures and upper-level stratification, including horizontal and vertical grid spacing, model physics, data assimilation technique, and the data sources assimilated. The horizontal grid spacings are 79 km (TL255) (ERA-I) and 31 km (TL639) (ERA5), and the numbers of vertical levels and vertical extent are 60 levels up to 10 hPa for ERA-I and 137 levels up to 1 hPa for ERA5.
ERA-I and ERA5 assimilate vast quantities of in situ, radiosonde, and remote sensing observations, and the observing systems change over time. This can lead to discontinuities in the simulated time series (Dee et al., 2011; Simmons et al., 2014). ERA-I assimilates the RAOBCORE data, and ERA5 assimilates radiosonde data that have been homogenised using a newer procedure that uses neighbouring stations rather than departure statistics alone. ERA5 contains a pronounced cold bias in the lower stratosphere from 2000 to 2006 due to the use of inappropriate background error covariances (Hersbach et al., 2020; Simmons et al., 2020). This bias has been corrected in ERA5.1, which is a rerun of ERA5 for the period 2000–2006 only (Simmons et al., 2020; accessed from European Centre for Medium-Range Weather Forecasts, 2020). For our analysis we join ERA5 and ERA5.1 by replacing ERA5 with ERA5.1 for the years 2000 to 2006 and continue to refer to this merged dataset as ERA5.
Observations of historical TCs are taken from two sources: the International Best Track Archive for Climate Stewardship version 4 (IBTrACS; Knapp et al., 2010, downloaded on 14 June 2021) and a reanalysed intensity record provided by Kossin et al. (2020). The IBTrACS has formed the basis for many studies of TC variability and change. Here, we use USA agency data, which are largely derived from the National Hurricane Center's HURricane DATa second-generation (HURDAT2) dataset and reports from the Joint Typhoon Warning Center. However, spatial and temporal variations in the instrumental observing system challenge the interpretation of TC variability and change, particularly in the early record (e.g. Landsea et al., 2006; Klotzbach and Landsea, 2015). Indeed, substantial differences across the reporting agencies (Knapp and Kruk, 2010) can contaminate global climatologies (Schreck et al., 2014). In response, Kossin et al. (2013) reanalysed the historical intensity record by applying an intensity algorithm (the advanced Dvorak technique, ADT) to a homogenised geostationary satellite dataset (the Hurricane Satellite record, HURSAT). The resulting ADT-HURSAT dataset was recently extended to cover the period 1979 to 2017 (Kossin et al., 2020). The key advantage of ADT-HURSAT compared to IBTrACS is its consistency in time and space, which makes it suitable for trend analysis, especially from 1981 onwards. Both TC datasets are included here to demonstrate the sensitivity of TC intensity change to artefacts of the datasets and to connect results back to prior work.
The 37-year observational analysis period of 1981 to 2017 is chosen as a balance between data availability and to roughly coincide with the start of the recent warming trend (e.g. Rahmstorf et al., 2017, their Fig. 2) and its influence on global TC behaviour (Holland and Bruyère, 2014).
2.2 Idealised model experiments
We hypothesise that observed environmental temperature changes exert predictable influences on trends in the intensification rate and maximum intensity of TCs. As discussed above, previous studies have explored the sensitivity of TC intensity to both the tropical upper-tropospheric warming maximum and lower-stratospheric cooling. Changes in temperature stratification near the tropopause may influence the sensitivity of TC outflow temperature for a given SST warming (and therefore also influence the thermodynamic efficiency). We use ensembles of simulations from an axisymmetric model to test these predictions and quantify the magnitude of these influences on TC intensity.
The axisymmetric TC capability of Cloud Model 1 (CM1; Bryan and Fritsch, 2002; Bryan and Rotunno, 2009a) is well suited for our experiments. The limitations of axisymmetric simulations are outweighed by the reduced computational expense, which allows us to run ensembles of simulations. Axisymmetric models have proven useful in the evaluation of TC maximum intensity (e.g. Rotunno and Emanuel, 1987; Bryan and Rotunno, 2009a; Hakim, 2011; Rousseau-Rizzi and Emanuel, 2019). We acknowledge that some three-dimensional effects, such as vortex Rossby waves, are known to be important to TC intensity (e.g. Wang, 2002; Gentry and Lackmann, 2010; Persing et al., 2013). So too are asymmetric thermodynamic processes such as downdraughts and radial ventilation that can occur as a response to TC–environment interactions. While axisymmetric models miss the component of the TC response due to internal thermodynamic and kinematic asymmetries, they offer a controlled experimental design to start to link theory and observations. Thus, the response of axisymmetric vortices to changes in the thermodynamic profile is deemed sufficient to test our hypotheses, but fully three-dimensional simulations are needed to investigate this limitation. The axisymmetric domain in our simulations features a 4 km grid length, a model top of 25 km (59 vertical levels), and a radial domain length of 1500 km. At radial distances greater than 280 km the grid length stretches to the larger grid spacing. Sensitivity tests to a doubling of the radial domain length and a simultaneous doubling of the radial distance at which the grid length stretches showed the sensitivity is small compared to changes in physics options or responses to temperature changes (not shown). The horizontal mixing length in this version of CM1 is a linear function of surface pressure, varying from 100 m at 1015 hPa to 1000 m at 900 hPa (Bryan, 2012).
We initialise CM1 (version r19.10) with the Dunion (2011) “moist tropical” sounding, derived from western North Atlantic rawinsonde data from 1995 to 2002 (Fig. 1a). The model is initialised with a weak vortex (∼12 m s−1 maximum azimuthal velocity in gradient thermal wind balance) like that in the control simulation of Rotunno and Emanuel (1987). A potentially important difference between our experimental design and that of Rotunno and Emanuel (1987) is that our initial conditions are not in a state of radiative–convective equilibrium. This is to assess the influence of temperature profile differences more directly during the TC intensification stage, although we acknowledge that the TC begins to modify the environment immediately, and we have not eliminated these changes in our simulations. Our present-day simulations feature an SST of 28 ∘C, close to the near-surface air temperature (following Bryan and Rotunno, 2009b)
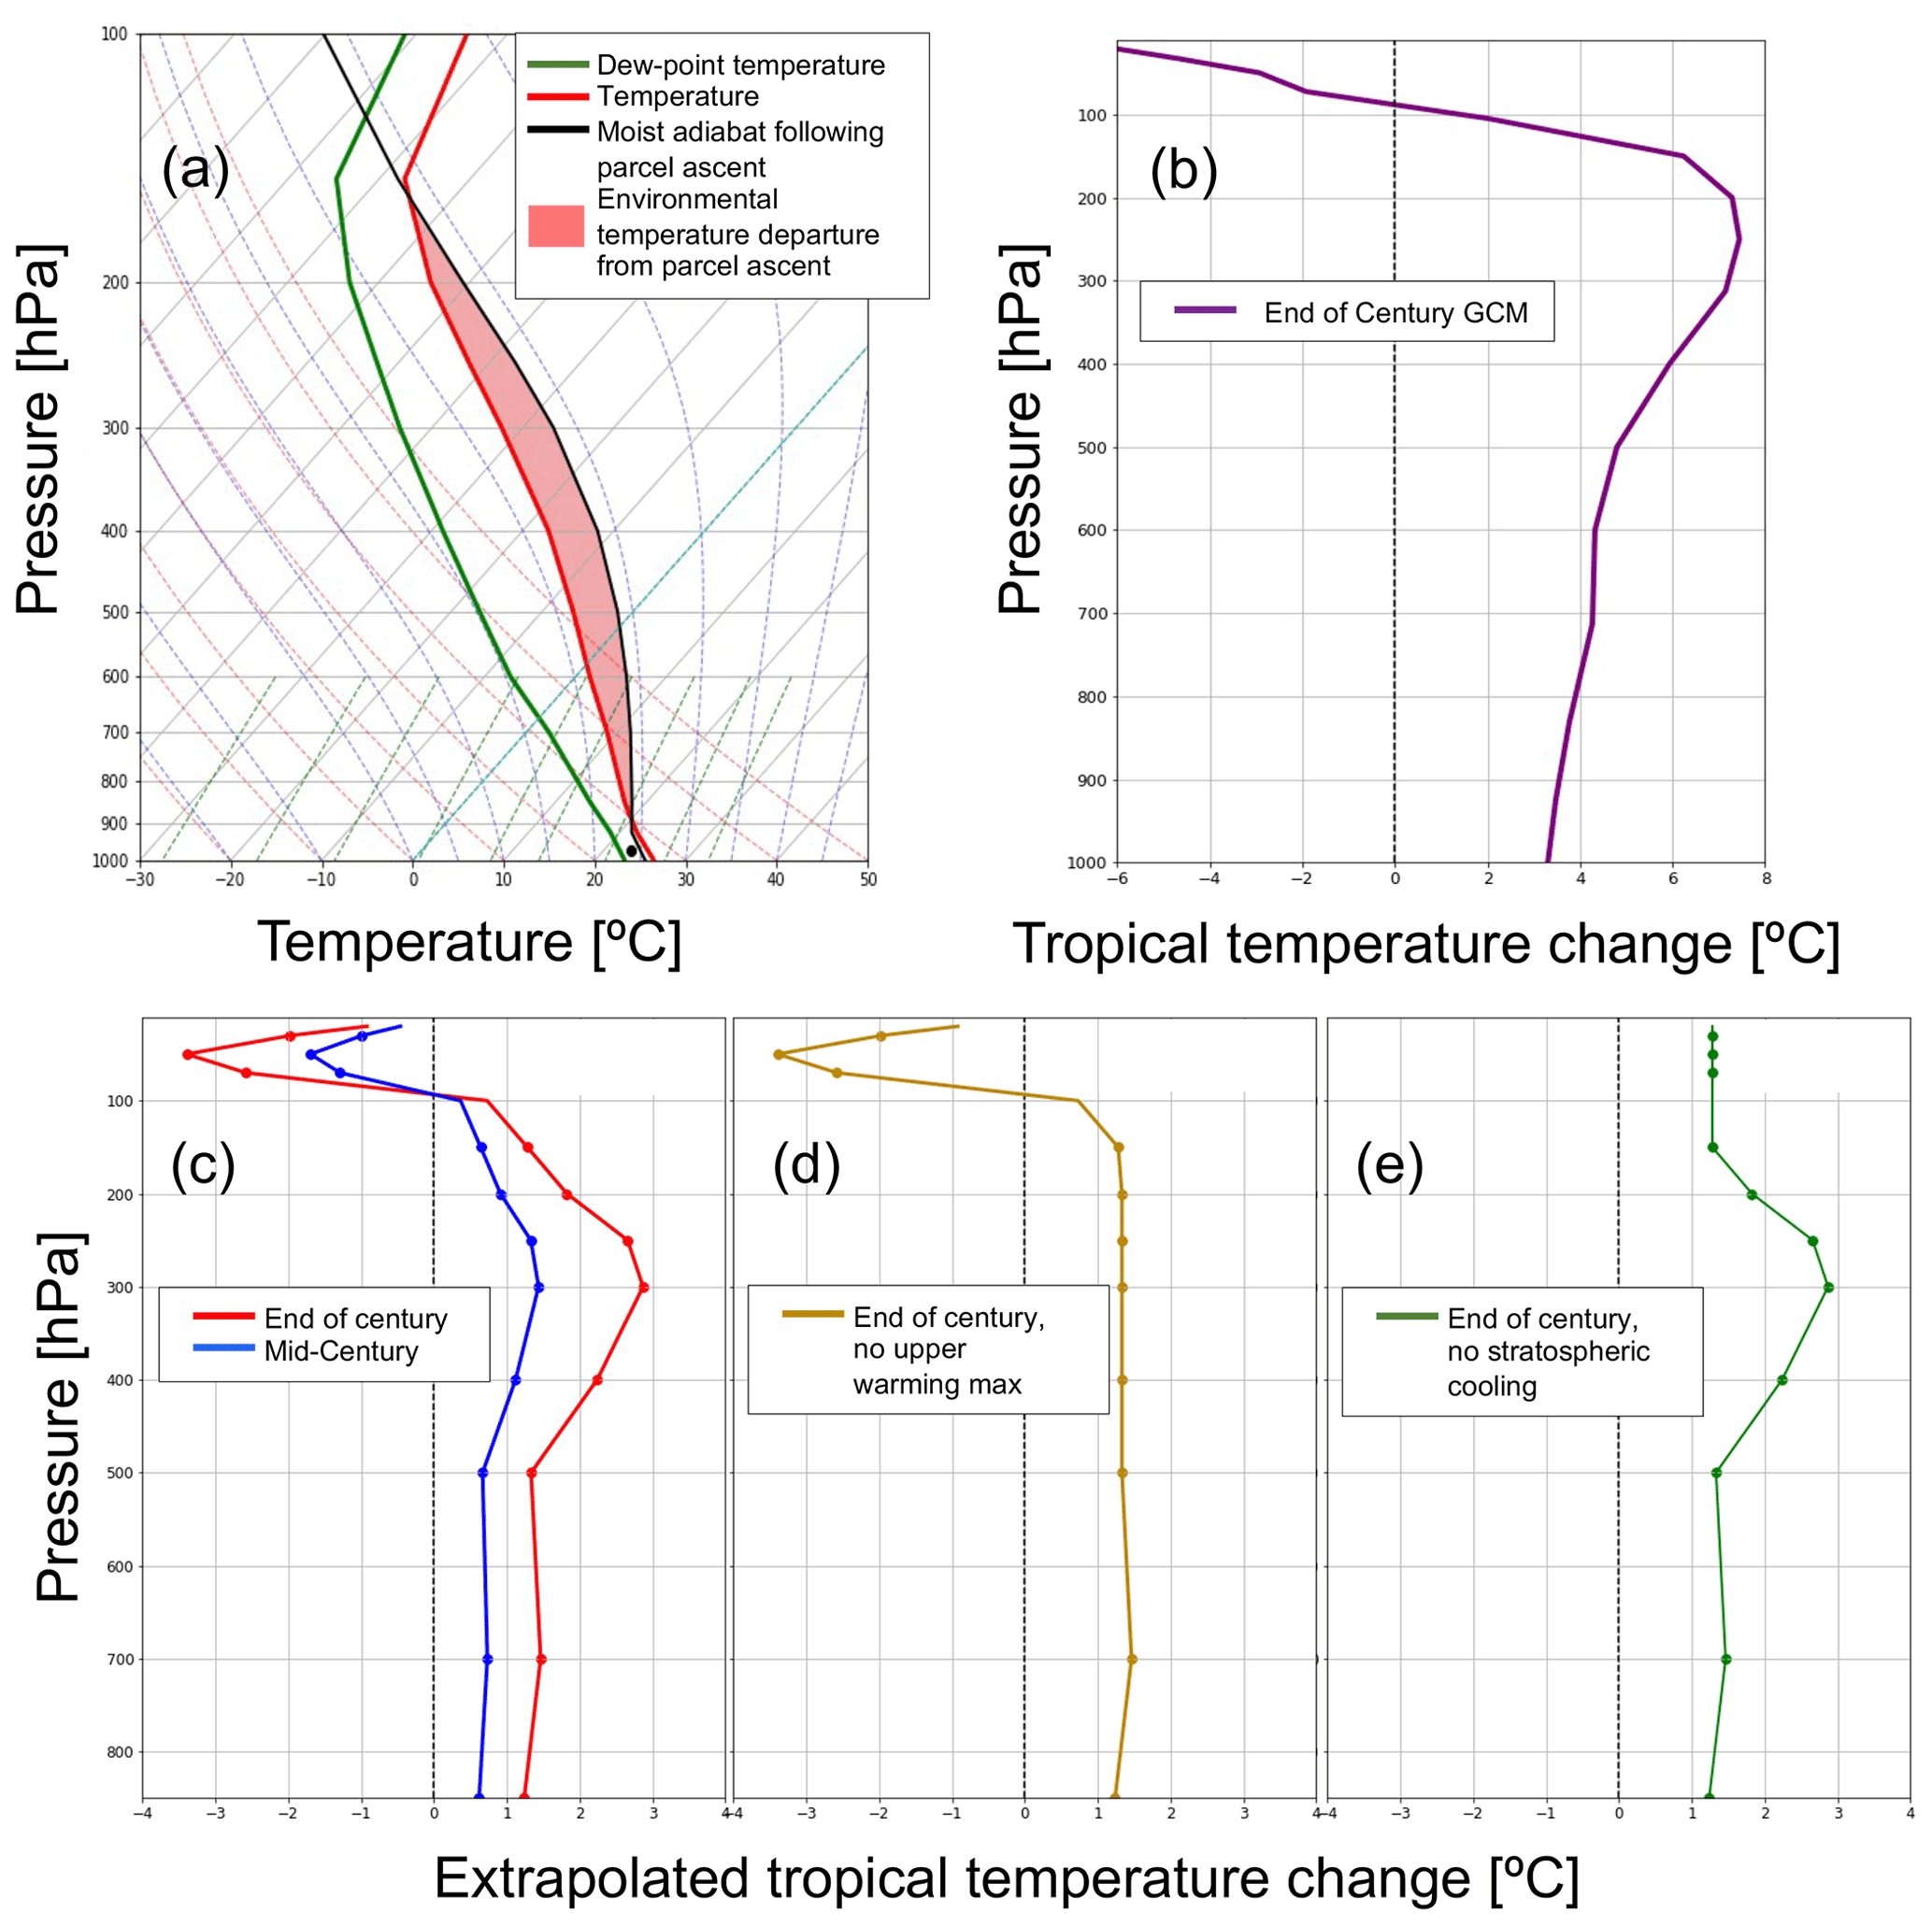
Figure 1(a) Dunion (2011) moist tropical sounding, (b) tropical temperature change profile derived from an average of 21 CMIP5 GCMs under the RCP8.5 emission scenario, (c) temperature change profiles extrapolated from hurricane-season tropical trends in the RAOBCORE database and modified (d) by removal of the upper warming maximum and (e) by removal of stratospheric cooling. Note the differences in vertical-axis ranges between panels (b) and (c), (d), and (e).
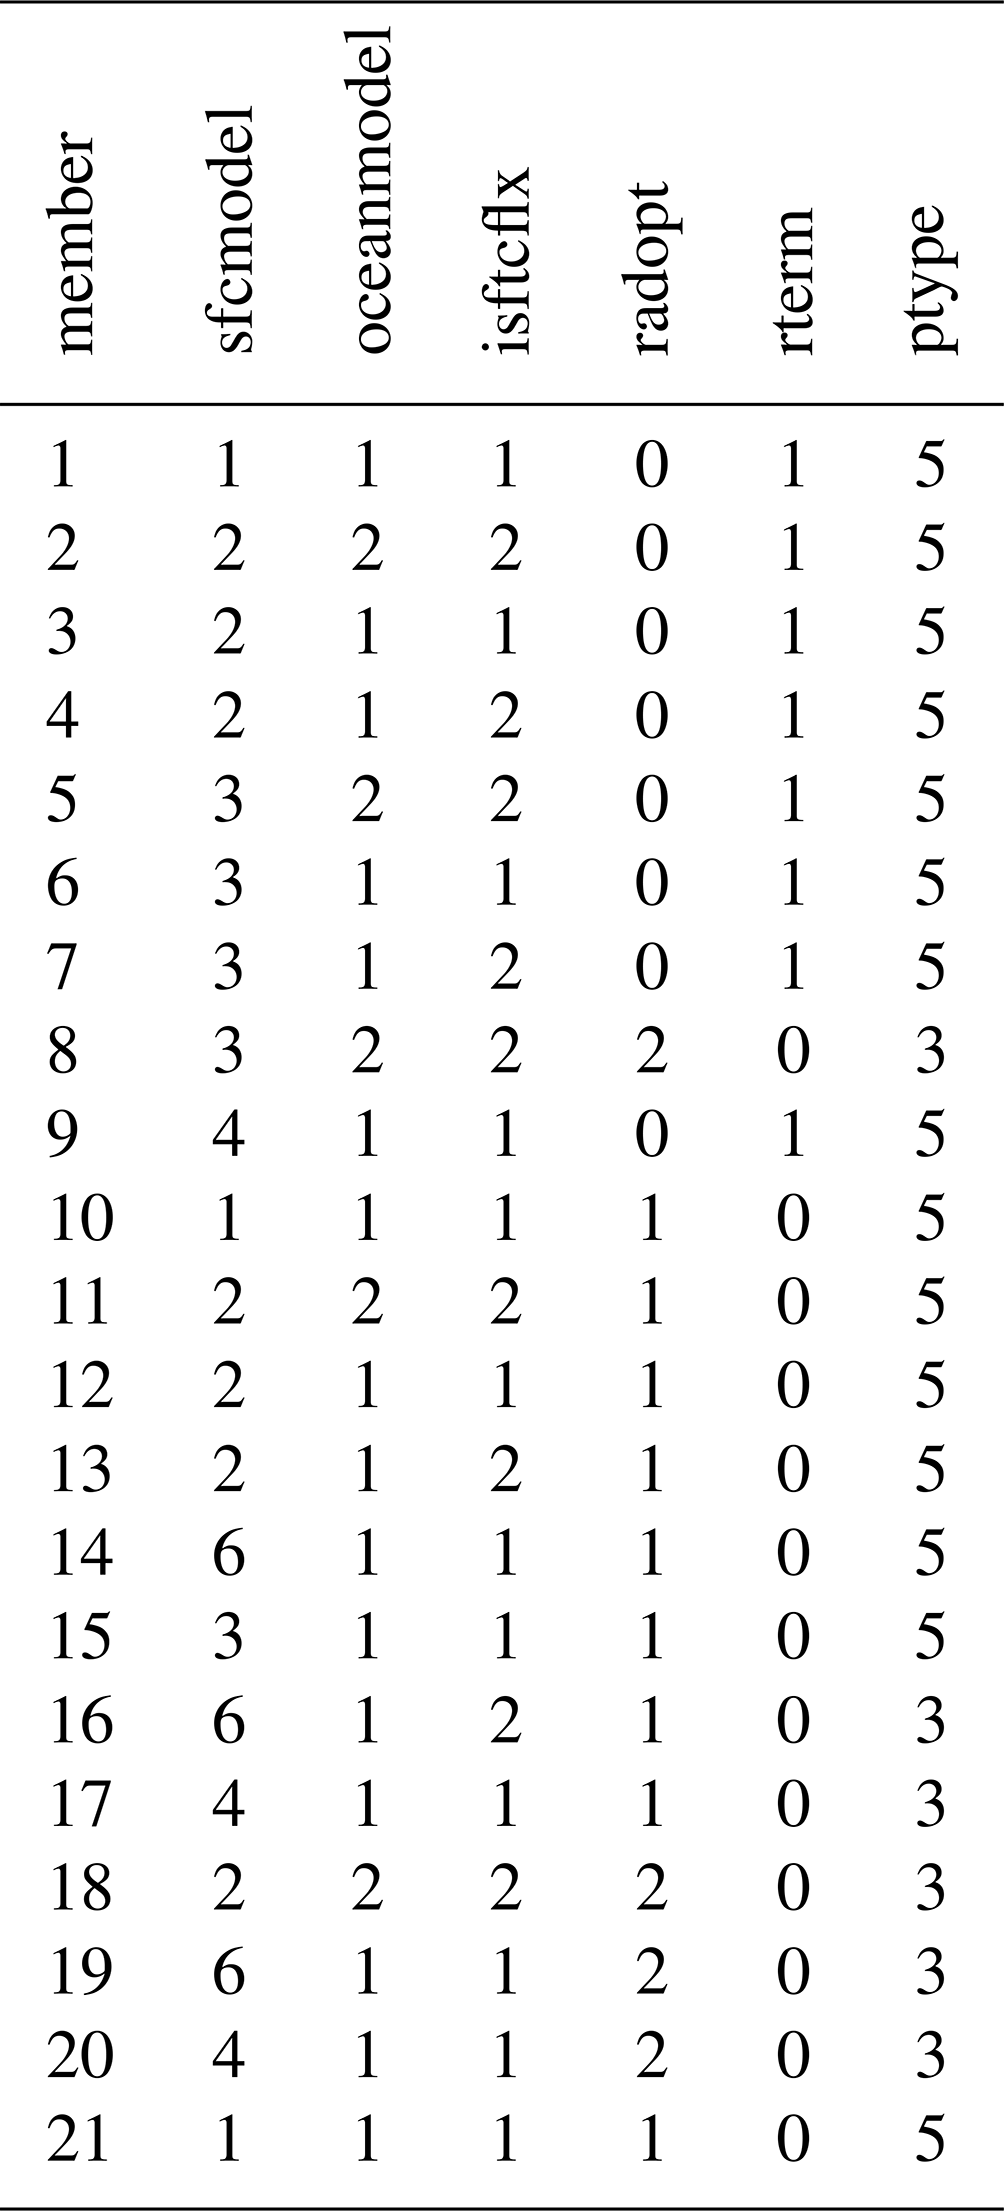
We ran the simulations for 8 d, which allowed the idealised TCs to intensify to a maximum and then equilibrate to a quasi-steady-state intensity. We recognise that much longer integrations have been used in several equilibrium studies (e.g. Hakim, 2011; Ramsay, 2013), but TC modification of the environment in longer integrations would limit our ability to detect environmental influences. Shorter simulations also limit the effect of excessive large-scale drying in the subsidence region, leading to storm weakening found in some longer CM1 simulations (Rousseau-Rizzi et al., 2021). Given our goal of examining TC responses to changes in environmental temperatures, we focus on the core steady-state (CS) period, where intensity varies only slowly after the time of peak core strength (Rousseau-Rizzi et al., 2021), though we also present the peak core strength given its approximate equivalence to lifetime maximum intensity (LMI). Owing to the sensitivity of simulated TC intensity to various model parameterisation choices, we ran an ensemble of 21 simulations for each environmental profile, varying the turbulence, radiation, sea surface, and microphysical parameterisations (Tables 1 and A1).
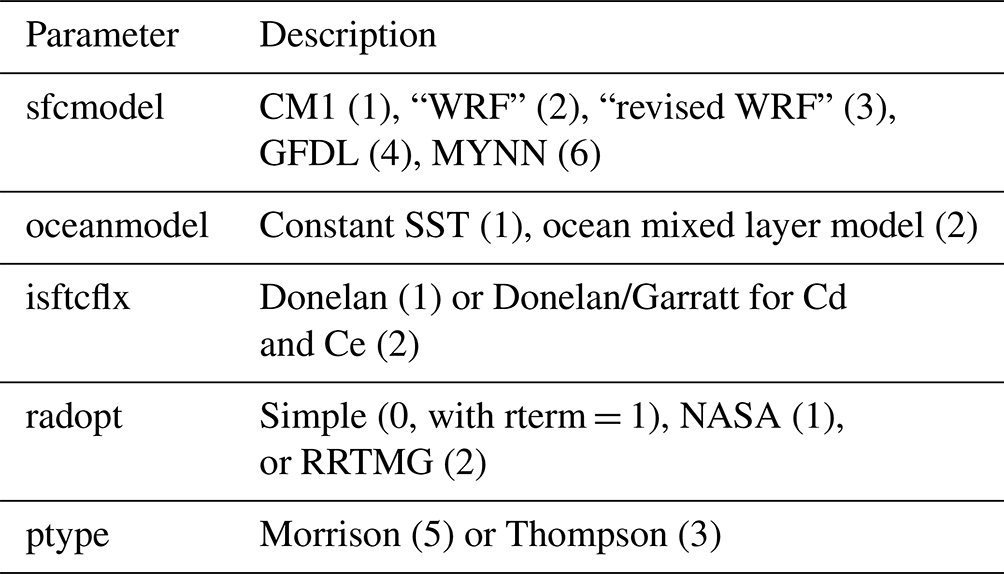
Table 1CM1 model physics ensemble name list choices for the surface model (sfcmodel), ocean model (oceanmodel), surface exchange coefficients (isftcflx), atmospheric radiation (radopt), relaxation term that mimics atmospheric radiation (rterm), and explicit moisture scheme (ptype); see Table A1 for specific settings for each of the 21 ensemble members.
To explore the sensitivity of simulated TC intensity to changes in the environmental thermodynamic profile, we ran five additional 21-member ensemble experiments (Table 2). These were primarily designed to explore TC intensity response to extrapolated observational trends based on RAOBCORE data discussed in Sect. 2.1 and presented in Sect. 3.1. The “mid-century” experiment corresponds to conditions approximately in the year 2050 if current trends are extrapolated, and the “end-of-century” experiment applies changes extrapolated over a century-long period (Fig. 1c). SSTs for the mid- and end-of-century experiments were chosen to be close to the near-surface air temperature. Two additional experiments allow us to isolate the sensitivity of TC intensity to specific changes observed in tropical temperature profiles. The “no upper warming maximum” ensemble is based on a temperature change profile that is nearly constant with height in the troposphere (Fig. 1d), and the “no stratospheric cooling” simulations explore the TC response to a temperature change profile that eliminates lower-stratospheric cooling (Fig. 1e). Recognising the limitations in the extrapolation of current observational trends, we ran an additional ensemble experiment based on a multi-model mean of IPCC AR5 GCM tropical change profiles for end-of-century conditions under the RCP8.5 scenario (Fig. 1b; see also Table 2 in Jung and Lackmann, 2019). For all simulations involving temperature perturbations, relative humidity is held constant, resulting in increased water vapour content with warming. This assumption is supported by observations (e.g. Dai, 2006; Willett et al., 2007) in addition to theoretical and modelling studies (e.g. Allen and Ingram, 2002; Held and Soden, 2006; Pall et al., 2007).
Table 2Ensemble experiments and maximum intensity (i.e. Pmin); values are for time-filtered time series. For the three right columns, numbers in parentheses represent standard deviation. A Butterworth low-pass time filter was applied to remove high-frequency fluctuations. Core steady-state (CS) Pmin is taken over simulation hours 150 to 193, while Pmin is peak intensity. “Complex” denotes the 13-member ensemble subset with complex-radiation parameterisation. Settings for the Emanuel potential intensity (E-PI) calculation, based on the pyPI software package (Gilford, 2021), include dissipative heating (Bister and Emanuel, 1998), an enthalpy-drag coefficient ratio of 0.9, and a wind reduction coefficient of 0.9.
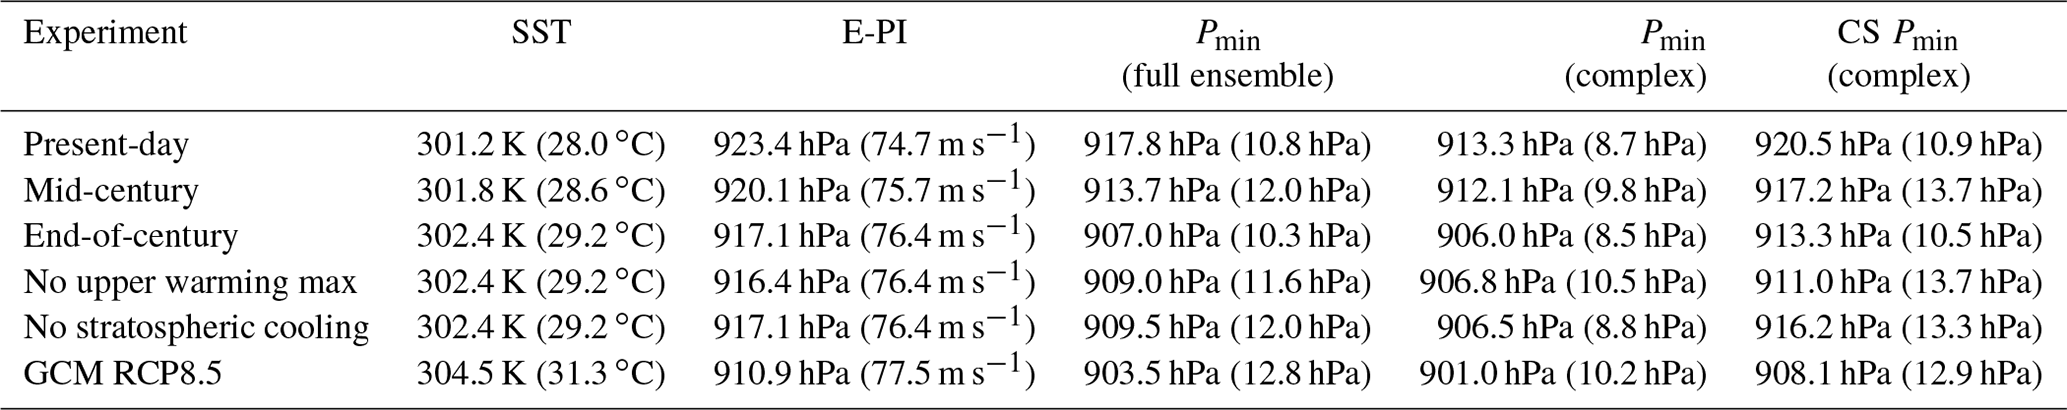
Despite temporal variability, the ensemble-mean intensity appears close to the analytical value predicted by the Emanuel (1988) maximum potential intensity (E-PI; Table 2); we recognise that considerable uncertainty also exists in the E-PI values owing to various choices that go into that calculation. We also note that the E-PI algorithm used here is formulated using a convective available potential energy (CAPE)-based definition of E-PI, which does not depend explicitly on efficiency and disequilibrium. Rather, it is based on the equivalence between disequilibrium and the difference between environmental CAPE and saturation CAPE. Rousseau-Rizzi et al. (2022) show that the two formulations are physically linked via parcels' surface moist static energy, thus increasing confidence in our use of the CAPE-based formulation.
Based on the thermodynamic and Carnot efficiency considerations mentioned in Sect. 1 and the E-PI calculations shown in Table 2, we predict a priori that the present-day simulation would produce the weakest ensemble-mean TC, followed in order of increasing intensity by the mid-century and end-of-century simulations. We further expect that simulations omitting the tropical upper warming maximum would be slightly stronger than the default end-of-century ensemble and that the ensemble removing stratospheric cooling would be slightly weaker in intensity relative to the default end-of-century run. We expect the GCM-based ensemble to yield the strongest storm, given significantly greater warming. Of course, the numerical simulations are not constrained to agree with these theoretically motivated predictions.
To further test our hypotheses relating changes in TC intensity to environmental temperature changes, we computed thermodynamic efficiency and thermodynamic disequilibrium following Emanuel (1987, 1988) and Gilford (2021). Given the availability of high-resolution numerical simulations, we also computed the simulated TC outflow temperature directly, defined as the temperature of air with outward radial flow exceeding 1.0 m s−1 and cloud ice mixing ratio exceeding 10−5 kg kg−1. Experimentation with these threshold values demonstrates that this setting works well to represent the temperature of the cirrostratus outflow layer, though the ensemble average values obtained were not highly sensitive to changes in the radial velocity or cloud ice mixing ratio thresholds (not shown). In our analysis of derived outflow temperatures, we noted substantial differences between simulations conducted with “complex” versus “simple” representations of radiation and have stratified the results accordingly.
3.1 Historical temperature and TC observations
To begin exploring whether observed changes in near-surface temperature and upper-level stratification are sufficient to explain observed trends in the TC intensity distribution, we start with an analysis of historical data. Historical summertime tropical temperature trends are compared across RAOBCORE, ERA5, and ERA-I in Fig. 2a. The known upper-tropospheric warming maximum and lower-stratospheric cooling are present across all three datasets but vary significantly in magnitude and vertical structure. As expected, ERA-I and RAOBCORE trend profiles agree well with each other (since ERA-I assimilates RAOBCORE data), with peak warming located at the 300 hPa level. The ERA5 exhibits 30 % weaker peak warming than RAOBCORE and locates peak warming higher in altitude, at 175 hPa. Cooling rates in the lower stratosphere are strongest in ERA5, reportedly due to the assimilation of radiosonde data adjusted by the RICH method (Haimberger et al., 2012; Hersbach et al., 2020). Simmons et al. (2014) suggest that the weaker cooling trend in ERA-I may be related to a cold bias in the lower stratosphere which persisted through the early 2000s and then was corrected through new assimilation of radio occultation data.
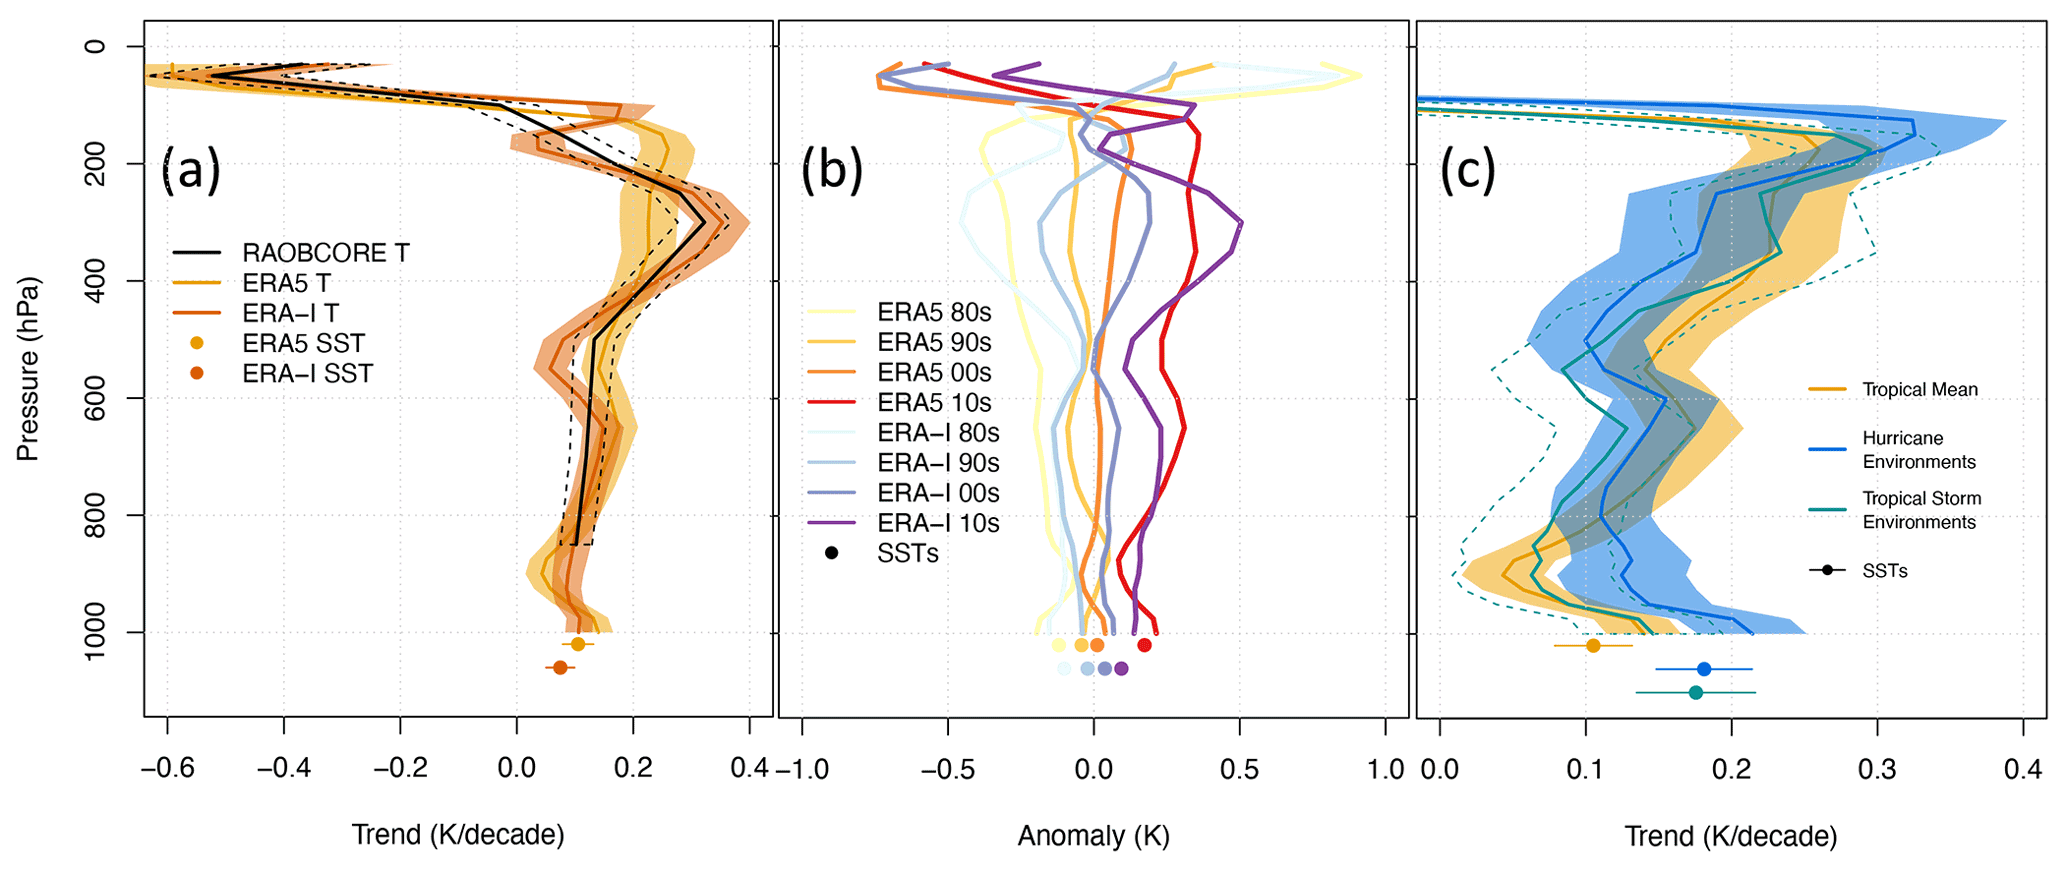
Figure 2Historical tropical temperature profiles averaged over 0∘ to 20∘ N for August–September–October and 20∘ S to 0∘ for December–January–February using RAOBCORE, ERA5, and ERA-I are shown as (a) the linear trend over the period 1981 to 2017 (K per decade) and (b) departures of decadal averages from the 1981 to 2017 average (K) for ERA5 and ERA-I only. Decadal averages are calculated over the periods 1981 to 1989, 1990 to 1999, 2000 to 2009, and 2010 to 2017. (c) As in panel (a) for ERA5 and including trends for proximal environments for tropical storms (ADT-HURSAT LMI less than 33 m s−1) and for hurricane-strength TCs (ADT-HURSAT LMI greater than or equal to 33 m s−1). Proximal environments are defined as averages within a 0.5∘ radius of the LMI locations 2 d before the TC arrives at the location using ERA5. Filled circles indicate sea surface temperatures (SSTs) where the position on the y axis is chosen for clarity. Shading, dashed lines, and lines through the filled circles in panels (a) and (c) indicate plus and minus twice the standard error of the trend lines, approximating the 95 % confidence interval.
We next examine whether the trend is stable across the decades or whether the change concentrates in a particular decade. The rate of change is roughly constant across the 4 decades throughout the troposphere (Fig. 2b). But decadal changes in the lower stratosphere are less stable, reflecting the known step changes in temperature linked to volcanic eruptions (Ramaswamy et al., 2006).
Figure 2c shows that temperature trends proximal to strong TCs are significantly different from trends for the tropics as a whole. Proximal is defined here as an average within 0.5∘ of the LMI locations (according to ADT-HURSAT) 2 d before a TC arrives at the location. Area-averaged soundings are crude approximations for the spatially varying profiles the TCs experience (e.g. Zawislak et al., 2016). However, we consider area-averaged profiles appropriate for this assessment of global trend signals, where spatial profile variations specific to individual TCs may be less important. The sample sizes are 2174 tropical storm environments and 1774 hurricane environments. Strong TC environments have warmed significantly faster than the tropical mean environment below the 850 hPa level. The SSTs in strong TC environments have also warmed faster than the tropical mean SSTs (Fig. 2c) and are likely driving the rapid warming at low levels. The warming surface and low-level temperatures would sustain the thermal disequilibrium supportive of strong potential intensities. The peak warming in the upper troposphere is correspondingly stronger for strong TC environments and located at a higher level relative to the tropics overall. Trends also differ between proximal environments for tropical storms and hurricane-strength storms, but not significantly so. Tropical storm environments also do not trend significantly differently from the tropical mean environment.
Our purpose here is not to comment on which temperature dataset produces the most accurate trends but rather to document that the choice of temperature dataset matters for the magnitude and structure of the temperature trend. We also update previous work (Emanuel et al., 2013; Vecchi et al., 2013) that compared across reanalysis datasets by including the more recent ERA5 combined with ERA5.1. By extension, analysed relationships between TC intensity trends and near-surface temperature and upper-level stratification trends may also vary by choice of temperature dataset. Later in this section, we make links between temperature trends and TC intensity trends. This requires a temperature dataset with globally uniform coverage. We choose the ERA5 dataset for this purpose given its higher spatial resolution and newer data assimilation procedures compared to ERA-I. We next turn our attention to the changing TC intensity distribution.
At the same time as the global tropical temperatures have changed, so too has the distribution of global TC intensity. Figure 3a and b show TC intensity distributions by historical decade in both the IBTrACS and ADT-HURSAT datasets. First, we notice the differently shaped distributions between IBTrACS and ADT-HURSAT. Kossin et al. (2020) explain that cirrus-obscured TC eyes can cause underestimation of lifetime maximum intensity (LMI) at around 33 m s−1. It is likely that this dataset, therefore, over-reports LMI values less than 33 m s−1, with higher LMI only reported if the algorithm locks onto a clearing eye signature as TCs intensify. ADT-HURSAT, therefore, sacrifices storm-level accuracy for improved long-term statistics.
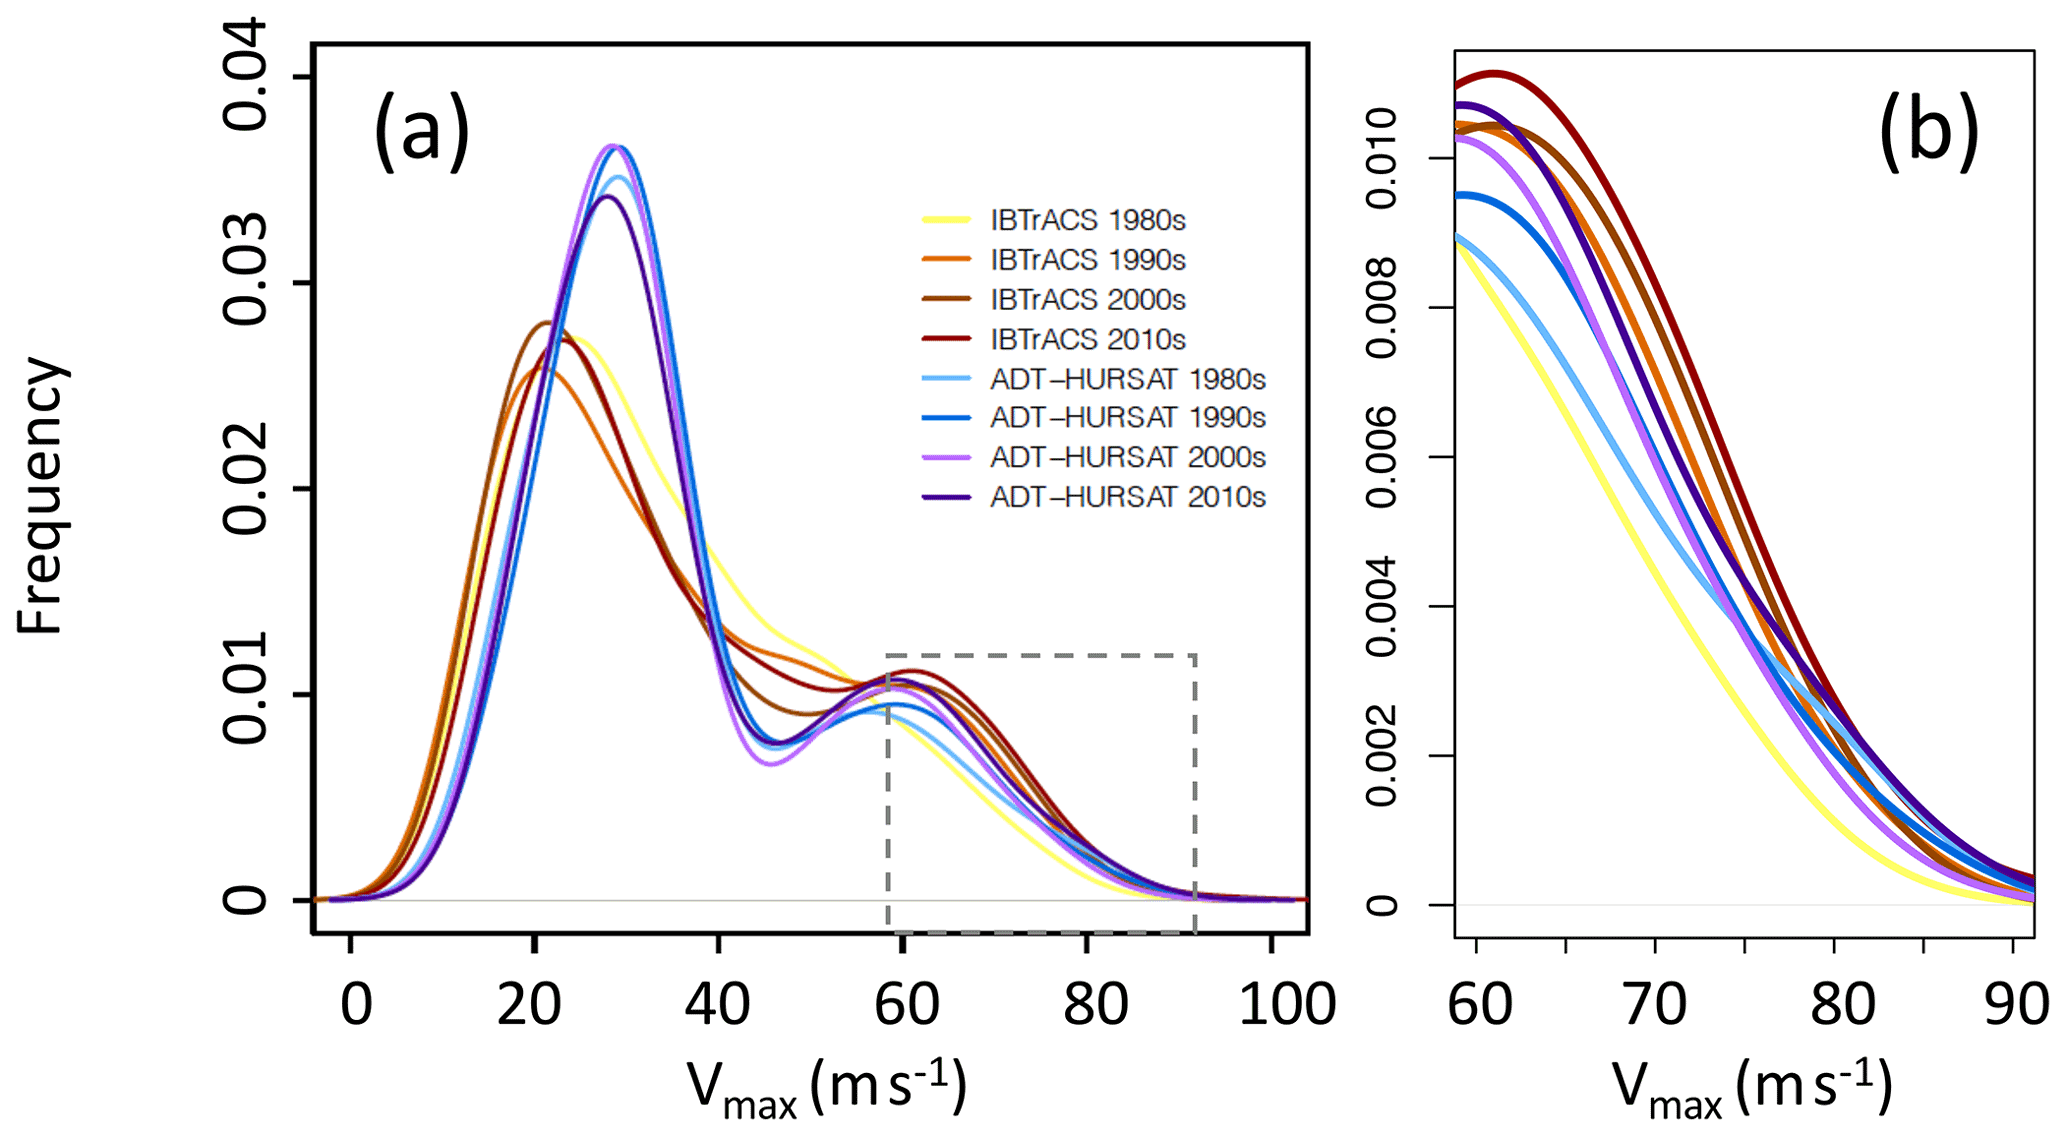
Figure 3(a, b) Distributions of global TC LMI (lifetime maximum 1 min sustained wind speed at 10 m above the surface; m s−1) for the period 1981 to 2017 split by historical decade using IBTrACS and ADT-HURSAT. The exact years for each decadal period are 1981 to 1989, 1990 to 1999, 2000 to 2009, and 2010 to 2017. Kernel density is estimated using Gaussian smoothing kernels with a standard deviation of 5 m s−1. Panel (b) provides a close-up view of the portion of panel (a) outlined by the dashed grey line.
The well-established bimodal distribution is present in both datasets, and both reproduce the known result of an increasing proportion of the strongest storms over time (e.g. Elsner et al., 2008; Kossin et al., 2020). We also reproduce the stronger trends in IBTrACS than ADT-HURSAT. For the proportion of major hurricanes (category 3 and higher on the Saffir–Simpson scale), Kossin et al. (2020) find the increase in ADT-HURSAT is about half that in IBTrACS and suggest that half the trend in IBTrACS is attributable to changes in observing systems. When considering the proportion of category 4 and 5 storms, we find even larger discrepancies. In IBTrACS, the proportion of category 4 and 5 storms increases from 11.3 % in the 1980s to 20.9 % in the 2010s, a factor of 1.85 increase. For ADT-HURSAT, the proportion increases from 14.1 % in the 1980s to 17.7 % in the 2010s, a factor of only 1.26 and a rate approximately 3 times lower than in IBTrACS. Our finding here is consistent with the greater impact of observing system change for the strongest storms (Kossin et al., 2020). Interestingly, we also find that IBTrACS produces more than half the change between the first 2 decades (the 1980s to the 1990s), whereas ADT-HURSAT produces more than half the change between the final 2 decades (2000s to the 2010s).
We now begin to explore statistical linkages between the changing TC intensity and near-surface and upper-level temperatures. We use quantile regression models to explore how the strength of the statistical relationship between LMI and environmental temperature varies by storm intensity, following the approach used in Elsner et al. (2008) and Kossin et al. (2013). Our quantile regression models specify how the LMI quantile changes with temperature variation. This allows us to identify whether relationships with the surface or upper-level temperature differ between strong and weak storms. We later compare these assessments to those derived from our numerical simulations.
We start by quantifying temporal trends in LMI to link back to existing work and provide a starting point from which to explore trends concerning temperature. When considering all TCs (Fig. 4a), only those exceeding hurricane strength (>33 m s−1) show intensification, but trends are not significantly different from zero. Kossin et al. (2020) report that quantile regression can be highly sensitive to the range of the data. When considering only hurricane-strength storms (Fig. 4b) we found that intensification is significantly different from zero, peaking at 3 m s−1 per decade for a hurricane quantile of 0.4. These results reproduce those of Kossin et al. (2020).

Figure 4Trends in global LMI quantiles using ADT-HURSAT over the period 1981 to 2017. (a) Temporal trends for all TCs, (b) temporal trends for hurricane-strength (>33 m s−1) TCs only, (c) trends with SST for all TCs, (d) trends with temperature at the 300 hPa level (T300) for all TCs, and (e) trends with temperature at 50 hPa (T50) for all TCs. Quantiles vary between 0.025 and 0.0975 with an interval of 0.05. The 95 % confidence interval (grey shading) is calculated from bootstrapping with 200 replications. The vertical dashed grey lines are reference lines indicating hurricane category 1 intensity. The slope of the E-PI trend line is shown with horizontal dashed red lines in panels (a) and (b). E-PI is calculated using LMI-proximal data. The second x axis along the top of each panel shows the LMI values corresponding to the LMI quantiles. In panel (b) the second x axis starts at 33 m s−1 (by definition) and remains at 33 m s−1 until the 0.2 quantile. R code is adapted from Elsner and Jagger (2013) and available at https://rpubs.com/jelsner/5342 (last access: 1 October 2021).
We next explore how these trends in LMI quantiles compare to trends in the theoretical maximum potential intensity to determine how strong vs. weak storms have kept pace with trends in their PI. The theoretical maximum potential intensity is calculated using E-PI (Emanuel, 1988) on thermodynamic profiles from ERA5 data proximal to individual TCs at the time of LMI. The linear trend in mean E-PI is 1.2 m s−1 per decade for locations of all TCs and 0.9 m s−1 per decade for locations of hurricane-strength TCs only. Given that tropical-storm-strength TCs show no temporal trend, they have not kept pace with their rising E-PI. But hurricane-strength storms exhibit super-E-PI trends and have therefore closed the gap between realised and maximum potential intensity.
Figure 4c, d, and e show relationships between LMI quantiles over all TCs and SST, temperature at the 300 hPa level (T300), and temperature at the 50 hPa level (T50). As before for the calculation of E-PI, representative environmental temperatures are obtained using LMI proximal values. In general, we find large and statistically significant relationships. Intensity has increased substantially with warming SSTs almost universally across LMI quantiles, but with a markedly different response between hurricane-strength storms and weaker storms. Tropical-storm-strength quantiles have increased by approximately 0.6 m s−1 K−1, whereas the rate rises rapidly with LMI quantiles above hurricane category 1 strength, reaching a maximum of 2.6 m s−1 K−1 at the highest quantiles. This is markedly different behaviour from the temporal trends where the higher rates are located at the middle quantiles. We also note the dip in the trend at quantiles close to about 33 m s−1. These may not be reliable because it coincides with the intensity at which the ADT-HURSAT determinations can be influenced by cirrus-obscured eyes.
The response of LMI quantiles to T300 is qualitatively similar to the response to SST, but trends plateau for the highest quantiles. This similarity may be expected given the strong correlation between proximal SST and proximal T300 (R=0.78). The reduced rates of change for the highest quantiles may also be expected given the larger change in upper-tropospheric temperature per unit change in SST. As before for SST, hurricane-strength TCs exhibit markedly different behaviour to weaker storms: they intensify with T300 warming at approximately twice the rate of weaker storms.
The response of LMI quantiles to T50 temperature (Fig. 4c) shows increasing intensity with cooling across most LMI quantiles but is statistically significant for tropical-storm-strength storms only. We, therefore, do not find a significant relationship between trends in hurricane intensity and lower-stratosphere temperature, at least for this global-scale analysis. This is consistent with the GCM study by Vecchi et al. (2013) but inconsistent with idealised simulations of Ramsay (2013).
In summary, our analysis of historical records finds that hurricane-strength storms exhibit markedly different behaviour to weaker storms in environments of changing near-surface and upper-level temperature. Hurricane-strength storm intensity increases at twice the rate or more compared to weaker storms within environments of sea surface temperature warming. Hurricane-strength storm intensity also increases at twice the rate compared to that of weaker storms in environments of upper-tropospheric warming. Despite upper warming having a limited correlation with TC intensity, this result is perhaps unsurprising given the strong correlation between SST and T300 (not shown). The response of hurricane-strength storms within environments of lower-stratospheric cooling was mixed and did not reach statistical significance.
3.2 Idealised model experiments
Towards the goal of isolating and quantifying the effects of near-surface temperature and upper-level stratification changes on TC intensity, we turn to idealised simulations which are free from other changes. If the results of these simulations agree with expectations, we can be more confident in attributing observed TC intensity trends to temperature changes, which are perhaps more reliably projected by GCMs. On the other hand, if the idealised simulations indicate TC intensity trends that differ markedly from observations, then we can be more confident that other environmental changes are dominant in driving the observed changes. As discussed in Sect. 2.2, numerical simulations were conducted with the CM1 model in an axisymmetric TC configuration.
The 21-member control (present climate) ensemble features an initial period of slightly weakening TC intensity, followed by steady vortex intensification between simulation hours 12 and 90 (Fig. 5). Considerable ensemble spread develops by hour 50, with central pressure values ranging from less than 900 hPa to nearly 960 hPa at hour 100. The simulated ensemble mean TC minimum sea level pressure attained a minimum (maximum intensity) around hour 130, followed by slight weakening and quasi-steady ensemble-mean intensity until the end of the simulation. Simulations using a simple Newtonian cooling radiation parameterisation generally resulted in weaker TCs (blue lines in Fig. 5), motivating the use of an ensemble subset consisting of the 13 members using more complex-radiation parameterisations. The complex-radiation subset features reduced ensemble spread and a lower ensemble-mean central pressure (Table 2). The intensification phase of TCs in the complex-radiation members consistently begins earlier in the simulation relative to the simple-radiation subset; for instance, the time required for Pmin to reach 960 hPa is nearly 24 h faster for the complex-radiation members (Fig. 5). We evaluate both the maximum ensemble-mean core intensity and the quasi-steady period around the core intensity period later in the simulations, consistent with “core steady-state (CS)” in the nomenclature of Rousseau-Rizzi et al. (2021). The core intensity roughly corresponds to the LMI.
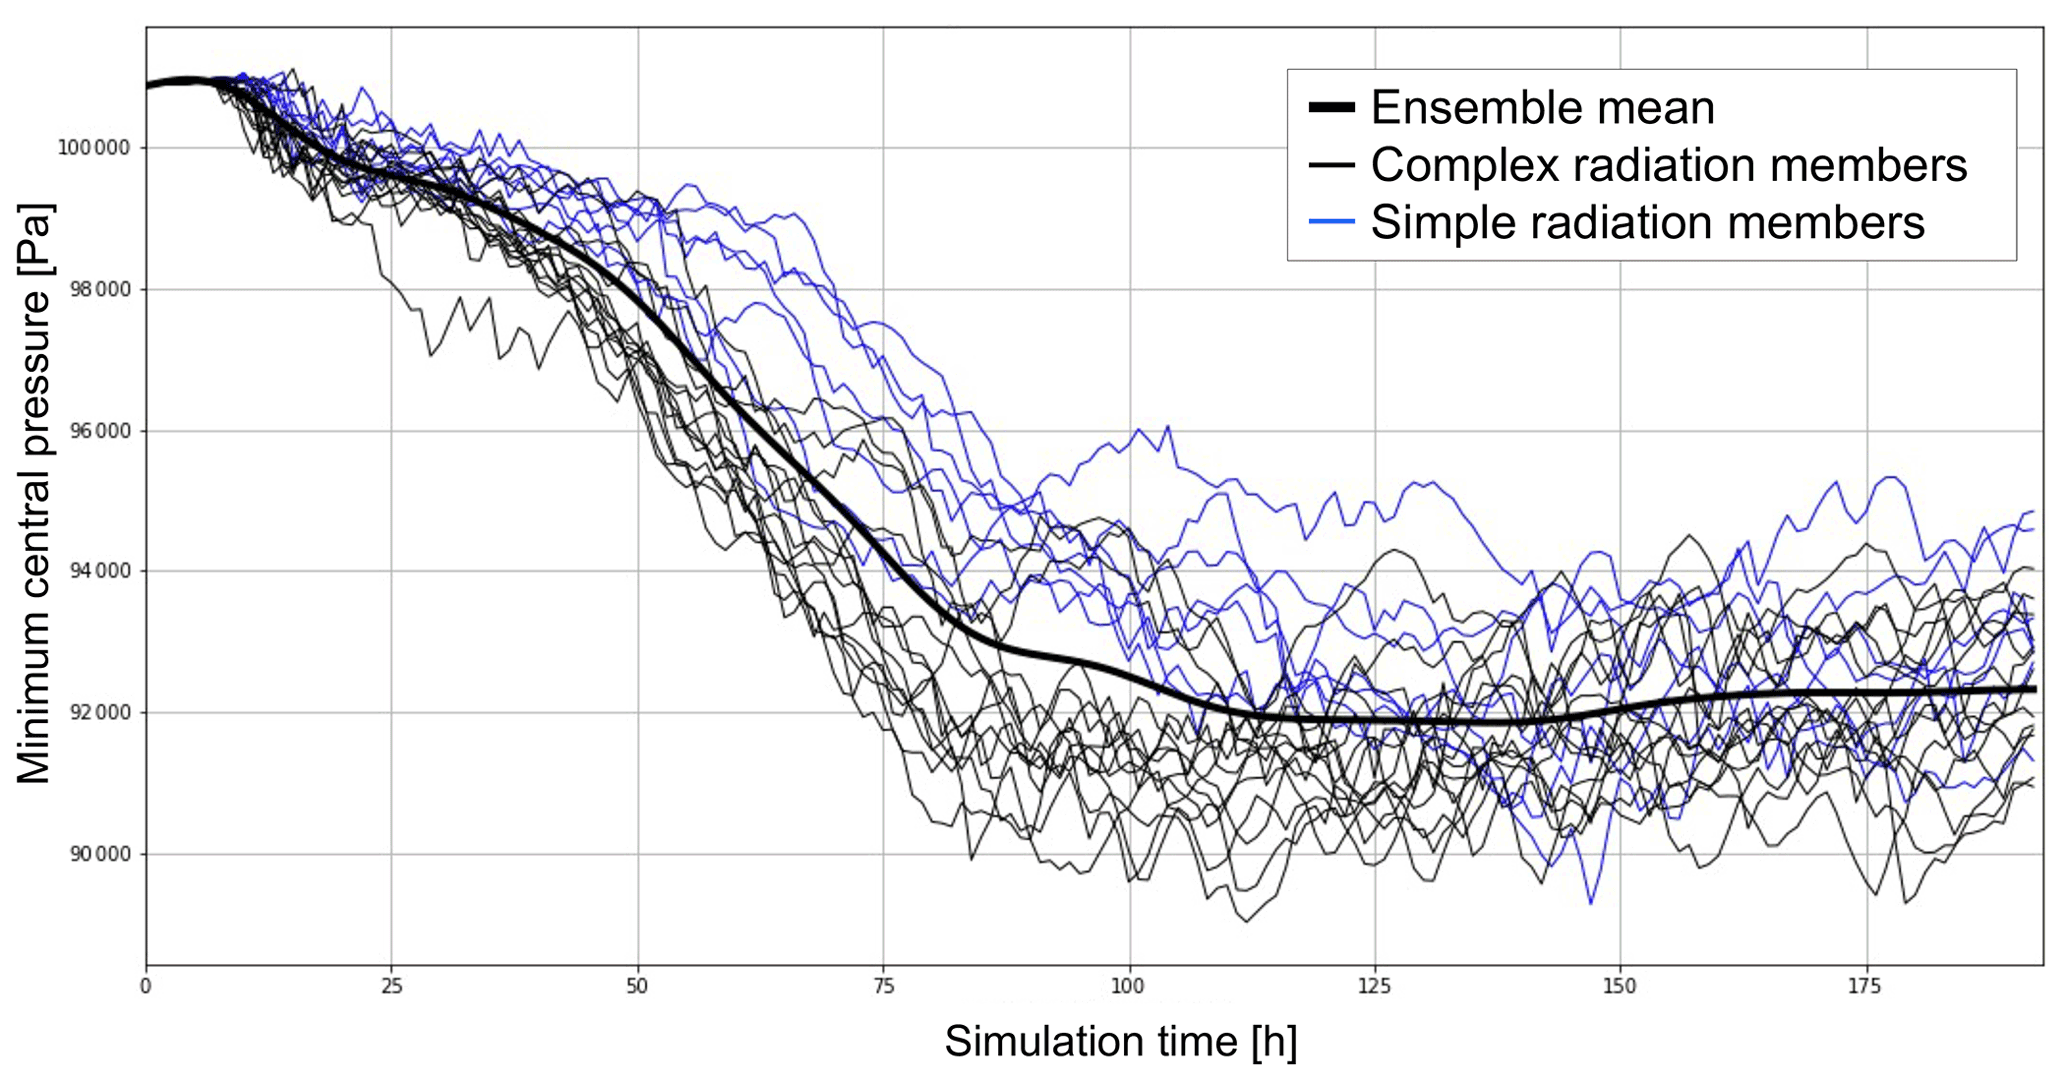
Figure 5CM1 time series of axisymmetric TC minimum central pressure (Pa) for the default present-day ensemble based on the Dunion moist tropical sounding, distinguishing ensemble members with complex (black) and simple radiation (blue).
For the additional experiments, time series of ensemble-mean maximum near-surface wind speed and minimum central pressure sort out precisely as expected based on theoretical predictions: the present-day simulation features the weakest ensemble-mean TC, while the end-of-century simulations are all stronger, with the mid-century ensemble falling in between (Fig. 6, Table 2). This overall trend matches the E-PI calculations in a relative sense (Table 2). One notable difference is the removal of the stratospheric cooling, which had no impact on E-PI but weakened the simulated storm slightly. The GCM-modified end-of-century environment yields the greatest intensity, with filtered ensemble-mean Pmin values approaching 900 hPa in the complex-radiation ensemble subset (Fig. 6a). This is consistent with the fact that future changes under the CMIP5 RCP8.5 scenario exceed that due to extrapolation of current observed trends (compare purple and red curves in Fig. 6a and b and abscissa values in Fig. 1b and c). In all simulations, the ensemble-mean Pmin values were lower than the E-PI calculations. Note that there is uncertainty in the E-PI calculation owing to several choices in parameter settings, as is the case with the CM1 model. But perhaps the greatest discrepancy arises from our calculation of E-PI at the initial time, leading to possible differences in the E-PI-calculated outflow and the realised outflow temperature in our simulations.
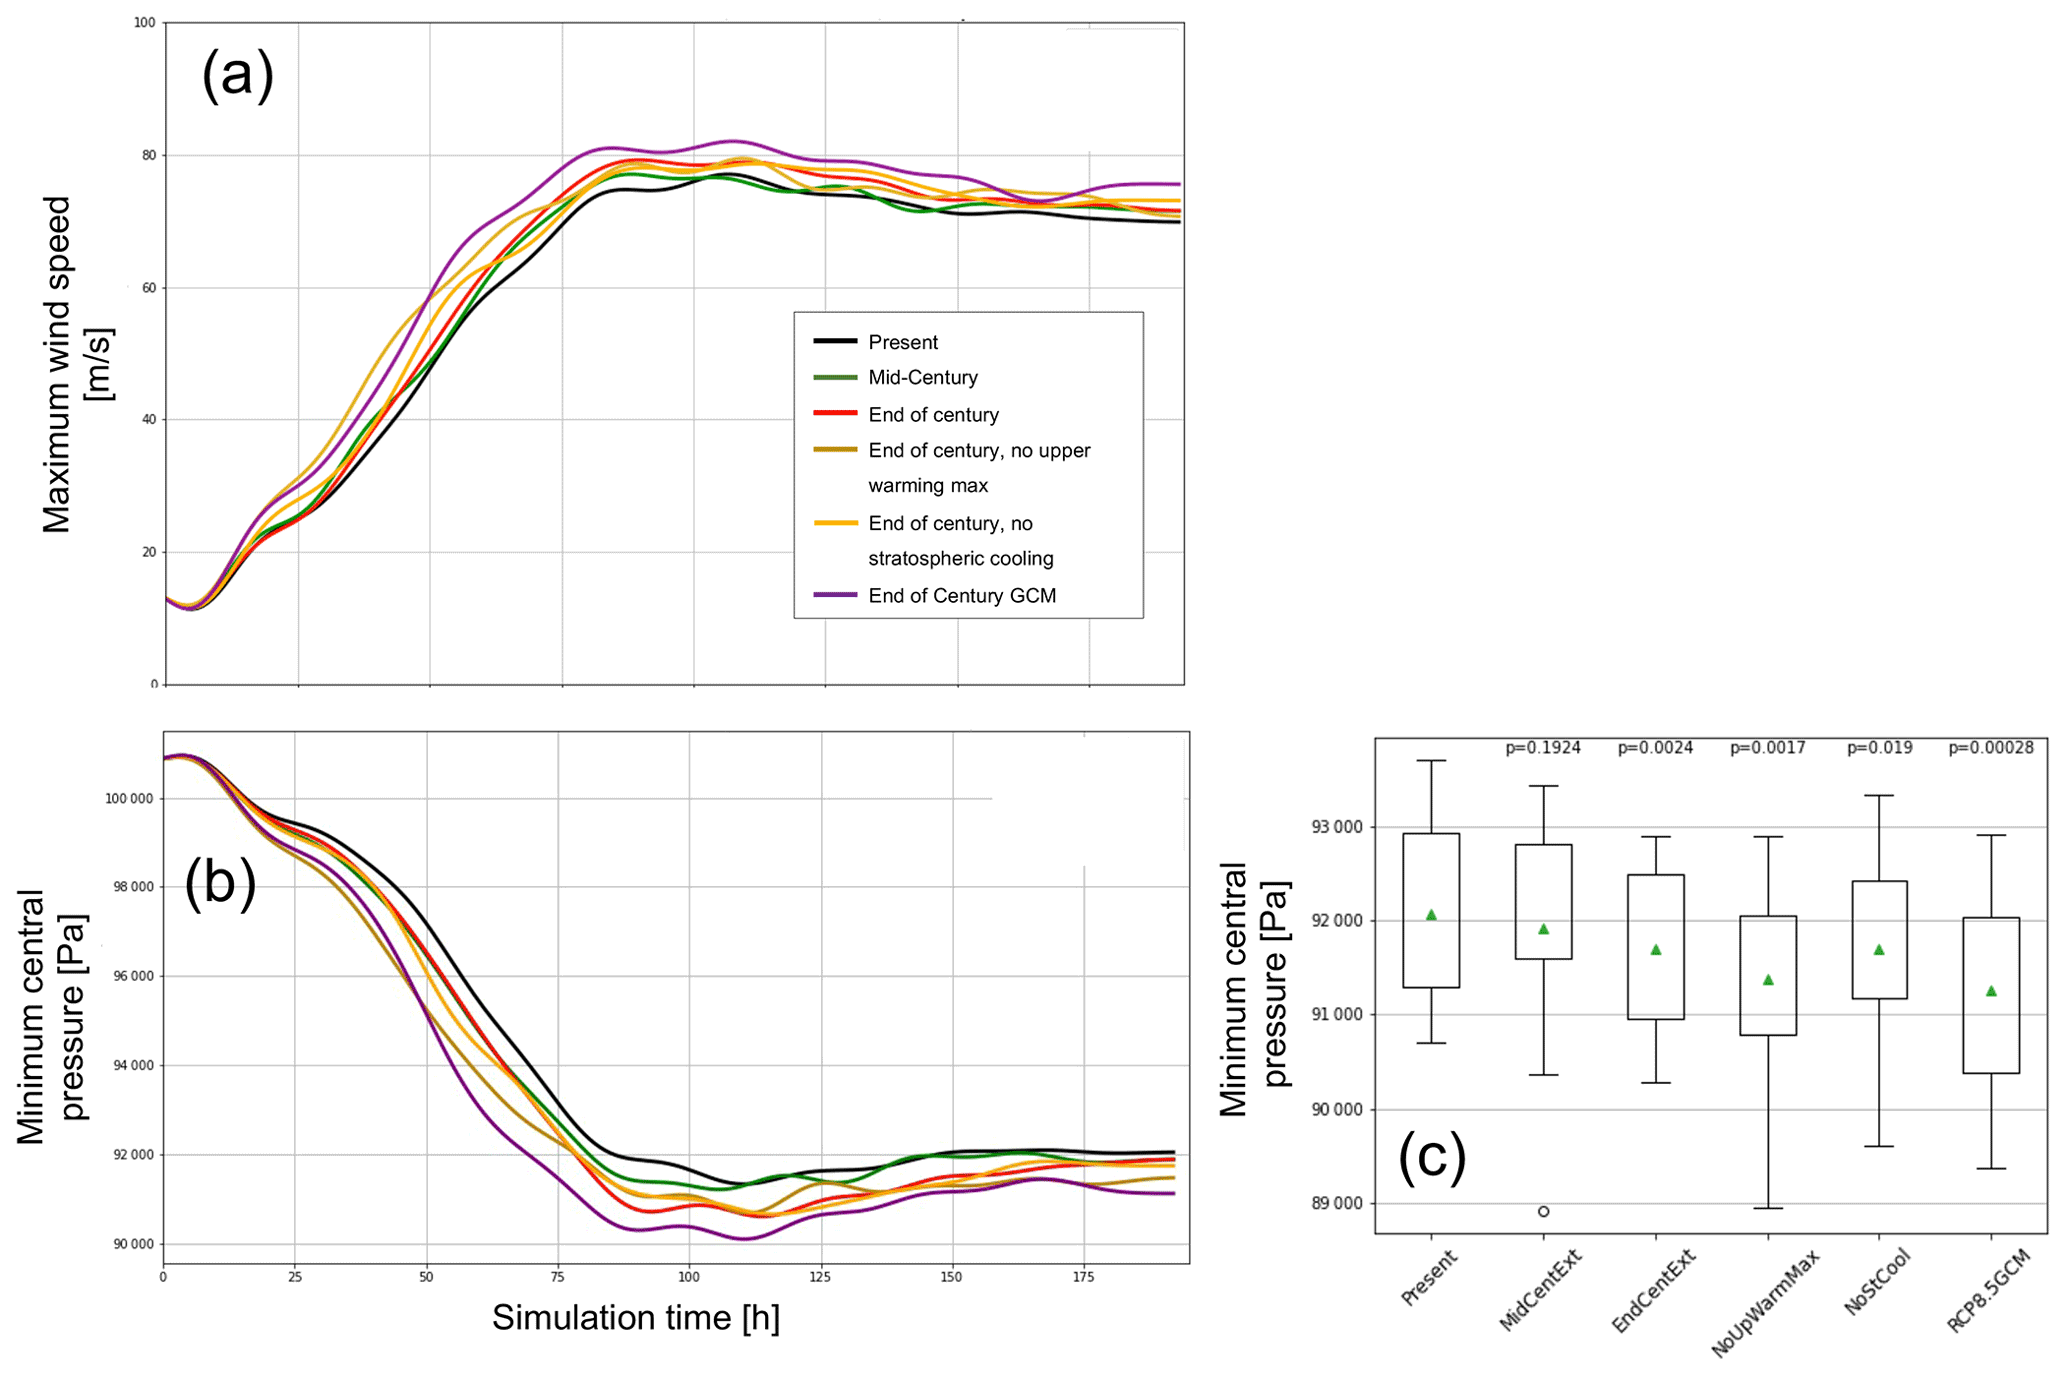
Figure 6Time series of CM1 ensemble-mean (a) maximum wind speed (m s−1) and (b) minimum sea level pressure (Pa) for present-day simulations with complex-radiation parameterisation. Experiments as indicated in the legend in panel (a). Ensemble-mean time series have been smoothed with a Butterworth filter to remove high-frequency fluctuations. (c) Box plot showing the distribution of average CS period minimum central pressure over the 13 complex-radiation ensemble members. Mean values are shown as green triangles; p values are from a Wilcoxon paired rank-sum test shown at the top for each experiment versus the present climate.
Each ensemble experiment exhibits considerable variability, and the ensemble standard deviations are generally larger than the differences in the ensemble mean between the experiments (Fig. 6b, Table 2). That the relative ranking of the experimental ensemble-mean intensity matches expectation from theory is notable, but the large ensemble variability provides context regarding statistical robustness, or lack thereof. We refrain from a dichotomous declaration of “statistically significant” or not (e.g. Amrhein et al., 2019; Wasserstein et al., 2019). Yet, an inspection of the individual ensemble experiments demonstrates that the relative intensity of the different ensemble members exhibits considerable consistency, motivating the use of a Wilcoxon signed-rank test (Wilcoxon, 1945), appropriate for paired samples (Fig. 6c). Except for the mid-century experiment, small p values relative to the present-day simulation provide more confidence in the significance of the results relative to what comparison to the overall ensemble mean suggests (top labels in Fig. 6c). Comparison of the end-of-century with the no-upper-warming ensemble yields a signed-rank p value of 0.13, and comparison with the no-stratospheric-cooling ensemble yields a p value of 0.29 (not shown).
While the smoothed, ensemble-mean changes are highly consistent with theoretical expectations, neither the changes predicted by E-PI theory nor those resulting from the numerical simulations are dramatic in terms of Pmin. For extrapolations of current RAOBCORE trends, the end-of-century ensemble mean is characterised by Pmin values that are approximately 10 hPa lower than for the present-day ensemble. That is not to say that these intensity increases are insignificant, however. Changes in the GCM-modified environment under the RCP8.5 scenario exhibit the strongest changes in ensemble-mean Pmin, approximately 12 hPa lower. The strengthening seen in the extrapolated RAOBCORE experiments is consistent with that reported for a 2 K change by Knutson et al. (2020), while the GCM experiment change, accompanied by an SST warming over 3 K, is somewhat less than what would be anticipated from the Knutson et al. (2020) review.
The consistency between the CM1 simulation results and the theoretical E-PI intensity calculations suggests that the interpretation of the simulated TC responses to environmental change is consistent with the concept of a Carnot heat engine (e.g. Emanuel, 1988, 1991). Because we use Pmin to measure storm intensity, we are not concerned with supergradient wind speeds as analysed by Rousseau-Rizzi and Emanuel (2019), Hakim (2011), and Smith et al. (2008). Our hypothesis in this analysis is that in the quiescent (un-sheared) axisymmetric CM1 environment, the TC response to changes in environmental temperature will be consistent with PI theory and the concept of thermodynamic engines. These idealised simulations provide an estimate of the expected effect of such changes on TC characteristics, allowing us to relate the simulation responses to the observational TC statistics presented in Sect. 3.1.
To understand comparisons between our simulated TC intensity and E-PI changes, we compute thermodynamic efficiency and thermodynamic disequilibrium changes in our simulations. As stated earlier, the square of PI is proportional to the product of the thermodynamic efficiency and the thermodynamic disequilibrium (Eq. 1 in Gilford et al., 2017). We therefore examine whether changes in our simulated intensity () are proportional to simulated changes in the product of thermodynamic efficiency and the thermodynamic disequilibrium. But first, we compare relative changes in the thermodynamic efficiency and thermodynamic disequilibrium terms themselves.
We compute the temperature of cloudy, outflowing air in the upper troposphere for each ensemble member in each experiment and use this information in conjunction with SST to compute the thermodynamic efficiency (see Sect. 2.2) according to Eq. (1):
Thermodynamic disequilibrium is computed as the difference between the saturation moist static energy at the sea surface and a near-surface value of moist static energy. It is calculated at the initial time, whereas efficiency is calculated for the CS period.
First, we examine changes in outflow temperature and pressure. The outflow temperature is remarkably similar between the different experiments (Table 3) despite varying outflow pressures. While the warmest outflow is in the GCM-modified experiment, as expected, this does not reach statistical significance. The similarity in outflow temperatures is consistent with the fixed anvil temperature (FAT) hypothesis (Hartmann and Larson, 2002), which argues that the environmental cooling rate is largely governed by temperature. This follows from the saturation vapour pressure dependence on temperature via the Clausius–Clapeyron relation. The temperature at which cooling rates rapidly decrease with height (and therefore also the temperature of the outflow) should remain approximately constant. Surface warming, therefore, raises the altitude of the outflow but has less effect on outflow temperature. In agreement, we find that the average pressure altitude of the outflow exhibits considerable difference among the experiments, with the present-day ensemble showing the lowest outflow altitude and the GCM experiment the highest (∼190 hPa, Table 3). Although the differences are small relative to the ensemble standard deviation, the no-stratospheric-cooling and no-upper-warming-maximum experiments exhibit the expected changes in outflow pressure. The FAT hypothesis could be contributing to the small changes in efficiency in our experiments with modified upper-level stratification. Interestingly, the average outflow pressure generally reflects an altitude above the upper warming maximum, especially for the stronger TCs in the GCM ensemble.
Table 3Ensemble-mean thermodynamic disequilibrium, outflow temperature, outflow pressure, and thermodynamic efficiency computations for the 13-member complex-radiation ensemble subset; radial wind threshold of 1.0 m s−1 and cloud ice threshold of 10−5 kg kg−1. Ensemble standard deviation (SD) is shown for outflow temperature and pressure. Disequilibrium (defined as the difference between the saturation moist static energy at the sea surface and a near-surface value of moist static energy) is calculated at the initial time, and all other values apply to the CS time window of the simulations, hours 150 to 192.
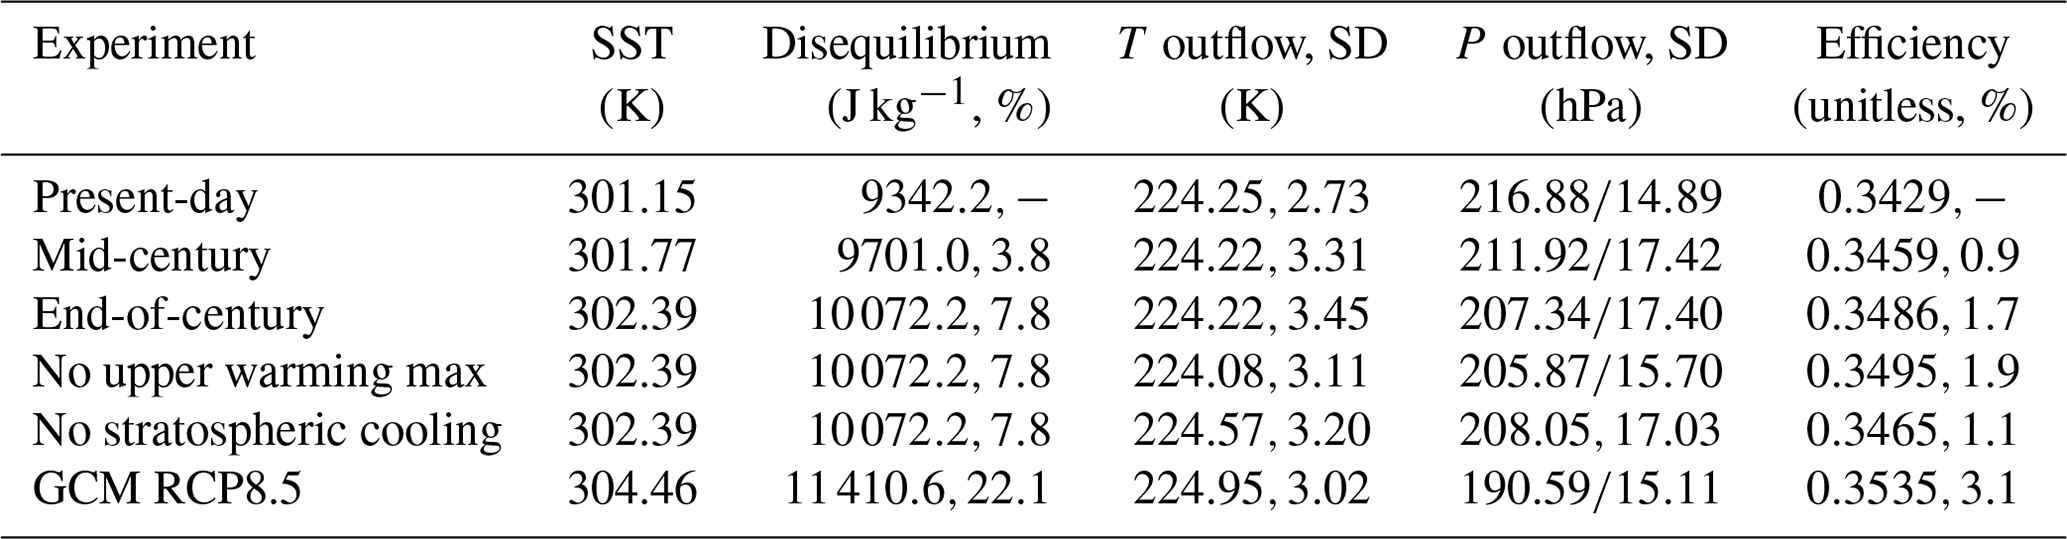
For the GCM experiment, the slightly warmer outflow temperature is more than compensated by the increased SST, resulting in the greatest thermodynamic efficiency among the experiments. The GCM experiment also produces the lowest Pmin (Table 2). The numerical simulation experiments ranked by intensity match exactly the ranking in thermodynamic efficiency (Tables 2 and 3). However, differences in thermodynamic efficiency between the ensemble members are small in magnitude, and relative changes in thermodynamic disequilibrium with increased SST are much larger. Percent changes in disequilibrium relative to the default run are +3.8 % for the mid-century run, +7.8 % for the end-of-century runs (including the no-upper-warming and no-stratospheric-cooling runs), and +22.1 % for the GCM RCP8.5 run. Upper-level changes have no impact on disequilibrium in our modelling. Percent changes in efficiency are much less, at +0.9 % for the mid-century run, +1.7 % for the end-of-century runs, and +3.1 % for the GCM RCP8.5 run. In contrast to disequilibrium, efficiency does change a little with upper-level changes, but changes remain small. The lack of change in efficiency is related to the nearly constant TC outflow temperatures between our experiments.
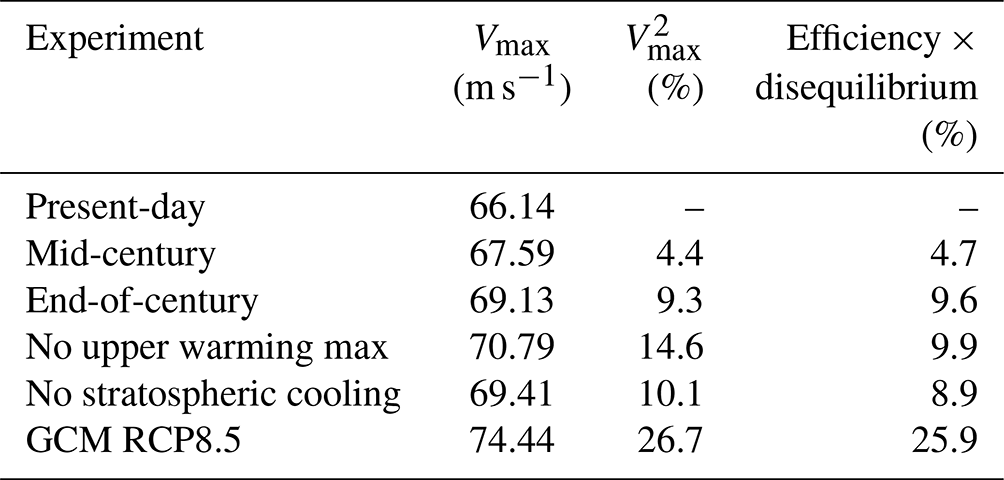
Having established the dominance of thermodynamic disequilibrium over thermodynamic equilibrium in driving PI, we now examine how close our simulated intensity behaviour is to theoretical expectations. Specifically, we quantify whether our simulated intensity changes are proportional to changes in the product of thermodynamic disequilibrium and thermodynamic equilibrium. Quantitative comparisons are challenging given the differing absolute changes, but we do so here using percent changes (as also used in Gilford et al., 2017). Table 4 shows close agreement between percent changes in the square of the realised intensity and percent changes in the product of efficiency and disequilibrium. This indicates that PI theory explains much of the TC responses to changes in environmental temperature. However, there are notable discrepancies in the experiments with changed upper-level stratification. Possible explanations for the discrepancies are discussed in the next section.
Table 4Maximum intensity (Vmax) and percent changes on the left-hand side () and right-hand side (efficiency × disequilibrium) of Eq. (1) in Gilford et al. (2017) as simulated by the complex-radiation ensemble experiments. All values are for time-filtered time series and represent the core steady-state (CS) period except for disequilibrium, which is calculated at the initial time.
In a quiescent environment, theory indicates that TC intensities should exhibit considerable sensitivity to changes in near-surface temperatures and upper-level stratification (Emanuel, 1991; Kieu and Zhang, 2018; Tao et al., 2020). In this paper, we explore whether observed environmental temperature changes are sufficient to explain observed trends in the TC intensity distribution, to improve the understanding and interpretation of observed and emerging trends in the TC intensity distribution. To do so we worked to isolate and quantify the response of TC intensity to observed trends in environmental temperature using a combination of historical data analysis and idealised numerical modelling. While our choice of axisymmetric modelling misses potentially important TC asymmetries, such models are useful tools to begin to link theory and observations.
Our historical data analysis focused on global scales spanning 4 decades to emphasise the scales where thermodynamic change is large, and circulation change is minimised. Tropical-storm-strength intensities show no temporal trend and have therefore not kept pace with rising PI. Hurricane-strength storms, however, exhibit significant temporal trends that reach super-PI rates for some intensity quantiles. Storms at these quantiles have therefore closed the gap between realised and maximum potential intensity. The larger trends in the more intense storms are consistent with our finding that hurricane environments have warmed faster than the tropical mean environment. The faster warming is most apparent in the lower troposphere and is likely driven by faster SST warming.
The differing trends in TC environments compared to the tropical mean environment have implications for climate change studies that use “storyline” or “pseudo global warming (PGW)” methods. These methods typically apply a long time-average change from GCMs to reanalysis conditions and use those high-resolution conditions to drive regional model simulations of historical and future weather events (e.g. Hazeleger et al., 2015; Lackmann, 2015; Gutmann et al., 2018; Shepherd, 2019). TCs may respond differently to environmental change more representative of that taking place locally within TC environments.
In changing our frame of reference from time to temperature, we again found markedly different sensitivities between tropical storms and hurricane-strength storms. Hurricane-strength storms intensified at up to 4 times the rate of tropical storms per unit increase in surface and upper-tropospheric temperature. The response of storms within environments of lower-stratospheric cooling was mixed and did not reach statistical significance. However, our global scale of analysis may miss basin-specific sensitivities arising from the differing TC outflow layer heights relative to the tropopause (Gilford et al., 2017). SST and outflow are strongly linked when the outflow is confined to the troposphere, but there is greater potential for larger efficiency changes when the outflow extends above the tropopause. In addition, the differing trend magnitudes among commonly used historical temperature and TC intensity datasets challenge our ability to understand relationships using historical data alone.
We then turned to idealised modelling to further isolate, quantify, and understand the effects of near-surface temperature and upper-level stratification change on TC intensity and to interpret the empirical statistics. Idealised TC simulations responded in the expected sense to various imposed changes in environmental temperatures and generally agree with TCs operating as heat engines. We found close agreement between percent changes in the square of the realised intensity in our simulations and percent changes in the product of efficiency and disequilibrium. This indicates that PI theory explains much of the TC responses to changes in environmental temperature. Removing upper-tropospheric warming or stratospheric cooling from the end-of-century experiment resulted in much smaller changes in E-PI or realised intensity than between present day and the end of the century. The larger proportional change in thermodynamic disequilibrium compared to thermodynamic efficiency in our experiments (in agreement with Rousseau-Rizzi and Emanuel, 2021) also suggests that disequilibrium, not efficiency, is responsible for the intensity increase from present day to the end of the century in our simulations. Possible explanations for residual differences between realised intensity change and PI change include (i) necessary differences in the timing of the efficiency and disequilibrium computations, (ii) limitations to the model related to axisymmetry and parameterisations, and (iii) assumptions in the E-PI algorithm.
The weak influence of lower-stratospheric cooling on TC intensity in our simulations and our observational analysis is consistent with the GCM study by Vecchi et al. (2013). However, axisymmetric simulations out of radiative–convective equilibrium by Ramsay (2013) showed stronger vortex intensity with stronger imposed lower-stratospheric cooling rates. This was despite much of the outflow being confined to the upper troposphere. We agree with Ramsay (2013) and Ferrara et al. (2017) that it is challenging to reconcile contrasting results across different models with different parameter settings and analysis procedures and across studies using limited historical datasets.
Analysis of TC outflow found little change in the outflow temperature but a rising mean pressure outflow altitude that is located above the altitude of peak upper-tropospheric warming. The near constancy of outflow temperatures limited thermodynamic efficiency changes with surface warming, and upper-level temperature change mattered less than we originally thought. The FAT hypothesis appears to explain our findings well and would limit thermodynamic efficiency change under changed upper-level stratification. Further work is needed to understand, at a process level, the extent of applicability of the FAT hypothesis for TCs. For tropical convection it has support from observational analysis (Xu et al., 2007) and convection-resolving idealised numerical simulations (Kuang and Hartmann, 2007). Some additional supporting evidence for a FAT for TCs is provided by idealised cloud-resolving modelling (Khairoutdinov and Emanuel, 2013) and by analysis of TC cloud top temperatures in ADT-HURSAT data (Kossin, 2015). However, detecting trends in TC cloud top temperatures is complicated by a poleward trend in the latitude of LMI (Kossin, 2015).
Increasing thermodynamic disequilibrium with warming may also explain the fastest temporal trends in intensity for the middle LMI quantiles. With warming, middle-LMI-quantile TCs are closing the gap with PI. The strongest storms, however, were already close to their PI, and weaker storms are more strongly limited by other environmental factors such as shear or dry air. Techniques to simulate weaker storms within the idealised modelling framework are needed to test this hypothesis.
The magnitude of the simulated changes, even for extrapolated trends, is relatively small compared to observed trends in TC characteristics. This suggests that environmental temperature changes contributed to some of the observed TC intensity change but that other environmental factors dominated as the root causes, including, for example, changes in vertical wind shear, humidity, incipient disturbances, or internal asymmetries.
Extrapolated observational temperature trends resulted in weaker TC intensity trends relative to change profiles based on an ensemble of CMIP5 GCMs under the RCP8.5 emission scenario. Future extensions of this work could omit the GCM-based tropical upper warming maximum or stratospheric cooling to determine whether a more substantial change results relative to these exercises with the extrapolated observations. The use of CMIP6 trends would also be informative. Future work could also start from a different base sounding other than the Dunion (2011) North Atlantic moist tropical sounding. It is possible that different magnitude sensitivities between the historical data analysis and the idealised simulations could be due, in part, to our use of this single profile that allows all simulated storms to reach the highest observed intensities. Base soundings representative of the observed tropical storm and hurricane-strength storm environments may yield more nuanced sensitivity to environmental temperature change, given permitted variations in outflow altitude. Future work should also include tests with fully three-dimensional TC simulations; such simulations would include the effects of potentially important internal asymmetries and also allow examination of changes in intensification rate and timing. Finally, more comprehensive physical process studies are needed to interpret the empirical and idealised modelling findings reported here and work towards untangling the factors driving observed intensity changes.
Table A1Description of name list settings for axisymmetric CM1 ensemble simulations.
The pyPI Python software package, developed by Daniel Gilford, is available from https://doi.org/10.5281/zenodo.3985975 (Gilford, 2020).
The ECMWF reanalysis datasets are available at (https://apps.ecmwf.int/datasets/, last access: 22 June 2022; European Centre for Medium-Range Weather Forecasts, 2009, https://doi.org/10.5065/D6CR5RD9; European Centre for Medium-Range Weather Forecasts, 2019, https://doi.org/10.5065/BH6N-5N20; European Centre for Medium-Range Weather Forecasts, 2020, https://doi.org/10.5065/CBTN-V814). The results contain modified Copernicus Climate Change Service information 2020. Neither the European Commission nor ECMWF is responsible for any use that may be made of the Copernicus information or data it contains. IBTrACS data are available from NOAA (https://www.ncdc.noaa.gov/ibtracs/, last access: 22 June 2022; Knapp et al., 2010, https://doi.org/10.1175/2009BAMS2755.1). ADT-HURSAT data are available in the supporting information of Kossin et al. (2020, https://doi.org/10.1073/pnas.1920849117). RAOBCORE data are available at https://www.univie.ac.at/theoret-met/research/raobcore/ (last access: 22 June 2022; Haimberger, 2007, https://doi.org/10.1175/JCLI4050.1). CMIP5 model output was obtained from the Program for Climate Model Diagnosis and Intercomparison (PCMDI). The pyPI software used for the E-PI calculations are available from Gilford (2021, https://doi.org/10.5194/gmd-14-2351-2021). R code for the quantile regression modelling presented in Fig. 4 is available at from Elsner and Jagger (2013, https://doi.org/10.1093/oso/9780199827633.001.0001). The CM1 axisymmetric TC model is available from https://www2.mmm.ucar.edu/people/bryan/cm1/ (last access: 22 June 2022; Bryan and Fritsch, 2002, https://doi.org/10.1175/1520-0493(2002)130<2917:ABSFMN>2.0.CO;2).
JMD, GML, and AFP designed the analysis and experiments and carried them out. JMD and GML prepared the manuscript with contributions from AFP.
The contact author has declared that neither they nor their co-authors have any competing interests.
Publisher’s note: Copernicus Publications remains neutral with regard to jurisdictional claims in published maps and institutional affiliations.
GML was partially supported by the National Center for Atmospheric Research (NCAR)/MMM Visitor Program. We would like to acknowledge data support and high-performance computing support from Cheyenne (https://doi.org/10.5065/D6RX99HX) provided by the NCAR's Computational and Information Systems Laboratory, sponsored by the National Science Foundation. This material is based upon work supported by the NCAR; the NCAR is a major facility sponsored by the National Science Foundation (NSF) under cooperative agreement 1852977. Raphaël Rousseau-Rizzi and an anonymous reviewer provided exceptionally constructive reviews of the initial version of this paper. We are grateful to the NCAR's George Bryan for developing and maintaining the CM1 model and Daniel Gilford for the pyPI software used for the E-PI calculations presented in Table 2. We thank the NCAR's Chris Davis for suggestions that improved the manuscript.
This research has been supported by the Willis Research Network and the National Science Foundation (NSF; grant nos. AGS-1546743 and 1852977).
This paper was edited by Nili Harnik and reviewed by Raphael Rousseau-Rizzi and one anonymous referee.
Alland, J. J., Tang, B H., Corbosiero, K. L., and Bryan, G. H.: Synergistic effects of midlevel dry air and vertical wind shear on tropical cyclone development. Part I: Downdraft ventilation, J. Atmos. Sci., 78, 763–782, https://doi.org/10.1175/JAS-D-20-0054.1, 2021a
Alland, J. J., Tang, B. H., Corbosiero, K. L., and Bryan, G. H.: Combined effects of midlevel dry air and vertical wind shear on tropical cyclone development. Part II: Radial ventilation, J. Atmos. Sci., 78, 783–796, https://doi.org/10.1175/JAS-D-20-0055.1, 2021b.
Allen, M. R. and Ingram, W. J.: Constraints on future changes in climate and the hydrologic cycle, Nature, 419, 224–232, https://doi.org/10.1038/nature01092, 2002.
Alvey III, G. R., Zipser, E., and Zawislak, J.: How does Hurricane Edouard (2014) evolve toward symmetry before rapid intensification? A high-resolution ensemble study, J. Atmos. Sci., 77, 1329–1351, https://doi.org/10.1175/JAS-D-18-0355.1, 2020.
Amrhein, V., Greenland, S., and McShane, B.: Scientists rise up against statistical significance, Nature, 567, 305–307, https://doi.org/10.1038/d41586-019-00857-9, 2019.
Bister, M. and Emanuel, K. A.: Dissipative heating and hurricane intensity, Meteorol. Atmos. Phys., 65, 233–240, https://doi.org/10.1007/BF01030791, 1998.
Bryan, G. H.: Effects of surface exchange coefficients and turbulence length scales on the intensity and structure of numerically simulated hurricanes, Mon. Weather Rev., 140, 1125–1143, https://doi.org/10.1175/MWR-D-11-00231.1, 2012.
Bryan, G. H. and Fritsch, J. M.: A benchmark simulation for moist nonhydrostatic numerical models, Mon. Weather Rev., 130, 2917–2928, https://doi.org/10.1175/1520-0493(2002)130<2917:ABSFMN>2.0.CO;2, 2002 (code available at: https://www2.mmm.ucar.edu/people/bryan/cm1/, last access: 22 June 2022).
Bryan, G. H. and Rotunno, R.: The maximum intensity of tropical cyclones in axisymmetric numerical model simulations, Mon. Weather Rev., 137, 1770–1789, https://doi.org/10.1175/2008MWR2709.1, 2009a.
Bryan, G. H. and Rotunno, R.: Evaluation of an analytical model for the maximum intensity of tropical cyclones, J. Atmos. Sci., 66, 3042–3060, https://doi.org/10.1175/2009JAS3038.1, 2009b.
Butchart, N.: The Brewer-Dobson circulation, Rev. Geophys., 52, 157–184, https://doi.org/10.1002/2013RG000448, 2014.
Cordero, E. C. and Forster, P. M. D. F.: Stratospheric variability and trends in models used for the IPCC AR4, Atmos. Chem. Phys., 6, 5369–5380, https://doi.org/10.5194/acp-6-5369-2006, 2006.
Dai, A.: Recent climatology, variability, and trends in global surface humidity, J. Climate, 19, 2589–3606, https://doi.org/10.1175/JCLI3816.1, 2006.
Dee, D. P., Uppala, S. M., Simmons, A. J., Berrisford, P., Poli, P., Kobayashi, S., Andrae, U., Balmaseda, M. A., Balsamo, G., Bauer, D. P., and Bechtold, P.: The ERA-Interim reanalysis: Configuration and performance of the data assimilation system, Q. J. Roy. Meteor. Soc., 137, 553–597, https://doi.org/10.1002/qj.828, 2011.
Deser, C., Knutti, R., Solomon, S., and Phillips, A. S.: Communication of the role of natural variability in future North American climate, Nat. Clim. Change, 2, 775–779, https://doi.org/10.1038/nclimate1562, 2012.
Dunion, J. P.: Rewriting the climatology of the tropical North Atlantic and Caribbean Sea atmosphere, J. Climate, 24, 893–908, https://doi.org/10.1175/2010JCLI3496.1, 2011.
Durre, I., Vose, R. S., and Wuertz, D. B.: Overview of the integrated global radiosonde archive, J. Climate, 19, 53–68, https://doi.org/10.1175/JCLI3594.1, 2006.
Elsner, J. B. and Jagger, T. H.: Hurricane climatology: a modern statistical guide using R, Oxford University Press, https://doi.org/10.1093/oso/9780199827633.001.0001, 2013.
Elsner, J. B., Kossin, J. P., and Jagger, T. H.: The increasing intensity of the strongest tropical cyclones, Nature, 455, 92–95, https://doi.org/10.1038/nature07234, 2008.
Emanuel, K. A.: An air-sea interaction theory for tropical cyclones. Part I: Steady-state maintenance, J. Atmos. Sci., 43, 585–604, https://doi.org/10.1175/1520-0469(1986)043<0585:AASITF>2.0.CO;2, 1986.
Emanuel, K. A.: The dependence of hurricane intensity on climate, Nature, 326, 483–485, https://doi.org/10.1038/326483a0, 1987.
Emanuel, K. A.: The maximum intensity of hurricanes, J. Atmos. Sci., 45, 1143–1155, https://doi.org/10.1175/1520-0469(1988)045<1143:TMIOH>2.0.CO;2, 1988.
Emanuel, K. A.: The theory of hurricanes, Annu. Rev. Fluid Mech., 23, 179–196, https://doi.org/10.1146/annurev.fl.23.010191.001143, 1991.
Emanuel, K. A.: Hurricanes: Tempests in a greenhouse, Phys. Today, 59, 74–75, https://doi.org/10.1063/1.2349743, 2006.
Emanuel, K. A.: Atlantic tropical cyclones downscaled from climate reanalyses show increasing activity over past 150 years, Nat. Commun., 12, 1–8, https://doi.org/10.1038/s41467-021-27364-8, 2021.
Emanuel, K. A., Solomon, S., Folini, D., Davis, S., and Cagnazzo, C.: Influence of tropical tropopause layer cooling on Atlantic hurricane activity, J. Climate, 26, 2288–2301, https://doi.org/10.1175/JCLI-D-12-00242.1, 2013.
European Centre for Medium-Range Weather Forecasts: ERA-Interim Project. Research Data Archive at the National Center for Atmospheric Research, Computational and Information Systems Laboratory [data set], Boulder, CO, https://doi.org/10.5065/D6CR5RD9, 2009 (data available at: https://apps.ecmwf.int/datasets/, last access: 22 June 2022).
European Centre for Medium-Range Weather Forecasts: ERA5 Reanalysis (0.25 Degree Latitude-Longitude Grid). Research Data Archive at the National Center for Atmospheric Research, Computational and Information Systems Laboratory [data set], Boulder, CO, https://doi.org/10.5065/BH6N-5N20, 2019 (data available at: https://apps.ecmwf.int/datasets/, last access: 22 June 2022).
European Centre for Medium-Range Weather Forecasts: ERA5.1: Corrections to ERA5 Stratospheric Temperature 2000-2006. Research Data Archive at the National Center for Atmospheric Research, Computational and Information Systems Laboratory [data set], Boulder, CO, https://doi.org/10.5065/CBTN-V814, 2020 (data available at: https://apps.ecmwf.int/datasets/, last access: 22 June 2022).
Ferrara, M., Groff, F., Moon, Z., Keshavamurthy, K., Robeson, S. M., and Kieu, C.: Large-scale control of the lower stratosphere on variability of tropical cyclone intensity, Geophys. Res. Lett., 44, 4313–4323, https://doi.org/10.1002/2017GL073327, 2017.
Fujiwara, M., Hibino, T., Mehta, S. K., Gray, L., Mitchell, D., and Anstey, J.: Global temperature response to the major volcanic eruptions in multiple reanalysis data sets, Atmos. Chem. Phys., 15, 13507–13518, https://doi.org/10.5194/acp-15-13507-2015, 2015.
Gentry, M. S. and Lackmann, G. M.: Sensitivity of simulated tropical cyclone structure and intensity to horizontal resolution, Mon. Weather Rev., 138, 688–704, https://doi.org/10.1175/2009MWR2976.1, 2010.
Gettelman, A., Hegglin, M. I., Son, S.-W., Kim, J., Fujiwara, M., Birner, T., Kremser, S., Rex, M., Añel, J. A., Akiyoshi, H., Austin, J., Bekki, S., Braesike, P., Brühl, C., Butchart, N., Chipperfield, M., Dameris, M., Dhomse, S., Garny, H., Hardiman, S. C., Jöckel, P., Kinnison, D. E., Lamarque, J. F., Mancini, E., Marchand, M., Michou, M., Morgenstern, O., Pawson, S., Pitari, G., Plummer, D., Pyle, J. A., Rozanov, E., Scinocca, J., Shepherd, T. G., Shibata, K., Smale, D., Teyssèdre, H., and Tian, W.: Multimodel assessment of the upper troposphere and lower stratosphere: Tropics and global trends, J. Geophys. Res., 115, D00M08, https://doi.org/10.1029/2009JD013638, 2010.
Gilford, D.: dgilford/pyPI: pyPI v1.3 (initial package release), Version v1.3, Zenodo [code], https://doi.org/10.5281/zenodo.3985975, 2020.
Gilford, D. M.: pyPI (v1.3): Tropical Cyclone Potential Intensity Calculations in Python, Geosci. Model Dev., 14, 2351–2369, https://doi.org/10.5194/gmd-14-2351-2021, 2021.
Gilford, E. M., Solomon, S., and Emanuel, K. A.: On the seasonal cycles of tropical cyclone potential intensity, J. Climate, 30, 6085–6096, 2017.
Gutmann, E. D., Rasmussen, R. M., Liu, C., Ikeda, K., Bruyere, C. L., Done, J. M., Garrè, L., Friis-Hansen, P., and Veldore, V.: Changes in hurricanes from a 13-yr convection-permitting pseudo–global warming simulation, J. Climate, 31, 3643–3657, https://doi.org/10.1175/JCLI-D-17-0391.1, 2018.
Haimberger, L.: Homogenization of radiosonde temperature time series using innovation statistics, J. Climate, 20, 1377–1403, https://doi.org/10.1175/JCLI4050.1, 2007 (data available at: https://www.univie.ac.at/theoret-met/research/raobcore/, last access: 22 June 2022).
Haimberger, L., Tavolato, C., and Sperka, S.: Toward elimination of the warm bias in historic radiosonde temperature records – Some new results from a comprehensive intercomparison of upper-air data, J. Climate, 21, 4587–4606, https://doi.org/10.1175/2008JCLI1929.1, 2008.
Haimberger, L., Tavolato, C., and Sperka, S.: Homogenization of the global radiosonde temperature dataset through combined comparison with reanalysis background series and neighboring stations, J. Climate, 25, 8108–8131, https://doi.org/10.1175/JCLI-D-11-00668.1, 2012.
Hakim, G. J.: The mean state of axisymmetric hurricanes in statistical equilibrium, J. Atmos. Sci., 68, 1364–1376, https://doi.org/10.1175/2010JAS3644.1, 2011.
Hardiman, S. C., Butchart, N., and Calvo, N.: The morphology of the Brewer–Dobson circulation and its response to climate change in CMIP5 simulations, Q. J. Roy. Meteor. Soc., 140, 1958–1965, https://doi.org/10.1002/qj.2258, 2014.
Hartmann, D. L. and Larson, K.: An important constraint on tropical cloud-climate feedback, Geophys. Res. Lett., 29, 1951, https://doi.org/10.1029/2002GL015835, 2002.
Hazeleger, W., van den Hurk, B. J., Min, E., van Oldenborgh, G. J., Petersen, A. C., Stainforth, D. A., Vasileiadou, E., and Smith, L. A.: Tales of future weather, Nat. Clim. Change, 5, 107–113, 2015.
Held, I. M. and Soden, B. J.: Robust responses of the hydrological cycle to global warming, J. Climate, 19, 5686–5699, https://doi.org/10.1175/JCLI3990.1, 2006.
Hersbach, H., Bell, B., Berrisford, P., Hirahara, S., Horányi, A., Muñoz-Sabater, J., Nicolas, J., Peubey, C., Radu, R., Schepers, D., and Simmons, A.: The ERA5 global reanalysis, Q. J. Roy. Meteor. Soc., 146, 1999–2049, https://doi.org/10.1002/qj.3803, 2020.
Hill, K. A. and Lackmann, G. M.: The impact of future climate change on TC intensity and structure: A downscaling approach, J. Climate, 24, 4644–4661, https://doi.org/10.1175/2011JCLI3761.1, 2011.
Holland, G. and Bruyère, C. L.: Recent intense hurricane response to global climate change, Clim. Dynam., 42, 617–627, https://doi.org/10.1007/s00382-013-1713-0, 2014.
Holland, G. J.: The maximum potential intensity of tropical cyclones, J. Atmos. Sci., 54, 2519–2541, https://doi.org/10.1175/1520-0469(1997)054<2519:TMPIOT>2.0.CO;2, 1997.
Jewson, S. and Lewis, N.: Statistical decomposition of the recent increase in the intensity of tropical storms, Oceans, 1, 311–325, https://doi.org/10.3390/oceans1040021, 2020.
Jung, C. and Lackmann, G. M.: Extratropical transition of Hurricane Irene (2011) in a changing climate, J. Climate, 32, 4847–4871, https://doi.org/10.1175/JCLI-D-18-0558.1, 2019.
Khairoutdinov, M. and Emanuel, K.: Rotating radiative-convective equilibrium simulated by a cloud-resolving model, J. Adv. Model. Earth Sy., 5, 816–825, https://doi.org/10.1002/2013MS000253, 2013.
Kieu, C. and Zhang, D. L.: The control of environmental stratification on the hurricane maximum potential intensity, Geophys. Res. Lett., 45, 6272–6280, https://doi.org/10.1029/2018GL078070, 2018.
Klotzbach, P. and Landsea, C.: Extremely intense hurricanes: Revisiting Webster et al. (2005) after 10 years, J. Climate, 28, 7621–7629, https://doi.org/10.1175/JCLI-D-15-0188.1, 2015.
Knapp, K. R. and Kruk, M. C.: Quantifying interagency differences in tropical cyclone best-track wind speed estimates, Mon. Weather Rev., 138, 1459–1473, https://doi.org/10.1175/2009MWR3123.1, 2010.
Knapp, K. R., Kruk, M. C., Levinson, D. H., Diamond, H. J., and Neumann, C. J.: The international best track archive for climate stewardship (IBTrACS) unifying tropical cyclone data, B. Am. Meteorol. Soc., 91, 363–376, https://doi.org/10.1175/2009BAMS2755.1, 2010 (data available at: https://www.ncdc.noaa.gov/ibtracs/, last access: 22 June 2022).
Knutson, T., Camargo, S. J., Chan, J. C., Emanuel, K., Ho, C. H., Kossin, J., Mohapatra, M., Satoh, M., Sugi, M., Walsh, K., and Wu, L.: Tropical cyclones and climate change assessment: Part I: Detection and attribution, B. Am. Meteorol. Soc., 100, 1987–2007, https://doi.org/10.1175/BAMS-D-18-0189.1, 2019.
Knutson, T., Camargo, S. J., Chan, J. C., Emanuel, K., Ho, C. H., Kossin, J., Mohapatra, M., Satoh, M., Sugi, M., Walsh, K., and Wu, L.: Tropical cyclones and climate change assessment: Part II: Projected response to anthropogenic warming, B. Am. Meteorol. Soc., 101, E303–E322, https://doi.org/10.1175/BAMS-D-18-0194.1, 2020.
Knutson, T. R., McBride, J. L., Chan, J., Emanuel, K., Holland, G., Landsea, C., Held, I., Kossin, J. P., Srivastava, A. K., and Sugi, M.: Tropical cyclones and climate change, Nat. Geosci., 3, 157–163, https://doi.org/10.1038/ngeo779, 2010.
Kossin, J. P.: Validating atmospheric reanalysis data using tropical cyclones as thermometers, B. Am. Meteoro. Soc, 96, 1089-1096, https://doi.org/10.1175/BAMS-D-14-00180.1, 2015.
Kossin, J. P., Olander, T. L., and Knapp, K. R.: Trend analysis with a new global record of tropical cyclone intensity, J. Climate, 26, 9960–9976, https://doi.org/10.1175/JCLI-D-13-00262.1, 2013.
Kossin, J. P., Knapp, K. R., Olander, T. L., and Velden, C. S.: Global increase in major tropical cyclone exceedance probability over the past four decades, P. Natl. Acad. Sci. USA, 117, 11975–11980, https://doi.org/10.1073/pnas.1920849117, 2020.
Kuang, Z. and Hartmann, D. L.: Testing the fixed anvil temperature hypothesis in a cloud-resolving model, J. Climate, 20, 2051–2057, https://doi.org/10.1175/JCLI4124.1, 2007.
Lackmann, G. M.: Hurricane Sandy before 1900 and after 2100, B. Am. Meteorol. Soc., 96, 547–560, https://doi.org/10.1175/BAMS-D-14-00123.1, 2015.
Landsea, C. W., Harper, B. A., Hoarau, K., and Knaff, J. A.: Can we detect trends in extreme tropical cyclones?, Science, 313, 452–454, https://doi.org/10.1126/science.1128448, 2006.
Lee, C. Y., Tippett, M., Sobel, A., and Camargo, S. J.: Rapid intensification and the bimodal distribution of tropical cyclone intensity, Nat. Commun., 7, 10625, https://doi.org/10.1038/ncomms10625, 2016.
Meehl, G. A., Washington, W. M., Ammann, C. M., Arblaster, J. M., Wigley, T. M. L., and Tebaldi, C.: Combinations of natural and anthropogenic forcings in twentieth-century climate, J. Climate, 17, 3721–3727, https://doi.org/10.1175/1520-0442(2004)017<3721:CONAAF>2.0.CO;2, 2004.
Meehl, G. A., Washington, W. M., Arblaster, J. M., Hu A., Teng, H., Tebaldi, C., Sanderson, B., Lamarque, J. F., Conley, A., Strand, W. G., and White III, J. B.: Climate system response to external forcings and climate change projections in CCSM4, J. Climate, 25, 3661–3683. https://doi.org/10.1175/JCLI-D-11-00240.1, 2012.
Mitchell, D. M., Thorne, P. W., Stott, P. A., and Gray, L. J.: Revisiting the controversial issue of tropical tropospheric temperature trends, Geophys. Res. Lett., 40, 2801–2806, https://doi.org/10.1002/grl.50465, 2013.
O'Gorman, P. A. and Singh, M. S.: Vertical structure of warming consistent with an upward shift in the middle and upper troposphere, Geophys. Res. Lett., 40, 1838–1842, https://doi.org/10.1002/grl.50328, 2013.
Pall, P., Allen, M. R., and Stone, D. A.: Testing the Clausius–Clapeyron constraint on changes in extreme precipitation under CO2 warming, Clim. Dynam., 28, 351–363, https://doi.org/10.1007/s00382-006-0180-2, 2007.
Pauluis, O. M. and Zhang, F.: Reconstruction of thermodynamic cycles in a high-resolution simulation of a hurricane, J. Atmos. Sci., 74, 3367–3381, https://doi.org/10.1175/JAS-D-16-0353.1, 2017.
Persing, J., Montgomery, M. T., McWilliams, J. C., and Smith, R. K.: Asymmetric and axisymmetric dynamics of tropical cyclones, Atmos. Chem. Phys., 13, 12299–12341, https://doi.org/10.5194/acp-13-12299-2013, 2013.
Philipona, R., Mears, C., Fujiwara, M., Jeannet, P., Thorne, P., Bodeker, G., Haimberger, L., Hervo, M., Popp, C., Romanens, G., and Steinbrecht, W.: Radiosondes show that after decades of cooling, the lower stratosphere is now warming, J. Geophys. Res.-Atmos., 123, 12509–12522, https://doi.org/10.1029/2018JD028901, 2018.
Po-Chedley, S. and Fu, Q.: Discrepancies in tropical upper tropospheric warming between atmospheric circulation models and satellites, Environ. Res. Lett., 7, 044018, https://doi.org/10.1088/1748-9326/7/4/044018, 2012.
Prein, A. F. and Heymsfield, A. J.: Increased melting level height impacts surface precipitation phase and intensity, Nat. Clim. Change, 10, 771–776, https://doi.org/10.1038/s41558-020-0825-x, 2020.
Prein, A. F., Liu, C., Ikeda, K., Trier, S. B., Rasmussen, R. M., Holland, G. J., and Clark, M. P.: Increased rainfall volume from future convective storms in the US, Nat. Clim. Change, 7, 880–884, https://doi.org/10.1038/s41558-017-0007-7, 2017.
Rahmstorf, S., Foster, G., and Cahill, N.: Global temperature analysis: Recent trends and some pitfalls, Environ Res. Lett., 12, 054001, https://doi.org/10.1088/1748-9326/aa6825, 2017.
Ramaswamy, V., Schwarzkopf, M. D., Randel, W. J., Santer, B. D., Soden, B. J., and Stenchikov, G. L.: Anthropogenic and natural influences in the evolution of lower stratospheric cooling, Science, 311, 1138–1141, https://doi.org/10.1126/science.1122587, 2006.
Ramsay, H. A.: The effects of imposed stratospheric cooling on the maximum intensity of tropical cyclones in axisymmetric radiative–convective equilibrium, J. Climate, 26, 9977–9985, https://doi.org/10.1175/JCLI-D-13-00195.1, 2013.
Riemer, M., Montgomery, M. T., and Nicholls, M. E.: A new paradigm for intensity modification of tropical cyclones: thermodynamic impact of vertical wind shear on the inflow layer, Atmos. Chem. Phys., 10, 3163–3188, https://doi.org/10.5194/acp-10-3163-2010, 2010.
Rogers, R. F., Reasor, P. D., and Lorsolo, S.: Airborne Doppler observations of the inner-core structural differences between intensifying and steady-state tropical cyclones, Mon. Weather Rev., 141, 2970–2991, https://doi.org/10.1175/MWR-D-12-00357.1, 2013.
Rotunno, R. and Emanuel, K. A.: An air–sea interaction theory for tropical cyclones. Part II: Evolutionary study using a nonhydrostatic axisymmetric numerical model, J. Atmos. Sci., 44, 542–561, https://doi.org/10.1175/1520-0469(1987)044<0542:AAITFT>2.0.CO;2, 1987.
Rousseau-Rizzi, R. and Emanuel, K.: An evaluation of hurricane superintensity in axisymmetric numerical models, J. Atmos. Sci., 76, 1697–1708, https://doi.org/10.1175/JAS-D-18-0238.1, 2019.
Rousseau-Rizzi, R. and Emanuel, K.: A weak temperature gradient framework to quantify the causes of potential intensity variability in the tropics, J. Climate, 34, 8669–8682, https://doi.org/10.1175/JCLI-D-21-0139.1, 2021.
Rousseau-Rizzi, R., Rotunno, R., and Bryan, G.: A Thermodynamic Perspective on Steady-State Tropical Cyclones, J. Atmos. Sci., 78, 583–593, https://doi.org/10.1175/JAS-D-20-0140.1, 2021.
Rousseau-Rizzi, R., Merlis, T. M., and Jeevanjee, N.: The connection between Carnot and CAPE formulations of TC potential intensity, J. Climate, 35, 941–954, https://doi.org/10.1175/JCLI-D-21-0360.1, 2022.
Santer, B. D., Wigley, T. M., Mears, C., Wentz, F. J., Klein, S. A., Seidel, D. J., Taylor, K. E., Thorne, P. W., Wehner, M. F., Gleckler, P. J., and Boyle, J. S.: Amplification of surface temperature trends and variability in the tropical atmosphere, Science, 309, 1551–1556, https://doi.org/10.1126/science.1114867, 2005.
Santer, B. D., Thorne, P. W., Haimberger, L., Taylor, K. E., Wigley, T. M. L., Lanzante, J. R., Solomon, S., Free, M., Gleckler, P. J., Jones, P. D., Karl, T. R., Klein, S. A., Mears, C., Nychka, D., Schmidt, G. A., Sherwood, S. C., and Wentz, F. J.: Consistency of modelled and observed temperature trends in the tropical troposphere, Int. J. Climatol., 28, 1703–1722, https://doi.org/10.1002/joc.1756, 2008.
Schreck III, C. J., Knapp, K. R., and Kossin, J. P.: The impact of best track discrepancies on global tropical cyclone climatologies using IBTrACS, Mon. Weather Rev. 142, 3881–3899, https://doi.org/10.1175/MWR-D-14-00021.1, 2014.
Shen, W., Tuleya, R. E., and Ginis, I.: A sensitivity study of the thermodynamic environment on GFDL model hurricane intensity: Implications for global warming, J. Climate, 13, 109–121, https://doi.org/10.1175/1520-0442(2000)013<0109:ASSOTT>2.0.CO;2, 2000.
Shepherd, T. G.: Storyline approach to the construction of regional climate change information, P. Roy. Soc. A-Math. Phy., 475, 20190013, https://doi.org/10.1098/rspa.2019.0013, 2019.
Sherwood, S. C., Lanzante, J. R., and Meyer, C. L.: Radiosonde daytime biases and late-20th century warming, Science, 309, 1556–1559, https://doi.org/10.1126/science.1115640, 2005.
Simmons, A. J., Poli, P., Dee, D. P., Berrisford, P., Hersbach, H., Kobayashi, S., and Peubey, C.: Estimating low-frequency variability and trends in atmospheric temperature using ERA-Interim, Q. J. Roy. Meteor. Soc., 140, 329–353, https://doi.org/10.1002/qj.2317, 2014.
Simmons, A. J., Soci, C., Nicolas, J., Bell, B., Berrisford, P., Dragani, R., Flemming, J., Haimberger, L., Healey, S. B., Hersbach, H., Horányi, A., Inness, A., Muñoz-Sabater, J., Radu, R., and Schepers, D.: Global stratospheric temperature bias and other stratospheric aspects of ERA5 and ERA5.1, Technical Memorandum 859, ECMWF, Reading, UK, https://doi.org/10.21957/rcxqfmg0, 2020.
Smith, R. K., Montgomery, M. T., and Nguyen, S. V.: Axisymmetric dynamics of tropical cyclone intensification in a three dimensional model, Q. J. Roy. Meteor. Soc., 134, 337–351, https://doi.org/10.1175/JAS-D-17-0179.1, 2008.
Sobel, A. H., Camargo, S. J., Hall, T. M., Lee, C. Y., Tippett, M. K., and Wing, A. A.: Human influence on tropical cyclone intensity, Science, 353, 242–246, https://doi.org/10.1126/science.aaf6574, 2016.
Strazzo, S. E., Elsner, J. B. and LaRow, T. E.: Quantifying the sensitivity of maximum, limiting, and potential tropical cyclone intensity to SST: Observations versus the FSU/COAPS global climate model, J. Adv. Model. Earth Sy., 7, 586–599, https://doi.org/10.1002/2015MS000432, 2015.
Tao, D., Rotunno, R., and Bell, M.: Lilly's Model for Steady-State Tropical Cyclone Intensity and Structure, J. Atmos. Sci., 77, 3701–3720, https://doi.org/10.1175/JAS-D-20-0057.1, 2020.
Thompson, D. W. J., Seidel, D. J., Randel, W. J., Zou, C. Z., Butler, A. H., Mears, C., Osso, A., Long, C., and Lin, R.: The mystery of recent stratospheric temperature trends, Nature, 491, 692–697, https://doi.org/10.1038/nature11579, 2012.
Thorne, P. W., Lanzante, J. R., Peterson, T. C., Seidel, D. J., and Shine, K. P.: Tropospheric temperature trends: History of an ongoing controversy, WIREs Clim. Change, 2, 66–88, https://doi.org/10.1002/wcc.80, 2011.
Ting, M., Kossin, J. P., Camargo, S. J., and Li, C.: Past and future hurricane intensity change along the US east coast, Scientific Reports, 9, 7765, https://doi.org/10.1038/s41598-019-44252-w, 2019.
Tuleya, R. E., Bender, M. A., Knutson, T. R., Sirutis, J. J., Thomas, B., and Ginis, I.: Impact of upper tropospheric temperature anomalies and vertical wind shear on tropical cyclone evolution using an idealized version of the operational GFDL hurricane model, J. Atmos. Sci., 73, 3803–3820, https://doi.org/10.1175/JAS-D-16-0045.1, 2016.
Uppala, S. M., Kållberg, P. W., Simmons, A. J., Andrae, U., Bechtold, V. D. C., Fiorino, M., Gibson, J. K., Haseler, J., Hernandez, A., Kelly, G. A., and Li, X.: The ERA-40 re-analysis, Q. J. Roy. Meteor. Soc., 131, 2961–3012, https://doi.org/10.1256/qj.04.176, 2005.
Vecchi, G. A., Fueglistaler, S., Held, I. M., Knutson, T. R., and Zhao, M.: Impacts of atmospheric temperature changes on tropical cyclone activity, J. Climate, 26, 3877–3891, https://doi.org/10.1175/JCLI-D-12-00503.1, 2013.
Wadler, J. B., Zhang, J. A., Jaimes, B. and Shay, L. K.: The Rapid Intensification of Hurricane Michael (2018): Storm Structure and the Relationship to Environmental and Air-Sea Interactions. Mon. Weather Rev., 149, 245–267, https://doi.org/10.1175/MWR-D-20-0145.1, 2021.
Wang, Y.: Vortex Rossby waves in a numerically simulated tropical cyclone. Part I: Overall structure, potential vorticity, and kinetic energy budgets, J. Atmos. Sci., 59, 1213–1238, https://doi.org/10.1175/1520-0469(2002)059<1213:VRWIAN>2.0.CO;2, 2002.
Wasserstein, R. L., Schirm, A. L., and Lazar, N. A.: Moving to a world beyond “p<0.05”, Am. Stat., 73, 1537–2731, https://doi.org/10.1080/00031305.2019.1583913, 2019.
Wilcoxon, F.: Individual comparisons by ranking methods, Biometrics Bull., 1, 80–83, https://doi.org/10.2307/3001968, 1945.
Willett, K. M., Gillett, N. P, Jones, P. D., and Thorne, P. W.: Attribution of observed surface humidity changes to human influence, Nature, 449, 710–712, https://doi.org/10.1038/nature06207, 2007.
Xu, K. M., Wong, T., Wielicki, B. A., Parker, L., Lin, B., Eitzen, Z. A. and Branson, M.: Statistical analyses of satellite cloud object data from CERES. Part II: Tropical convective cloud objects during 1998 El Niño and evidence for supporting the fixed anvil temperature hypothesis, J. Climate, 20, 819–842, https://doi.org/10.1175/JCLI4069.1, 2007.
Zawislak, J., Jiang, H., Alvey III, G. R., Zipser, E. J., Rogers, R. F., Zhang, J. A., and Stevenson, S. N.: Observations of the structure and evolution of Hurricane Edouard (2014) during intensity change. Part I: Relationship between the thermodynamic structure and precipitation, Mon. Weather Rev., 144, 3333–3354, https://doi.org/10.1175/MWR-D-16-0018.1, 2016.