the Creative Commons Attribution 4.0 License.
the Creative Commons Attribution 4.0 License.
 | 19 Apr 2024
Warm conveyor belt characteristics and impacts along the life cycle of extratropical cyclones: case studies and climatological analysis based on ERA5
Katharina Heitmann
Michael Sprenger
Hanin Binder
Heini Wernli
Hanna Joos
This study presents a systematic investigation of the characteristics and meteorological impacts of warm conveyor belts (WCBs). For this purpose, we compile a new WCB climatology (1980–2022) of trajectories calculated with the most recent reanalysis dataset ERA5 from the European Centre for Medium-Range Weather Forecasts (ECMWF). Based on this new climatology, two-dimensional masks are defined that represent the inflow, ascent, and outflow locations of WCBs. These masks are then used to objectively quantify the key characteristics (intensity, ascent rate, and ascent curvature) and meteorological impacts (precipitation and potential vorticity (PV) anomalies) of WCBs in order to (i) attribute them to different stages in the life cycle of the associated cyclones and to (ii) evaluate differences in the outflow of the cyclonic and anticyclonic branches. The approach was applied globally, but this study focuses on the North Atlantic, one of the regions where WCBs ascend most frequently.
The method is first tested and illustrated through three case studies of well-documented cyclones, revealing both the similarities and the case-to-case variability in the evolution of the WCB characteristics and impacts. We then extend the analysis to about 5000 cyclones that occurred in winter between 1980–2022 in the North Atlantic. The case studies and the climatological analysis both show that WCBs are typically most intense (in terms of air mass transported, ascent rate, precipitation rate, and volume) during the intensification period of the associated cyclone. The northward displacement along the storm track and diabatic PV production lead to an increase in low-level PV in the region of WCB ascent during the cyclone life cycle. The negative PV anomaly at upper levels, associated with the WCB outflow, remains relatively constant. The investigation of the WCB branches reveals an increasing intensity of the cyclonic WCB branch with time, linked to the increasing strength of the cyclonic wind field around the cyclone. Due to a lower altitude, the outflow of the cyclonic WCB branch is associated with a weaker negative PV anomaly than the anticyclonic one, which ascends to higher altitudes. In summary, this study highlights the distinct evolution of WCB characteristics and impacts during the cyclone life cycle and the marked differences between the cyclonic and anticyclonic branches.
- Article
(7659 KB) - Full-text XML
-
Supplement
(14163 KB) - BibTeX
- EndNote


The warm conveyor belt (WCB) is a coherent airstream that ascends from the warm sector of an extratropical cyclone into the upper troposphere, transporting moist air over large vertical and horizontal distances. It is one of the three main airstreams in an extratropical cyclone (Browning, 1990), which are the descending dry intrusion (Reed and Danielsen, 1958), the cold conveyor belt (Carlson, 1980), and the strongly ascending WCB (Harrold, 1973; Browning et al., 1973). The WCB was initially identified from the Eulerian flow field on isentropic surfaces (Namias, 1939; Carlson, 1980) and, more recently, by utilizing the Lagrangian perspective. Wernli and Davies (1997) defined the WCB as a “coherent ensemble of trajectories” by identifying trajectories in the vicinity of an extratropical cyclone (hereafter referred to as a cyclone) that are associated with a large decrease in pressure p, a reduction in specific humidity q, or an increase in potential temperature θ integrated along the trajectories. Suitable thresholds to identify WCBs are about 600 hPa in 2 d for the ascent, 10 g kg−1 for the decrease in q, and 20 K for the increase in θ. WCBs occur in all seasons and in the mid-latitudes of both hemispheres but ascend most frequently in boreal winter in the North Atlantic (NA) and North Pacific (NP) storm tracks at around 30–50° N (Eckhardt et al., 2004; Madonna et al., 2014b). Eckhardt et al. (2004) also showed that most winter cyclones over oceans in the mid-latitudes are associated with a WCB. However, there is a broad spectrum of cyclones (Catto, 2016), which is likely also reflected in the large case-to-case variability of the WCB characteristics and impacts. This study addresses this variability in WCBs for the first time objectively and systematically.
To quantify this variability, we refer to “characteristics” as properties of WCBs that can be quantified from the number and paths of the trajectories, whereas with “impacts”, we refer to effects of physical and dynamical processes in WCBs that affect meteorological variables like surface precipitation and potential vorticity (PV).
There are different measures to quantify such WCB characteristics and impacts. Regarding the characteristics of WCBs, previous studies have investigated their intensity and ascent rate and the curvature of the ascending trajectories. The intensity of a WCB can be measured by the mass of air transported within the WCB, which can be quantified from a Lagrangian perspective as the number of WCB trajectories that form a coherent bundle and belong to the same cyclone. For instance, Binder et al. (2016) used this measure of WCB intensity and found a positive correlation with cyclone intensification. Another characteristic is the maximum ascent rate along the WCB trajectories (e.g., the maximum pressure decrease in 2 h along WCB trajectories, Rasp et al., 2016; Oertel et al., 2019; Blanchard et al., 2020), which helps to distinguish between more gentle, slantwise ascent and faster updrafts due to embedded convection. This distinction corresponds to the “escalator–elevator concept” by Neiman et al. (1993). A third characteristic, the curvature of the WCB ascent, becomes apparent on horizontal maps of WCBs. WCBs, or branches of WCBs, can be categorized into anticyclonic (W1) and cyclonic (W2) branches (Browning and Roberts, 1994; Wernli, 1997). The W1 branch typically enters an upper-level ridge downstream of the cyclone, joins the westerly upper-level jet, and is characterized by an anticyclonic curvature during the ascent. The W2 branch, on the other hand, ascends near the cyclone center and therefore turns cyclonically during the ascent. In the case study of Wernli (1997), the W2 branch ascended further poleward and with lower initial specific humidity than the W1 branch. Martínez-Alvarado et al. (2014) found in a detailed case study that the anticyclonic W1 branch starts from lower latitudes and higher initial moisture contents, ascends to higher altitudes, and thereby causes a stronger negative PV anomaly than the W2 branch. Blanchard et al. (2021) also found a higher final altitude and lower PV values in the W2 branch compared to the W1 branch. The described WCB characteristics co-evolve with the life cycle of the associated cyclone as described in the detailed case study by Wernli (1997). For instance, the WCB was most intense before the cyclone reached its minimum central pressure, it ascended most rapidly in the early phase of the cyclone, and its curvature transitioned from anticyclonic to cyclonic as the cyclone intensified.
Important impacts of WCBs are related to surface precipitation and the diabatic production of PV anomalies in the lower and upper troposphere, which both result from the ascent of moist air with subsequent cloud formation and latent heat release in the WCB. Traditionally, the WCB is regarded as the main precipitation-producing airstream in cyclones (Browning, 1990). Pfahl et al. (2014) quantified that 70 %–80 % of extreme precipitation events (6-hourly precipitation exceeding the 99th percentile) are linked to WCBs. This also holds specifically for the Mediterranean, where heavy precipitation in cyclones is predominantly associated with WCBs (Flaounas et al., 2018). Case study investigations of WCB ascent rates and surface precipitation (Binder, 2017; Oertel et al., 2019, 2020) revealed that intense local precipitation often occurs in regions of convection embedded in an ascending WCB. In contrast, more slowly slantwise-ascending WCBs are typically linked to weaker precipitation rates. Another important impact of the WCB is the modification of PV at lower and upper levels, induced primarily by the wide range of cloud microphysical processes along the WCB ascent (Joos and Wernli, 2012; Joos and Forbes, 2016). At first order, PV is produced below the level of maximum latent heating and destroyed above and vice versa for processes that consume latent heat (e.g., Stoelinga, 1996; Wernli and Davies, 1997). This led to the general understanding that PV first increases along the ascent of the WCB in the lower troposphere until the level of maximum diabatic heating and then decreases again to similar values as at the start of the ascent (Wernli, 1997; Joos and Wernli, 2012; Madonna et al., 2014b; Methven, 2015). At the end of the ascent, in the so-called WCB outflow, the low PV values correspond to strongly negative PV anomalies because of the anomalously strong poleward and upward transport within the WCB and subsequent PV destruction (e.g., Grams et al., 2011; Chagnon et al., 2013; Madonna et al., 2014b). The diabatic PV anomaly produced at low levels sometimes contributes to the rapid intensification of the associated cyclone (Binder et al., 2016). Accordingly, Booth et al. (2012) showed in a sensitivity experiment that enhanced latent heat release in the WCB due to higher surface temperatures leads to more intense cyclones. At higher levels, on the other hand, the diabatically produced negative PV anomalies potentially affect the flow evolution downstream of the cyclone. For instance, by supporting the negative PV anomaly of atmospheric blocks, WCBs likely enhance their lifespan and intensity and support associated extreme weather events such as heat waves or cold-air outbreaks (Pfahl et al., 2015; Steinfeld and Pfahl, 2019). When WCBs impinge on straight jets or less amplified Rossby wave patterns, they can either trigger the formation of Rossby waves (Röthlisberger et al., 2018) or contribute to wave amplification (Grams et al., 2011) or strengthening of the jet (Blanchard et al., 2021). Consistently, the diabatic processes in the WCB ascent were found to increase the forecast uncertainty in the region of the WCB outflow and further downstream (Grams et al., 2018; Rodwell et al., 2018).
This brief summary emphasizes the key characteristics of WCBs and their impacts on surface weather, the evolution of the associated cyclone, and the downstream flow. Because most of the studies so far have focused on either one particular WCB impact or discussed the linkage between WCB characteristics and impacts in case studies, a systematic climatological analysis of WCB characteristics and impacts is currently missing. This study aims at closing this gap by using an established WCB identification method applied to state-of-the-art ERA5 reanalyses and then developing objective measures to obtain a climatology of WCB characteristics and impacts. In combination with the tracking of cyclones, our approach enables the systematic investigation of how WCB characteristics and impacts evolve along the life cycle of cyclones. Based on this approach, we aim to answer the following research questions first using case studies and later from a climatological perspective:
-
How can we quantify the main characteristics and meteorological impacts of WCBs?
-
How do the characteristics and impacts of WCBs change along the life cycle of the associated cyclone?
-
How do the cyclonic and anticyclonic WCB branches differ in terms of their characteristics and impacts?
The methodology devised to address the first research question is applied in case studies and a climatology to answer the second and third research questions.
The approach of systematically attributing specific properties to individual weather systems is very common for cyclones. Many studies have described the properties of a cyclone in terms of a set of values that quantify, e.g., its lifetime, size, depth, intensity, intensification rate, and propagation speed (e.g., Neu et al., 2013). This study adds a next dimension to this feature-based climatological approach by attributing an additional set of values, which quantify the characteristics and impacts of WCBs, to individual cyclone life cycles. In a subsequent study, we will use this methodology to attribute WCBs to cyclones in climate model simulations and investigate how the WCB characteristics and impacts might change in a future, warmer climate.
This study, focusing on cyclones and their WCBs in ERA5 data, first introduces the data and methods to quantify the characteristics and impacts of a WCB in Sect. 2. In Sect. 3 and in the Supplement, three case studies of cyclone life cycles and their WCB characteristics and impacts are presented in detail, and in Sect. 4, the case study results are put into perspective by presenting a climatology of the temporal evolution of the characteristics and impacts of all WCBs in the North Atlantic in the winter seasons between 1980–2022. The main results are discussed and concluded in Sect. 5.
2.1 ERA5
For the scope of this study, we use the most recent reanalysis dataset ERA5 from the European Centre for Medium-Range Weather Forecasts (ECMWF) that represents the fifth generation of atmospheric reanalysis data (Hersbach et al., 2020). This dataset is characterized by 31 km spatial resolution (spectral resolution T369) on 137 model levels and hourly temporal resolution. We interpolate the output from ERA5 for the 1980–2022 period to a 0.5° × 0.5° latitude–longitude grid to calculate trajectories, identify WCBs, and calculate different metrics to describe them.
2.2 Outline of the approach
The first research question addresses the development of an objective method to quantify the characteristics and impacts of WCBs. In the following, we describe the outline of the three main steps of the approach, visualized in Fig. 1. First, we calculate 48 h forward trajectories and then select the trajectories that fulfill a set of WCB criteria. In the second step, two-dimensional masks are derived that describe the region of the inflow, ascent, and outflow of each WCB, defined by the previously identified WCB trajectories. Lastly, we describe each WCB mask with a set of metrics that quantify the WCB's characteristics and impacts. These three steps are applied globally and for the 1980–2022 period. However, this study focuses specifically on WCBs in the North Atlantic.
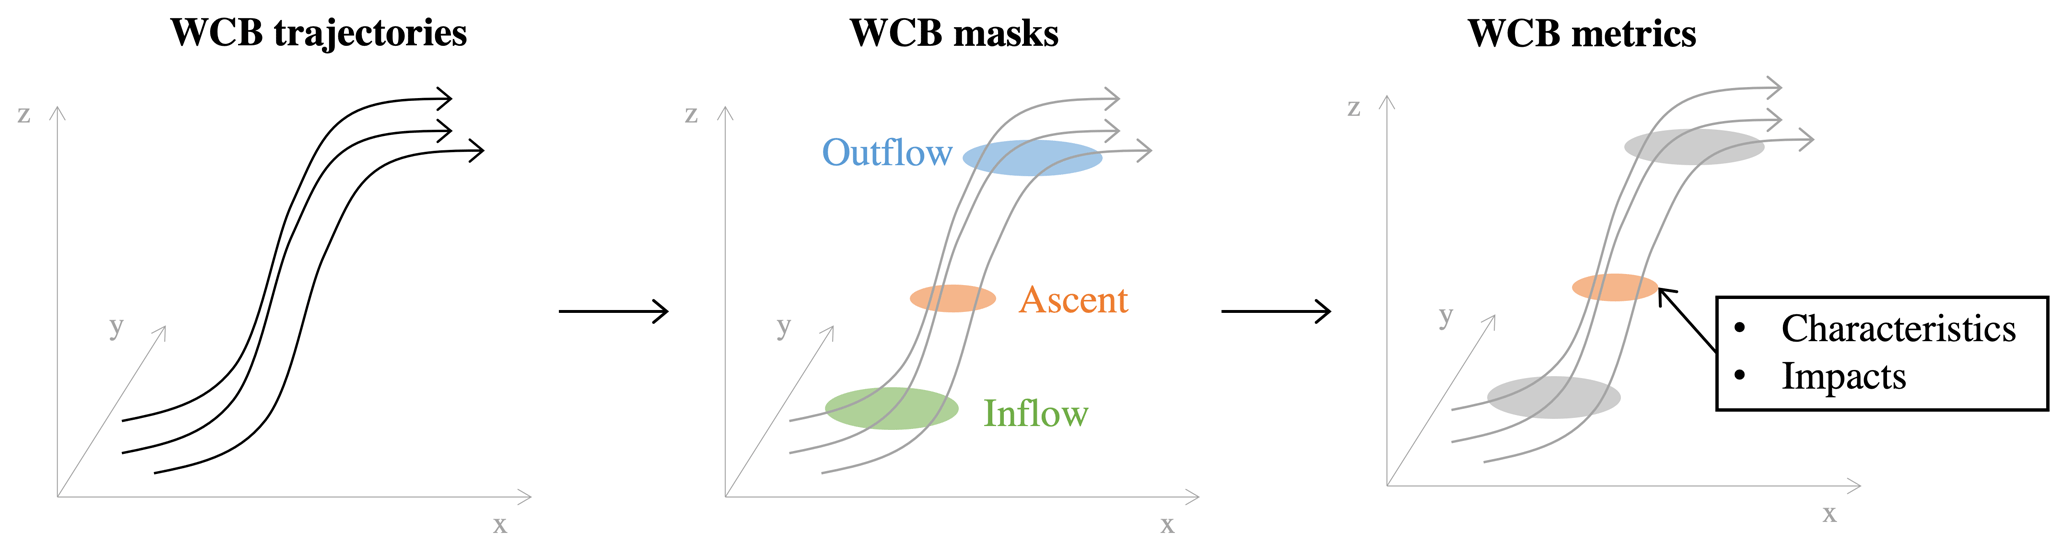
Figure 1To quantify the WCB characteristics and impacts, we first identify WCB trajectories; then define WCB masks describing the regions of WCB inflow, ascent, and outflow; and finally attribute each WCB mask to a set of metrics describing its characteristics and impacts.
2.2.1 Cyclones and WCB trajectories
Cyclone masks are calculated according to the cyclone identification and tracking algorithm by Wernli and Schwierz (2006) that was further refined by Sprenger et al. (2017). The algorithm defines the cyclone mask by the outermost sea-level pressure (SLP) contour surrounding an SLP minimum, poleward of 25° N or ° S and with a maximum contour circumference of 7500 km. Thereby, SLP minima associated with tropical convection or very large cyclone masks consisting of multiple cyclone centers are avoided. Cyclone centers at consecutive times are combined into distinct cyclone tracks, which must last at least 24 h. Cyclone tracks shorter than 24 h are neglected to omit transient and weak systems (see Sprenger et al., 2017, for details).
To identify WCBs, we use the Lagrangian analysis tool LAGRANTO (Wernli and Davies, 1997; Sprenger and Wernli, 2015). Every 6 h, 96 h forward trajectories are started. The trajectories are then calculated based on the three-dimensional wind field with an hourly resolution. The starting positions are set globally on an 80 km equidistant grid in the lower troposphere (790–1050 hPa every 20 hPa). The temporal and spatial resolution of the starting positions of trajectories in ERA5 is consistent with the approach of previous WCB-related studies (Madonna et al., 2014a; Binder et al., 2016, 2023; Joos et al., 2023). To select WCB trajectories, we apply criteria adapted from the ones used by Madonna et al. (2014b). First, WCB trajectories are defined as trajectories that ascend at least 600 hPa within 48 h. Then, a WCB bundle is defined as a set of WCB trajectories that start within a 250 km distance to at least one other WCB trajectory, and a minimum of one trajectory per WCB bundle must at least once coincide with a cyclone mask during its 48 h ascent. Finally, a double-count filter deletes trajectories that fulfill the previous WCB criteria at multiple time steps and would thus be counted several times (see Madonna et al., 2014b, for details). The WCB trajectory identification by Madonna et al. (2014b) was adapted in two central aspects. A detailed description and comparison of the two sets of WCB trajectories can be found in Heitmann (2023). First, the required threshold of 600 hPa for the decrease in pressure can be exceeded at any time during the 48 h ascent and not only strictly between the start and end of the ascent, 48 h later. The difference between these two definitions lies in the fact that the adapted definition also takes trajectories into account that ascend rapidly and descend again within 48 h, which were not considered in the climatology by Madonna et al. (2014b). Secondly, Madonna et al. (2014b) only took WCB trajectories into account that were collocated with a cyclone mask at least once during the ascent. In contrast, the adapted definition considers every trajectory in a bundle of trajectories if at least one of them coincides with a cyclone mask at least once during the ascent (as described above). Hence, the bundle of WCB trajectories also includes the eastern part of the WCB that potentially does not coincide with the cyclone mask at any point in time and therefore is excluded in the climatology by Madonna et al. (2014b). The adapted WCB criteria are also described by Binder et al. (2020), who used them to investigate the vertical cloud structure associated with a WCB. A climatology of the WCB trajectories in ERA5 based on this adapted definition can be found in Supplement Fig. S7. In the comparison of the WCB climatology by Madonna et al. (2014b) with the present one (Fig. S8), we found very similar starting regions of WCB trajectories and an eastward shift in the ascent and outflow location in the new ERA5 climatology. A more in-depth investigation of the impact of the changes in the WCB trajectory definition showed that, in contrast to the trajectories considered by Madonna et al. (2014b), the new set of WCB trajectories fulfilling the adapted WCB definition reaches higher altitudes and higher zonal wind speeds at an earlier moment in their lifetime (illustrated in Fig. 3.3 by Heitmann, 2023), thereby explaining the eastward shift in the ascent and outflow locations. The ERA5 WCB climatology provides the basis for the calculation of the WCB masks, which is described in the following section.
2.2.2 WCB masks
The WCB trajectories are used to define two-dimensional Eulerian WCB masks, representing different altitude ranges of the WCB. More specifically, the 48 h WCB can be divided into different altitude ranges depending on the pressure of the air masses at a specific time. These altitude ranges are the WCB inflow (> 800 hPa), ascent (500–800 hPa), and outflow (< 400 hPa). To avoid very large WCB outflow masks, we limit the maximum residence time in the WCB outflow region to 12 h after the trajectories have crossed the lower limit of 400 hPa. These altitude ranges are used to analyze the impacts and characteristics of WCBs at different phases during the ascent. For instance, we assume the ascent phase to be the most important for forming precipitation and modifying the low-level PV field. On the other hand, the outflow of the WCB likely coincides with negative upper-level PV anomalies. Thus, by defining two-dimensional Eulerian masks for the different altitude ranges of WCBs, it is possible to determine the impacts of WCBs separately for the different ascent phases of WCBs.
The WCB trajectories that define a WCB mask at time t* can start between 0–48 h before t*, as schematically shown in Fig. 3a. The positions of air parcels at t* located in a specific pressure range (here WCB ascent, 500–800 hPa) are projected on a latitude–longitude grid and then inflated to a circle with a 100 km radius (Fig. 3b). The envelope of these circles denotes the outer border of all WCB air parcels in the respective ascent phase and therefore defines the two-dimensional Eulerian WCB ascent mask at t* (red line in Fig. 3b). By inflating the WCB air parcel position, artificial gaps in the masks in areas where only a few WCB trajectories ascend are avoided. The selection of the radius value of 100 km is motivated by the grid spacing of the trajectory starting position (80 km). We only consider WCB trajectories for the mask calculation until the time step when they have reached their minimum pressure in the 48 h ascent window. This approach is consistent with previous studies that also used two-dimensional masks to define the area of WCB ascent or outflow in order to study the relationship between WCBs and PV streamers (Madonna et al., 2014a) or the co-occurrence of WCB masks, fronts, and intense precipitation (Catto et al., 2015). WCB masks are defined every 6 h for the entire ERA5 period for the inflow, ascent, and outflow pressure range.
Additionally, we divide each WCB outflow mask into sub-regions depending on the curvature of the trajectories inside the mask. For this purpose, we determine the curvature of each WCB trajectory (see Sect. 2.2.3 for details of ascent curvature calculation) and separately calculate WCB outflow masks for cyclonically, anticyclonically, and non-curved WCB trajectories.
Based on the concept of defining WCBs in specific ascent phases as two-dimensional objects, we can now compile a new WCB climatology that accounts for the variability in the ascent behavior of WCB trajectories. Figure 2 shows the frequency of occurrence of WCB inflow (> 800 hPa), ascent (500–800 hPa), and outflow (< 400 hPa) masks. Key features of the new climatology are consistent with previous WCB climatologies that are based on the location of WCB trajectories at different time steps (Fig. S7; Stohl, 2001; Eckhardt et al., 2004; Madonna et al., 2014b), such as the enhanced frequency of WCB inflow (Fig. 2a, b) in the region of the storm tracks and on the respective winter hemisphere (linked to the previously mentioned condition that each WCB trajectory bundle must coincide with a cyclone mask at least once). Directly comparing the absolute values of WCB frequency derived from WCB trajectories or WCB masks poses challenges due to inherent differences in their definition. The inflation of each WCB trajectory position to a 100 km circle leads to maximum frequency values of WCB inflow masks of more than 25 % (Fig. 2a) compared to a frequency of 5 %–7 % for WCB trajectory starting positions (Fig. S7a). Another difference to the climatology by Madonna et al. (2014b) is the reduced frequency during the ascent phase compared to the inflow and outflow phase. Typically, a bundle of WCB trajectories is less coherent (in terms of trajectories per area) in the inflow and outflow region compared to the ascent region. Thus, WCB ascent masks tend to be smaller and spread over fewer grid points, thereby causing a reduced frequency. One of the main advantages of a climatology based on WCB masks is the focus on the different ascent phases of the WCB. The approach of previous WCB climatologies, which took the position of a WCB trajectory at a fixed time instance, disregards any information about the vertical position and is strongly dependent on the ascent behavior of a trajectory. For example, at t=24 h, WCB trajectories can be located at 700 hPa in the ascent phase or already at 300 hPa, thus, in the WCB outflow. While these two WCB trajectory positions would be added to the same climatology (t=24 h) in the previous method, the new WCB climatology takes the different vertical positions into account and adds them to different climatologies (WCB ascent and outflow).
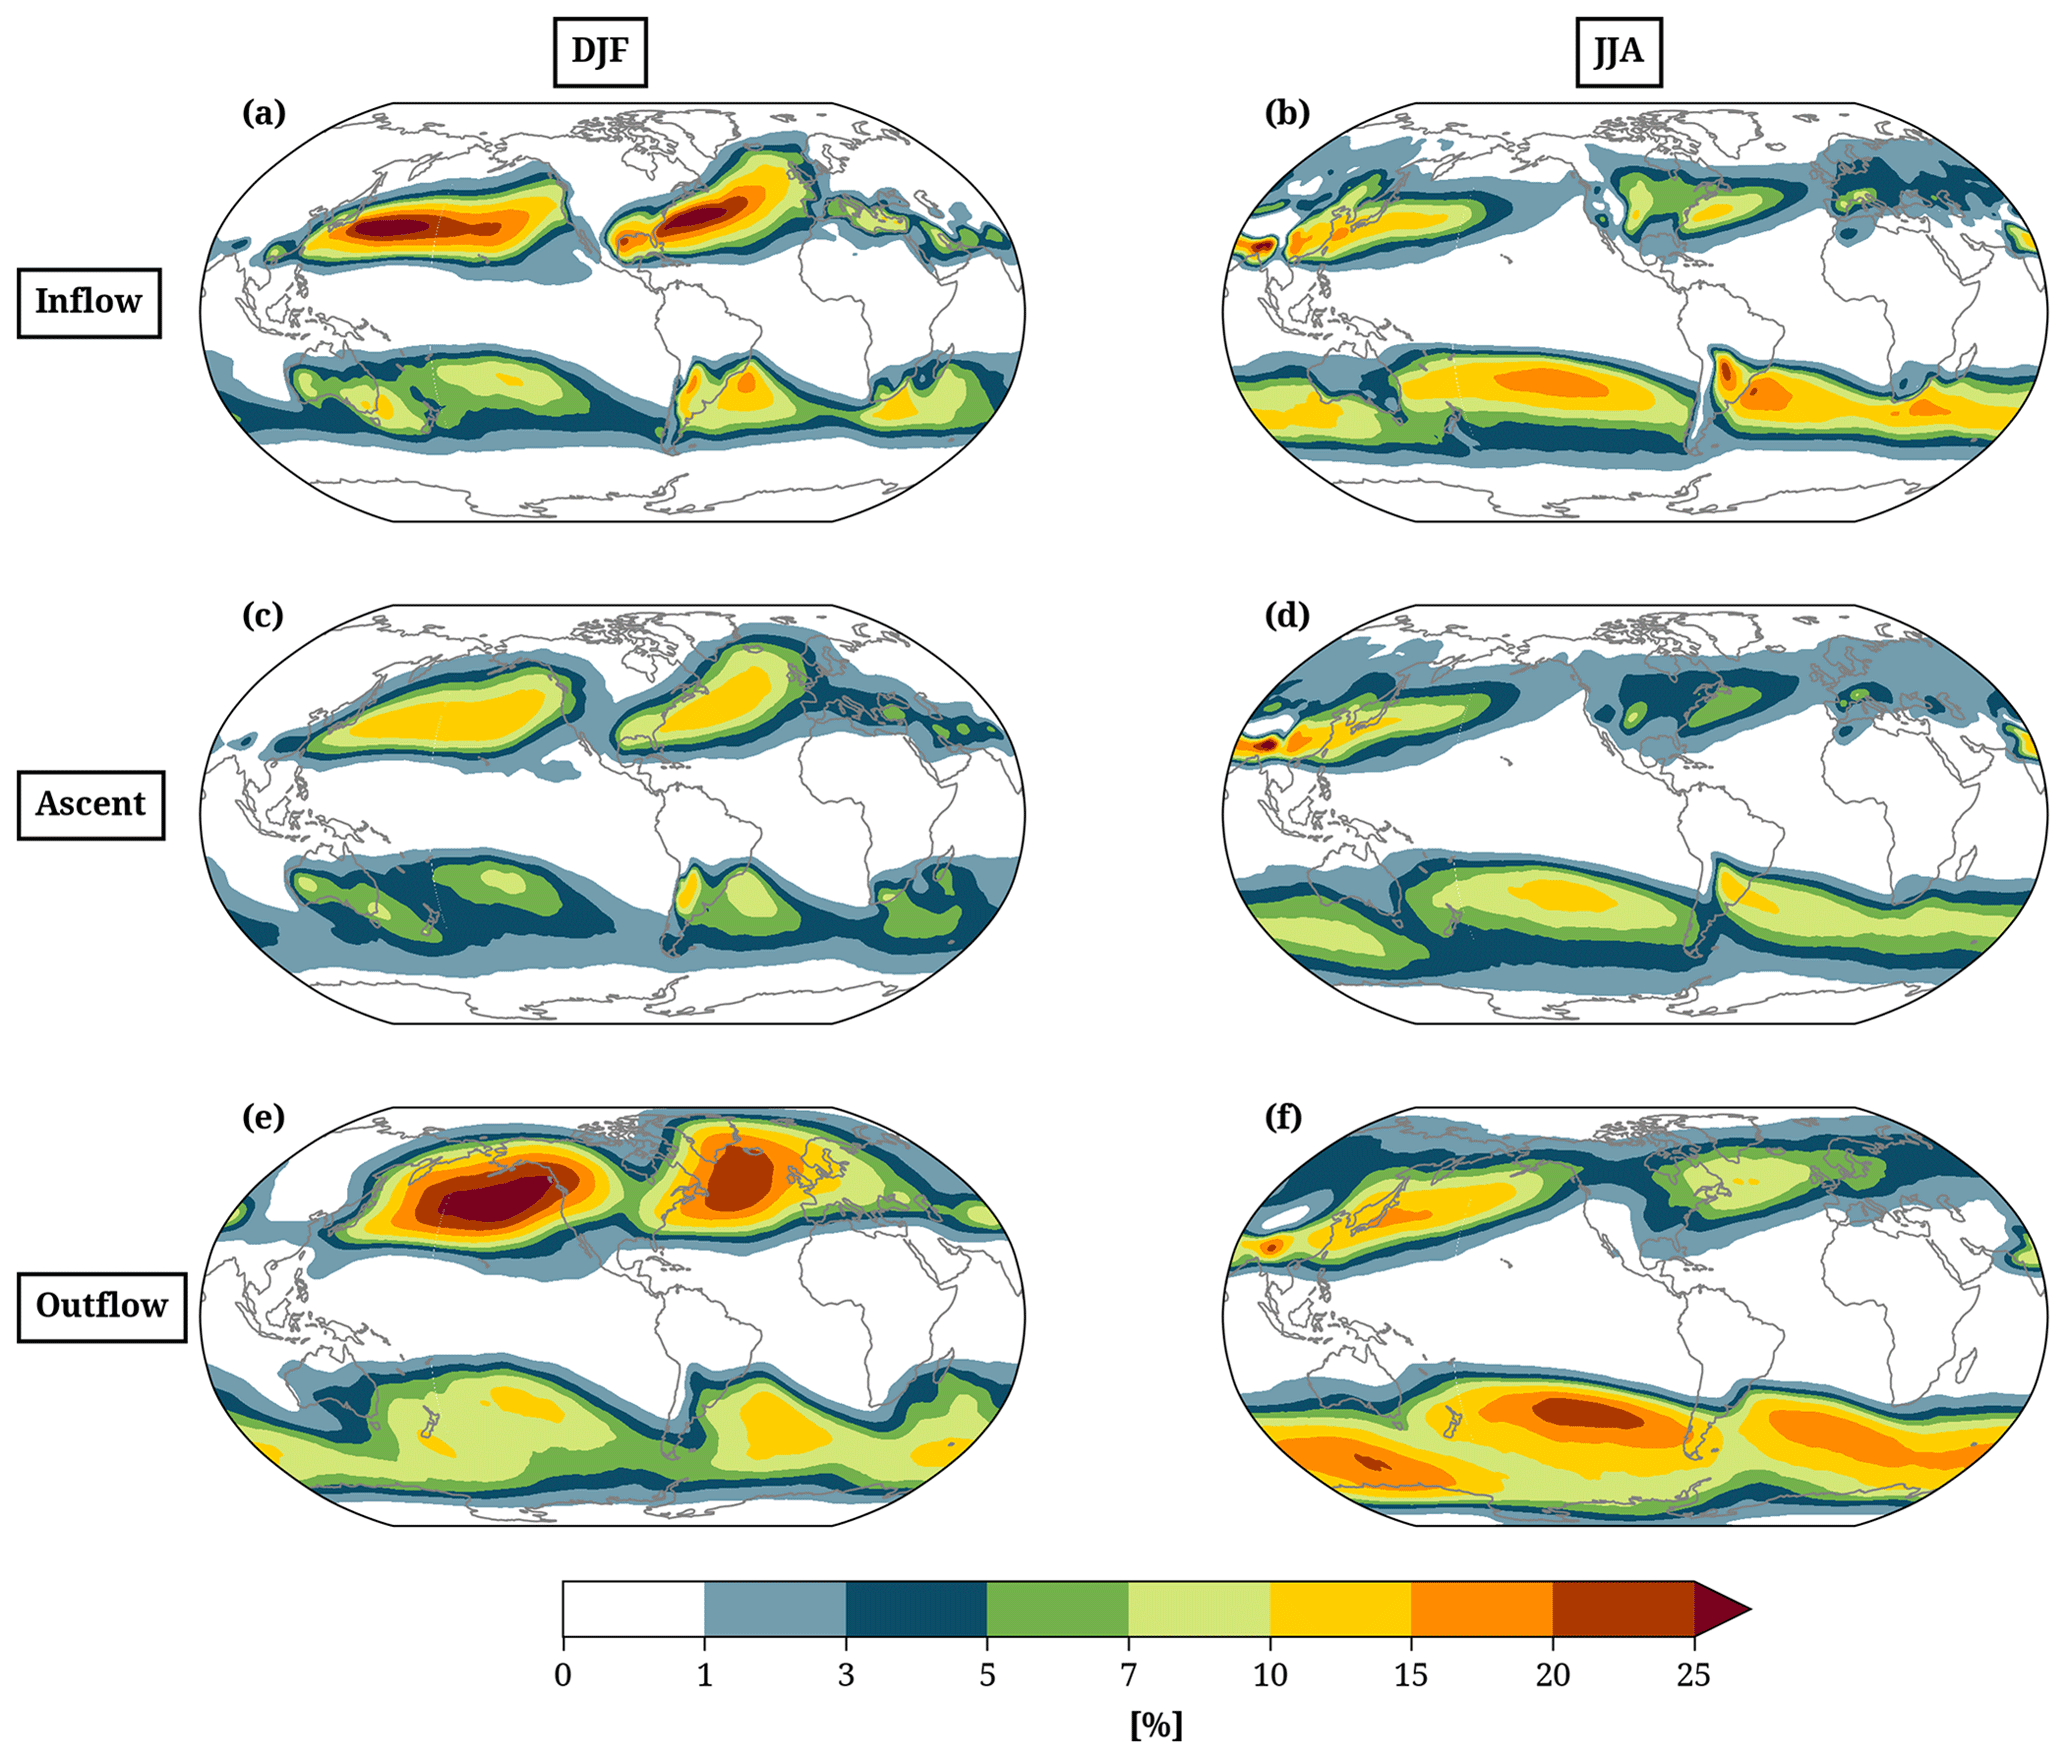
Figure 2The 42-year (1980–2022) climatology of the frequency of occurrence (%) of (a, b) WCB inflow, (c, d) ascent, and (e, f) outflow masks in (a, c, e) DJF and (b, d, f) JJA. For each grid point, the number of time steps with a WCB mask present divided by the total number of time steps in the respective time period equals the frequency of occurrence.
Finally, each Eulerian WCB mask is linked to a cyclone by first attributing each bundle of WCB trajectories to the cyclone with which they coincide most often. We only consider trajectory positions between 600–800 hPa when the WCB starts to ascend distinctively and is located closest to the associated cyclone. In the second step, the cyclone linked to a WCB bundle is transferred to the resulting Eulerian WCB masks. Since different WCB bundles associated with different cyclones may define one WCB mask, we select the cyclone with which the largest number of trajectories is linked. The allocation of WCB masks to cyclones allows for analyzing the WCB characteristics and impacts during the cyclone life cycle.
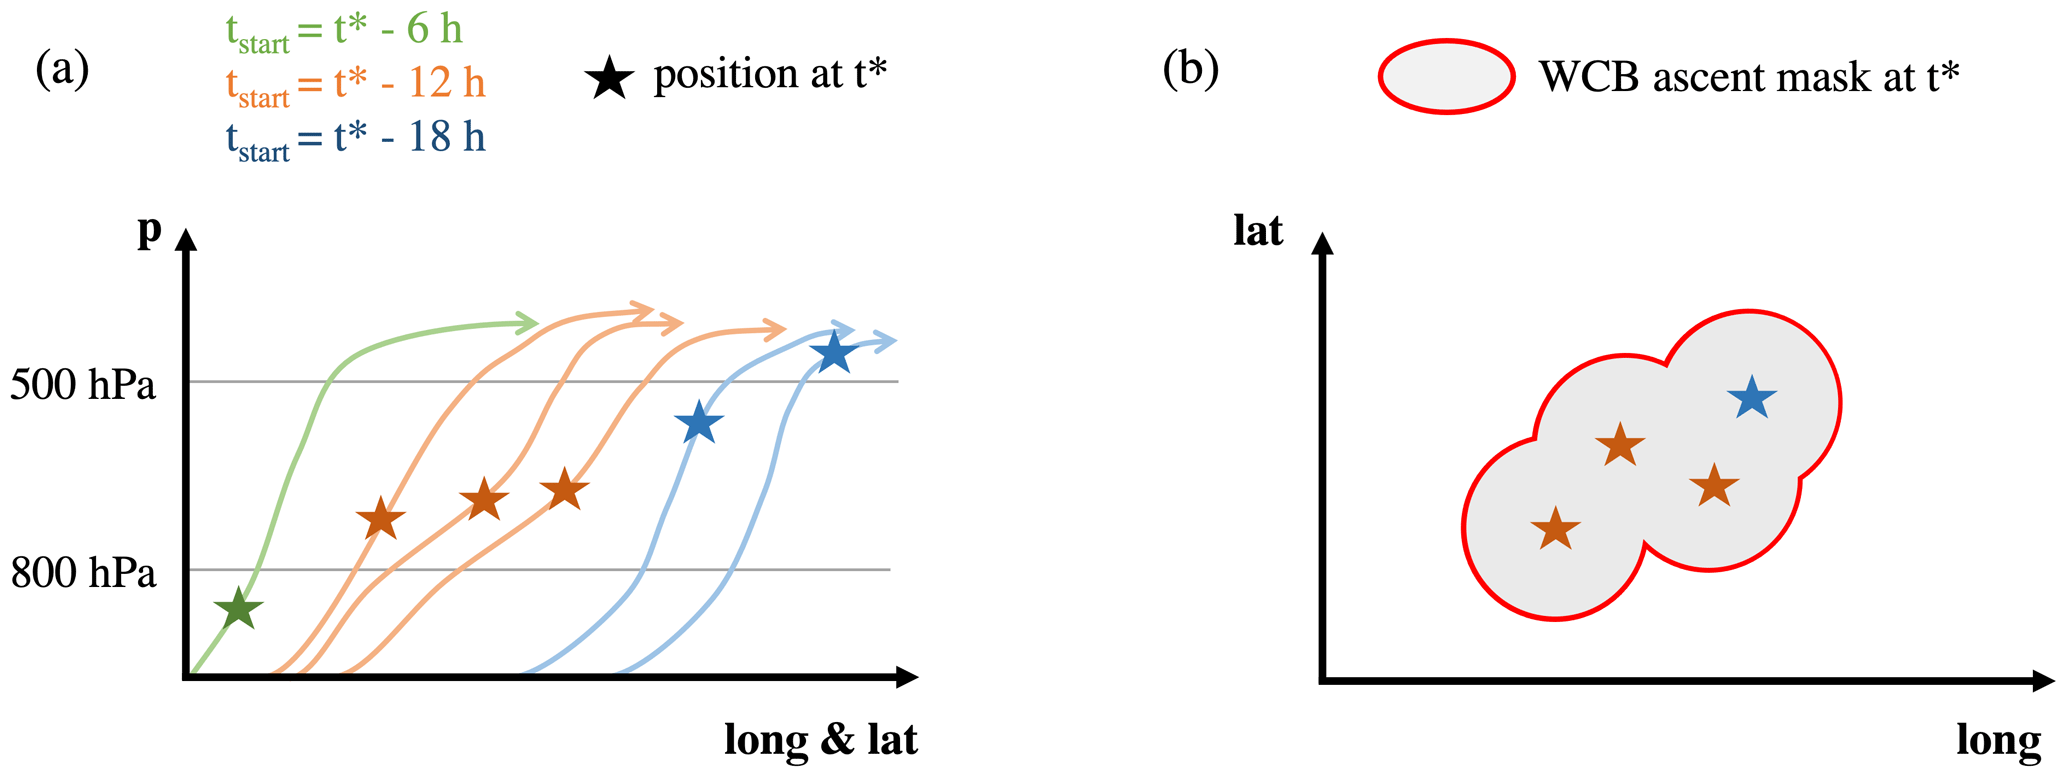
Figure 3Schematic of WCB mask calculation. (a) The 48 h forward trajectories starting at different times and their location at time t* (colored stars). (b) The horizontal position of trajectories that are located between 500–800 hPa at t* (colored stars), 100 km radius around each position (grey circles), and final circumferential mask (red contour) defining the ascent region of a WCB. Schematic adapted from Catto et al. (2015).
2.2.3 WCB characteristics and impacts
To each WCB mask, we attribute metrics that describe the WCB's characteristics and impacts at a specific time instance. In general, WCB characteristics are Lagrangian properties, calculated based on the WCB trajectories defining a WCB mask. In contrast, WCB impact metrics are Eulerian properties, derived from the statistical value of a variable (e.g., precipitation rate or low-level PV) over all grid points inside the two-dimensional Eulerian WCB mask. To clearly distinguish between a meteorological field (e.g., precipitation rate) and the resulting WCB impact metric, we use different abbreviations (e.g., PQ90) for the latter.
Three measures of WCB characteristics are calculated as follows:
-
Intensity. The number of WCB trajectories inside a WCB ascent mask defines the WCB intensity. As trajectories start from an equidistant grid (Δx=80 km) and equally spaced pressure levels (Δp=20 hPa), each trajectory represents a constant mass. Thus, the total number of trajectories in a WCB trajectory bundle represents the air mass that is transported by the WCB. This concept was also applied by Binder et al. (2016), who quantified the WCB intensity accordingly and found a positive correlation with the cyclone deepening rate.
-
Ascent rate. We define the WCB ascent rate as the mean pressure change in the trajectories that define the WCB ascent mask at a specific time step. For each trajectory, we calculate the pressure change during the last 3 h prior to the arrival in the WCB ascent mask and then take the average over all trajectories. Short episodes of enhanced ascent rates are also captured by taking a 3 h window.
-
Ascent curvature. So far, the WCB curvature has never been investigated systematically. In a case study, Martínez-Alvarado et al. (2014) used the potential temperature at the end of the WCB ascent (48 h after the start of the trajectories) to identify the cyclonic and anticyclonic branches. However, this approach is unsuitable for a global and climatological study due to the decreasing tropopause height towards the poles, potentially creating a bias at high/low latitudes. Thus, in the present study, we first classify each WCB trajectory based on its change in direction during the ascent and subsequently calculate the share of cyclonically or anticyclonically ascending trajectories in the WCB ascent mask. More specifically, the curvature of each individual trajectory is calculated as the mean change in direction (in degrees) between two time instances. The first time instance is defined as the time step the trajectory is first located at a pressure below 600 hPa (tp600). The second time instance is defined at the time step 12 h after tp600; however, it must not exceed 48 h after the starting time of the trajectory. The hourly change in direction between these two time instances is then averaged. By limiting the time span to a maximum of 12 h, we avoid the anticyclonic curvature that most WCB trajectories experience towards the end of the ascent and focus on the actual ascent direction. A mean change in direction of more than 4° h−1 is defined as a cyclonic ascent, and a change in the direction of less than −2° h−1 is defined as an anticyclonic ascent. The asymmetry in threshold values arises from the observation that the trajectories of the anticyclonic branch frequently exhibit an initial cyclonic ascent. Thus, only trajectories that are characterized by a distinct cyclonic curvature are considered for the cyclonic WCB branch. Ascent curvature values in between are defined as a straightly or weakly curved ascent. The thresholds were chosen based on multiple case studies. To quantify the ascent curvature of the WCB mask, we define it as the ratio of cyclonically or anticyclonically curved trajectories to the total number of trajectories that defines a WCB mask. Figure 4 illustrates the WCB case described by Martínez-Alvarado et al. (2014) and how the different WCB branches are well identified with the presented method except for a few trajectories that are classified as cyclonically ascending (green), although turning eastward, likely due to an initial strong cyclonic curvature. Furthermore, a clear separation between the non-curved and anticyclonically curved branches is often difficult and artificial as the eastward direction of the large-scale flow leads to an anticyclonic curvature of both branches. However, we found in several case studies that this objective method results in a reasonable identification of WCB branches. In this case and at this moment in time, cyclonic, anticyclonic, and non-curved trajectories account for 25 %, 7 %, and 68 % of the WCB, respectively.
-
Outflow pressure level. To characterize where the WCB outflow masks are located vertically, we calculate the median pressure of all trajectories located in a WCB outflow mask at each time instance. This metric is used to study differences in the outflow of the different WCB branches.
The four WCB impacts, related to precipitation and PV, are quantified as follows:
-
Precipitation rate and volume (PQ90, PVOL). We quantify the precipitation rate associated with each WCB at a specific time by calculating the 90th percentile of total precipitation rates (convective + large-scale precipitation rate, PQ90) of all grid points inside the WCB ascent mask. This metric thereby also captures small-scale areas of locally intense precipitation. Additionally, for each grid cell inside the WCB ascent mask, we calculate the volume of precipitation (grid cell area × precipitation rate). The sum of these precipitation volumes over all grid cells inside a WCB ascent mask equals the total precipitation volume (PVOL) of the WCB at a specific time over 1 h.
-
Low-level PV (LLPV). The precipitation formation along the WCB leads to the release of latent heat. The vertical gradient in the diabatic heating rates leads to PV production below the heating maximum. To quantify the impact of WCBs on the PV distribution at low levels, we first calculate vertically averaged PV between 750–950 hPa at each grid point inside the WCB ascent mask. Since the background PV at lower altitudes is relatively small (approx. 0.5 pvu) and exhibits only a weak seasonal cycle, we take the in situ values instead of the anomaly. We calculate the low-level PV (LLPV) metric of a WCB mask as the 90th percentile of the vertically averaged PV values of the grid points inside the mask. The 90th percentile was chosen because the area of enhanced PV values often accounts only for a small part of the whole WCB ascent mask.
-
Upper-level PV anomaly (ULPVA). Diabatic PV destruction above the level of maximum latent heat release and upward advection of low-PV air masses in a WCB leads to a region of anomalously low PV values in the area of WCB outflows. To quantify this impact, we first vertically average PV at all grid points inside a WCB outflow mask between 200–375 hPa. The monthly 42-year climatology of vertically averaged PV over the same pressure range is then subtracted to get a PV anomaly. The subsequent upper-level PV anomaly (ULPVA) is defined as the median of the anomaly values of all grid points inside the WCB outflow mask. As the negative upper-level PV anomaly often accounts for a majority of the region of WCB outflow, the median is a reasonable measure to quantify it. Furthermore, taking the median of all grid values proves to be resilient to outliers, e.g., very large PV values close to a strong PV gradient. Note that this approach quantifies the total negative PV anomaly in the region of WCB outflow and therefore does not allow for assessing the importance of diabatic PV destruction. However, we are confident that the chosen approach can provide valuable insight into the impacts of WCBs at upper levels.
In addition to the WCB's characteristics and impacts, we also quantify the evolution of the cyclone that is linked to each WCB mask (see last paragraph in Sect. 2.2.2) using the central pressure and its deepening rate. Sanders and Gyakum (1980) defined the deepening rate ΔSLPB in units of Bergeron as the change in minimum SLP over 24 h, normalized by , where ϕ refers to the mean latitude of the cyclone center during this time interval. A deepening rate of 1 Bergeron corresponds to a deepening of 24 hPa in 24 h at 60° N. The calculation implies a minimum cyclone lifetime of 24 h. Rapidly intensifying cyclones with a maximum ΔSLPB > 1 Bergeron are referred to as “bombs” (Sanders and Gyakum, 1980). The evolution of the deepening rate along the life cycle of each cyclone allows for defining the time step of the most intense deepening as the center of the 24 h period that results in the largest ΔSLPB. The WCB masks are attributed not only to metrics describing their characteristics and impacts but also to their position in time relative to the time step of the most intense deepening of the associated cyclone.
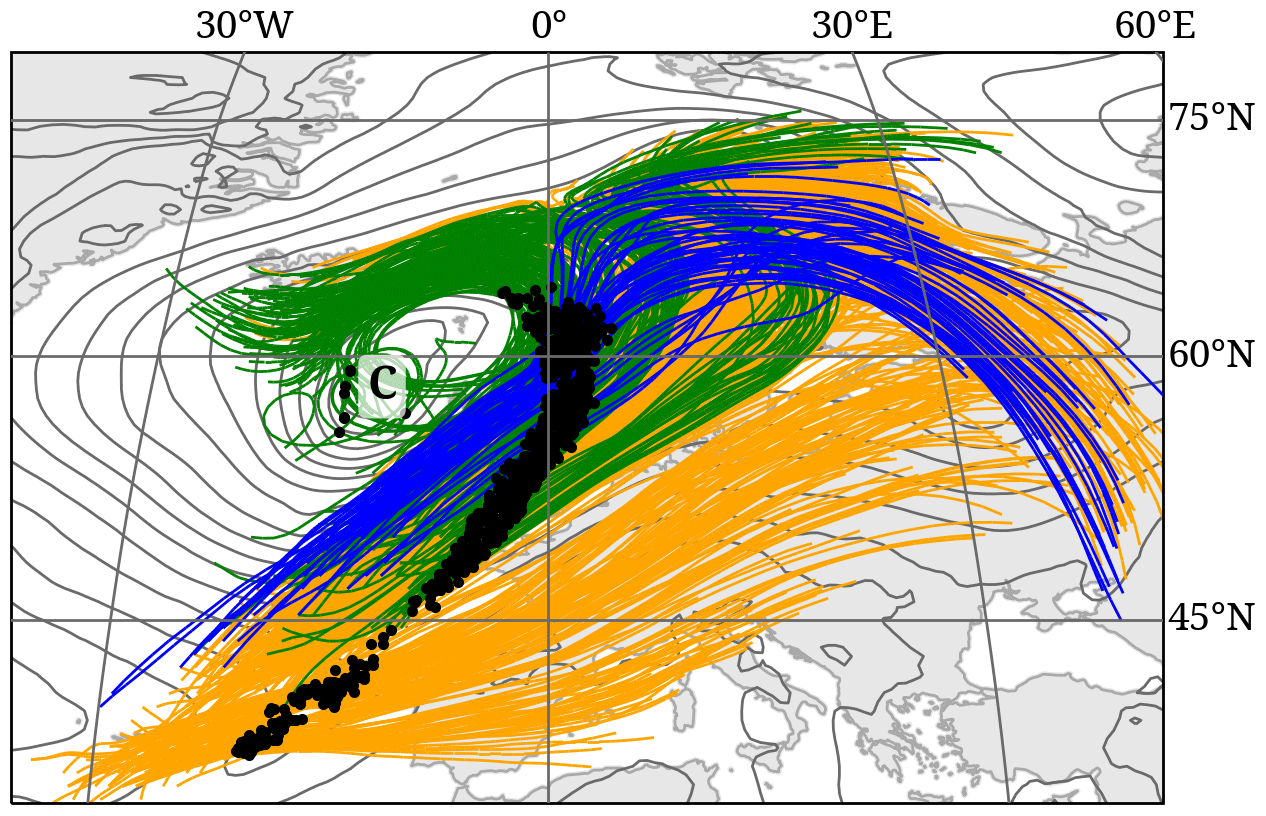
Figure 4The 48 h WCB trajectories for the dichotomous WCB case described by Martínez-Alvarado et al. (2014), located between 500–800 hPa at 00:00 UTC on 25 November 2009 (black dots) and ascending cyclonically (green), anticyclonically (blue), or without a distinct curvature (orange). The letter “C” marks the position of the cyclone center, and the grey contours show SLP (every 4 hPa) at 00:00 UTC on 25 November 2009.
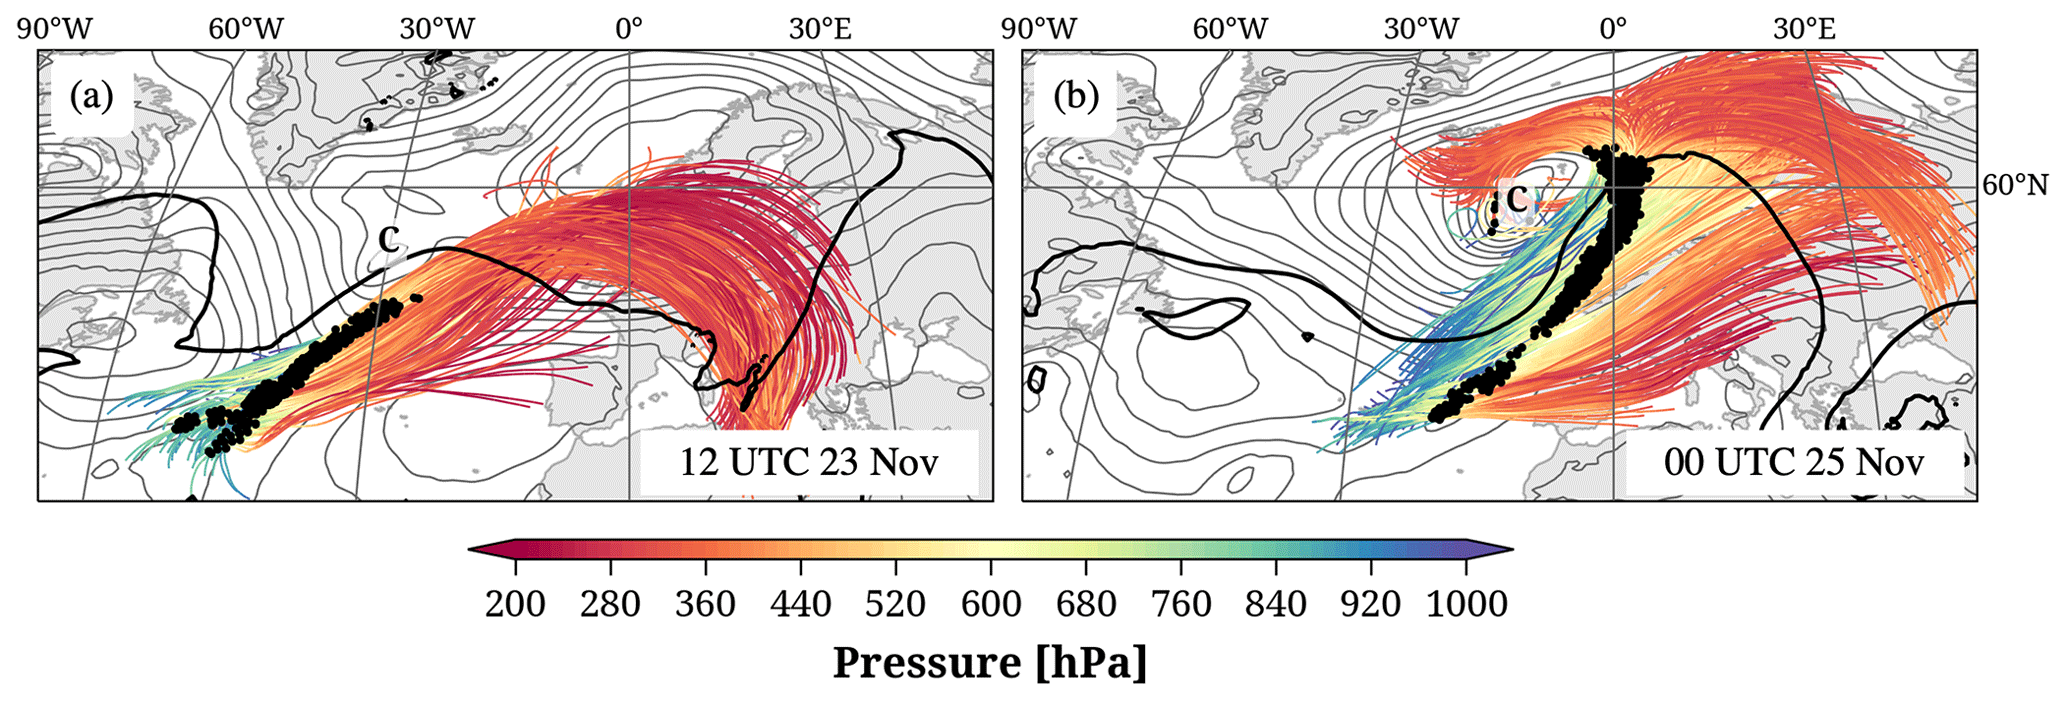
Figure 5The 48 h WCB trajectories (colored by pressure; hPa) associated with Case 1. Trajectories that contribute to the WCB ascent mask (500–800 hPa) at (a) 12:00 UTC on 23 November and (b) 00:00 UTC on 25 November 2009 are shown. The black dots mark the position of the WCB air parcels at the respective time step, the grey contours show SLP (every 4 hPa), and the dashed black line is the 2 pvu contour at 320 K at the respective time.
To summarize, the resulting dataset consists of 42 years (1980–2022) of two-dimensional Eulerian WCB mask objects that define the WCB inflow, ascent, and outflow region every 6 h and globally. A set of metrics describes the characteristics and impacts of each WCB mask. Attributing each WCB mask to a specific cyclone allows for an investigation of the WCB metrics along the cyclone life cycle. Additionally, we calculated individual outflow masks and their characteristics and impacts specifically for the cyclonic and anticyclonic WCB branches.
We first utilize the developed method to assess the characteristics and impacts of WCBs in three case studies of North Atlantic cyclones. Starting with case studies serves two purposes: it enables a detailed analysis of how WCB characteristics and impacts relate to the overall synoptic-scale setting and evolution of the cyclones, and it helps to identify the strengths and limitations of the method. A generalized climatological analysis is presented in Sect. 4. After performing about 10 detailed case studies, three cyclones were selected to be presented here and in the Supplement, which (i) are well documented in the literature and therefore known to the community and (ii) reveal interesting similarities and differences. The first case in November 2009 featured a clear separation of the cyclonic and anticyclonic WCB branches and is discussed in the following. The second case was an extremely strong cyclone that occurred in January 1989 and that was associated with intense precipitation. The third case in November 1992 revisits the first WCB that was investigated in detail based on trajectory calculations (Wernli, 1997). In the following, the cyclone and WCB occurring in November 2009 are discussed in detail. For the discussion of the second and third case studies, the reader is referred to Sects. S1 and S2.
Due to the complex synoptic situations associated with the 2009 and 1992 cases, we manually attributed WCB trajectories to the respective cyclones. The limitations of an objective attribution of WCBs and cyclones are discussed in Sect. 5. For all cases, we start with a qualitative discussion of WCB characteristics and impacts at selected time steps before quantitatively discussing the evolution of the WCB metrics along the life cycle of the cyclones.
3.1 Case 1: November 2009, North Atlantic
In November 2009, UK scientists performed a research flight into a North Atlantic cyclone with a prominent WCB to test their experimental setup for the North Atlantic waveguide and downstream impact experiment in 2016 (NAWDEX; Schäfler et al., 2018). Knippertz et al. (2010) analyzed a vertical profile along the flight and found an enhanced moisture content between 770–900 hPa, linked to the ascent of the WCB from the moist planetary boundary layer. Numerical simulations of this WCB were investigated in detail by Martínez-Alvarado et al. (2014) as it featured a distinct split at its northern end into an anticyclonic (W1) and a cyclonic (W2) branch. The W1 branch initially had higher values of q, ascended along the cold front south of the cyclone, and arrived at higher outflow altitudes than the cyclonically curved W2 branch. The split of the WCB into these two branches was reported to occur early in the WCB's evolution. We selected this well-documented WCB case to assess how well our method identifies the different WCB branches and their respective characteristics. In addition to the analysis of the WCB branches, we investigate the characteristics and impacts of the WCB at individual time steps as well as along the cyclone life cycle.
3.1.1 WCB characteristics
The cyclone and its associated WCB are shown at two different time steps in Fig. 5. A total of 13 h after genesis, at 12:00 UTC on 23 November 2009 (Fig. 5a), the developing cyclone is located at about 50° N and 30° W, southwest of a mature cyclone. At upper levels, a high-PV trough is located upstream of the cyclone, indicated by the 2 pvu line on 320 K. The WCB trajectories that define the ascent mask at this moment start at the southern tip of the PV trough and ascend in an elongated region ahead of it (indicated by black dots in Fig. 5a). The bundle of trajectories remains coherent during the ascent and without a distinct curvature. At upper levels, the trajectories reach into the developing ridge downstream of the cyclone and thereby turn anticyclonically. The WCB becomes less coherent over the following 36 h and can be divided into three branches at 00:00 UTC on 25 November (Fig. 5b), about a day after the time of the strongest intensity of the associated cyclone. WCB trajectories ascending along the northern part of the cold front turn anticyclonically (W1), while trajectories ascending close to the cyclone center turn cyclonically (W2). WCB trajectories starting from the southern end of the cold front ascend without a distinct curvature (non-curved) and are located at 315 hPa 48 h later, 30 hPa above the rest of the WCB trajectory bundle. The classification of the trajectories into three branches depending on their change in direction during the ascent was also illustrated in Fig. 3 (see Sect. 2.4). In contrast, Martínez-Alvarado et al. (2014) investigated the same WCB case and distinguished two WCB branches based on the potential temperature at the end of the ascent of WCB trajectories that were calculated with different limited-area models (COSMO, Met Office Unified Model) and started at 18:00 UTC on 23 November. However, the pathway of the trajectories of Martínez-Alvarado et al. (2014) is very similar to the trajectories shown in Fig. 5b. Intriguingly, the branch classification based on the change in direction results in very similar conclusions regarding the characteristics of the WCB branches as in Martínez-Alvarado et al. (2014). Compared to W2, W1 has higher initial values of q (about 9 vs. 8 g kg−1) and experiences stronger latent heating such that its outflow occurs on a higher isentrope (about 310 vs. 305 K), consistent with Martínez-Alvarado et al. (2014).
3.1.2 WCB impacts
Figure 6 shows the precipitation rate, low-level PV, and upper-level PV anomaly in the region of the WCB ascent and outflow at three selected time steps. The WCB ascent mask at 12:00 UTC on 23 November (defined by the trajectories shown in Fig. 5a) and the precipitation rate are shown in Fig. 6a. The band of WCB ascent aligns well with an elongated band of precipitation, with the most intense precipitation located in its center (>4 mm h−1). No significant precipitation occurs at this moment in the emerging cyclone center. A total of 12 h later (Fig. 6b), the region of WCB ascent has moved eastward, and the cyclone has intensified. The WCB ascends along the elongated cold front and close to the cyclone center. The most intense precipitation still occurs along the cold front, but weak precipitation also forms near the cyclone center. Weak precipitation along the cyclone's warm front, south of Ireland, is not associated with the WCB ascent. A day later (Fig. 6c), the cyclone has intensified noticeably while moving northeastwards. The WCB ascent mask (defined by trajectories shown in Fig. 5b) reaches from around 40 to 65° N and coincides with the cyclone's cold front. The northwestward extension of the WCB ascent mask at high latitudes indicates the split of the WCB as illustrated in Fig. 5b. The majority of precipitation is still formed along the cyclone's cold front, inside the WCB ascent mask and with enhanced intensity at lower latitudes. The warm front and cyclone center are associated with weak precipitation rates only.
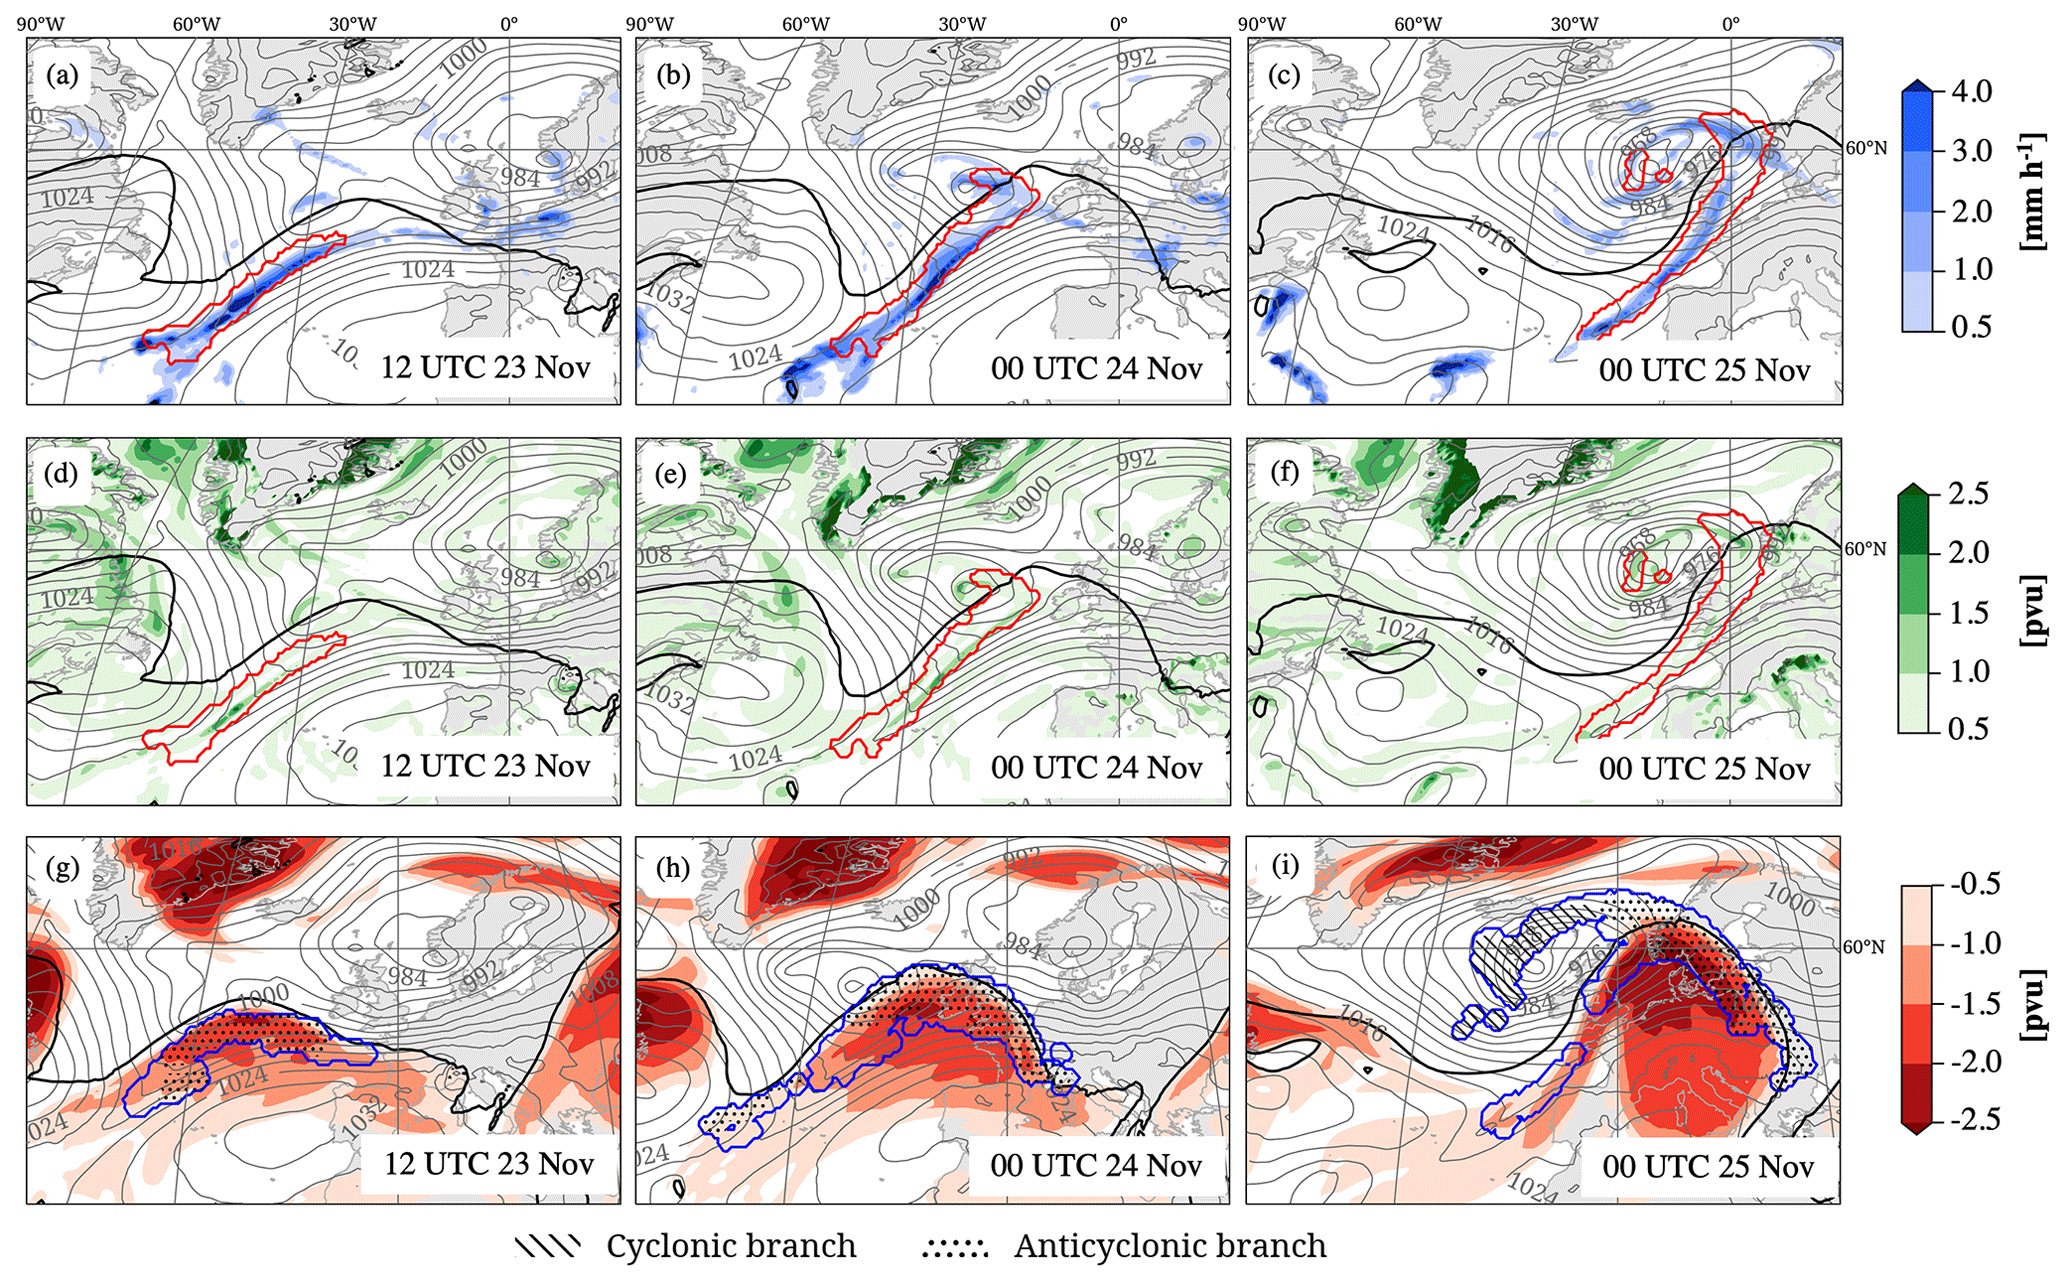
Figure 6WCB-related impacts of Case 1 (22–29 November 2009) in terms of (a–c) precipitation rate (mm h−1, blue shading), (d–f) low-level PV (pvu, green shading), and (g–i) upper-level PV (pvu, red shading) as well as the location of the WCB ascent and outflow masks (red and blue contours, respectively), SLP (grey contours every 4 hPa), and 2 pvu contour on 320 K (pvu, black line). The hatching in the WCB outflow mask indicates the outflow of the cyclonic (dashed) and anticyclonic (dotted) WCB branches (see text for details). All fields are shown at the times indicated in the lower-right corners of the panels.
Prior to cyclone intensification, the WCB ascent mask coincides with an elongated band of enhanced low-level PV (Fig. 6d). A small region of distinctively enhanced values embedded in this band aligns with the previously described region of intense precipitation rates (Fig. 6a). The cyclone center is characterized by only weakly enhanced low-level PV values at this moment. A total of 12 h later (Fig. 6e), the low-level PV distribution in the region of WCB ascent is still similar. The region of the most enhanced low-level PV coincides with the region of the most intense precipitation rates at this time (Fig. 6b). A region of enhanced low-level PV close to the cyclone center is slightly outside of the WCB ascent mask. Note that in an idealized study, Schemm and Wernli (2014) explained this by diabatic low-level PV production beneath the WCB and subsequent westward advection at low levels into the cyclone center. At 00:00 UTC on 25 November (Fig. 6f), almost the entire region of WCB ascent is associated with low-level PV values between 0.5–2 pvu. The precipitation rates in the region of the most intense low-level PV values are no longer distinctively enhanced. Near the cyclone center, low-level PV values are enhanced and partially coincide with WCB ascent.
At upper levels at 12:00 UTC on 23 November (Fig. 6g), some WCB trajectories arrive at the northern edge of the ridge that develops downstream of the cyclone. The emerging ridge is characterized by a negative upper-level PV anomaly with the most intense values (approx. −2 pvu) in the region of the WCB outflow, which is mainly formed by anticyclonically curved WCB trajectories. The ULPVA in the outflow region of the anticyclonic branch equals −1.6 pvu. The area of the negative PV anomaly increases during the following 12 h when the ridge becomes more pronounced (Fig. 6h). Similar to the previous time step, the most intense PV anomaly is located in the northern part of the ridge and in the region of WCB outflow. The ULPVA inside the outflow region of the anticyclonic branch, which makes up the majority of the entire WCB outflow mask, has become less intense and equals −1.2 pvu. At 00:00 UTC on 25 November (Fig. 6i), the split in the WCB trajectory bundle becomes apparent. The WCB outflow along the northeastern edge of the ridge is formed by the anticyclonic WCB branch and coincides with the negative PV anomaly inside the ridge, while the outflow of the cyclonic branch bends towards the cyclone center. As a result, the ULPVA inside the outflow of the anticyclonic branch equals −1.2 pvu, whereas the outflow of the cyclonic branch is characterized by a ULPVA of 1.4 pvu.
3.1.3 Evolution of WCB metrics
Figure 7 shows the evolution of the WCB's characteristics and impacts along the cyclone life cycle. The cyclone forms at 23:00 UTC on 22 November and starts its main intensification phase at 10:00 UTC on 23 November (Fig. 7a). The cyclone classifies as a bomb cyclone with a maximum deepening rate of 1.2 Bergeron at 22:00 UTC on 23 November. The pressure in the cyclone's center continues to decrease after the main intensification phase and finally reaches a minimum of 956.2 hPa at 07:00 UTC on 25 November. Afterward, the cyclone weakens for 4 d before it disappears. The intensity of the WCB increases in two phases (Fig. 7b). The first WCB ascent mask appears at 06:00 UTC on 22 November. After that, the number of WCB trajectories in the ascent phase increases to 456 at 18:00 UTC on 23 November, followed by a slight weakening. Finally, 733 WCB trajectories ascend at 00:00 UTC on 25 November, shortly before the cyclone reaches its minimum SLP. Thereafter, the number of trajectories in the WCB ascent decreases rapidly. The WCB first reaches the region of WCB outflow at 00:00 UTC on 23 November, 18 h after the first appearance of the WCB ascent mask. After a rapid increase in WCB outflow intensity, it remains constant for about 2.5 d and, after that, decreases rapidly.
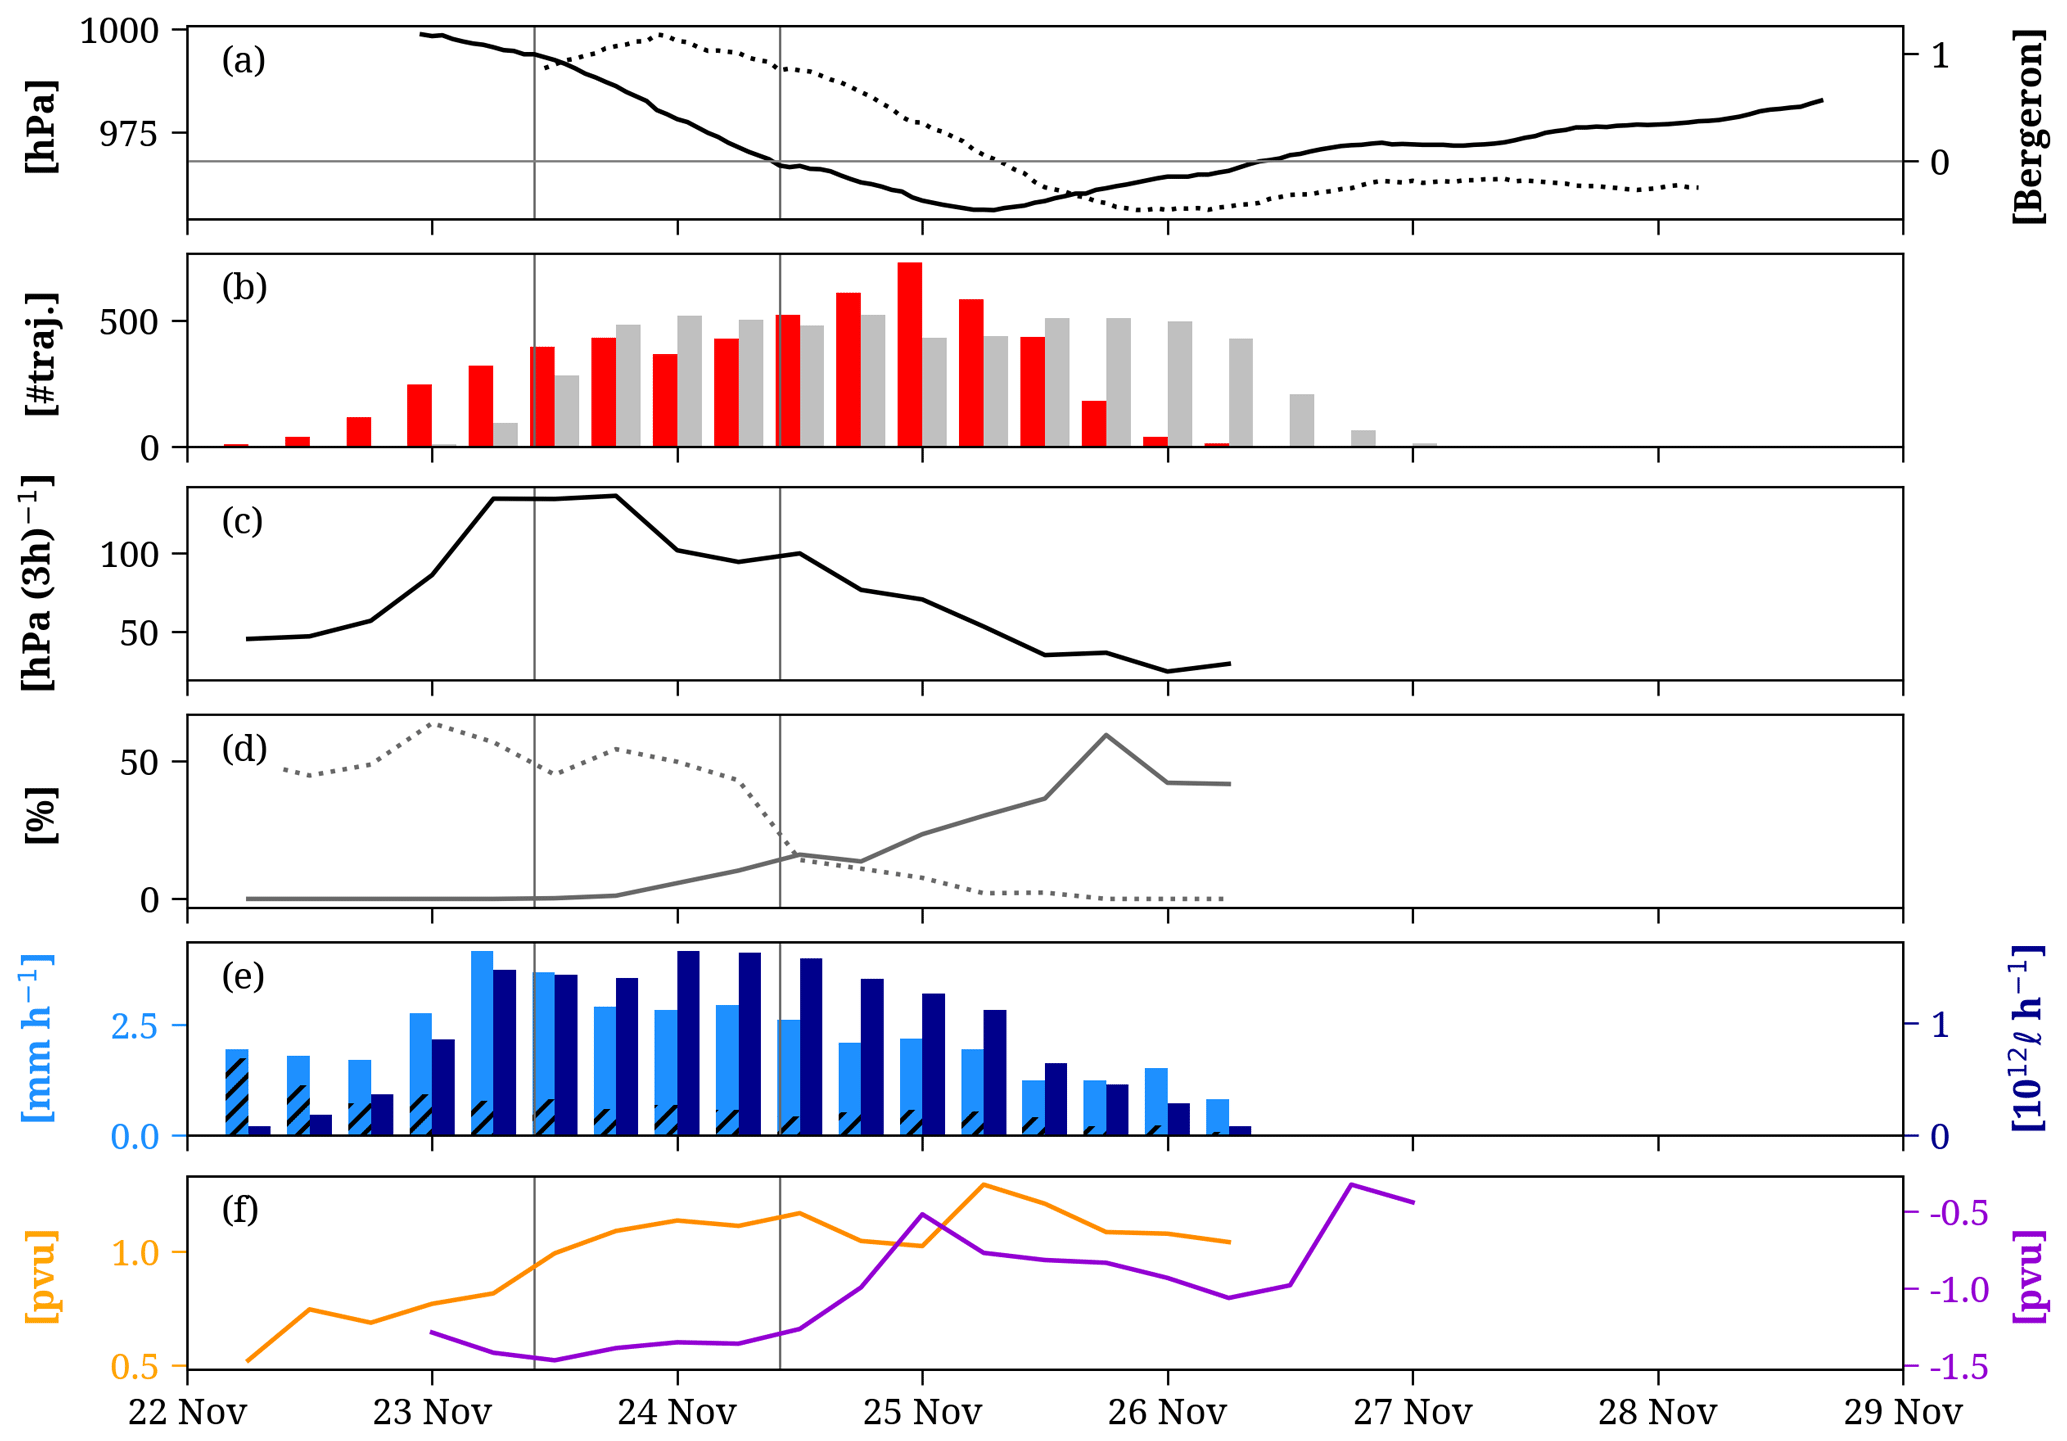
Figure 7Temporal evolution of cyclone characteristics and WCB characteristics and impacts for Case 1 (22–29 November 2009): (a) the cyclone's central pressure (solid, hPa) and deepening rate in the center of the 24 h window (Bergeron, dotted); (b) intensity of WCB ascent (number of trajectories, red) and outflow (number of trajectories, grey); (c) mean ascent rate (hPa (3 h)−1); (d) percentage of cyclonically (%, solid) and anticyclonically ascending trajectories (%, dotted); (e) convective precipitation (mm h−1, hatched), PQ90 (mm h−1, light blue), and PVOL (1012 ℓ h−1, dark blue); and (f) LLPV (pvu, orange) and ULPVA (pvu, violet). The vertical lines denote the 24 h period of the strongest cyclone intensification.
The WCB trajectories that ascend in these two phases differ in their characteristics. The first peak in WCB intensity is associated with rapidly ascending trajectories (up to 134 hPa (3 h)−1, Fig. 7c), which ascend mainly anticyclonically (Fig. 7d). During the second peak in WCB intensity, the WCB trajectories ascend more slowly, many of them cyclonically.
The impacts of the WCB also vary over time. The first phase of enhanced WCB intensity is associated with the most intense PQ90 (Fig. 7e, light blue), potentially linked to the enhanced ascent rates of the WCB during this phase (Fig. 7c). The convective precipitation rate decreases as the cyclone and WCB ascent regions move poleward. During the cyclone's main intensification period, PQ90 remains at around 2.6 mm h−1, before it decreases gradually. The resulting PVOL (Fig. 7e, dark blue) peaks 18 h after the peak in PQ90 and a day before the WCB reaches its maximum intensity. Once the WCB intensity decreases, PVOL also decreases rapidly.
As shown above, the precipitation formation along the cold front and cyclone center leads to diabatic PV modification. LLPV increases from 0.5 pvu to more than 1 pvu along the cyclone life cycle (Fig. 7f, orange line). The northward movement and, thus, an increase in the Coriolis parameter explain why LLPV remains high at later stages in the cyclone life cycle although latent heating becomes weaker. Finally, we consider the evolution of ULPVA. It is most intense during cyclone intensification (−1.5 pvu, purple line) when the WCB outflow covers mainly the northern edge of the ridge that developed downstream of the cyclone. The increase in the intensity of the cyclonic branch leads to a decreasing ULPVA. As shown in Fig. 6i, the outflow of the cyclonic branch is located west of the ridge and in a region of weak PV anomalies in the considered layer. Thus, ULPVA equals −0.5 pvu at 00:00 UTC on 25 November. Afterward, ULPVA slightly intensifies again when the cyclonic WCB branch transports low-PV air from the ridge towards the northwest (not shown in Fig. 6). The weakening ULPVA in the final phase of the WCB outflow is less robust due to the small number of WCB trajectories at this moment.
This case study was characterized by a distinctive split of the WCB into prominent branches with cyclonic and anticyclonic curvature during the ascent. Our method identified these branches and the differences in their characteristics well, as shown by the comparison with Martínez-Alvarado et al. (2014). Furthermore, we found that the increase in the share of cyclonically ascending trajectories during the cyclone life cycle is associated with a decrease in WCB ascent rate (PQ90), a weakening of ULPVA, and an increase in LLPV.
3.2 Comparison of case studies
We applied the developed method to quantify the characteristics and impacts of WCBs that are linked to three cases of intense North Atlantic cyclones. Refer to Sects. S1 and S2 in the Supplement for a detailed analysis of the second and third cases that occurred in January 1989 and November 1992. Although all three case study cyclones showed a strong deepening, the temporal evolution of the associated WCBs differed in some key elements. First, the onset of the WCB can either coincide with the genesis of the cyclone or it may precede the cyclone. In the IOP4 storm of 1989, the WCB was first detected in the ascent layer (500–800 hPa) about 12 h after cyclogenesis. In contrast, in the 1992 and 2009 cases, the WCBs ascend 18 and 60 h before cyclogenesis. The complex synoptic situation in the 2009 and 1992 cases required a manual attribution of trajectories to the respective cyclones. Thus, such early onsets of the WCB relative to the cyclone life cycle are not included in the objective method to attribute WCB masks to cyclones presented in the following climatology. In all three cases, the WCB started to weaken when the cyclone reached its maximum intensity. However, the three cases differed in their maximum WCB intensity. During the 1992 case, about 1000 trajectories formed the WCB ascent mask, twice as many as during the first and second cases. A reason for this could be the widespread upper-level forcing in the third case, which favors the ascent of air over a large region. Another explanation could be different amounts of moisture transported by the WCB. However, this characteristic of the WCB was not considered in this study.
Another qualitative key difference between the cases concerns the formation of a cyclonic branch. While the share of cyclonically ascending trajectories increased to 63 % and 49 % in the second and third cases, respectively, it reached only 10 % in the first case. Regarding WCB-related impacts, in the first two cases, PQ90 was the most intense around the cyclone's intensification period. In contrast, in the third case, the most intense PQ90 occurred when the WCB ascended at low latitudes early in the cyclone's life cycle. In all three cases, the period of enhanced PQ90 went along with enhanced ascent rates. The PVOL peaked around the cyclone's intensification period for all three cases. Its temporal evolution is linked to the corresponding evolution of the WCB intensity and precipitation rates. During the 2009 case, PVOL peaked in a phase of weaker WCB intensity. This could be related to the relatively high PQ90 at this stage in the cyclone life cycle.
All three cases showed a clear increase in low-level PV in the area of WCB ascent. In the 2009 and 1992 cases, LLPV increased gradually over 3 d from 0.5 to 1.5 pvu. In the 1989 case, LLPV increased rapidly from 0.5 to 1.75 pvu within just 24 h during the cyclone intensification period. This period was also associated with the cyclone's exceptionally high deepening and precipitation rates, coinciding with the WCB ascent near the cyclone center, leading to diabatically produced low-level PV. When the region of the WCB ascent migrated away from the cyclone center, the PQ90 and, consistently, the LLPV decreased. In contrast, the 2009 and 1992 WCBs were associated with less rapidly intensifying cyclones and weaker precipitation rates, ascending largely at a greater distance to the cyclone center.
At upper levels, the temporal evolution of the PV anomaly in the region of the WCB outflow differed between the cases. In the 1989 and 1992 cases, the ULPVA was the strongest 12–24 h after the main cyclone intensification period and after the peak in WCB intensity. The intensification of the ULPVA was the strongest for the 1989 WCB, potentially linked to the intense precipitation rates and thus strong latent heat release, which potentially leads to a higher WCB outflow altitude. As a result, the WCB outflow was characterized by a ULPVA of around −2 pvu. The ULPVA was similarly negative for the 1992 case, which had an extremely intense WCB. The strong cyclonic branch resulted in a westward extension of the WCB outflow region, where ULPVA was much weaker.
All three case studies exhibited a maximum ΔSLPB greater than 1 Bergeron. However, the following climatology includes all cyclones with a positive maximum ΔSLPB. To put the results from the case studies into perspective and to investigate how the cyclone intensity affects the temporal evolution of the WCB, we also present a climatology of WCBs associated with cyclones with a maximum ΔSLPB greater than 1 Bergeron.
The method to quantify WCB characteristics and impacts was applied in the previous sections to selected case studies and showed an interesting evolution of these metrics along the cyclone life cycle. As a specific aspect, we found distinct differences in the cyclone-relative location and magnitude of the respective ULPVA associated with the outflow of the cyclonic and anticyclonic branches of the WCB and generally an increase in the intensity of the cyclonic branch during and after cyclone intensification. However, the three cases, all intense North Atlantic cyclones with explosive deepening, are not climatologically representative. Therefore, in the following, in order to put the results from the case studies into perspective, we quantify the characteristics and impacts of all WCBs associated with a representative set of winter (December–February, DJF) cyclones in the North Atlantic to systematically study the evolution of these metrics and their variability along the cyclone life cycle (Sect. 4.1). The analysis also specifically considers differences between the cyclonic and anticyclonic branches of WCBs (Sect. 4.2).
To this aim, we first selected a subset of cyclones in DJF from the 1980–2022 ERA5 period with a typical pressure evolution. Specifically, we only consider cyclones with a maximum ΔSLPB > 0; i.e., the cyclones have to exist for at least 24 h and experience a decrease in cental SLP during this period (see Sect. 2.2.3 for details concerning ΔSLPB). About 8700 cyclones fulfill these criteria in the North Atlantic (cyclone track starts between 20–80° N and 105° W–15° E) in DJF between 1980–2022. In the second step, we only consider cyclones that are linked to a WCB ascent mask at one point in their life cycle. This criterion is fulfilled for 57 % of all cyclones in the North Atlantic with a positive ΔSLPB (approx. 5000). Eckhardt et al. (2004) investigated cyclones in the entire Northern Hemisphere and found 60 % of all cyclones associated with a WCB. However, Eckhardt et al. (2004) applied different selection criteria for cyclones and WCBs, such as a cyclone deepening of at least 10 hPa. If we consider cyclones in the Northern Hemisphere with a deepening rate of at least 0.4 Bergeron, which corresponds to 10 hPa in 24 h at 60° N, we also find that 59.1 % of these cyclones are accompanied by a WCB, consistent with Eckhardt et al. (2004). This finding is intriguing as it highlights the robustness of the link between cyclones and WCBs that is seemingly unaffected by the difference in the dataset, WCB definition, and cyclone identification algorithm employed in Eckhardt et al. (2004) compared to the present study.
To make the time evolution for the 5000 cyclones comparable, we centered each cyclone track around the time of the strongest 24 h intensification, with the center of the 24 h time window defined as the relative time trel=0 h. Figure 8 shows how often cyclones (grey bars) are present as a function of trel. The cyclone selection criteria mentioned above lead to a constant number of approx. 5000 cyclones during the 24 h window between to +12 h. The distribution is skewed towards later times in the cyclone life cycle, indicating that the strongest intensification occurs more often in the early stages of the cyclone life cycle. The averaged evolution of the central SLP of these cyclones (black line, Fig. 8) shows a value of about 1000 hPa before intensification and a drop to about 983 hPa during the 24 h of maximum intensification. Most WCB ascent masks (red bars, Fig. 8) associated with this subset of cyclones are present between to +3 h, thus during maximum cyclone intensification. In contrast, the largest number of WCB outflow masks exists between trel=15 to 21 h. These variations in the number of WCB masks present during the cyclone life cycle must be considered in the subsequent analysis.
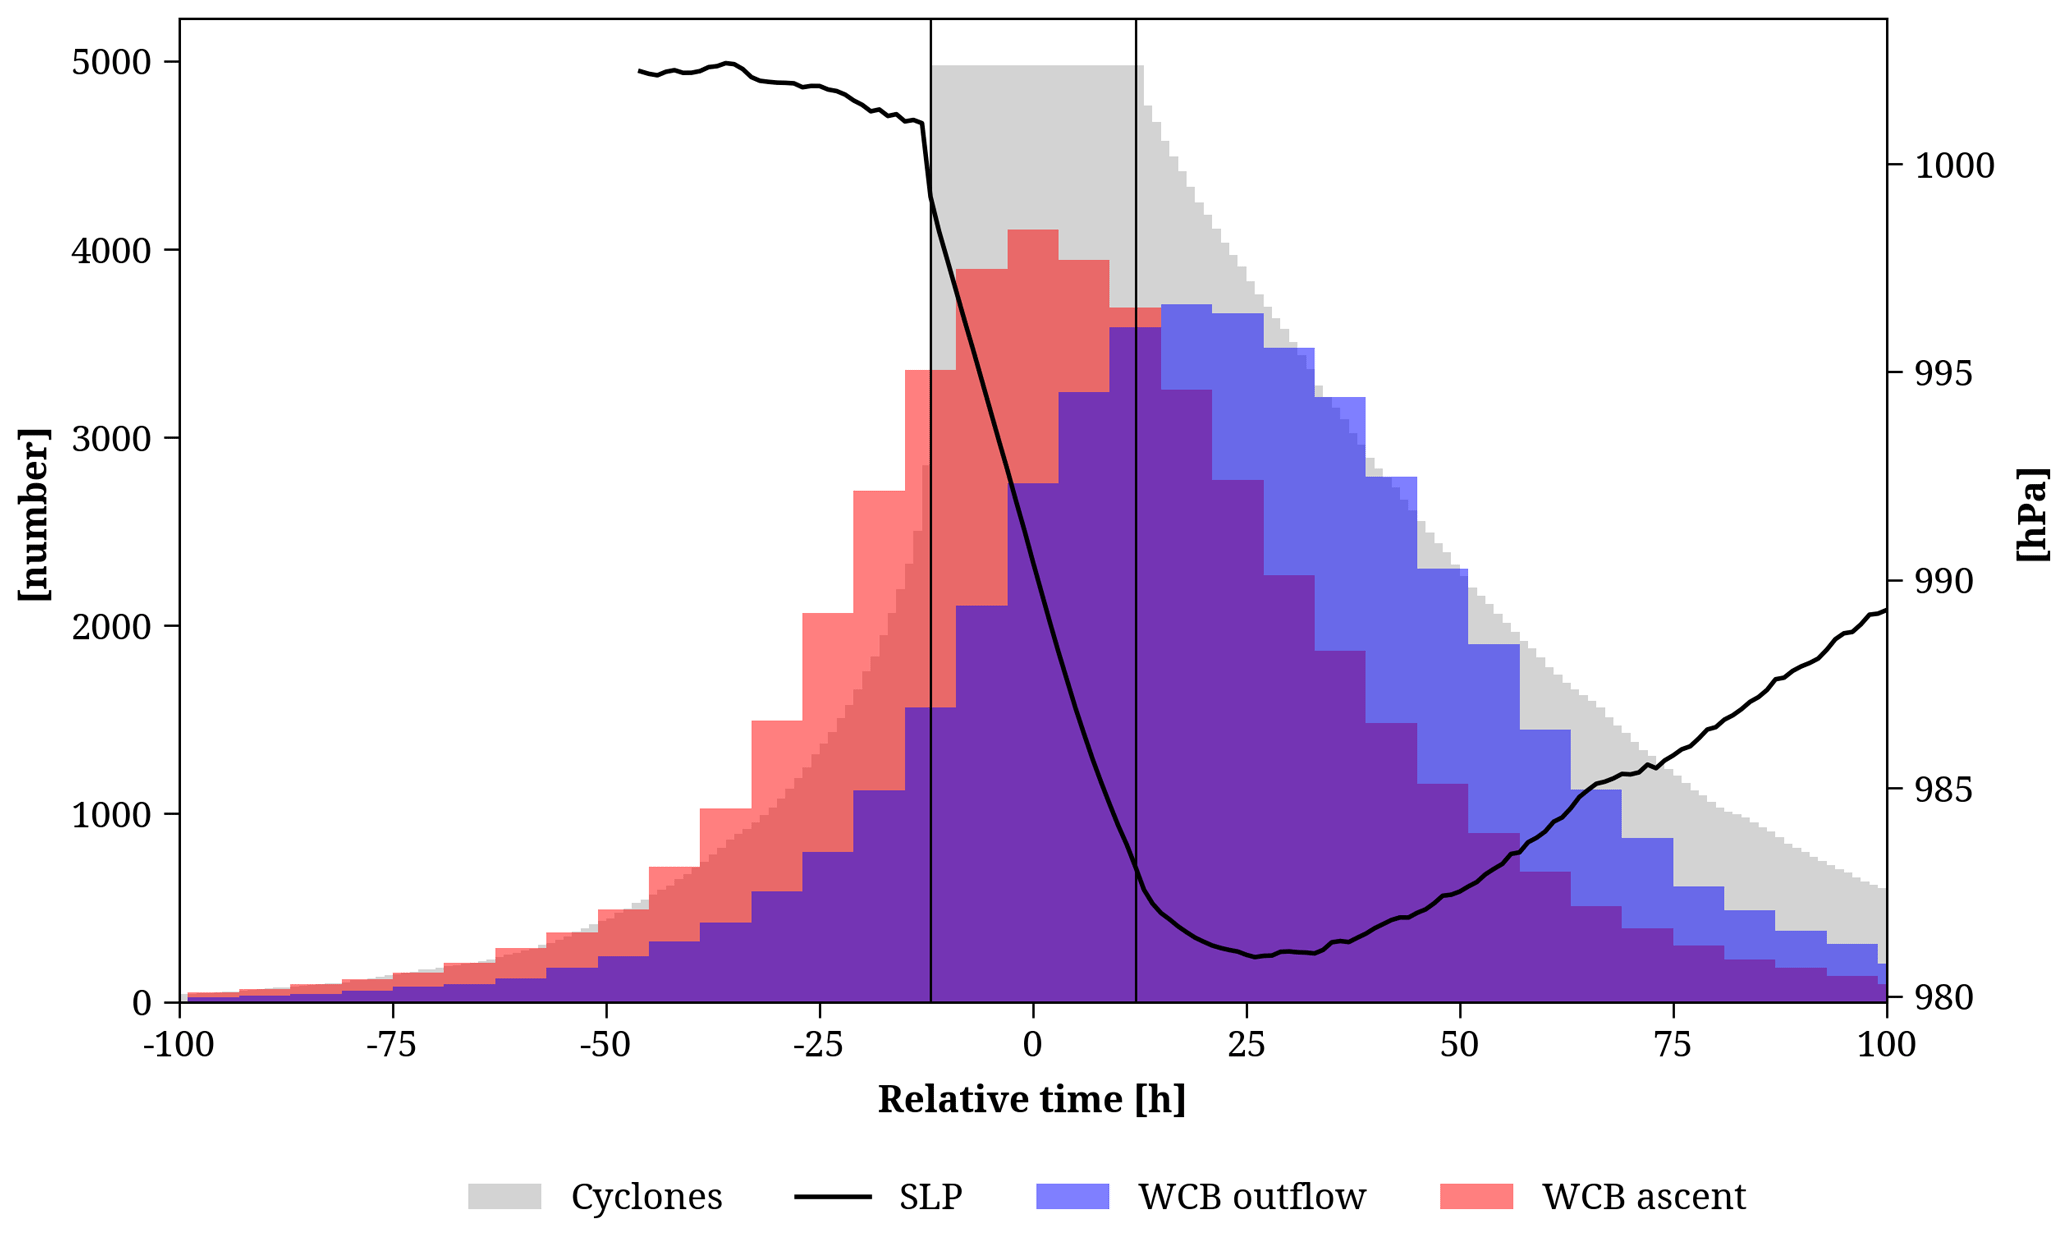
Figure 8Number of selected cyclones (grey) and their associated WCB ascent (red) and outflow masks (blue) at different time instances during the cyclone life cycle, centered around the time of the strongest cyclone deepening (see text for details). The average pressure of this subset of cyclones (hPa, black line) is shown for time instances with at least 500 cyclones.
The following results are based on WCB masks that contain at least 10 trajectories to ensure a sufficiently large WCB mask area. Based on this set of cyclones and their WCBs, we investigate how the region of frequent WCB ascent, the WCB characteristic and impact metrics, and the cyclonic and anticyclonic branches of the WCB evolve during the cyclone life cycle.
4.1 Evolution of WCBs during the cyclone life cycle
Figure 9 illustrates the regions where WCBs of North Atlantic cyclones frequently ascend at different relative times of the selected cyclones. As each WCB ascends in the vicinity of a cyclone, which generally moves from west to east, the region of WCB ascent depends on trel. Prior to maximum cyclone intensification (blue contour, Fig. 9), WCBs ascend most often in an elongated band south of 50° N and from 95 to 40° W, partially over southeastern North America. During the main cyclone intensification phase, at trel=0 h (red contour, Fig. 9), the region of the WCB ascent shifts northeastward and is located almost entirely over the open ocean. A day after the cyclone's main intensification phase, at trel=24 h (yellow contour, Fig. 9), WCBs ascend most frequently in the northeastern North Atlantic, north of 30° N. The changes in the atmospheric conditions associated with the shift in the region of frequent WCB ascent have to be considered when investigating the WCB characteristics and impacts relative to the cyclone's life cycle.
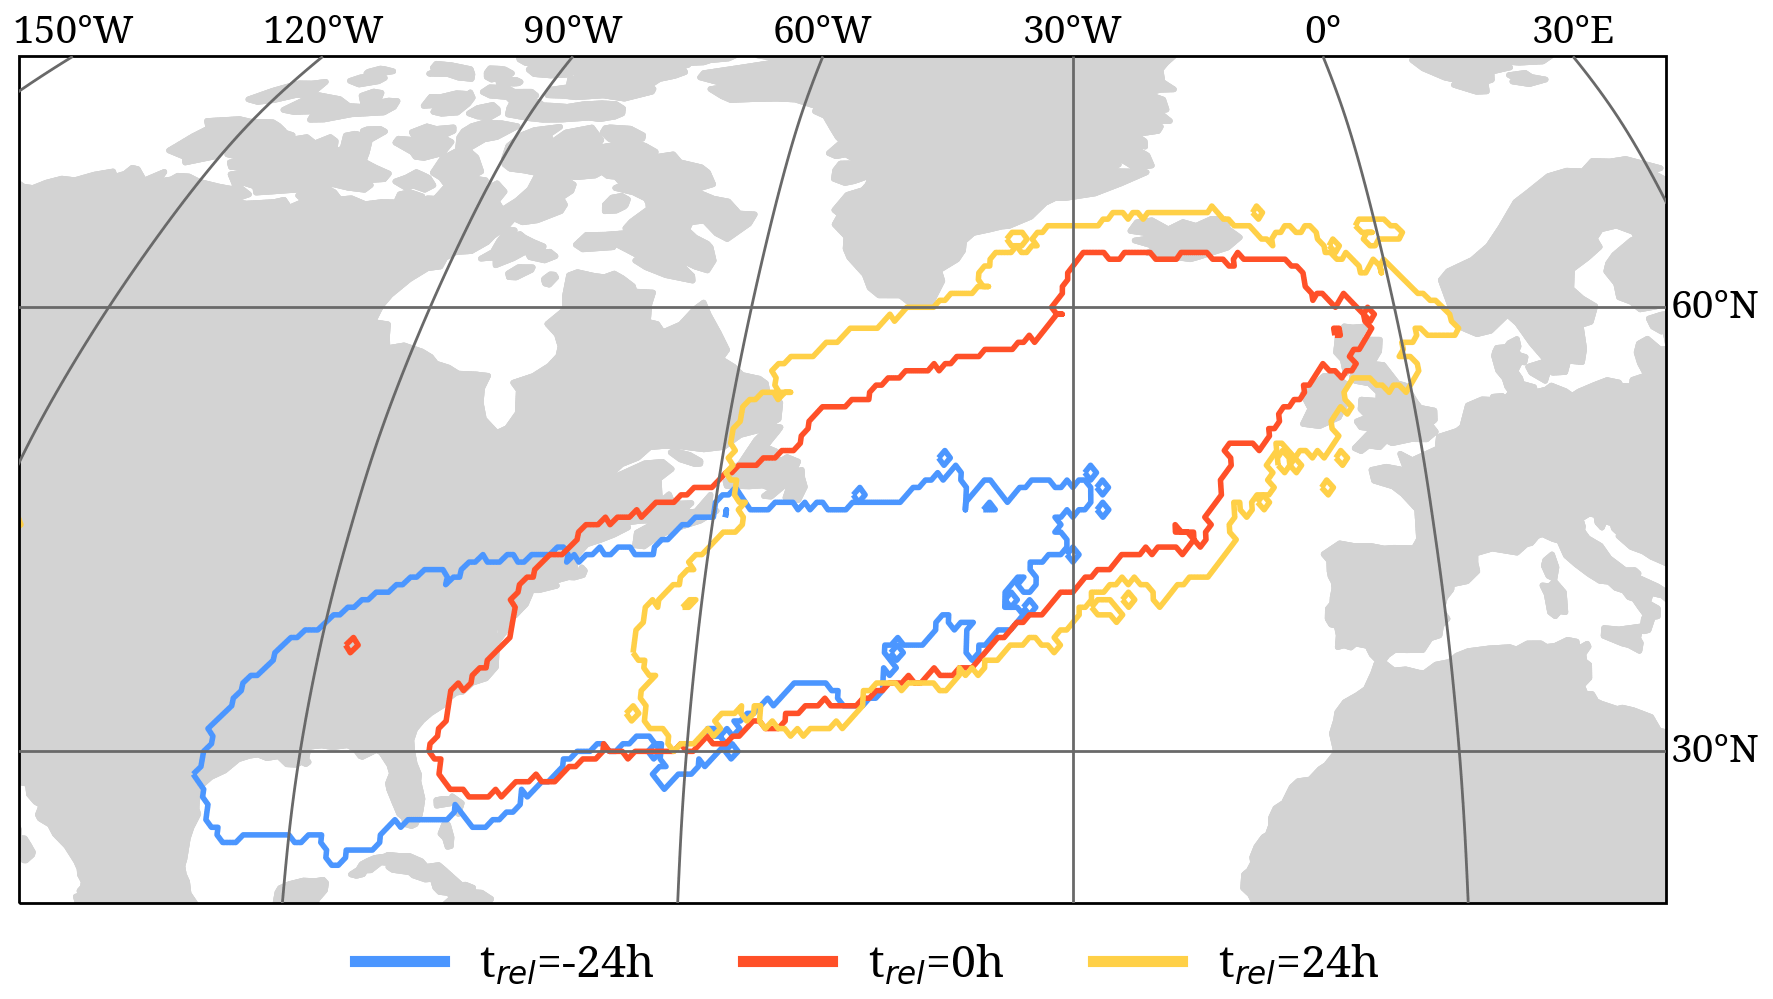
Figure 9Regions of frequent WCB ascent before ( h, blue), during (trel=0 h, red), and after ( h, yellow) the strongest cyclone intensification of the selected North Atlantic cyclones in DJF between 1980–2022. Due to the different number of WCB ascent masks present at each time step (Fig. 8), we show the 95th percentile contour of the respective WCB ascent mask frequency, namely 0.26 %, 0.68 %, and 0.37 % at h, respectively.
Figure 10 presents the climatological evolution of the characteristics and impacts of the WCBs associated with the selected cyclones. At each time instance, we average the respective metrics over all WCB masks that are present. As shown in Fig. 8, this number of WCB masks varies during the cyclone life cycle. The intensity of WCBs (black line, Fig. 10a) peaks at trel=5 h with on average 325 trajectories per ascent mask. Slightly more trajectories ascend towards the end of the intensification period (318 trajectories) compared to the beginning (258 trajectories). The intensity of the WCB outflow (grey line, Fig. 10a) peaks at trel=23 h. The delay in the averaged WCB intensity between the ascent and outflow mask is very similar to the time difference in the peak number of WCB ascent and outflow masks, shown in Fig. 8, and can be explained by the time needed for WCB trajectories to ascend from the middle to the upper troposphere. WCBs ascend most rapidly (83.8 hPa (3 h)−1, Fig. 10b) during the intensification phase (trel=4 h). Moreover, the WCB ascent rate decreases by about 8 hPa (3 h)−1 between h and trel=48 h. This decrease is potentially associated with convection embedded in the WCB ascent during the early stages of the cyclone life cycle when it is located at low latitudes, as detailed in the third case study provided in Sect. S2. The percentage of cyclonically ascending trajectories (Fig. 10c) increases from about 7 % to 18 % between to +20 h, while the share of anticyclonically ascending trajectories decreases from about 37 % to 30 % between to +48 h. Notably, once the central pressure of the cyclones reaches its minimum, the percentage of cyclonically ascending trajectories does not increase further. Overall, within the 6 h of the most intense cyclone intensification ( to +3 h), a distinct cyclonic branch with a relative intensity > 20 % occurs in about 32 % of the WCB ascent masks present at this time (red bars in Fig. 8). The altitude of the WCB outflow (Fig. 10d) decreases with time, as indicated by the increasing pressure of the trajectories that define the outflow mask. The propagation of the WCB during the cyclone life cycle (Fig. 9) to higher latitudes and, thus, to regions with a climatological lower tropopause explains the decreasing WCB outflow altitude.
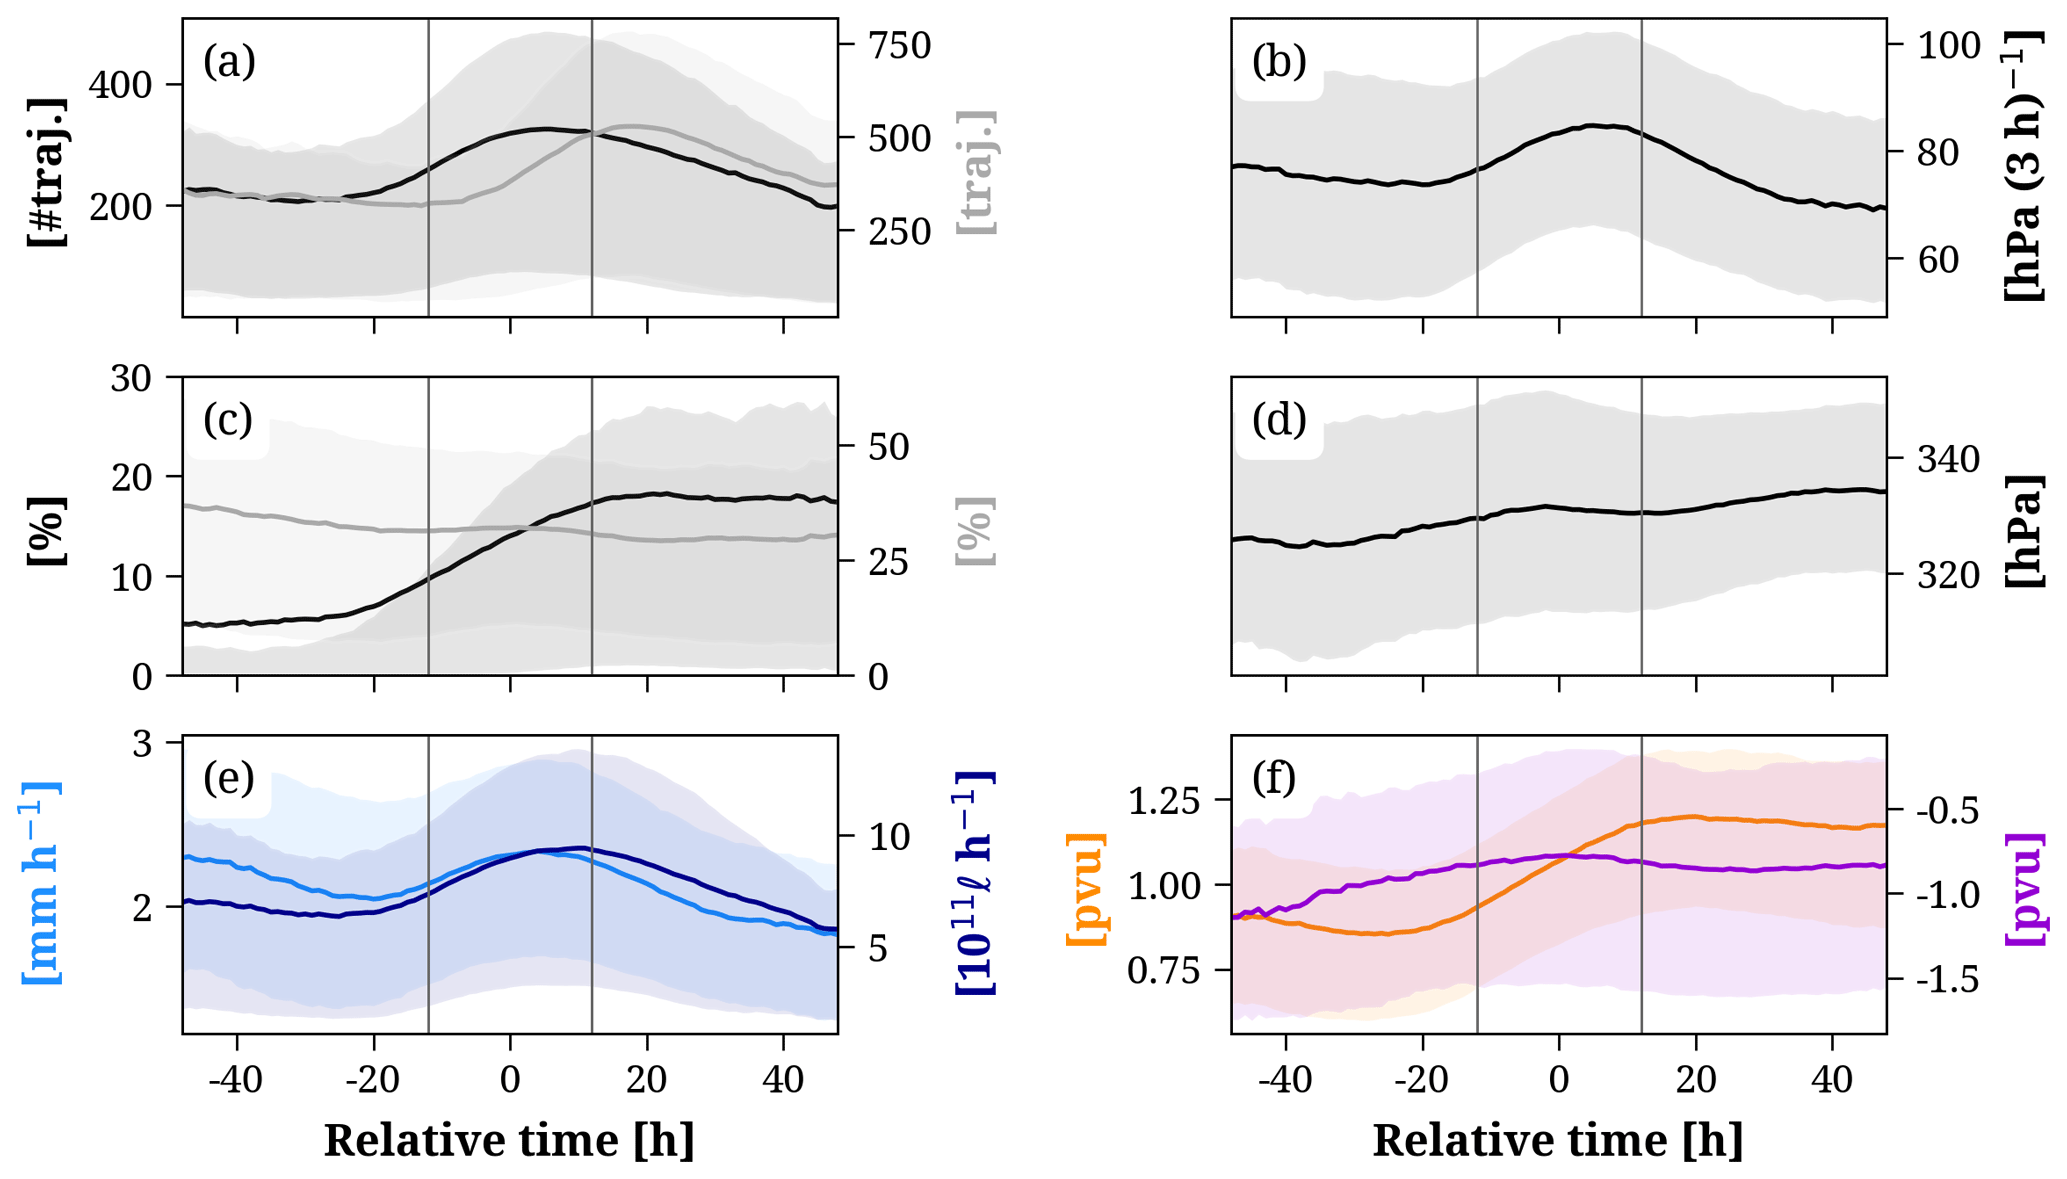
Figure 10Mean (solid) and 50 % confidence interval (shading) of the WCB metrics centered around the time of maximum cyclone intensification (trel=0 h) for WCBs ascending in the North Atlantic in DJF between 1980–2022. (a) Intensity of the WCB ascent (number of trajectories, black) and outflow (number of trajectories, grey), (b) WCB ascent rate (hPa (3 h)−1), (c) percentage of cyclonically (black) and anticyclonically ascending trajectories ( %, grey), (d) outflow altitude (hPa), (e) PQ90 (mm h−1, light blue) and PVOL (1012 ℓ h−1, dark blue), and (f) LLPV (pvu, orange) and ULPVA (pvu, purple). The vertical lines denote the 24 h period of the strongest cyclone intensification.
Consistent with the presented case studies (Sect. 3), WCB-related impacts also depend on the cyclone-relative time in the climatology. The most intense PQ90 associated with WCBs (2.3 mm h−1, light blue, Fig. 10e) is produced at trel=4 h. The largest PVOL (dark blue, Fig. 10e) occurs 6 h later at trel=10 h, linked to the also delayed peak in WCB intensity. The PQ90 is also enhanced during the early stages of the cyclone life cycle, related to intense convective precipitation, which peaks at h (1.1 mm h−1, not shown) when the WCB ascent occurs at lower latitudes (Fig. 9). However, it is important to keep in mind that these heavy precipitation rates at early times occur only rarely, as shown by the relatively low number of WCB ascent masks at h (Fig. 8).
Latent heating linked to precipitation formation affects the LLPV in the region of the WCB ascent. In fact, Fig. 10f (orange line) shows that LLPV gradually increases from 0.85 pvu at h to 1.20 pvu at trel=20 h. After trel=12 h, when the pressure in the cyclone center reaches its minimum, the LLPV also remains fairly constant. Additionally to the PV production by latent heat release, the LLPV also increases with trel because of the northward displacement (Fig. 9) and the associated increase in the Coriolis parameter. The WCB impact on the PV in the upper troposphere (purple line, Fig. 10f) also varies with time but less distinctively. The ULPVA is the most intense (negative) in the early stages of the cyclone life cycle. This finding, however, is statistically less robust, as only a small number of WCB outflow masks is present before the cyclone's intensification (blue bars, Fig. 8). As the intensity of the WCB outflow increases during cyclone intensification (Fig. 10b), the ULPVA becomes slightly more intense and decreases from −0.78 pvu at trel=0 h to −0.87 pvu at trel=28 h. In contrast to the median of the upper-level PV anomaly in the region of the WCB outflow (ULPVA), the respective 90th percentile is more negative overall and decreases more distinctively after cyclone intensification (not shown). A more detailed analysis of the present dataset of WCB characteristics and impacts (Heitmann, 2023) showed that the WCB outflow intensity at one specific moment in the cyclone life cycle (trel=12 h) correlates negatively () with the ULPVA. However, other factors, such as the climatological PV at upper levels at the location of the WCB outflow mask, seem to exert a more pronounced influence on the temporal evolution of the ULPVA.
So far, we have investigated how the WCB metrics depend on the cyclone-relative time and considered all North Atlantic cyclones characterized by a positive ΔSLPB that are associated with a WCB. However, the presented case studies (Sect. 3) are characterized by intense deepening rates (ΔSLPB > 1). When focusing only on cyclones with stronger deepening rates, WCB characteristics and impacts become more intense, whereas their overall temporal evolution remains similar (see Fig. S9). For instance, WCBs associated with cyclones with ΔSLPB > 1 (so-called bomb cyclones, Sanders and Gyakum, 1980) are also most intense during the maximum intensification period (Fig. S9a) but reach average WCB intensities of about 484 trajectories. In addition, these WCBs ascend more rapidly (max 93 hPa (3 h)−1, Fig. S9b) and have a more intense cyclonically curved branch (max 21 %, Fig. S3c). The altitude of the outflow of WCBs (Fig. S9d) is not affected by the intensity of the associated cyclone. In terms of WCB-related impacts, they are associated with larger PQ90 (max 2.7 mm h−1, Fig. S9e), larger PVOL (13.4×10¹² ℓ h−1, Fig. S9e), more intense LLPV after the cyclone intensification phase (max 1.24 pvu, Fig. S9f), and more negative ULPVA (−1.13 pvu, Fig. S9f) throughout the entire cyclone life cycle. Thus, more strongly intensifying cyclones are associated with more intense WCB characteristics and impacts.
As a side note, these findings about the evolution of WCB metrics along cyclone life cycles in the North Atlantic are also qualitatively valid for WCBs in other regions. Refer to Fig. S10 for a brief comparison of WCBs ascending in the North Atlantic, North Pacific, South Atlantic, and South Pacific.
4.2 Differences in the outflow of the WCB branches
The case studies presented in Sect. 3 showed that the branches of the WCB differed in their outflow location relative to the cyclone as well as the ULPVA values within the respective outflow masks. In the following, we generalize these findings by comparing the outflow of the cyclonic, anticyclonic, and non-curved branches of all WCBs ascending in the North Atlantic in DJF between 1980–2022. Each WCB outflow mask is now subdivided depending on the curvature of the underlying WCB trajectories, as described in Sect. 2.2.3 and illustrated in the case studies (panels g–i in Figs. 6, S2 and S4). As in the previous sections, each WCB outflow mask must contain at least 10 trajectories to ensure a sufficient mask area to calculate statistical values. For this analysis, we only consider WCB outflow masks in the 6 h time window around trel=24 h, thus during the peak in WCB outflow intensity.
The resulting set of WCB outflow masks can be separated into 1828, 2397, and 2772 masks formed by the cyclonic, anticyclonic, and non-curved branches of the WCB, respectively. These numbers are smaller than the number of WCB outflow masks between trel=21 to 27 h shown in Fig. 8 (blue bars) due to the threshold of 10 trajectories for single WCB branches instead of the entire WCB outflow. The difference in the number of outflow masks associated with the different WCB branches indicates that WCBs are more likely to feature an anticyclonic branch than a cyclonic branch at this moment in the cyclone life cycle.
Figure 11a shows a scatterplot of the outflow pressure level and the ULPVA of the cyclonic, anticyclonic, and non-curved WCB branches. Independent of the curvature, both variables correlate positively (Spearman correlation coefficient ρ=0.45). Due to the increasing climatological PV with altitude, higher WCB outflow altitudes lead to stronger negative PV anomalies. The intense diabatic heating occurring during the WCB ascent strengthens the cross-isentropic transport to the upper troposphere and leads to diabatic PV destruction above the level of maximum heating and, thus, to the formation of negative PV anomalies. Some WCB outflow regions are associated with positive ULPVA if they are located at relatively low altitudes (recall that ULPVA is calculated in a fixed vertical layer).
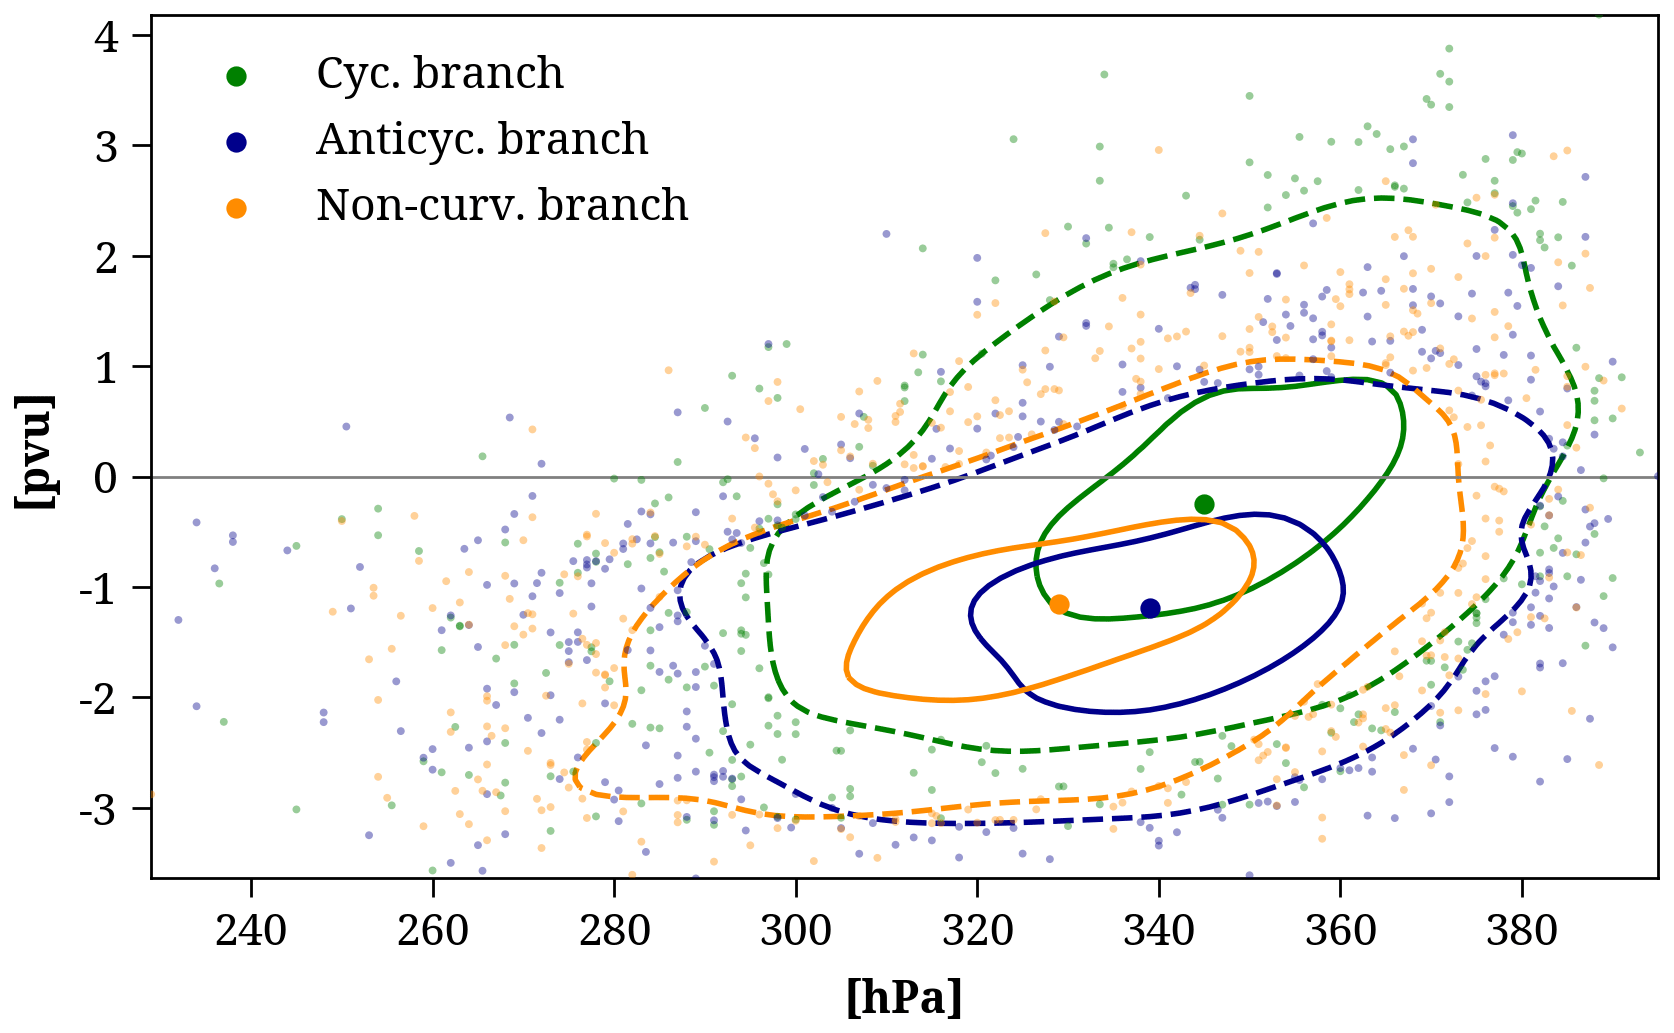
Figure 11ULPVA (pvu) and pressure level (hPa) of the cyclonic (green), anticyclonic (blue), and non-curved (orange) WCB outflow at trel=24 h. A Gaussian kernel density function of the ULPVA and pressure level was used to define the solid (dashed) contours containing 30 % (85 %) of all data points. The large dots inside the solid contours show the median values, while the small dots show values outside the 85 % density contour.
Consistent with the presented case studies, the amplitude of the ULPVA varies across the outflow of the cyclonic, anticyclonic, and non-curved WCB branches. The cyclonic WCB branch ascends to the lowest altitudes (highest pressure levels, 345 hPa, median) and is associated with the weakest ULPVA (−0.25 pvu, median), while the anticyclonic branch reaches higher altitudes (339 hPa, median) and is linked to the strongest ULPVA (−1.19 pvu, median). Although the anticyclonic and non-curved WCB branches are associated with a very similar ULPVA, the outflow of the non-curved WCB branch is located 10 hPa above the anticyclonic branch. As illustrated in Fig. 4, the anticyclonic branch bends eastward when reaching the upper-level flow at the northern edge of the ridge. In contrast, the non-curved WCB branch mainly ascends ahead of the upstream trough and towards the center of the ridge, where the tropopause height is enhanced, thereby potentially allowing for a higher WCB outflow altitude.
In summary, the systematic investigation of WCB branches is consistent with findings from the case studies. The anticyclonic and non-curved WCB branches are characterized by greater intensity, higher outflow altitude, and also a more intense ULPVA than the cyclonic branch.
This section aims to answer the research questions posed in Sect. 1. First, we summarize the approach used for the quantification of the WCB characteristics and impacts (Sect. 2.2) and its performance in the selected case studies (Sect. 3). We then evaluate the evolution of WCBs during the cyclone life cycle from a climatological perspective (Sect. 4) and finally summarize the differences between the cyclonic and anticyclonic WCB branches in terms of the associated upper-level PV modifications (Sect. 4). We discuss the results in the context of previous studies on cyclone life cycles and WCBs, address potential caveats and limitations of the developed method, and finish with the main conclusions and a brief outlook.
5.1 Answer to specific research questions
5.1.1 How can we quantify the main characteristics and impacts of WCBs?
We developed an approach for the quantification of WCBs that is based on three steps: (i) identifying WCB trajectories; (ii) defining two-dimensional masks that describe the region of WCB inflow (p> 800 hPa), ascent (500–800 hPa), and outflow (p< 400 hPa); and (iii) calculating and attributing a set of key numbers of the Lagrangian properties (characteristics: intensity, ascent rate, and curvature) and Eulerian properties (impacts: precipitation and low-/upper-level PV modification) of each WCB mask.
The WCB trajectory criteria applied in (i) were adapted from previous WCB studies to leverage the higher temporal resolution of ERA5 and to provide a more flexible WCB definition. As a consequence, the new definition also considers WCB trajectories that ascend rapidly or at a greater distance to the cyclone center and that have so far been omitted. Despite these adaptations, the climatology of the trajectories fulfilling the adapted WCB definition is qualitatively consistent with the climatological distribution of WCBs shown by Stohl (2001), Eckhardt et al. (2004), and Madonna et al. (2014b). We found that quantifying the characteristics of the WCB based on the adapted WCB trajectories in (iii) provides a more nuanced and detailed representation of the WCB. The two-dimensional masks derived in (ii) coincide very well with the meteorological impacts of the WCB, such as precipitation and enhanced PV at low levels in the region of WCB ascent and negative PV anomalies in the region of WCB outflow. Thus, calculating the WCB-related impacts over all grid points within the WCB masks in step (iii) allows for a meaningful quantification of the WCB.
The performance of the developed method was tested and analyzed in the scope of three case studies of intense cyclones in the North Atlantic and the associated WCBs. We found that the applied approach successfully captured key aspects of these WCBs that were described in previous literature, such as the pronounced split of the WCB ascending in November 2009, as described by Martínez-Alvarado et al. (2014), and the peak in WCB intensity during the cyclone intensification for the case of a WCB ascending in November 1992, as described by Wernli (1997). Thus, in the next step, we quantified the characteristics and impacts of all WCBs in the ERA5 dataset between 1980–2022.
5.1.2 How do the characteristics and impacts change along the life cycle of the associated cyclone?
The climatological analysis shows a clear pattern of how the WCB metrics vary along the life cycle of the corresponding cyclones, in qualitative agreement with the detailed results shown in the case studies. These main patterns are briefly summarized and put into context with related earlier findings in the literature:
-
The intensity of the WCB ascent phase, i.e., of the period when WCB trajectories ascend through the layer from 800 to 500 hPa, peaks during the period of maximum cyclone intensification. The intensity of the WCB outflow, i.e., when the trajectories rise within the layer above 400 hPa, peaks about 18 h later. The findings regarding the WCB ascent appear consistent with previous research that found a positive correlation between WCB intensity and the deepening rate of cyclones, attributed to low-level diabatic PV production (Binder et al., 2016). Furthermore, the quasi-geostrophic upper-level forcing for ascent at 700 hPa, evaluated in the vicinity of the cyclone center, peaks during maximum cyclone intensification (Besson et al., 2021). A reasonable interpretation might be that the upper-level forcing for ascent at the same time contributes to vortex stretching in the cyclone center, and hence cyclone intensification, as well as to the ascent of air from the warm sector, and hence WCB intensity. This interpretation is in line with results from a recent study (Müürsepp, 2022), which quantified the relationship between quasi-geostrophic forcing for ascent and the WCB intensity.
-
WCB ascent rates are not only related to large-scale quasi-geostrophic forcing for the WCB ascent. Thermodynamic stability, potentially leading to embedded convection, can also lead to locally amplified WCB ascent rates (e.g., Oertel et al., 2019). Although the overall understanding of embedded convection in WCBs is still incomplete, it is likely that this phenomenon occurs preferentially at lower latitudes and, therefore, comparatively early in the life cycle of cyclones. This could explain the slightly enhanced WCB ascent rates and rates of convective precipitation around h. However, overall, the composite time evolution of WCB ascent and precipitation rates agrees remarkably well with the evolution of WCB ascent intensity.
-
The share of cyclonically ascending WCB trajectories increases during the cyclone life cycle. This finding is consistent with previous qualitative descriptions of the flow evolution in extratropical cyclones. As described by Palmén (1951), the depth of the cyclonic circulation in a cyclone increases during its intensification, eventually affecting a large part of the troposphere. The increasing depth of the cyclonic circulation leads to an increasing number of WCB trajectories that ascend cyclonically, as summarized by Schultz and Vaughan (2011). However, not every WCB features a distinct cyclonic branch, and it remains unclear which ambient flow conditions are favorable for the formation of a cyclonic branch. In all three case studies, pronounced cyclonic upper-level wave breaking (of type LC2 according to Thorncroft et al., 1993) went along with the formation of a prominent cyclonic branch, but it is left for future investigations whether this result can be regarded as climatologically representative.
-
Considering the two metrics for precipitation, PQ90 is the largest during the cyclone's intensification phase and, thus, before it reaches the deepest SLP. This result is consistent with previous studies that found cyclone-related precipitation, which is mainly linked to the WCB ascent (Browning, 1990, Pfahl et al., 2014), to peak prior to the maximum cyclone intensity (Bengtsson et al., 2009, Michaelis et al., 2017, Hawcroft et al., 2017, Booth et al., 2018). The integrated metric PVOL peaks about 10 h after the peak in PQ90. This temporal shift is potentially linked to the slow decrease in WCB intensity after the cyclone intensification phase.
-
The climatology of LLPV along the cyclone life cycle revealed an increase during cyclone intensification, which appears intuitive as the increased WCB-related LLPV can be an important factor for cyclone intensification (Binder et al., 2016). This increase in LLPV is the result of strong low-level diabatic PV production caused by the ascent of the WCB and the poleward displacement of the WCB during the cyclone life cycle that goes along with an increase in f and hence absolute vorticity. These factors were discussed in detail by Joos and Wernli (2012), Madonna et al. (2014b), and Binder et al. (2016).
-
At upper levels, the WCB outflow is associated with a negative PV anomaly throughout the cyclone life cycle. This finding is consistent with the results of Madonna et al. (2014b), who compared the PV of WCB trajectories 48 h after their start with the climatological mean PV at the same position. They found PV anomalies between 0 and −3 pvu in the North Atlantic. The weaker ULPVA in this study (between about −0.3 and −1.5 pvu) is related to the different approach, as we calculate ULPVA in a fixed vertical layer (200–375 hPa; see Sect. 2.2.1), which captures not only the levels of the WCB outflow, as in Madonna et al. (2014b), but also ambient levels. We found that the ULPVA becomes slightly stronger when the WCB outflow intensity peaks about a day after the strongest cyclone intensification. However, it remains uncertain whether the WCB's most important impact on downstream large-scale flow coincides with this specific moment in time.
5.1.3 How do the cyclonic and anticyclonic WCB branches differ in terms of their characteristics and impacts?
As a particularly novel analysis, we systematically investigated the outflow level and ULPVA of the cyclonic, anticyclonic, and non-curved WCB branches. Consistent with the results from the case studies, the anticyclonic and non-curved branches ascend to higher altitudes and are associated with more intense ULPVA than the cyclonic branch. Wernli (1997), Martínez-Alvarado et al. (2014), and Blanchard et al. (2021) have already found lower PV values on higher isentropes for the anticyclonic branch of the WCB, typically corresponding to more negative PV anomalies compared to the cyclonic branch. Our study shows that this important difference between WCB branches is a relatively robust feature, even if the case-to-case variability, as shown in Fig. 15, is high.
5.2 Limitations
This study demonstrates the potential of the developed method to systematically quantify various important characteristics and impacts of WCBs. However, due to the large variability of cyclones and WCBs, performing a purely objective analysis remains challenging. For instance, attributing WCBs to cyclones can be difficult, particularly in complex synoptic situations. We decided to attribute each WCB trajectory cluster to the cyclone with which it overlaps most strongly while ascending between 800 and 600 hPa, similar to a study by Binder et al. (2023). However, this method may lead to an incorrect attribution in some cases, such as when a WCB is initially linked to a small cyclone, but its main ascent occurs later in a second cyclone. We tested various attribution algorithms, and the presented method agreed best with results from manual attribution. We are therefore confident that the benefit of this method offsets the occasional incorrect attributions.
Other limitations of our approach are related to the choices of our metrics. Clearly, there would be alternative options to define parameters like ULPVA and WCB curvature, but we are confident that the qualitative findings presented in this study are not dependent on the definition of the metric. Furthermore, there might also be other characteristics and metrics that would be worth investigating but are beyond the scope of this study (e.g., more detailed cloud microphysical aspects like the vertical extent of the WCB cloud or microphysical rates of precipitation formation or freezing).
5.3 Main conclusions and outlook
This study introduces an objective approach to quantitatively assess a set of so-called characteristics and impacts of WCBs and applies this approach to three detailed case studies and a climatology of North Atlantic cyclones and their WCBs in 42 winters of ERA5 data.
The calculation of the WCB characteristics and impacts is based on a new WCB climatology. As in previous studies, a Lagrangian perspective is used, and WCBs are identified as coherent bundles of trajectories that ascend at least 600 hPa within a 2 d time window, whereas the selection criteria for WCB trajectories are slightly adapted compared to Madonna et al. (2014b) (see Sect. 2.2.1 for details). Based on this Lagrangian WCB climatology, at every 6 h time step, two-dimensional Eulerian masks of WCB inflow, ascent, and outflow are determined from the trajectories. We present a novel climatology of the frequency of occurrence of these different WCB masks, an approach that takes a diverse trajectory ascent behavior into account. Then, we calculate different metrics within these masks. The considered metrics are intensity (number of trajectories within the mask), ascent rate (mean pressure change in 3 h), ascent curvature, precipitation rate (90th percentile of precipitation within the mask), the total precipitation volume in the mask, positive PV at low levels (90th percentile of PV between 750–950 hPa, LLPV) in the region of WCB ascent, and negative PV anomalies (50th percentile of PV anomalies between 200–375 hPa, ULPVA) in the region of WCB outflow. With this set of WCB metrics, which can be applied in other studies about WCBs identified in reanalyses or output from numerical weather prediction and climate simulations, this study offers an objective and valuable framework to better quantify various relevant aspects of WCBs.
The main novelties of this study are (i) the systematic approach that yields interesting insight into detailed case studies but can also be used for climatological investigations; (ii) the cyclone life cycle perspective, which considers the evolution of the WCB metrics along the development of the associated cyclone; and (iii) the specific consideration of the differences between cyclonic and anticyclonic WCB branches. With regard to point (ii), it was shown with a large set of about 5000 North Atlantic winter cyclones that the period of maximum cyclone intensification coincides with the maximum intensity of the WCB ascent, with peaks in surface precipitation and 3 h ascent rates, and with an increase in low-level PV and the intensity of the cyclonically curved branch of the WCB. This temporal synchronization of cyclone intensification and several key aspects of WCBs points to the dynamical linkages between dynamical forcing for ascent, cloud formation, precipitation, latent heating, diabatic PV production at low levels, and cyclone intensity.
As a brief outlook, we mention two extensions of this WCB characterization study. First, it could be rewarding to investigate the large variance in WCB characteristics and impacts observed in the present study. Heitmann (2023) analyzed the statistical relationships between WCB characteristics and impacts, e.g., the correlations between WCB intensity and PVOL or between ascent rate and precipitation rates. Further sensitivity studies could be employed to validate the identified connections between WCB characteristics and impacts. Second, the developed methods could be employed to understand the potential changes in WCBs in a future, warmer climate. Joos et al. (2023) and Binder et al. (2023) were the first to identify WCBs based on air parcel trajectories with wind fields from climate simulations. Comparing WCBs in the present-day climate and a future climate according to the RCP8.5 scenario, they found that WCBs will become more intense, moister, and associated with more intense precipitation. The approaches developed in this study might be ideal for obtaining further insight into the important questions of how WCBs, their multi-faceted characteristics, and hydrological and dynamical impacts may be modified by anthropogenic warming.
ERA5 reanalyses are available from the Copernicus Climate Data Store (https://doi.org/10.24381/CDS.ADBB2D47, Copernicus Climate Change Service, 2023).
The supplement related to this article is available online at: https://doi.org/10.5194/wcd-5-537-2024-supplement.
KH performed the analyses and wrote the first version of this paper. MS, HB, HW, and HJ helped KH in the design of the study, the interpretation of the results, and the writing of the paper.
At least one of the (co-)authors is a member of the editorial board of Weather and Climate Dynamics. The peer-review process was guided by an independent editor, and the authors also have no other competing interests to declare.
Publisher’s note: Copernicus Publications remains neutral with regard to jurisdictional claims made in the text, published maps, institutional affiliations, or any other geographical representation in this paper. While Copernicus Publications makes every effort to include appropriate place names, the final responsibility lies with the authors.
The authors are grateful for valuable discussions with John Methven and Ambrogio Volonté (University of Reading). We thank Jeffrey Chagnon, one anonymous reviewer, and the editor, Helen Dacre, for their time and their constructive and helpful feedback.
This research has been supported by the Schweizerischer Nationalfonds zur Förderung der Wissenschaftlichen Forschung (grant no. 185049).
This paper was edited by Helen Dacre and reviewed by Jeffrey Chagnon and one anonymous referee.
Bengtsson, L., Hodges, K. I., and Keenlyside, N.: Will extratropical storms intensify in a warmer climate?, J. Climate, 22, 2276–2301, https://doi.org/10.1175/2008JCLI2678.1, 2009. a
Besson, P., Fischer, L. J., Schemm, S., and Sprenger, M.: A global analysis of the dry-dynamic forcing during cyclone growth and propagation, Weather Clim. Dynam., 2, 991–1009, https://doi.org/10.5194/wcd-2-991-2021, 2021. a
Binder, H.: Warm conveyor belts: cloud structure and role for cyclone dynamics and extreme events, PhD Thesis, ETH Zurich, Zurich, https://doi.org/10.3929/ethz-b-000164982, 2017. a
Binder, H., Boettcher, M., Joos, H., and Wernli, H.: The role of warm conveyor belts for the intensification of extratropical cyclones in Northern Hemisphere winter, J. Atmos. Sci., 73, 3997–4020, https://doi.org/10.1175/JAS-D-15-0302.1, 2016. a, b, c, d, e, f, g
Binder, H., Boettcher, M., Joos, H., Sprenger, M., and Wernli, H.: Vertical cloud structure of warm conveyor belts – a comparison and evaluation of ERA5 reanalysis, CloudSat and CALIPSO data, Weather Clim. Dynam., 1, 577–595, https://doi.org/10.5194/wcd-1-577-2020, 2020. a
Binder, H., Joos, H., Sprenger, M., and Wernli, H.: Warm conveyor belts in present-day and future climate simulations – Part 2: Role of potential vorticity production for cyclone intensification, Weather Clim. Dynam., 4, 19–37, https://doi.org/10.5194/wcd-4-19-2023, 2023. a, b, c
Blanchard, N., Pantillon, F., Chaboureau, J.-P., and Delanoë, J.: Organization of convective ascents in a warm conveyor belt, Weather Clim. Dynam., 1, 617–634, https://doi.org/10.5194/wcd-1-617-2020, 2020. a
Blanchard, N., Pantillon, F., Chaboureau, J.-P., and Delanoë, J.: Mid-level convection in a warm conveyor belt accelerates the jet stream, Weather Clim. Dynam., 2, 37–53, https://doi.org/10.5194/wcd-2-37-2021, 2021. a, b, c
Booth, J. F., Thompson, L., Patoux, J., and Kelly, K. A.: Sensitivity of Midlatitude Storm Intensification to Perturbations in the Sea Surface Temperature near the Gulf Stream, Mon. Weather Rev., 140, 1241–1256, https://doi.org/10.1175/MWR-D-11-00195.1, 2012. a
Booth, J. F., Naud, C. M., and Jeyaratnam, J.: Extratropical cyclone precipitation life cycles: A satellite-based analysis, Geophys. Res. Lett., 45, 8647–8654, https://doi.org/10.1029/2018GL078977, 2018. a
Browning, K.: Organization of clouds and precipitation in extratropical cyclones, in: Extratropical cyclones, 129–153, Springer, https://doi.org/10.1007/978-1-944970-33-8_8, 1990. a, b, c
Browning, K. and Roberts, N.: Structure of a frontal cyclone, Q. J. Roy. Meteor. Soc., 120, 1535–1557, https://doi.org/10.1002/qj.49712052006, 1994. a
Browning, K., Hardman, M., Harrold, T., and Pardoe, C.: The structure of rainbands within a mid-latitude depression, Q. J. Roy. Meteor. Soc., 99, 215–231, https://doi.org/10.1002/qj.49709942002, 1973. a
Carlson, T. N.: Airflow through midlatitude cyclones and the comma cloud pattern, Mon. Weather Rev., 108, 1498–1509, https://doi.org/10.1175/1520-0493(1980)108<1498:ATMCAT>2.0.CO;2, 1980. a, b
Catto, J.: Extratropical cyclone classification and its use in climate studies, Rev. Geophys., 54, 486–520, https://doi.org/10.1002/2016rg000519, 2016. a
Catto, J. L., Madonna, E., Joos, H., Rudeva, I., and Simmonds, I.: Global relationship between fronts and warm conveyor belts and the impact on extreme precipitation, J. Climate, 28, 8411–8429, https://doi.org/10.1175/JCLI-D-15-0171.1, 2015. a, b
Chagnon, J. M., Gray, S. L., and Methven, J.: Diabatic processes modifying potential vorticity in a North Atlantic cyclone: Diabatic Modification of Potential Vorticity, Q. J. Roy. Meteor. Soc., 139, 1270–1282, https://doi.org/10.1002/qj.2037, 2013. a
Copernicus Climate Change Service: ERA5 hourly data on single levels from 1940 to present, Copernicus Climate Change Service (C3S) Climate Data Store (CDS) [data set], https://doi.org/10.24381/CDS.ADBB2D47, 2023. a
Eckhardt, S., Stohl, A., Wernli, H., James, P., Forster, C., and Spichtinger, N.: A 15-year climatology of warm conveyor belts, J. Climate, 17, 218–237, https://doi.org/10.1175/1520-0442(2004)017<0218:AYCOWC>2.0.CO;2, 2004. a, b, c, d, e, f, g, h
Flaounas, E., Kotroni, V., Lagouvardos, K., Gray, S. L., Rysman, J.-F., and Claud, C.: Heavy rainfall in Mediterranean cyclones. Part I: contribution of deep convection and warm conveyor belt, Clim. Dynam., 50, 2935–2949, https://doi.org/10.1007/s00382-017-3783-x, 2018. a
Grams, C. M., Wernli, H., Böttcher, M., Čampa, J., Corsmeier, U., Jones, S. C., Keller, J. H., Lenz, C.-J., and Wiegand, L.: The key role of diabatic processes in modifying the upper-tropospheric wave guide: a North Atlantic case-study, Q. J. Roy. Meteor. Soc., 137, 2174–2193, https://doi.org/10.1002/qj.891, 2011. a, b
Grams, C. M., Magnusson, L., and Madonna, E.: An atmospheric dynamics perspective on the amplification and propagation of forecast error in numerical weather prediction models: A case study, Q. J. Roy. Meteor. Soc., 144, 2577–2591, https://doi.org/10.1002/qj.3353, 2018. a
Harrold, T.: Mechanisms influencing the distribution of precipitation within baroclinic disturbances, Q. J. Roy. Meteor. Soc., 99, 232–251, https://doi.org/10.1002/qj.49709942003, 1973. a
Hawcroft, M., Dacre, H., Forbes, R., Hodges, K., Shaffrey, L., and Stein, T.: Using satellite and reanalysis data to evaluate the representation of latent heating in extratropical cyclones in a climate model, Clim. Dynam., 48, 2255–2278, https://doi.org/10.1007/s00382-016-3204-6, 2017. a
Heitmann, K.: Characteristics and Impacts of Warm Conveyor Belts in Present-Day and Future Climate, PhD thesis, ETH Zurich, https://doi.org/10.3929/ETHZ-B-000652214, 2023. a, b, c, d
Hersbach, H., Bell, B., Berrisford, P., Hirahara, S., Horányi, A., Muñoz-Sabater, J., Nicolas, J., Peubey, C., Radu, R., Schepers, D., and others: The ERA5 global reanalysis, Q. J. Roy. Meteor. Soc., 146, 1999–2049, https://doi.org/10.1002/qj.3803, 2020. a
Joos, H. and Forbes, R. M.: Impact of different IFS microphysics on a warm conveyor belt and the downstream flow evolution, Q. J. Roy. Meteor. Soc., 142, 2727–2739, https://doi.org/10.1002/qj.2863, 2016. a
Joos, H. and Wernli, H.: Influence of microphysical processes on the potential vorticity development in a warm conveyor belt: a case-study with the limited-area model COSMO, Q. J. Roy. Meteor. Soc., 138, 407–418, https://doi.org/10.1002/qj.934, 2012. a, b, c
Joos, H., Sprenger, M., Binder, H., Beyerle, U., and Wernli, H.: Warm conveyor belts in present-day and future climate simulations – Part 1: Climatology and impacts, Weather Clim. Dynam., 4, 133–155, https://doi.org/10.5194/wcd-4-133-2023, 2023. a, b
Knippertz, P., Chagnon, J. M., Foster, A., Lathouwers, L., Marsham, J. H., Methven, J., and Parker, D. J.: Research flight observations of a prefrontal gravity wave near the southwestern UK, Weather, 65, 293–297, https://doi.org/10.1002/wea.632, 2010. a
Madonna, E., Limbach, S., Aebi, C., Joos, H., Wernli, H., and Martius, O.: On the Co-Occurrence of Warm Conveyor Belt Outflows and PV Streamers, J. Atmos. Sci., 71, 3668–3673, https://doi.org/10.1175/JAS-D-14-0119.1, 2014a. a, b
Madonna, E., Wernli, H., Joos, H., and Martius, O.: Warm conveyor belts in the ERA-Interim dataset (1979–2010). Part I: Climatology and potential vorticity evolution, J. Climate, 27, 3–26, https://doi.org/10.1175/JCLI-D-12-00720.1, 2014b. a, b, c, d, e, f, g, h, i, j, k, l, m, n, o, p, q, r
Martínez-Alvarado, O., Joos, H., Chagnon, J., Boettcher, M., Gray, S., Plant, R., Methven, J., and Wernli, H.: The dichotomous structure of the warm conveyor belt, Q. J. Roy. Meteor. Soc., 140, 1809–1824, https://doi.org/10.1002/qj.2276, 2014. a, b, c, d, e, f, g, h, i, j, k, l
Methven, J.: Potential vorticity in warm conveyor belt outflow, Q. J. Roy. Meteor. Soc., 141, 1065–1071, https://doi.org/10.1002/qj.2393, 2015. a
Michaelis, A. C., Willison, J., Lackmann, G. M., and Robinson, W. A.: Changes in winter North Atlantic extratropical cyclones in high-resolution regional pseudo–global warming simulations, J. Climate, 30, 6905–6925, https://doi.org/10.1175/JCLI-D-16-0697.1, 2017. a
Müürsepp, T.: Warm Conveyor Belts in the Extratropics: What Determines Their Intensity?, Master's thesis, ETH Zurich, Institute for Atmospheric and Climate Science, Zurich, https://doi.org/10.3929/ethz-b-000600318, 2022. a
Namias, J.: The use of isentropic analysis in short term forecasting, J. Aeronaut. Sci., 6, 295–298, https://doi.org/10.2514/8.860, 1939. a
Neiman, P. J., Shapiro, M., and Fedor, L.: The life cycle of an extratropical marine cyclone. Part II: Mesoscale structure and diagnostics, Mon. Weather Rev., 121, 2177–2199, https://doi.org/10.1175/1520-0493(1993)121<2177:TLCOAE>2.0.CO;2, 1993. a
Neu, U., Akperov, M. G., Bellenbaum, N., Benestad, R., Blender, R., Caballero, R., Cocozza, A., Dacre, H. F., Feng, Y., Fraedrich, K., Grieger, J., Gulev, S., Hanley, J., Hewson, T., Inatsu, M., Keay, K., Kew, S. F., Kindem, I., Leckebusch, G. C., Liberato, M. L. R., Lionello, P., Mokhov, I. I., Pinto, J. G., Raible, C. C., Reale, M., Rudeva, I., Schuster, M., Simmonds, I., Sinclair, M., Sprenger, M., Tilinina, N. D., Trigo, I. F., Ulbrich, S., Ulbrich, U., Wang, X. L., and Wernli, H.: IMILAST: A Community Effort to Intercompare Extratropical Cyclone Detection and Tracking Algorithms, B. Am. Meteorol. Soc., 94, 529–547, https://doi.org/10.1175/BAMS-D-11-00154.1, 2013. a
Oertel, A., Boettcher, M., Joos, H., Sprenger, M., Konow, H., Hagen, M., and Wernli, H.: Convective activity in an extratropical cyclone and its warm conveyor belt–a case-study combining observations and a convection-permitting model simulation, Q. J. Roy. Meteor. Soc., 145, 1406–1426, https://doi.org/10.1002/qj.3500, 2019. a, b, c
Oertel, A., Boettcher, M., Joos, H., Sprenger, M., and Wernli, H.: Potential vorticity structure of embedded convection in a warm conveyor belt and its relevance for large-scale dynamics, Weather Clim. Dynam., 1, 127–153, https://doi.org/10.5194/wcd-1-127-2020, 2020. a
Palmén, E.: The aerology of extratropical disturbances, Compendium of Meteorology: Prepared under the Direction of the Committee on the Compendium of Meteorology, 599–620, https://doi.org/10.1007/978-1-940033-70-9_49, 1951. a
Pfahl, S., Madonna, E., Boettcher, M., Joos, H., and Wernli, H.: Warm conveyor belts in the ERA-Interim dataset (1979–2010). Part II: Moisture origin and relevance for precipitation, J. Climate, 27, 27–40, https://doi.org/10.1175/JCLI-D-13-00223.1, 2014. a, b
Pfahl, S., Schwierz, C., Croci-Maspoli, M., Grams, C. M., and Wernli, H.: Importance of latent heat release in ascending air streams for atmospheric blocking, Nat. Geosci., 8, 610–614, https://doi.org/10.1038/ngeo2487, 2015. a
Rasp, S., Selz, T., and Craig, G. C.: Convective and slantwise trajectory ascent in convection-permitting simulations of midlatitude cyclones, Mon. Weather Rev., 144, 3961–3976, https://doi.org/10.1175/MWR-D-16-0112.1, 2016. a
Reed, R. J. and Danielsen, E. F.: Fronts in the vicinity of the tropopause, Archiv für Meteorologie, Geophysik und Bioklimatologie, Ser. A, Meteorologie und Geophysik, 11, 1–17, https://doi.org/10.1007/BF02247637, 1958. a
Rodwell, M., Forbes, R., and Wernli, H.: Why warm conveyor belts matter in NWP, ECMWF Newsletter, 154, 21–28, https://doi.org/10.21957/mr20vg, 2018. a
Röthlisberger, M., Martius, O., and Wernli, H.: Northern Hemisphere Rossby wave initiation events on the extratropical jet – A climatological analysis, J. Climate, 31, 743–760, https://doi.org/10.1175/JCLI-D-17-0346.1, 2018. a
Sanders, F. and Gyakum, J. R.: Synoptic-dynamic climatology of the “bomb”, Mon. Weather Rev., 108, 1589–1606, https://doi.org/10.1175/1520-0493(1980)108<1589:SDCOT>2.0.CO;2, 1980. a, b, c
Schemm, S. and Wernli, H.: The Linkage between the Warm and the Cold Conveyor Belts in an Idealized Extratropical Cyclone, J. Atmos. Sci., 71, 1443–1459, https://doi.org/10.1175/JAS-D-13-0177.1, 2014. a
Schultz, D. M. and Vaughan, G.: Occluded fronts and the occlusion process: A fresh look at conventional wisdom, B. Am. Meteorol. Soc., 92, 443–466, https://doi.org/10.1175/2010BAMS3057.1, 2011. a
Schäfler, A., Craig, G., Wernli, H., Arbogast, P., Doyle, J. D., McTaggart-Cowan, R., Methven, J., Rivière, G., Ament, F., Boettcher, M., and others: The North Atlantic waveguide and downstream impact experiment, B. Am. Meteorol. Soc., 99, 1607–1637, https://doi.org/10.1175/BAMS-D-17-0003.1, 2018. a
Sprenger, M. and Wernli, H.: The LAGRANTO Lagrangian analysis tool – version 2.0, Geosci. Model Dev., 8, 2569–2586, https://doi.org/10.5194/gmd-8-2569-2015, 2015. a
Sprenger, M., Fragkoulidis, G., Binder, H., Croci-Maspoli, M., Graf, P., Grams, C. M., Knippertz, P., Madonna, E., Schemm, S., Škerlak, B., and others: Global climatologies of Eulerian and Lagrangian flow features based on ERA-Interim, B. Am. Meteorol. Soc., 98, 1739–1748, https://doi.org/10.1175/BAMS-D-15-00299.1, 2017. a, b
Steinfeld, D. and Pfahl, S.: The role of latent heating in atmospheric blocking dynamics: a global climatology, Clim. Dyna., 53, 6159–6180, https://doi.org/10.1007/s00382-019-04919-6, 2019. a
Stoelinga, M. T.: A potential vorticity-based study of the role of diabatic heating and friction in a numerically simulated baroclinic cyclone, Mon. Weather Rev., 124, 849–874, https://doi.org/10.1175/1520-0493(1996)124<0849:APVBSO>2.0.CO;2, 1996. a
Stohl, A.: A 1-year Lagrangian “climatology” of airstreams in the northern hemisphere troposphere and lowermost stratosphere, J. Geophys. Res.-Atmos., 106, 7263–7279, https://doi.org/10.1029/2000JD900570, 2001. a, b
Thorncroft, C., Hoskins, B., and McIntyre, M.: Two paradigms of baroclinic-wave life-cycle behaviour, Q. J. Roy. Meteor. Soc., 119, 17–55, https://doi.org/10.1002/qj.49711950903, 1993. a
Wernli, H.: A Lagrangian-based analysis of extratropical cyclones. II: A detailed case-study, Q. J. Roy. Meteor. Soc., 123, 1677–1706, https://doi.org/10.1002/qj.49712354211, 1997. a, b, c, d, e, f, g
Wernli, H. and Davies, H. C.: A Lagrangian-based analysis of extratropical cyclones. I: The method and some applications, Q. J. Roy. Meteor. Soc., 123, 467–489, https://doi.org/10.1002/qj.49712353811, 1997. a, b, c
Wernli, H. and Schwierz, C.: Surface cyclones in the ERA-40 dataset (1958–2001). Part I: Novel identification method and global climatology, J. Atmos. Sci., 63, 2486–2507, https://doi.org/10.1175/JAS3766.1, 2006. a