the Creative Commons Attribution 4.0 License.
the Creative Commons Attribution 4.0 License.
 | 02 Dec 2025
Equatorial wave circulation associated with subseasonal convective variability over the subtropical western North Pacific in boreal summer
Peishan Chen
Katharina M. Holube
Frank Lunkeit
Nedjeljka Žagar
Yuan-Bing Zhao
Riyu Lu
Atmospheric convection over the subtropical western North Pacific (SWNP) during boreal summer varies on timescales of around 10 d, with significant effects on both local and remote circulation. One of less understood effects of this variability is its coupling with equatorial wave dynamics. This paper quantifies equatorial wave perturbations and their evolution throughout the lifecycle of SWNP convection using wave-space regression between outgoing longwave radiation over the SWNP region and spectral expansion coefficients of global tropospheric circulation from ERA5 reanalyses. The regression distinguishes between convection-coupled linear Rossby and Kelvin waves, and mixed Rossby-gravity (MRG) and inertia-gravity (IG) waves. The former two correspond to the Gill-type tropical circulation response to asymmetric heating.
The results show that MRG and IG waves exhibit amplitudes comparable to those of the Gill-response component in the upper troposphere. In particular, MRG and IG waves dominate the cross-equatorial northerly flow over the Maritime Continent, with MRG waves playing the larger role. These findings suggest caution when applying the Gill solution to interpret circulation responses to asymmetric heating in model simulations.
As SWNP convection intensifies, the MRG-wave northerly winds across the equator strengthen, while IG waves represent enhanced upper-tropospheric outflow over the SWNP region. By contrast, the combined effect of Kelvin and Rossby waves reinforces circulation on the equatorward flank of the anticyclone over the SWNP region, with Rossby wave easterlies being about three times stronger than those associated with Kelvin waves. The Rossby wave signal resembles the n=1 Rossby wave, with its Southern Hemisphere (SH) subtropical anticyclonic gyre forming over the southern Indian ocean during the decay phase of the SWNP convection. This gyre, together with the SH IG meridional flow provides a dynamical bridge linking SWNP convection and extratropical circulation during austral winter.
- Article
(11813 KB) - Full-text XML
-
Supplement
(2830 KB) - BibTeX
- EndNote


During boreal summer, the dominant feature of circulation over the subtropical western North Pacific (SWNP) is deep atmospheric convection, which acts as an off-equatorial heating source (e.g. Nitta, 1986). The effects of SWNP convection variability on the circulation and climate over the SWNP and Asia have been well documented (Nitta, 1987; Huang and Sun, 1992; Lau et al., 2000; Lu and Dong, 2001; Wang et al., 2001; Kosaka and Nakamura, 2006, and many others). Enhanced (suppressed) SWNP convection is associated with cyclonic (anticyclonic) circulation anomaly over the SWNP region in the lower troposphere (Nitta, 1987; Huang and Sun, 1992; Lu and Dong, 2001; Wang et al., 2001; Kosaka and Nakamura, 2006, 2010; Chen and Lu, 2023). In the upper troposphere, the SWNP convection induces anomalous cross-equatorial flow over the Maritime Continent (Zhao et al., 2022). In addition, the SWNP convection is also associated with teleconnection patterns in both the Northern Hemisphere (NH) and Southern Hemisphere (SH), connecting the tropical and extratropical circulation anomalies (Nitta, 1987; Huang and Sun, 1992; Zhu et al., 2020; Lin, 2009; Zhao et al., 2019).
While most of the above-cited studies focused on monthly or seasonal timescales, some studies also addressed the subseasonal variability of SWNP convection (Wang et al., 2016; Di Capua et al., 2020; Zhu et al., 2020; Sun et al., 2021; Sun and Tan, 2022; Quinting et al., 2024). For example, Sun et al. (2021) discussed the approximately 10 d long lifecycle of the SWNP convection along with the evolution of the Pacific-Japan pattern, which is characterised by a meridional dipole pattern over the north of the Philippines and east of Japan (e.g. Nitta, 1987; Zhu et al., 2020). Sun and Tan (2022) suggested a SH teleconnection of the SWNP convection over Australia, South Pacific and South Atlantic, which defines the Australia–South Pacific–South Atlantic pattern. Zhao et al. (2023) coupled cross-equatorial flow events over the Maritime Continent in reanalysis data with the convection over the SWNP region. They showed that the enhancement of the SWNP convection is associated with the westward propagation of the anomalous convection from the equatorial central Pacific region, and the cross-equatorial flow over the Maritime Continent appears in parallel with the convection moving away from the equator. Furthermore, the equatorial meridional wind anomalies have a baroclinic vertical structure and propagate westward.
The present study complements previous work on subseasonal variability of the SWNP convection during boreal summer by coupling its internal dynamics with equatorial waves. Earlier studies addressing this topic include Chatterjee and Goswami (2004) and Chen and Sui (2010). Chatterjee and Goswami (2004) found that the tropical quasi-biweekly mode resembles the gravest meridional (n=1) equatorial Rossby wave coupled with convection, whereas Chen and Sui (2010) identified the same mode in their case study of the 10-20 day oscillation in the convection over the SWNP. Feng et al. (2020a, b) coupled the rainfall progression in tropical depression-type waves over the SWNP region with the horizontal moisture advection. Several other studies analysing equatorial waves over the broad SWNP region focused either on boreal winter (Ferrett et al., 2019, 2023) or longer time scales (Straub and Kiladis, 2003).
Although earlier studies have addressed various aspects of wave circulation associated with SWNP convection, a comprehensive analysis based on reanalysis data is still lacking, both in terms of quantifying wave anomalies and elucidating the dynamics underlying the evolution of summer SWNP convection. In this study, we quantify the equatorial wave variances associated with SWNP convection, including MRG waves, Kelvin waves, equatorial Rossby waves and inertia-gravity (IG) waves. We examine the evolution of wave circulation throughout the lifecycle of SWNP convection using a novel wave-convection regression methodology formulated in wave space. In particular, we link the evolution of cross-equatorial flow during convective episodes to MRG and IG waves, while the predominantly along-equatorial flow is associated with Kelvin and Rossby waves. The latter represents the classical Gill response to localized off-equatorial heating.
Gill (1980) showed that the asymmetric heating produces Rossby wave response to the west of the heating source with the cross-equatorial flow in the lower troposphere pointing towards the localized subtropical heating. This steady-state meridional flow consists of the Rossby modes with even meridional mode index seen as a pair of gyres with stronger flows on their equatorward sides. In Gill's formulation, the asymmetric forcing comprises heating north of the equator and cooling of the equal magnitude and structure to the south. The resulting circulation response is commonly combined with the solution for heating centred on the equator to represent hemispherically asymmetric heating (Fig. 3 in Gill, 1980), such as the SWNP convection during boreal summer. Gill (1980)'s solution for such forcing consists of Rossby and Kelvin modes, whose spatial structure depend on the dissipation and other parameters of the system (e.g. Wu et al., 2000; Schubert et al., 2009; Bellon and Reboredo, 2022; Reboredo and Bellon, 2022).
The analytical Gill solution is based on meridional geostrophy or the “long-wave approximation” (Pedlosky, 1965), also referred to as the “low-frequency approximation”, which involves neglecting the local time derivative in the meridional momentum equation linearized about a state of rest (Eq. 12 in Gill, 1980). This approximation leaves the equatorial Kelvin wave unaffected and filters out both IG waves and MRG waves from the solutions (Boyd, 2018, Chap. 4). As demonstrated in this paper, the long-wave approximation limits the usefulness of the Gill solution for asymmetric forcing and real flow configurations associated with seasonal cycle, synoptic-scale processes and interactions with extratropics. Importantly, this limitation has not been previously quantified, particularly at subseasonal scales, which are the subject of the present study.
We hypothesize that the cross-equatorial flow accompanying the lifecycle of SWNP convection is associated with MRG and IG wave meridional winds that are not part of the Gill response to the asymmetrical heating. This cross-equatorial component of the response is compared with the flow component associated with Rossby and Kelvin waves. Our aim is to provide a comprehensive picture of equatorial wave behaviour during the evolution of SWNP convection in boreal summer by answering the following questions:
-
How does the equatorial wave circulation evolve in relation to the SWNP convection?
-
What roles do MRG and IG waves, compared to Rossby and Kelvin waves, play during different phases of SWNP convection?
To address these questions, we first analyze observations of the outgoing longwave radiation (OLR), as a proxy of convection, to establish the SWNP convection index similar to previous studies. This is followed by the equatorial wave analysis using the fifth European reanalysis dataset ERA5 (Hersbach et al., 2020). Coupling between the equatorial waves and convection variability is established through regression in wave space. The method is described in Sect. 2, along with data, with additional details and illustrations in the Supplement. Results are presented in Sect. 3, and conclusions and outlook are given in Sect. 4.
2.1 OLR data
We use daily mean OLR data from NOAA (Liebmann and Smith, 1996) for boreal summer (June to August; JJA) from 1979 to 2021 at a horizontal resolution of 2.5° × 2.5°. The SWNP convection index (SWNPI) is defined as the daily OLR anomaly averaged over the region between 10 and 20° N, 110 and 160° E and multiplied by −1. The anomaly is calculated as a departure from the 43-year mean for each day from June to August. The mean from all daily indexes is removed and the resulting deviations from the mean are divided by the standard deviation for each element. This definition follows earlier studies (e.g. Lu and Dong, 2001; Kobayashi et al., 2005; Xue and Fan, 2019; Chen and Lu, 2023). In this study, the sign is opposite to earlier studies in order to couple circulation patterns associated with positive values of SWNPI with circulation response to heating sources. Thus, a positive value of SWNPI denotes enhanced convection over the SWNP region, and vice versa.
The SWNPI has strong interannual and intraseasonal variability, which is well documented in previous studies (Nitta, 1987; Huang and Sun, 1992; Kosaka and Nakamura, 2006; Wang et al., 2016; Sun et al., 2021). The auto-correlation function of the daily SWNPI gives an e-folding timescale of about 5 d (Fig. S1), suggesting a lifespan of the SWNP convection being about 10 d, in agreement with Sun et al. (2021).
2.2 Wave decomposition of ERA5
Wave components of tropical circulation are obtained by carrying out modal decomposition of ERA5 reanalysis data (Hersbach et al., 2020) using the MODES software (Žagar et al., 2015). The MODES provides a multi-variate representation of the global circulation in terms of 3D orthogonal vertical and horizontal structure functions (VSFs and HSFs, respectively). The VSFs are the numerical solutions of the vertical structure equation whereas the HSFs are eigensolutions of the spherical shallow-water equations, and are called the Hough harmonics. The Hough harmonics are defined as a product of the latitude-dependent Hough functions and harmonic waves in the longitudinal direction (e.g. Longuet-Higgins, 1968; Swarztrauber and Kasahara, 1985; Žagar and Tribbia, 2020). The horizontal and vertical structures are coupled by the eigenvalues of the vertical structure equation, the so-called “equivalent depth”. Additional information on the wave decomposition method is provided in the Supplement and references therein.
Modal decomposition is wavenumber decomposition, applied at each time step with data without assumption on temporal wave evolution. The decomposition produces time series of nondimensional complex expansion coefficients . The 3-component index of χν consists of indices for the zonal wavenumber k, the meridional mode index n and the vertical mode index m. The meridional indices differentiate between the linearly balanced (or nearly non-divergent) Rossby modes and linearly unbalanced IG modes. The IG modes consist of eastward- and westward-propagating solutions, denoted EIG and WIG respectively. We use “modes” and “waves” interchangeably but the latter refers to the case without the zonal mean state (k=0). The meridional index n can take integer values starting from 0 and it defines the order of the associated Legendre functions which are used to represent the non-dimensional horizontal oscillations on the sphere (Swarztrauber and Kasahara, 1985). In MODES, the MRG mode is labelled as the lowest balanced mode or n=0 Rossby mode and the Kelvin mode is the n=0 EIG mode. Note that the spherical mode indexing is different from the solutions on the equatorial β-plane (Matsuno, 1966); in this case the Kelvin mode is denoted the whereas the n=0 EIG mode is called the eastward-propagating MRG mode (see discussion in Boyd, 2018).
2.3 Decomposition setup and climatology
The ERA5 data are used as daily averages of circulation on 26 pressure levels from 1000 to 125 hPa on the regular N128 Gaussian grid which includes 512 and 256 points in the longitudinal and latitudinal directions, respectively. Only the data in boreal summer season June-July-August (JJA) during 1979 to 2021 are used. The projection involves 200 zonal wavenumbers and the zonal mean state (k=0), 70 meridional modes for each of the three wave species (EIG, WIG and Rossby) and 19 vertical modes. The expansion is complete except for the vertical truncation which leaves the lower troposphere incompletely represented by the projection (e.g. Žagar et al., 2009). This means that the original physical field corresponds to the inverse transform of all modes (the sum of Rossby, Kelvin, MRG, WIG, and EIG modes) from wave space to physical space. Similarly, as the 3D normal modes are orthogonal, all moments can be evaluated in the wave and regime space of the Rossby and IG modes. The total global wave variance is a sum of variances in individual wave components.
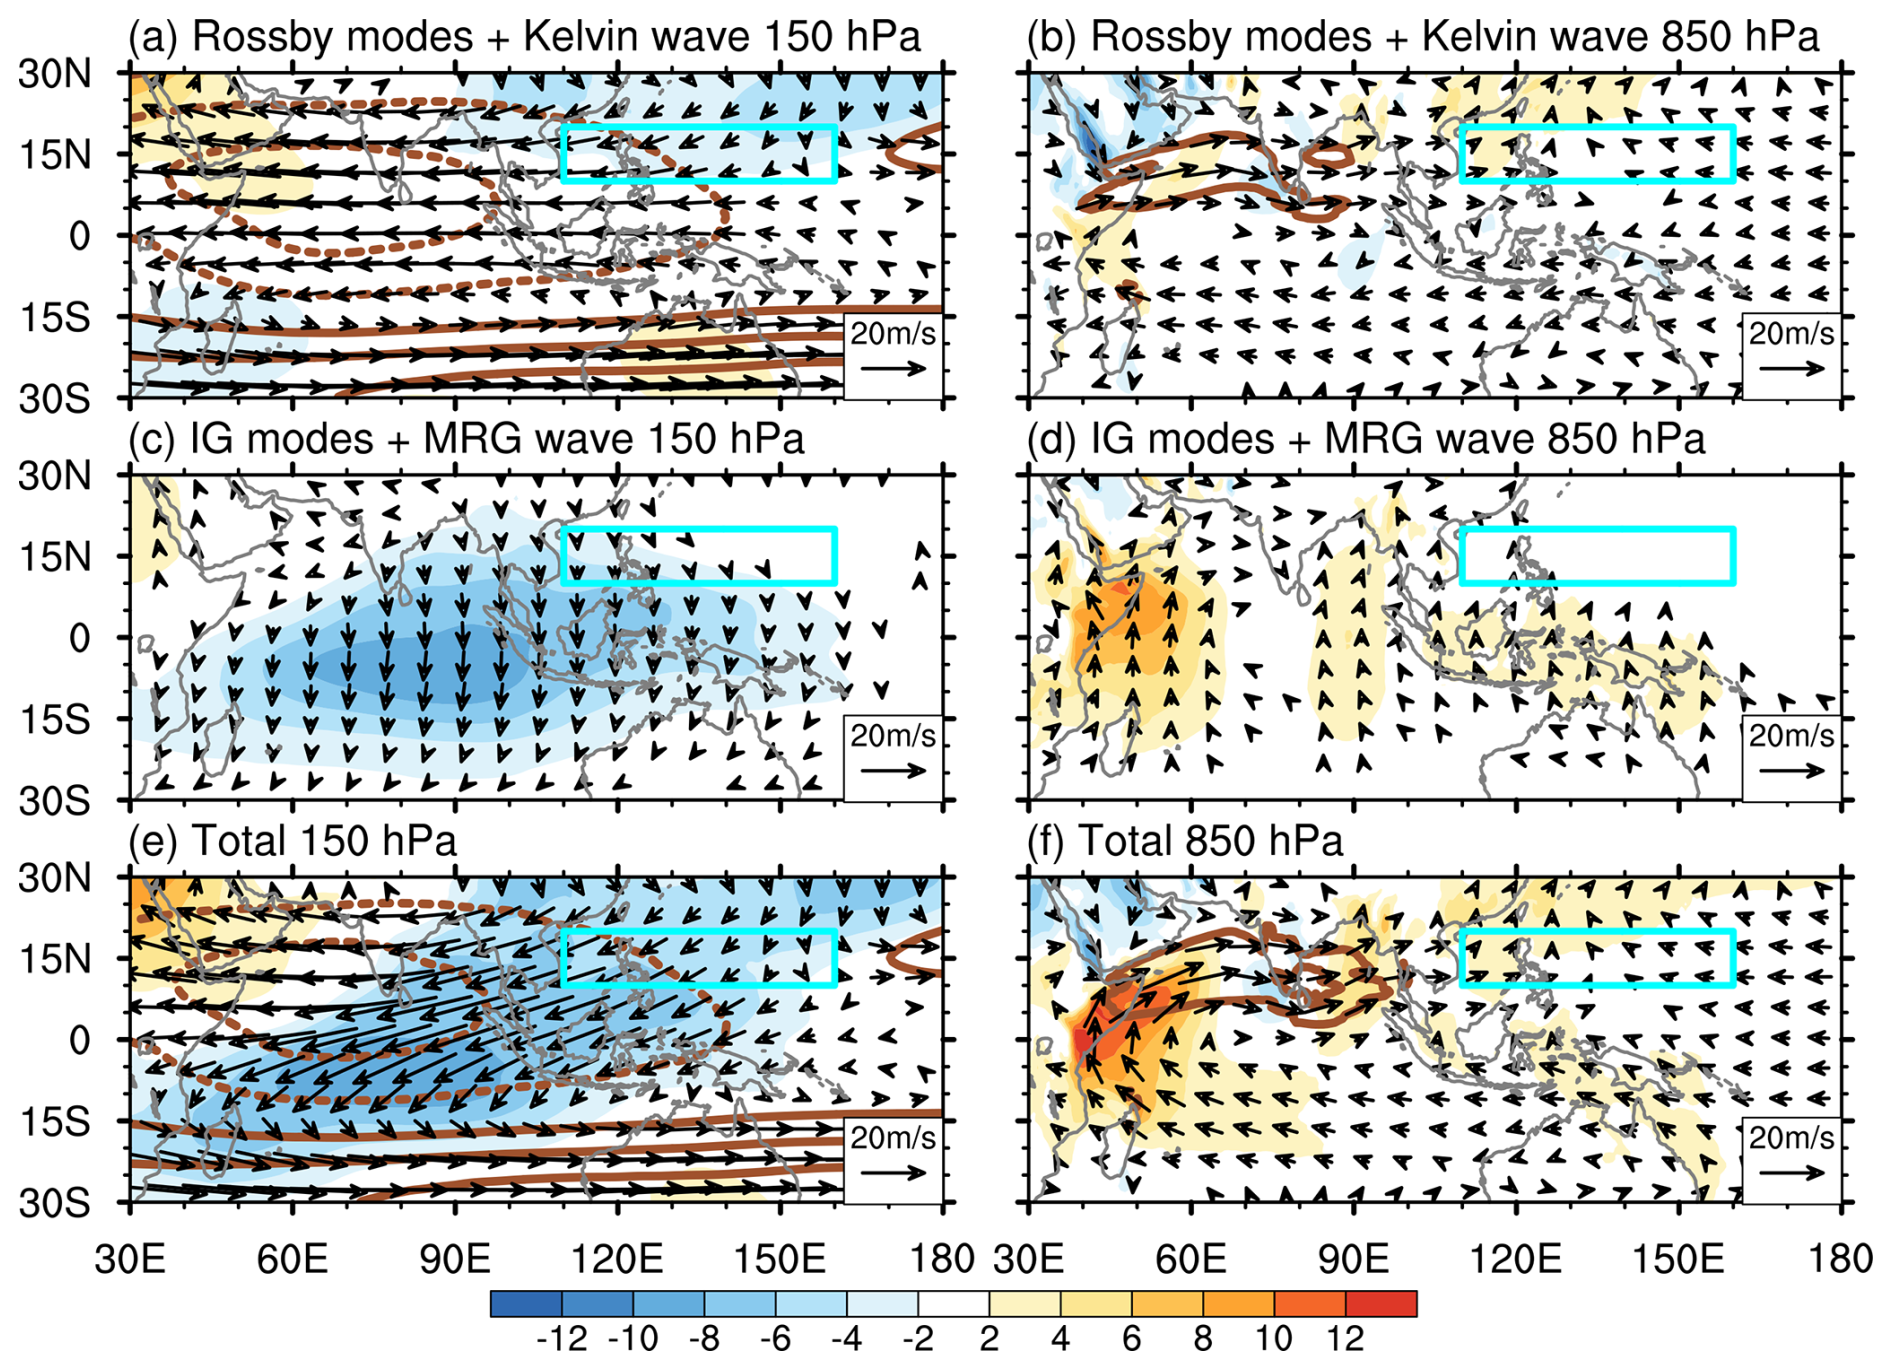
Figure 1Climatological horizontal winds at (a, c, e) 150 hPa and (b, d, f) 850 hPa in boreal summer for (a–b) the sum of Rossby modes and Kelvin waves, (c–d) the sum of IG modes and MRG waves, and (e–f) total circulation. The blue box denotes the SWNP region. Shading denotes the meridional wind whereas full and dashed contours represent the westerly and easterly zonal winds, respectively. The contouring interval for the zonal wind is ±15 m s−1 starting at ±10 m s−1, and the zero contour is omitted. The contouring interval for the meridional wind is ±2 m s−1 starting at ±2 m s−1, as shown by the colorbar.
Figure 1 shows the JJA climatological horizontal winds at 150 and 850 hPa levels split into components associated with the Rossby modes and the Kelvin waves – the Gill solution, and with the IG modes and MRG waves. The climatological winds are obtained by applying the inverse transform from wave space to physical space for the time-averaged spectral expansion coefficients in JJA during 1979–2021. Their sum corresponds to the total circulation. The Gill part (Fig. 1a, b) is primarily the zonal circulation, whereas the meridional circulation is predominantly contributed by the MRG and IG modes (Fig. 1c, d). Specifically, the Gill part largely contributes to the tropical easterly jet in the upper troposphere (Fig. 1a, e) and the zonal flow of Somali jet in the lower troposphere (Fig. 1b, f). The MRG and IG waves – non-Gill part – plays an important role in providing the upper-troposphere northerly and lower-troposphere southerly flow across the equator over the tropical Indian Ocean and western Pacific (Fig. 1c–f), as hypothesized. In the SWNP region (blue box), the upper troposphere northerly outflow from the region across the Maritime Continent is represented by the MRG and IG modes whereas the north-easterly to easterly winds stand for the Gill part of the flow. Together, the two components represent the north-easterly outflow over the deep summer convection in the region (Fig. 1a, c, e).
2.4 Coupling convection and wave circulation
In order to isolate wave modes related to the SWNP convection activity, we perform a linear regression between the time series of SWNPI and the complex expansion coefficient . Regression in wave space defined by the projection of 3D circulation onto different wave modes and selected circulation index was introduced by Žagar and Franzke (2015) who applied the method to identify equatorial waves associated with the Madden-Julian Oscillation. The regression is computed as
where τ denotes the time lag, stands for time averaging and Var(SWNPI) denotes the temporal variance of the SWNPI. The obtained complex coefficient describes the projection of the global circulation associated with the SWNP convection, as represented by the SWNPI, on Rossby, IG, Kelvin and MRG modes. The inverse projection of to physical space provides the wind and geopotential anomalies associated with convective activity over the SWNP region.
To assess the relative temporal evolution of convection and waves, the regression is performed for τ varying from −6 to +6 d, given that SWNP convection has the e-folding timescale of approximately 5 d. For τ<0, the OLR anomalies lag the circulation anomalies, and the τ>0 means that the OLR anomalies lead the circulation anomalies. For the purpose of discussing the dynamics, we assume enhanced convection (i.e., positive SWNPI) at day 0.
3.1 Circulation associated with SWNP convection at day 0
3.1.1 Total circulation
Figure 2 shows the total horizontal wind anomalies at 150 and 850 hPa in the tropics associated with OLR variability over the SWNP region at day 0. The upper-troposphere cross-equatorial northeasterly flow extending from the SWNP region to southeast Indian Ocean is related to enhanced SWNP convection. Its zonal component exceeds 5 m s−1 whereas the meridional component is locally over 3.5 m s−1. This northeasterly flow, combined with the weaker southerly flow towards the extratropics, causes divergence over the SWNP region (Fig. 2a). In the lower troposphere, there is anomalous cyclonic circulation over the SWNP region with its southwesterly component crossing the equator over the Maritime Continent (Fig. 2b). The above-described climatological circulation anomalies in boreal summer are similar to the results of previous studies, mostly applying for the monthly or seasonal timescale (Nitta, 1987; Lu and Dong, 2001; Wang et al., 2001; Li et al., 2019; Zhao et al., 2022; Chen and Lu, 2023).
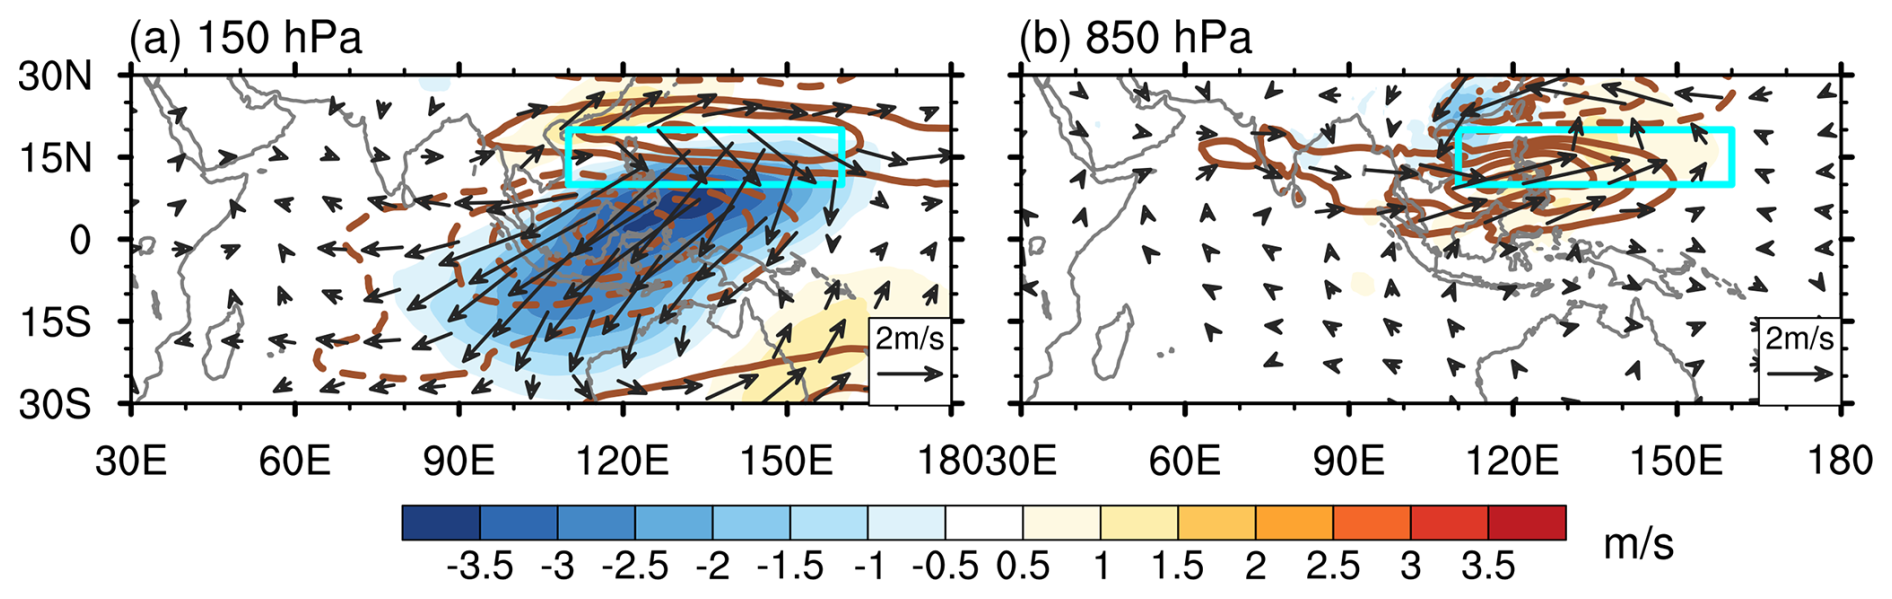
Figure 2Total horizontal wind anomalies associated with the OLR variability over the SWNP region at (a) 150 hPa and (b) 850 hPa. Shading denotes the meridional wind whereas full and dashed contours represent the westerly and easterly zonal winds, respectively. The contouring interval for the zonal wind is ±1 m s−1, and the zero contour is omitted. The contouring interval for the meridional wind is ±0.5 m s−1 starting at ±0.5 m s−1, as shown by the colorbar. Vectors show wind anomalies significant at the 95 % confidence level based on the Student's t test. The blue box denotes the SWNP region.
Note that Fig. 2 is based on ERA5 data without involving modal decomposition; in other words, we computed correlations between the convection index and circulation in grid points at 150 and 850 hPa. An equivalent figure produced applying formula (1) and inverse of the resulting complex field is provided in the Supplement as Fig. S2. Deviations are very small, demonstrating that the MODES decomposition is a complete representation of regional circulation. Now we proceed with the circulation decomposition to discuss how roles of different waves in shaping the observed anomalies in Fig. 2.
3.1.2 Rossby and Kelvin waves
Figure 3 presents the horizontal winds of Rossby waves and Kelvin waves associated with SWNP convection variability at two levels. Enhanced convection over the SWNP region is associated with significant easterly wind anomaly in Rossby wave flow over the Maritime Continent in the upper troposphere with the amplitude exceeding 3 m s−1 (Fig. 3a). The easterly wind anomaly over the Maritime Continent is additionally strengthened by the Kelvin waves (Fig. 3c), which contribute to the easterly outflow off the SWNP region extending from the tropical Maritime Continent to the Indian Ocean. Its amplitude exceeds 1 m s−1. The Kelvin wave signal contributes to the upper-level divergence over the SWNP region, especially on its westerly side. The upper-tropospheric easterly wind anomaly at the equator is accompanied by the anomalous Rossby-wave anticyclonic circulation in the NH subtropics (Fig. 3a), especially over the SWNP region, as expected by the Gill solution. The centre of the anticyclone in the NH is over the SWNP region. The subtropical part of the Kelvin waves acts to weaken the Rossby-wave westerlies in the north and strengthen the Rossby-wave easterlies in the southern part of the SWNP region (Fig. 3a, c, e). This result is mainly contributed by planetary-scale (k=1–3) waves, which exhibit a similar pattern to the total Rossby and Kelvin wave signals (Figs. S6 and S7).
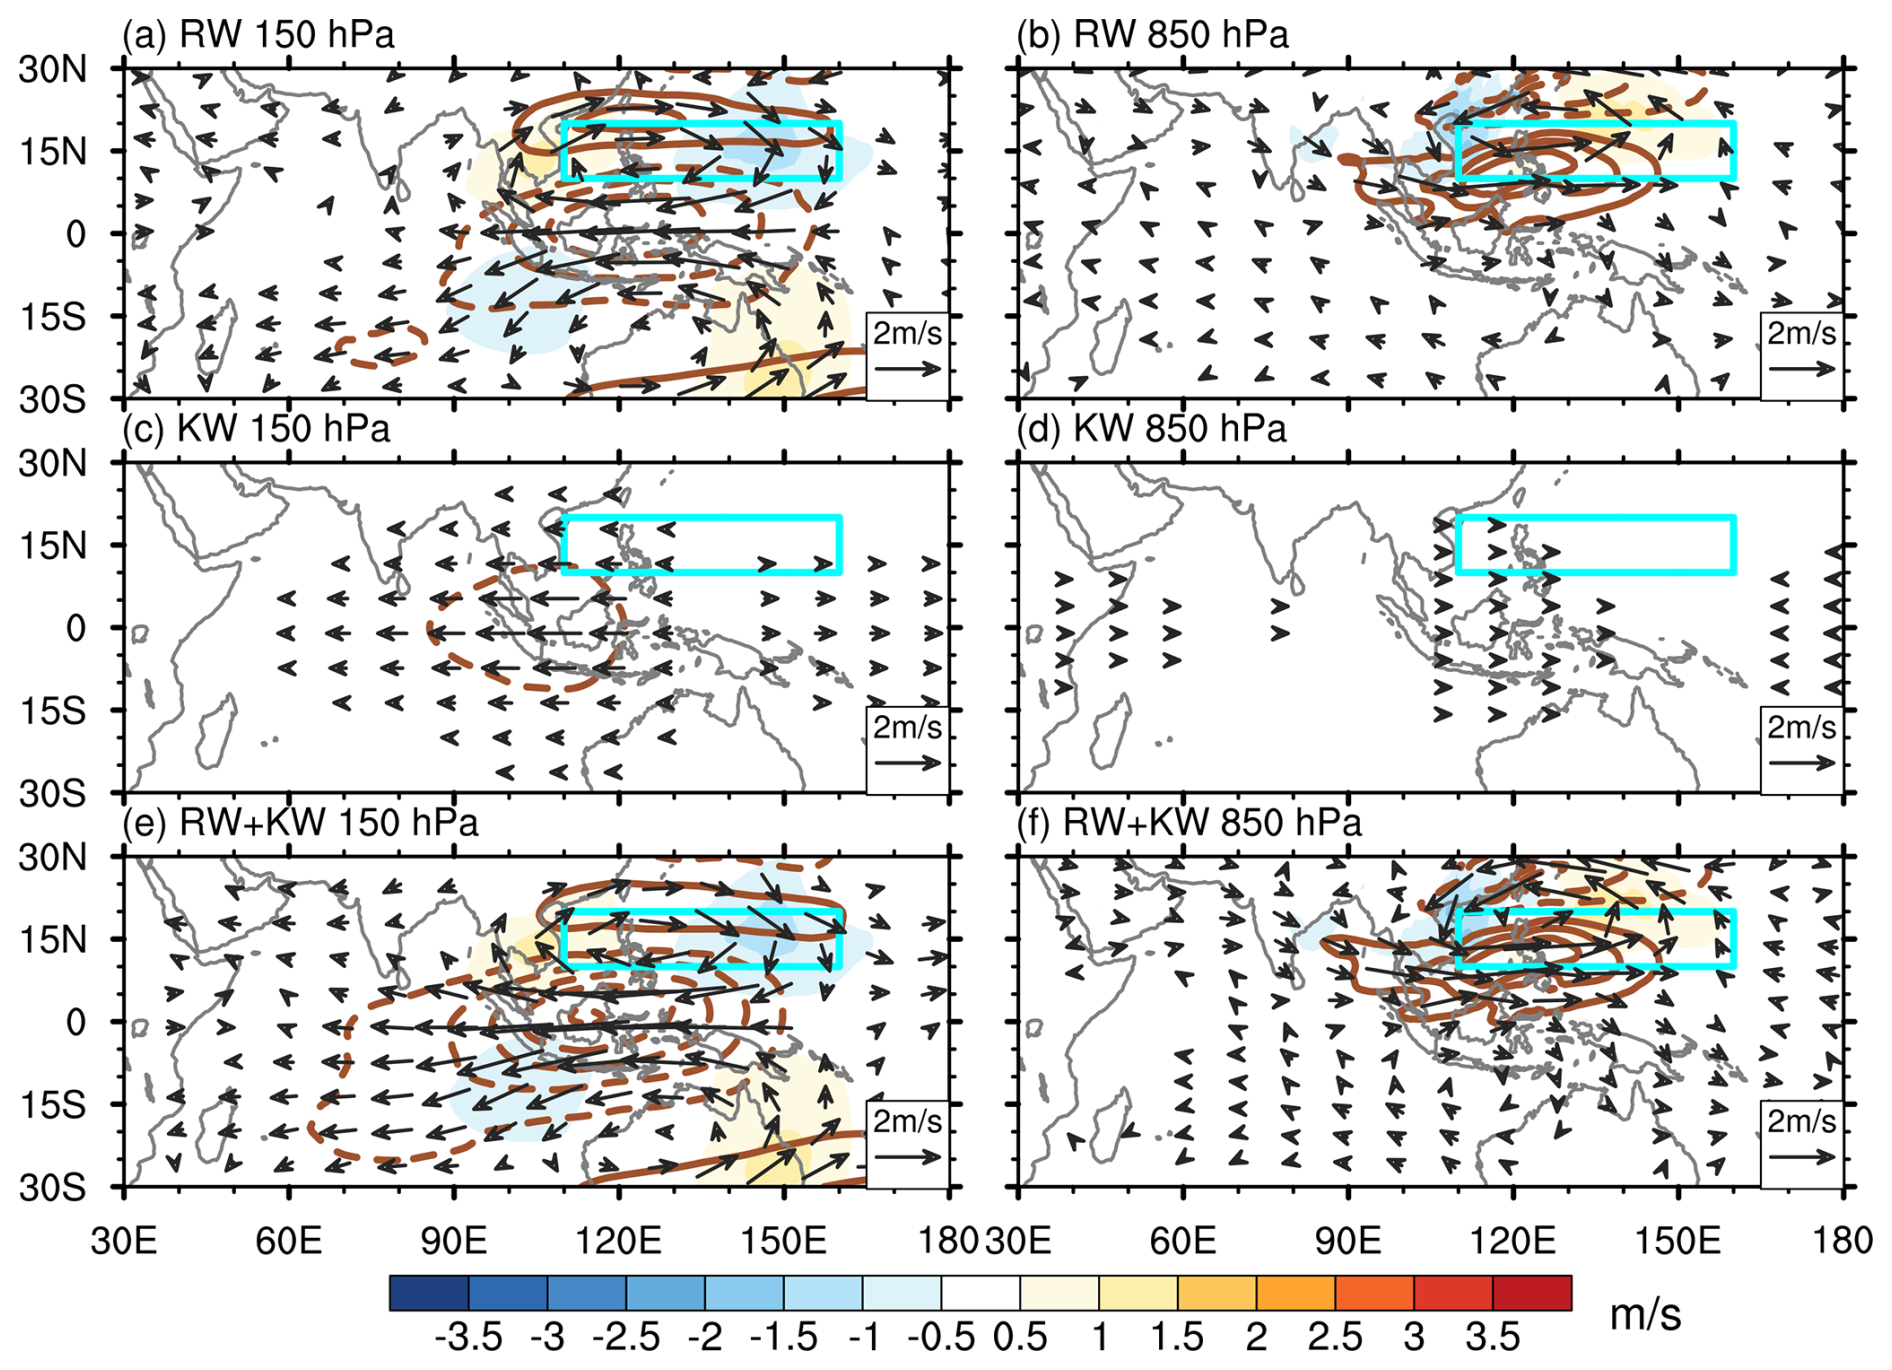
Figure 3As in Fig. 2 but for (a–b) Rossby waves, (c–d) Kelvin waves and (e–f) the sum of Rossby waves and Kelvin waves associated with the OLR variability over the SWNP region at (a, c, e) 150 hPa and (b, d, f) 850 hPa. Vectors indicate the horizontal wind anomalies with magnitudes greater than 0.2 and 0.1 m s−1 at 150 and 850 hPa, respectively.
In the lower troposphere, the centre of anomalous cyclonic circulation is centred in the northern part of the SWNP region (Fig. 3b). The Rossby-wave westerlies on its south-western edge are combined with weaker Kelvin wave westerlies (Fig. 3d). The Kelvin wave signal can be seen up to and inside the SWNP region, this way enhancing the cyclonic circulation anomalies seen in the Rossby wave circulation. In summary, the Kelvin and Rossby wave flows act together to enhance the southern flank of cyclonic circulation over the SWNP region (Fig. 3f), resembling the well-known structure of the Gill solution for the circulation anomaly in response to asymmetric heating located north of the equator (Fig. 3e, f).
To quantitatively compare the contributions of Rossby and Kelvin wave components, we calculated the area-averaged zonal wind anomalies over 90–150° E, 15° S–15° N at 150 and 850 hPa. The Rossby and Kelvin wave contributions are 79 % and 32 % of the total average zonal flow at 150 hPa and 80 % and 11 % at 850 hPa, respectively. The sum of them are 111 % at 150 hPa and 91 % at 850 hPa. These indicate that other modes slightly suppress the upper-easterly and enhance the lower-westerly.
The two-level circulation picture is complemented with the full vertical structure of the zonal wind anomalies averaged over 15° S–15° N (Fig. 4). The longitude-pressure cross section for longitudes between 90 and 150° E around the Maritime Continent shows the largest equatorial easterly flow at 150 hPa and the largest equatorial westerly flow at about 700 hPa, which is similar to the vertical structure of Kelwin waves, albeit the Kelvin wave signal is weaker than the Rossby waves (Fig. 4a–c), suggesting the reinforcing role of Kelvin waves in Rossby wave zonal wind. On the other hand, the latitude-pressure section shows that Rossby waves dominantly contribute to the asymmetric circulation anomalies between the NH and SH (Fig. 4d, e). Particularly, the lower-level Rossby waves in the SH are almost absent but the upper-level Rossby wave circulation is comparable to that in the NH, suggesting that the SWNP convection connects the circulation in the SH extratropics through the related upper-Rossby wave activity. By using numerical simulations, Goyal et al. (2021) also suggested that convection over the Indo-Pacific warm pool as an asymmetric heating source causes a upper-level Rossby wave source in the subtropics to excite a wave-train pattern in the SH extratropics.
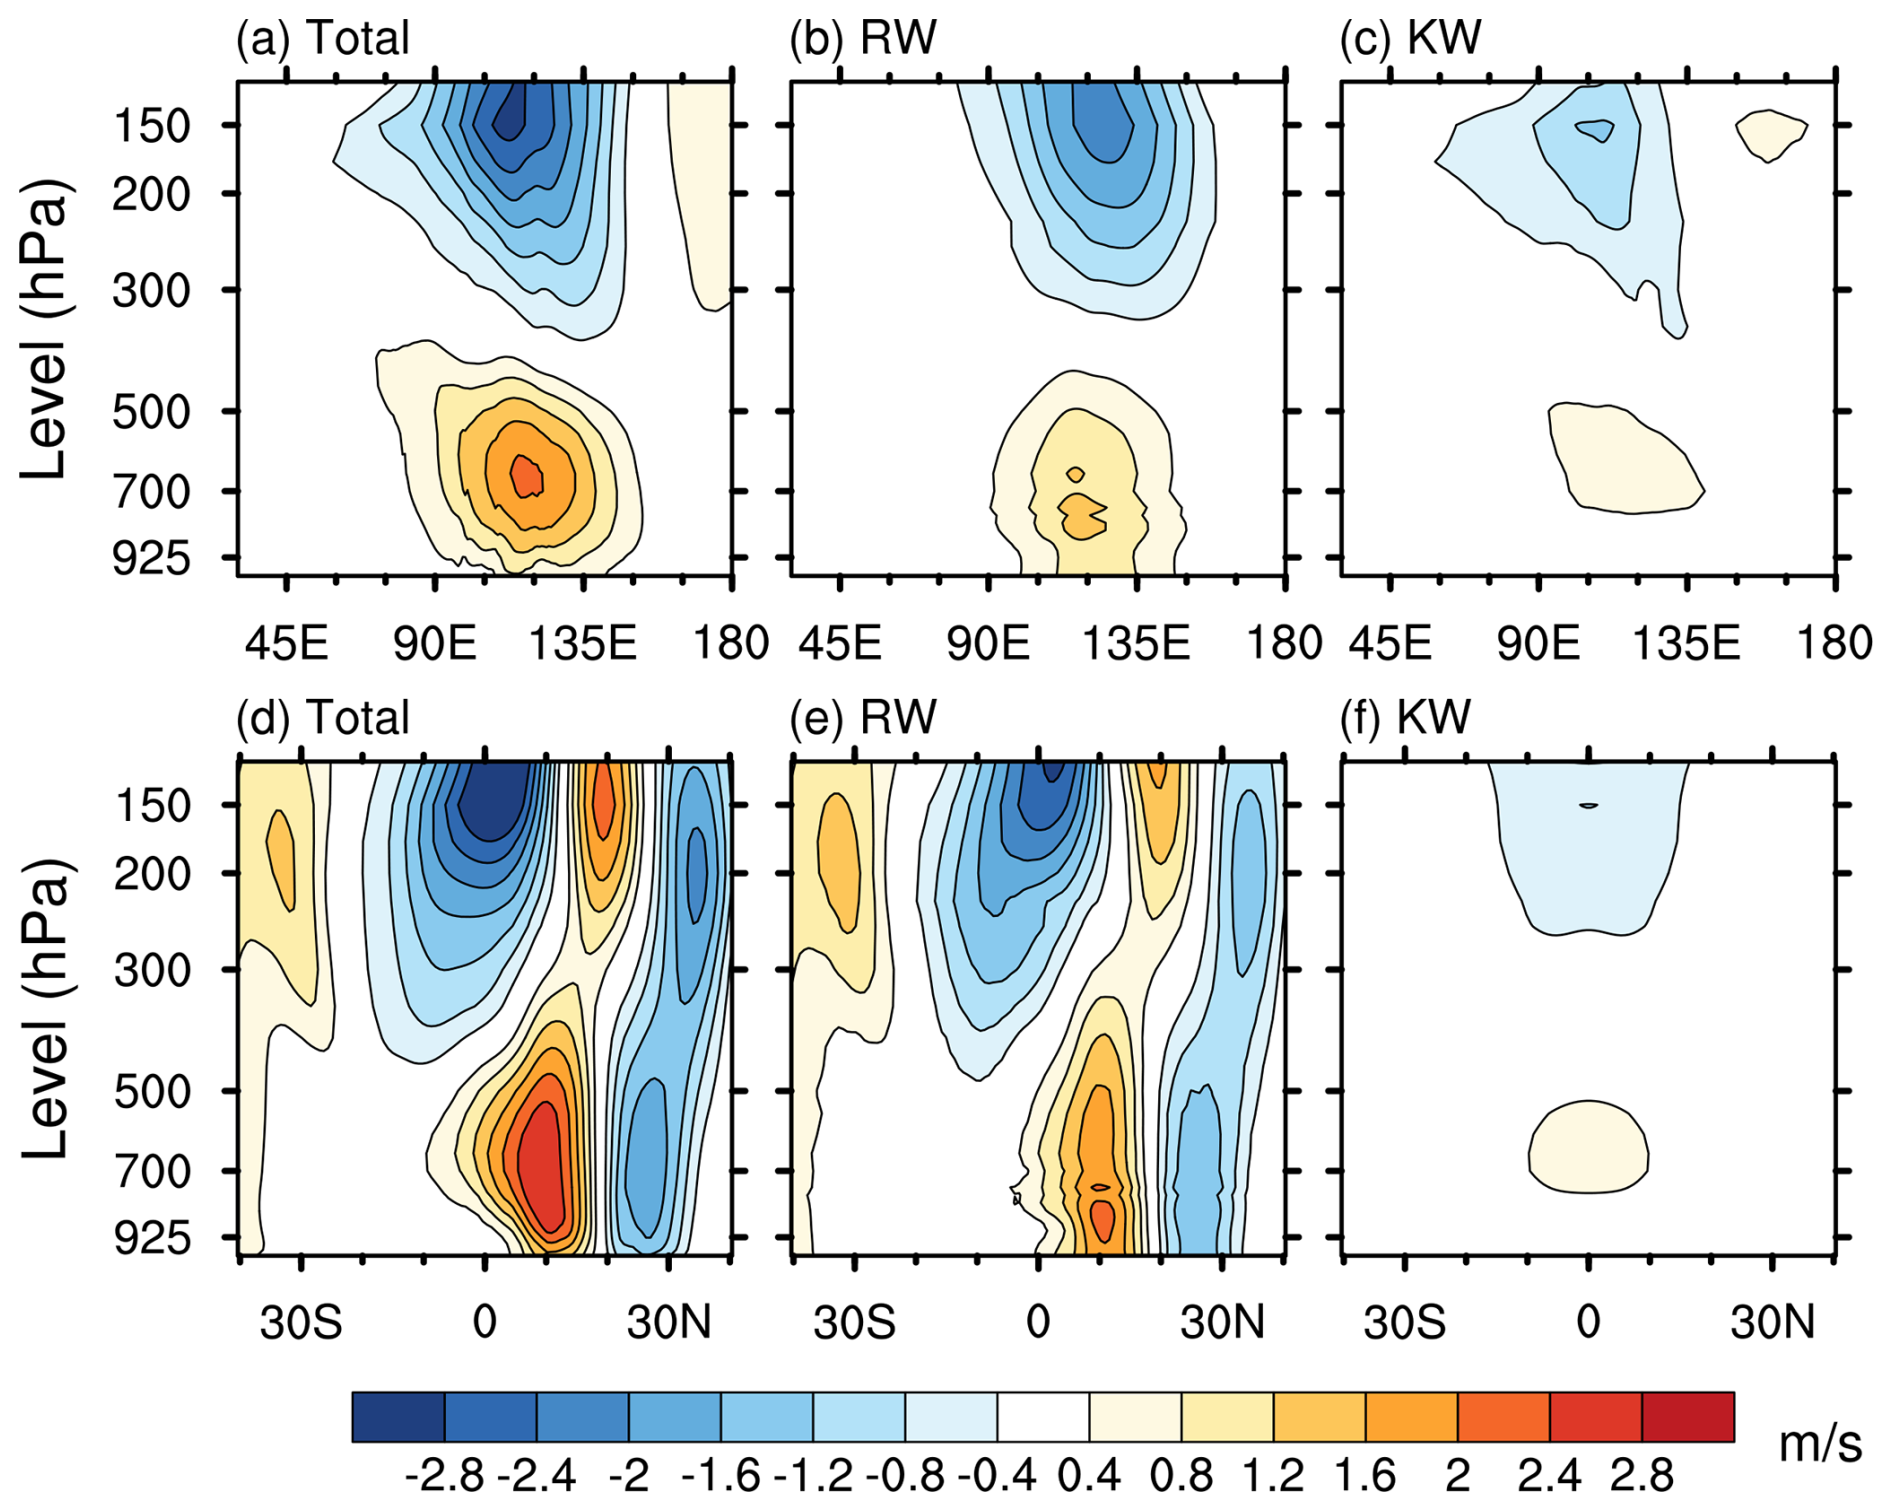
Figure 4(a–c) Longitude-pressure cross section of the zonal wind perturbations between 40 and 180° E, averaged over 15° S–15° N. (d–f) Latitude-pressure cross section of the zonal wind perturbations between 40° N and 40° S, averaged over 90–150° E. (a, d) The total signal, (b, e) Rossby waves and (c, f) Kelvin waves.
3.1.3 IG and MRG waves
The horizontal winds for the IG and MRG waves are shown in Fig. 5 for the two mode types separately and as their sum. It can be seen that both IG and MRG waves contribute to the cross-equatorial northerly flow from the SWNP region in the upper troposphere (Fig. 5a, c, e). The strongest IG wave northerly winds exceed 2 m s−1 and are found at the southern flank of the SWNP region. Together with the southerly flow towards the extratropics in the north of the SWNP region, the IG wave circulation represents most of divergence over the SWNP region in the total signal in Fig. 2a, as could be expected (Neduhal et al., 2024).
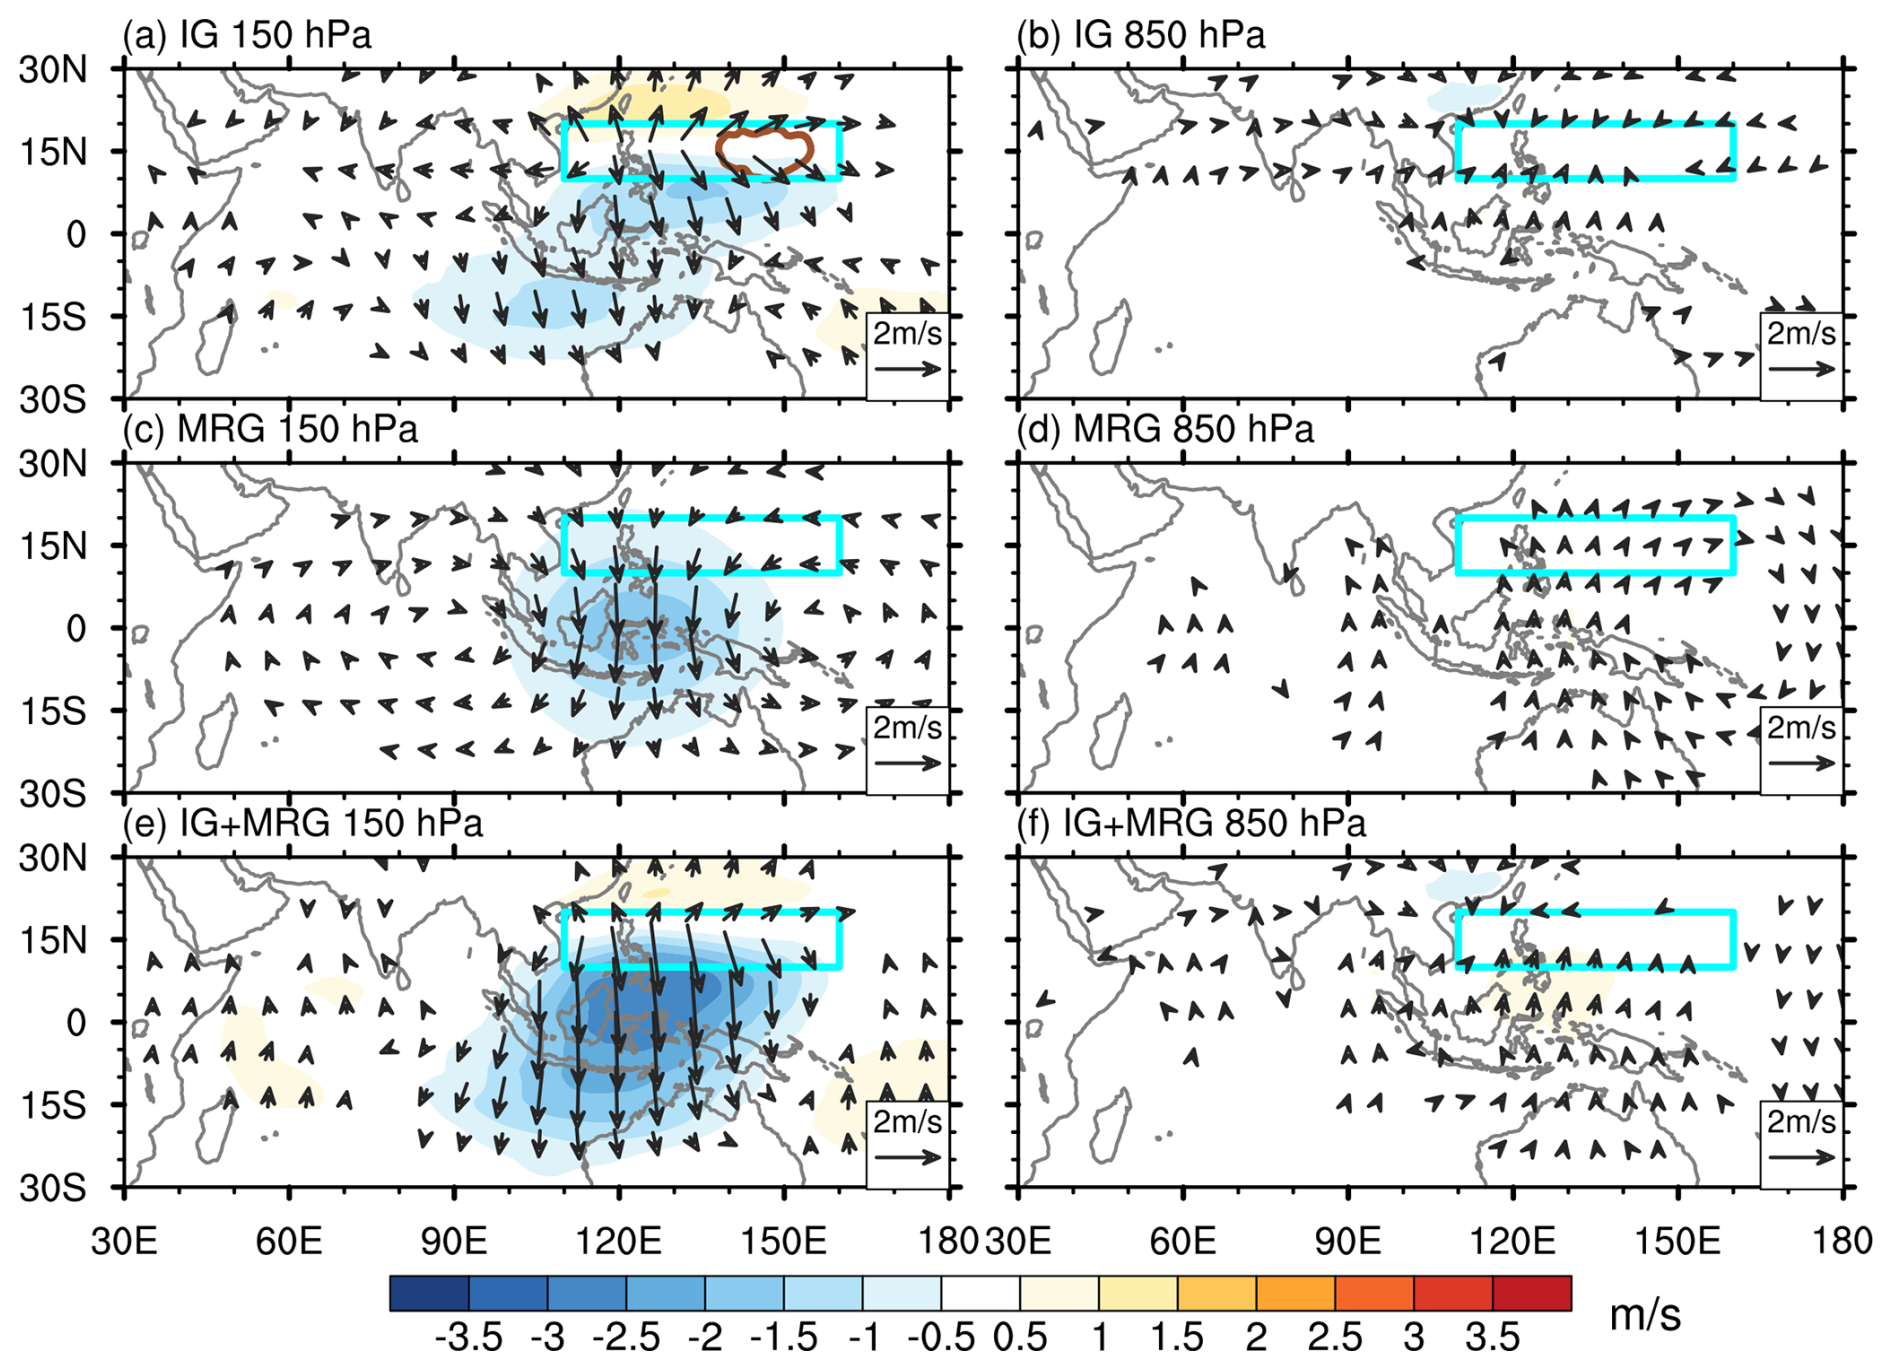
Figure 5As in Fig. 3, but for (a–b) IG waves, (c–d) MRG waves and (e–f) the sum of IG waves and MRG waves.
The overall strength of the northerly flow over the Maritime Continent is explained to a greater extent by the MRG waves than by the IG waves. The MRG wave northerly winds extend further across the equator and reach the northern Australia with amplitudes larger than 2 m s−1 (Fig. 5c). The zonal wind anomalies of the MRG waves are smaller than 1 m s−1, but nevertheless important for shaping the anomalous cyclonic and anticyclonic circulation to the west and east of the maximal MRG northerly flow near 125° E, respectively, as a near-equatorial response to the enhanced SWNP convection. In the lower troposphere, both MRG waves and IG waves contribute to the weak inflow over the SWNP region, with the former dominant and its southerly flow crossing the equator over the Maritime Continent (Fig. 5b, d).
To quantitatively compare the contributions of IG and MRG wave components, we also calculated the area-averaged meridional wind anomalies over 90–150° E, 15° S–15° N at 150 and 925 hPa. Considering that the maximum cross-equatorial flow in the lower troposphere appears at 925 hPa (e.g. Zhao et al., 2023), the area-averaged anomalies at this level are calculated. The IG and MRG wave contributions at 150 hPa are 37 % and 45 % of the total meridional flow, respectively. At 925 hPa, the percentages are 37 % and 53 % for the IG waves and MRG waves, respectively. This also indicates that the near-surface meridional flow associated with SWNP convection is less balanced (i.e. projecting to a smaller extent to Rossby modes) than in the upper troposphere (10 % versus 18 %).
Further details of the vertical structure of the MRG and IG wave meridional winds are presented in Fig. 6. It shows the maximum northerly wind near 150 hPa, while nearly negligible southerly wind anomalies are found at 925 hPa, and the meridional wind between 300 and 700 hPa is almost absent, which is similar to that documented in Zhao et al. (2023). The weak signal near the surface can be a result of the area averaged over 15° S–15° N or 90–150° E, as the cross-equatorial southerly flow is featured by some branches across the Maritime Continent due to the topography (Fig. S3; Li and Li, 2014; Zhao et al., 2023). The new aspect is the vertical structure decomposition showing that the two mode types have comparable contributions in the upper troposphere, with the MRG wave component being stronger (Fig. 6a–c). Moreover, the latitude-pressure cross section of the meridional wind anomalies exhibits asymmetry across the equator (Fig. 6d), which is attributed to the dipole IG wave northerly flow over the north and south of the Maritime Continent (Figs. 6e and 5a).
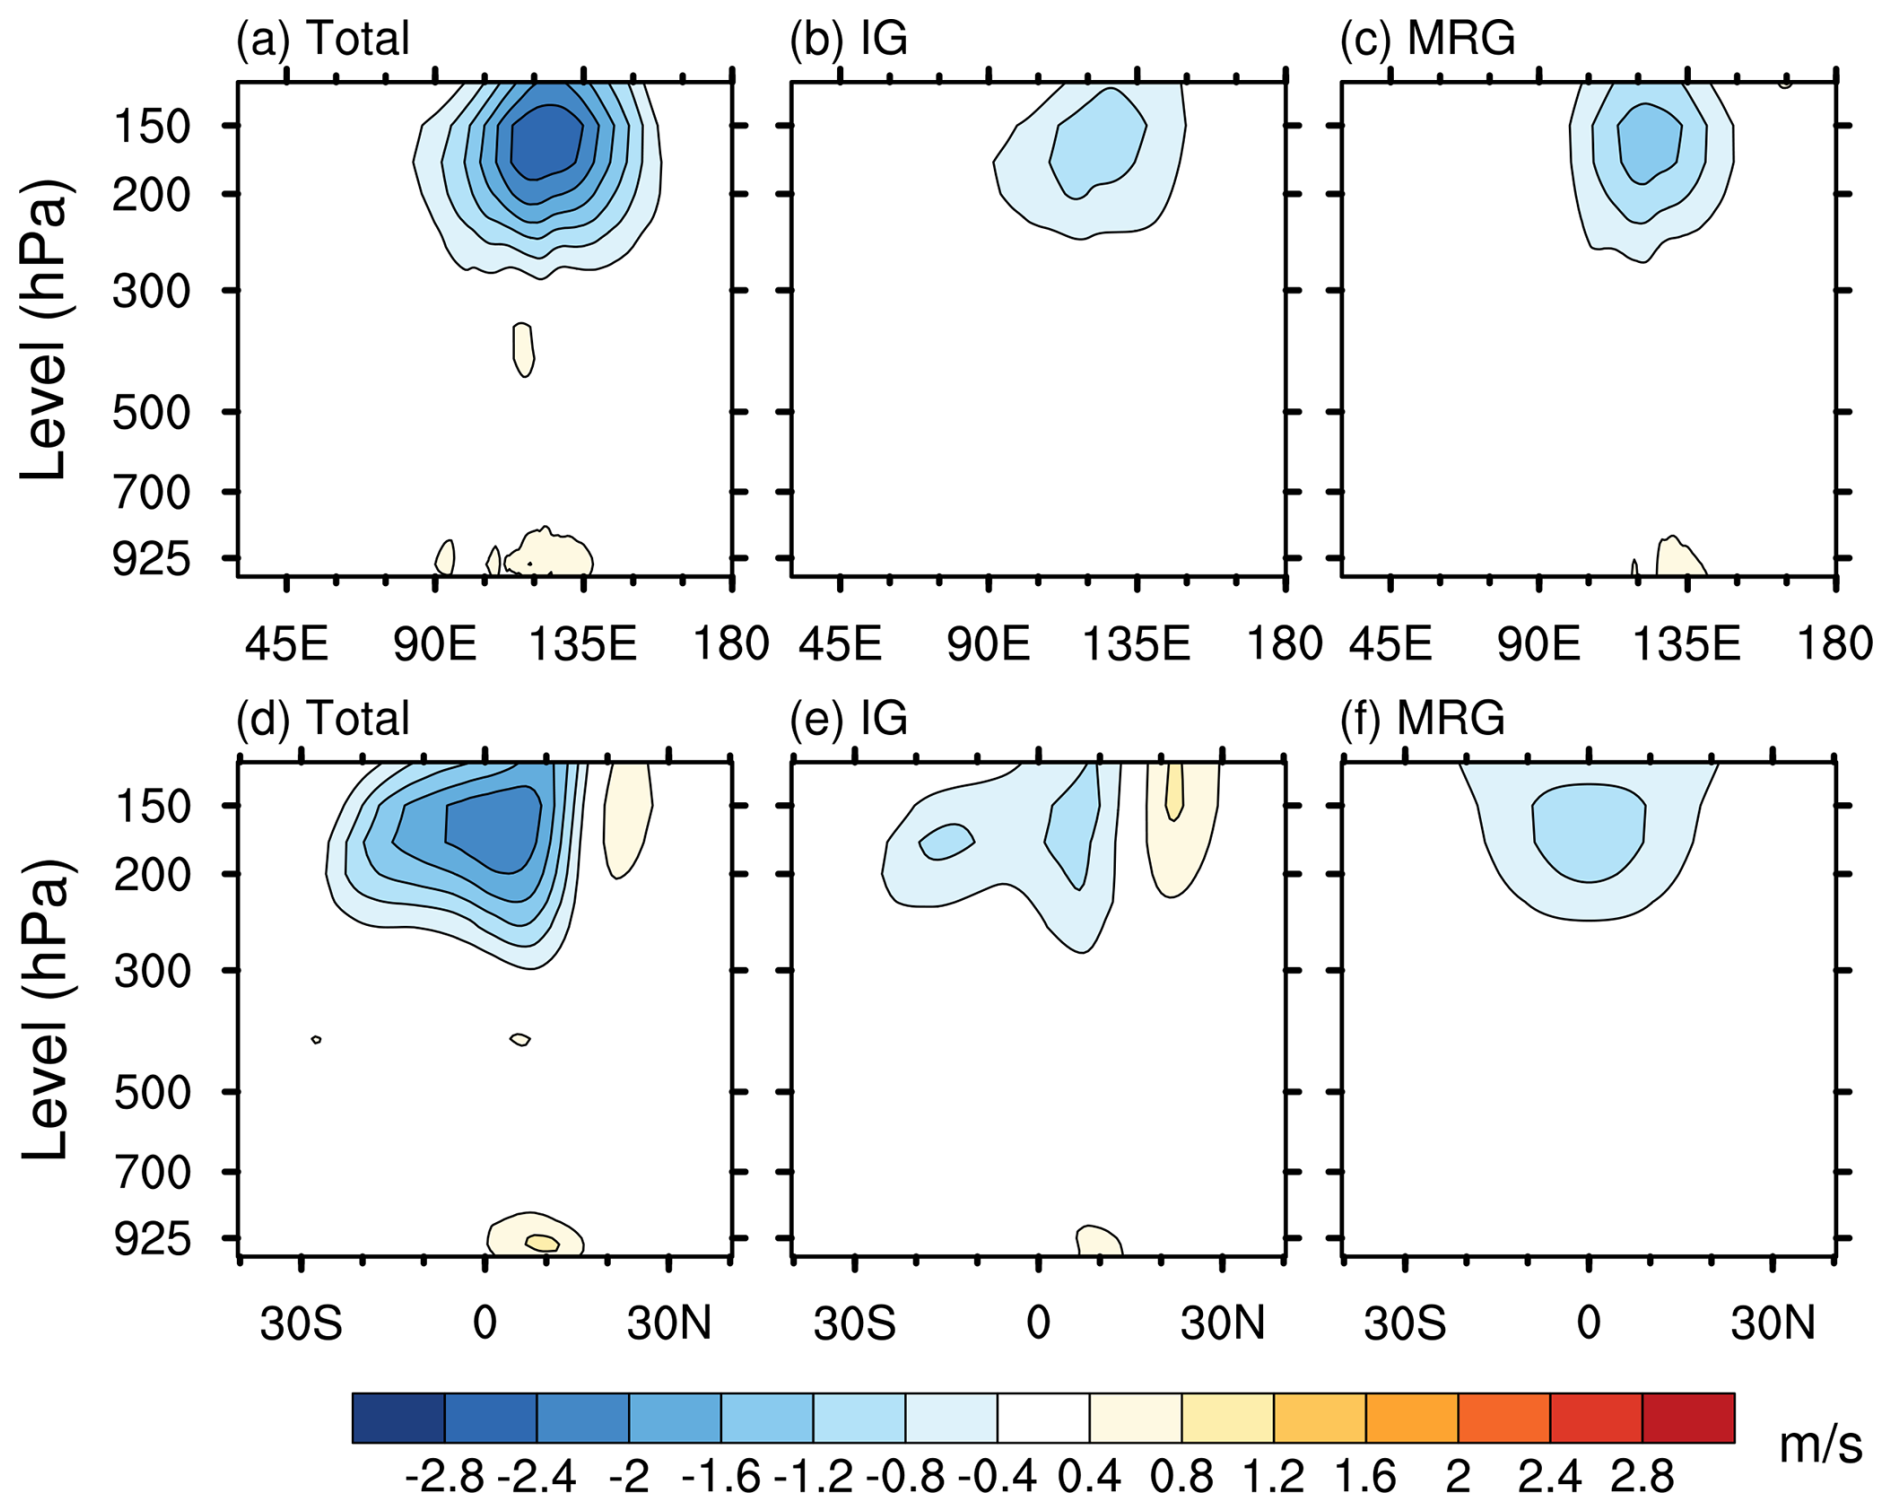
Figure 6As in Fig. 4, but for meridional wind perturbations. (a, d) The total signal, (b, e) IG waves and (c, f) MRG waves.
The new insights provide an important departure from the Gill (1980) solution to the asymmetric forcing or to the sum of the symmetric and asymmetric forcing. We show that solutions based on the long-wave approximation ignore the cross-equatorial flow associated with outflow/inflow over regions with enhanced convection, which projects onto the IG and MRG waves.
3.2 Evolution of SWNP convection and associated equatorial wave circulation
Next, we discuss the results of lagged regression from day −6 to day 6 to examine the temporal evolution of the wave circulations in connection with the SWNP convection at day 0. For brevity, we focus on the flow at 150 hPa, where the circulation response is strongest.
3.2.1 OLR and total circulation
Figure 7 presents the regressed OLR and total horizontal wind anomalies at 150 hPa. Enhanced convection (negative OLR anomalies) in the SWNP region at day −6 intensifies until day 0, followed by a gradual weakening until day 6 (Fig. 7h–n). During this 12 d period, the centre of OLR anomaly shifts westward from about 150° E at day −6 to 120° E at day 6 and moves slightly northward to the northern flank of the region. This behaviour is consistent with the quasi-biweekly oscillation described by Chatterjee and Goswami (2004), Kikuchi and Wang (2009), and Jia and Yang (2013). The relative movement is indicated by the red dots, which denote the location of maximum convection in the SWNP region at this particular day. This westward shift can be attributed to the zonal gradient of moisture anomalies and the mean easterly trade winds, which together precondition moisture anomalies west to the convection (Li et al., 2020).
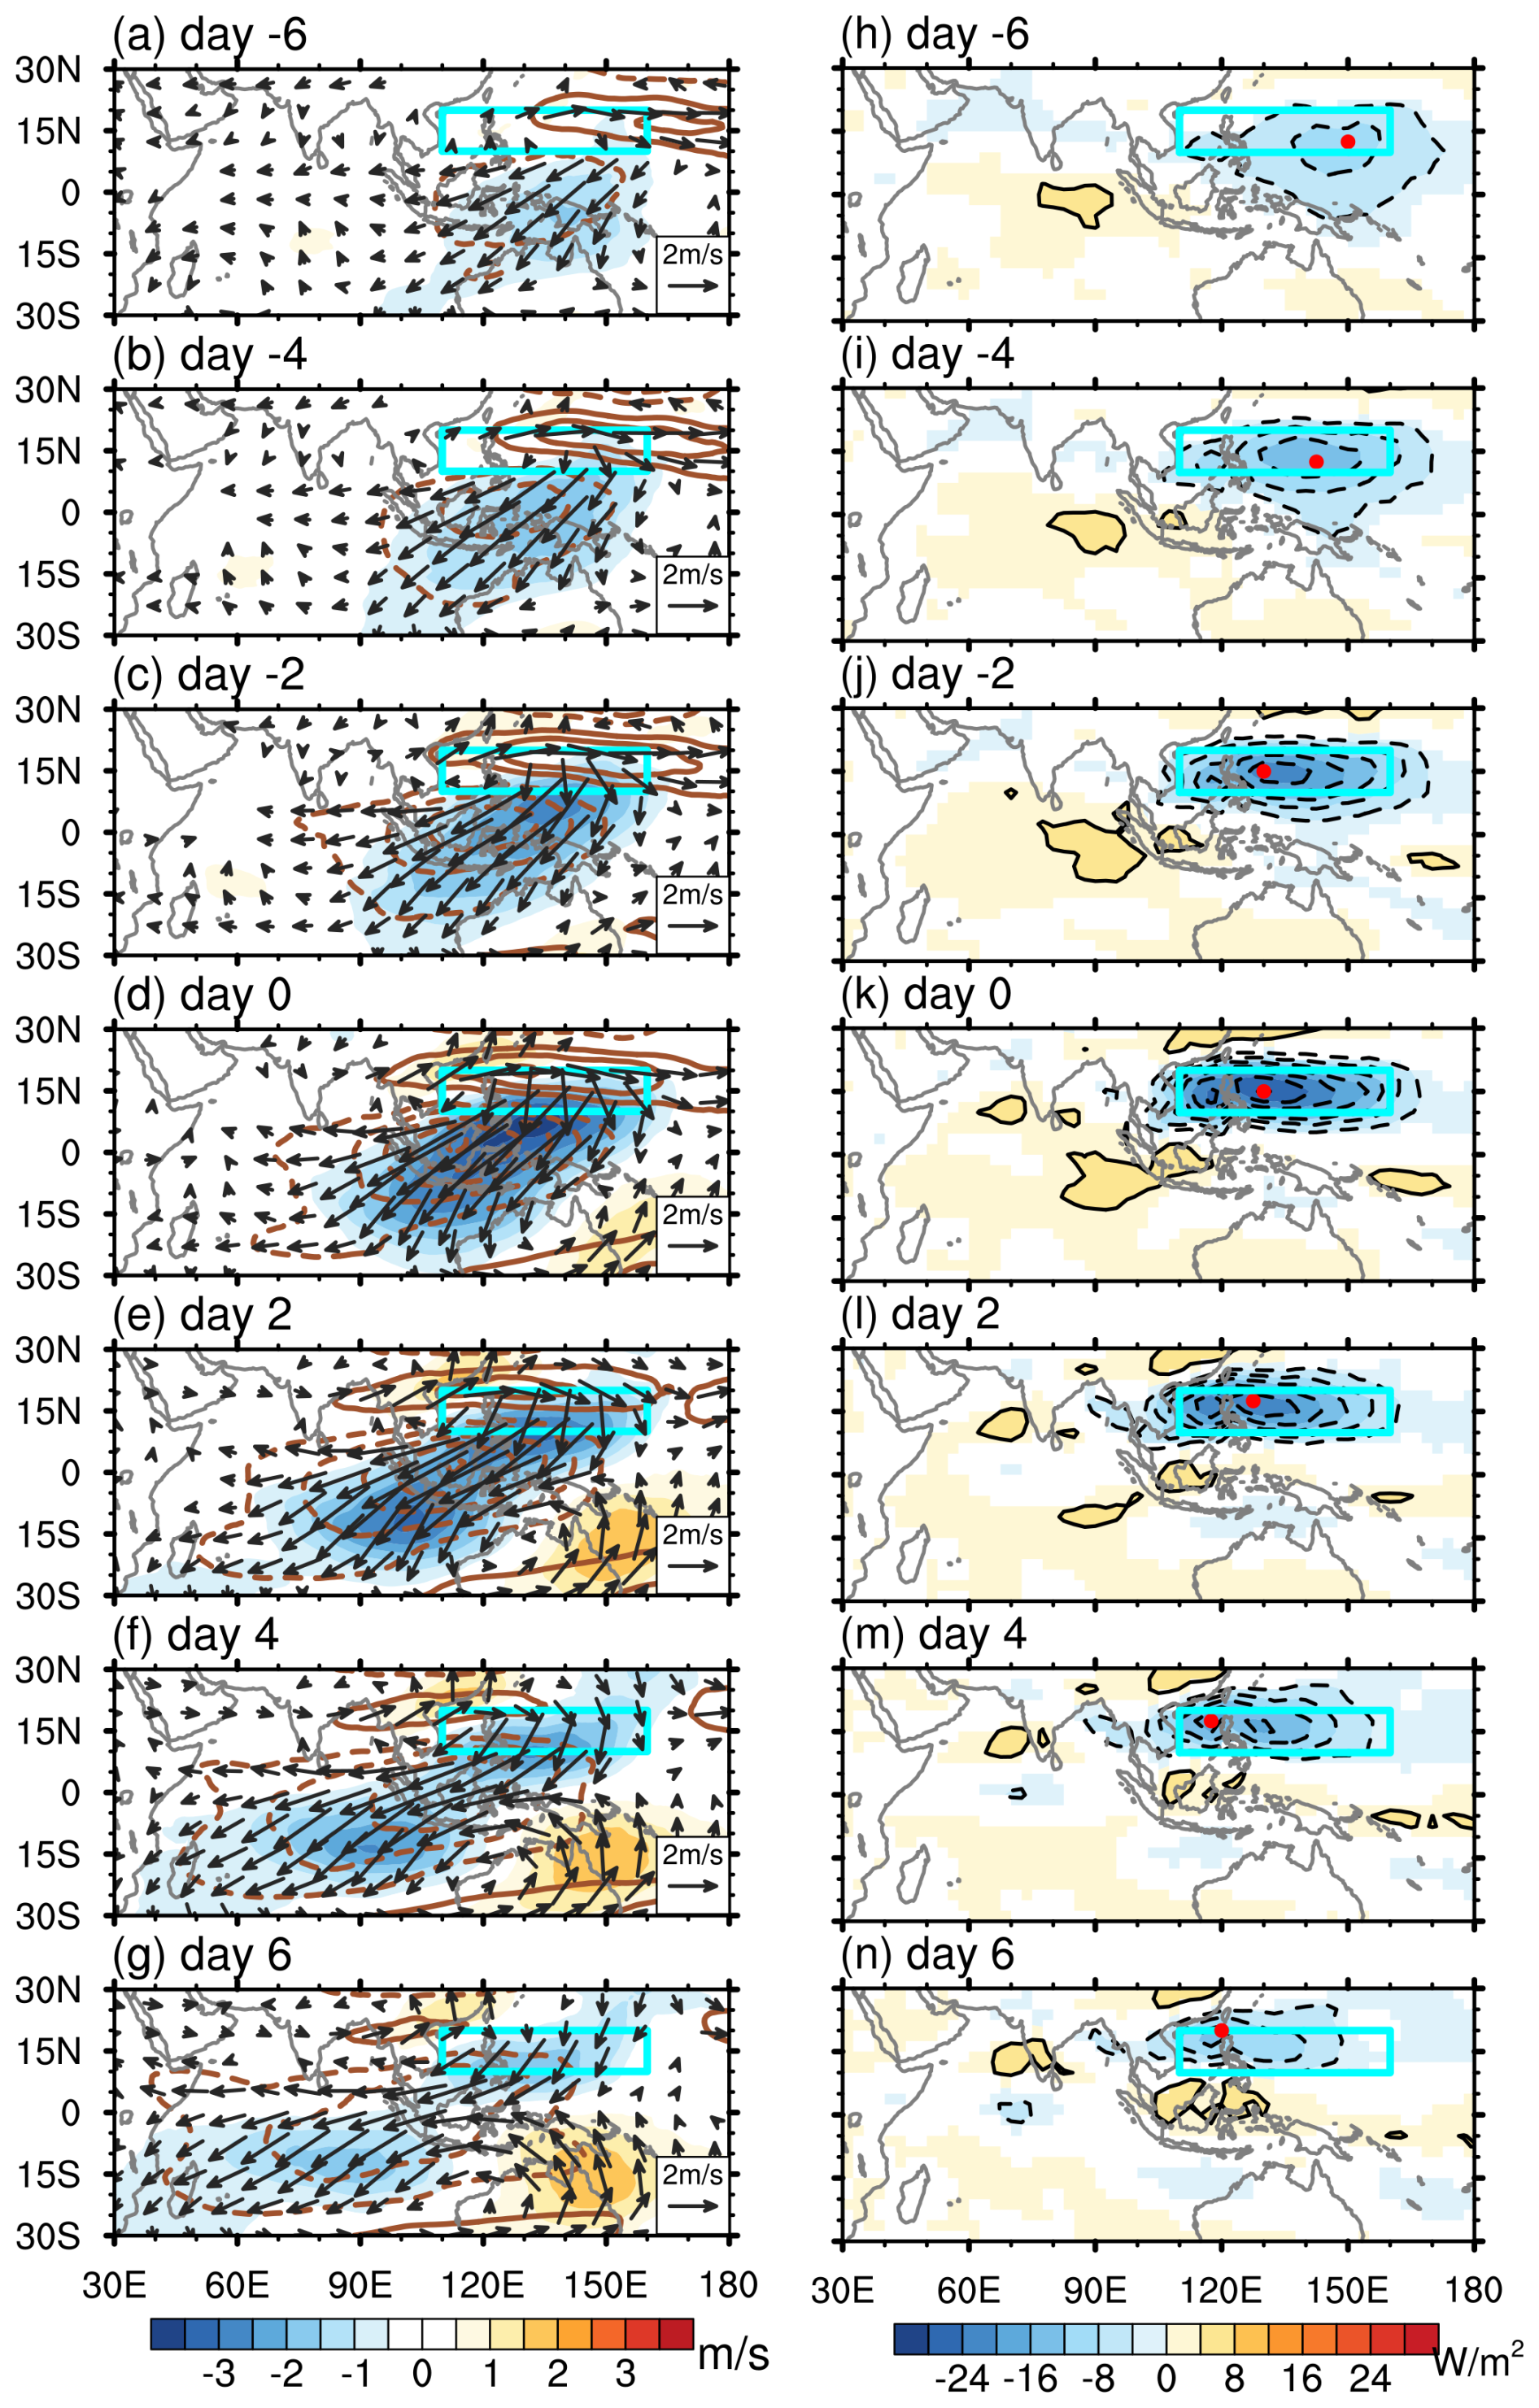
Figure 7Results of the lagged regression between the circulation and OLR anomalies over the SWNP region. (a–g) Total horizontal wind anomalies at 150 hPa (shading: v wind, contours: u wind), and (h–n) OLR anomalies. Significant OLR anomalies are shaded. The red dots denote the maximum OLR anomalies in the SWNP region. Day −6 to day −2 indicate that the OLR anomaly lags circulation from 6 to 2 d. Other details as in Fig. 3.
As the SWNP convection grows stronger from day −6 to day 0, the northeasterly outflow from the region stretches across the equator and expands westward while strengthening (Fig. 7a–d). Convection weakening after day 0 is accompanied by a westward shift of the northeasterly flow south of the equator and development of the anticyclonic circulation over the southern Indian ocean (Fig. 7e–g). The westward shift of cross-equatorial flow associated with the SWNP convection anomalies is consistent with Zhao et al. (2023).
An important result in Fig. 7 is the formation of the upper-tropospheric anticyclonic circulation in the SH subtropics. Within this large-scale feature, southerly wind anomalies develop over Australia and easterlies along the equator intensify, persisting even after day 0. The circulation differs markedly from that at the onset of the SWNP convective lifecycle. As the anticyclone expands westward towards the western Indian Ocean, the northeasterly outflow from the SWNP region becomes increasingly separated from the northerly flow on the westward flank, indicating a gradual decoupling between tropical and subtropical circulation. Additional understanding will be provided according to the roles of different equatorial waves.
3.2.2 Rossby and Kelvin waves
The decomposition reveals the relative roles of Rossby and Kelvin waves (Fig. 8) compared to IG and MRG waves (Fig. 9) in producing the circulation in Fig. 7. Figure 8 shows a growing Rossby wave signal as an upper-tropospheric anomalous anticyclone over the convective region simultaneously with the intensification of SWNP convection (Fig. 8a–d). Moreover, the anticyclone in the SH also appears nearly simultaneously and keeps developing after day 0. In between the two anticyclonic gyres, there are easterly winds making the whole structure resemblant of the equatorial n=1 Rossby wave. This is however not an analytical n=1 Rossby wave – an eigensolution of the linear shallow-water equations on the equatorial β plane (Matsuno, 1966) – but a structure modified by a complex interplay of convection, background flow and vertical stratification, and filtered by the time-independent decomposition performed by MODES.
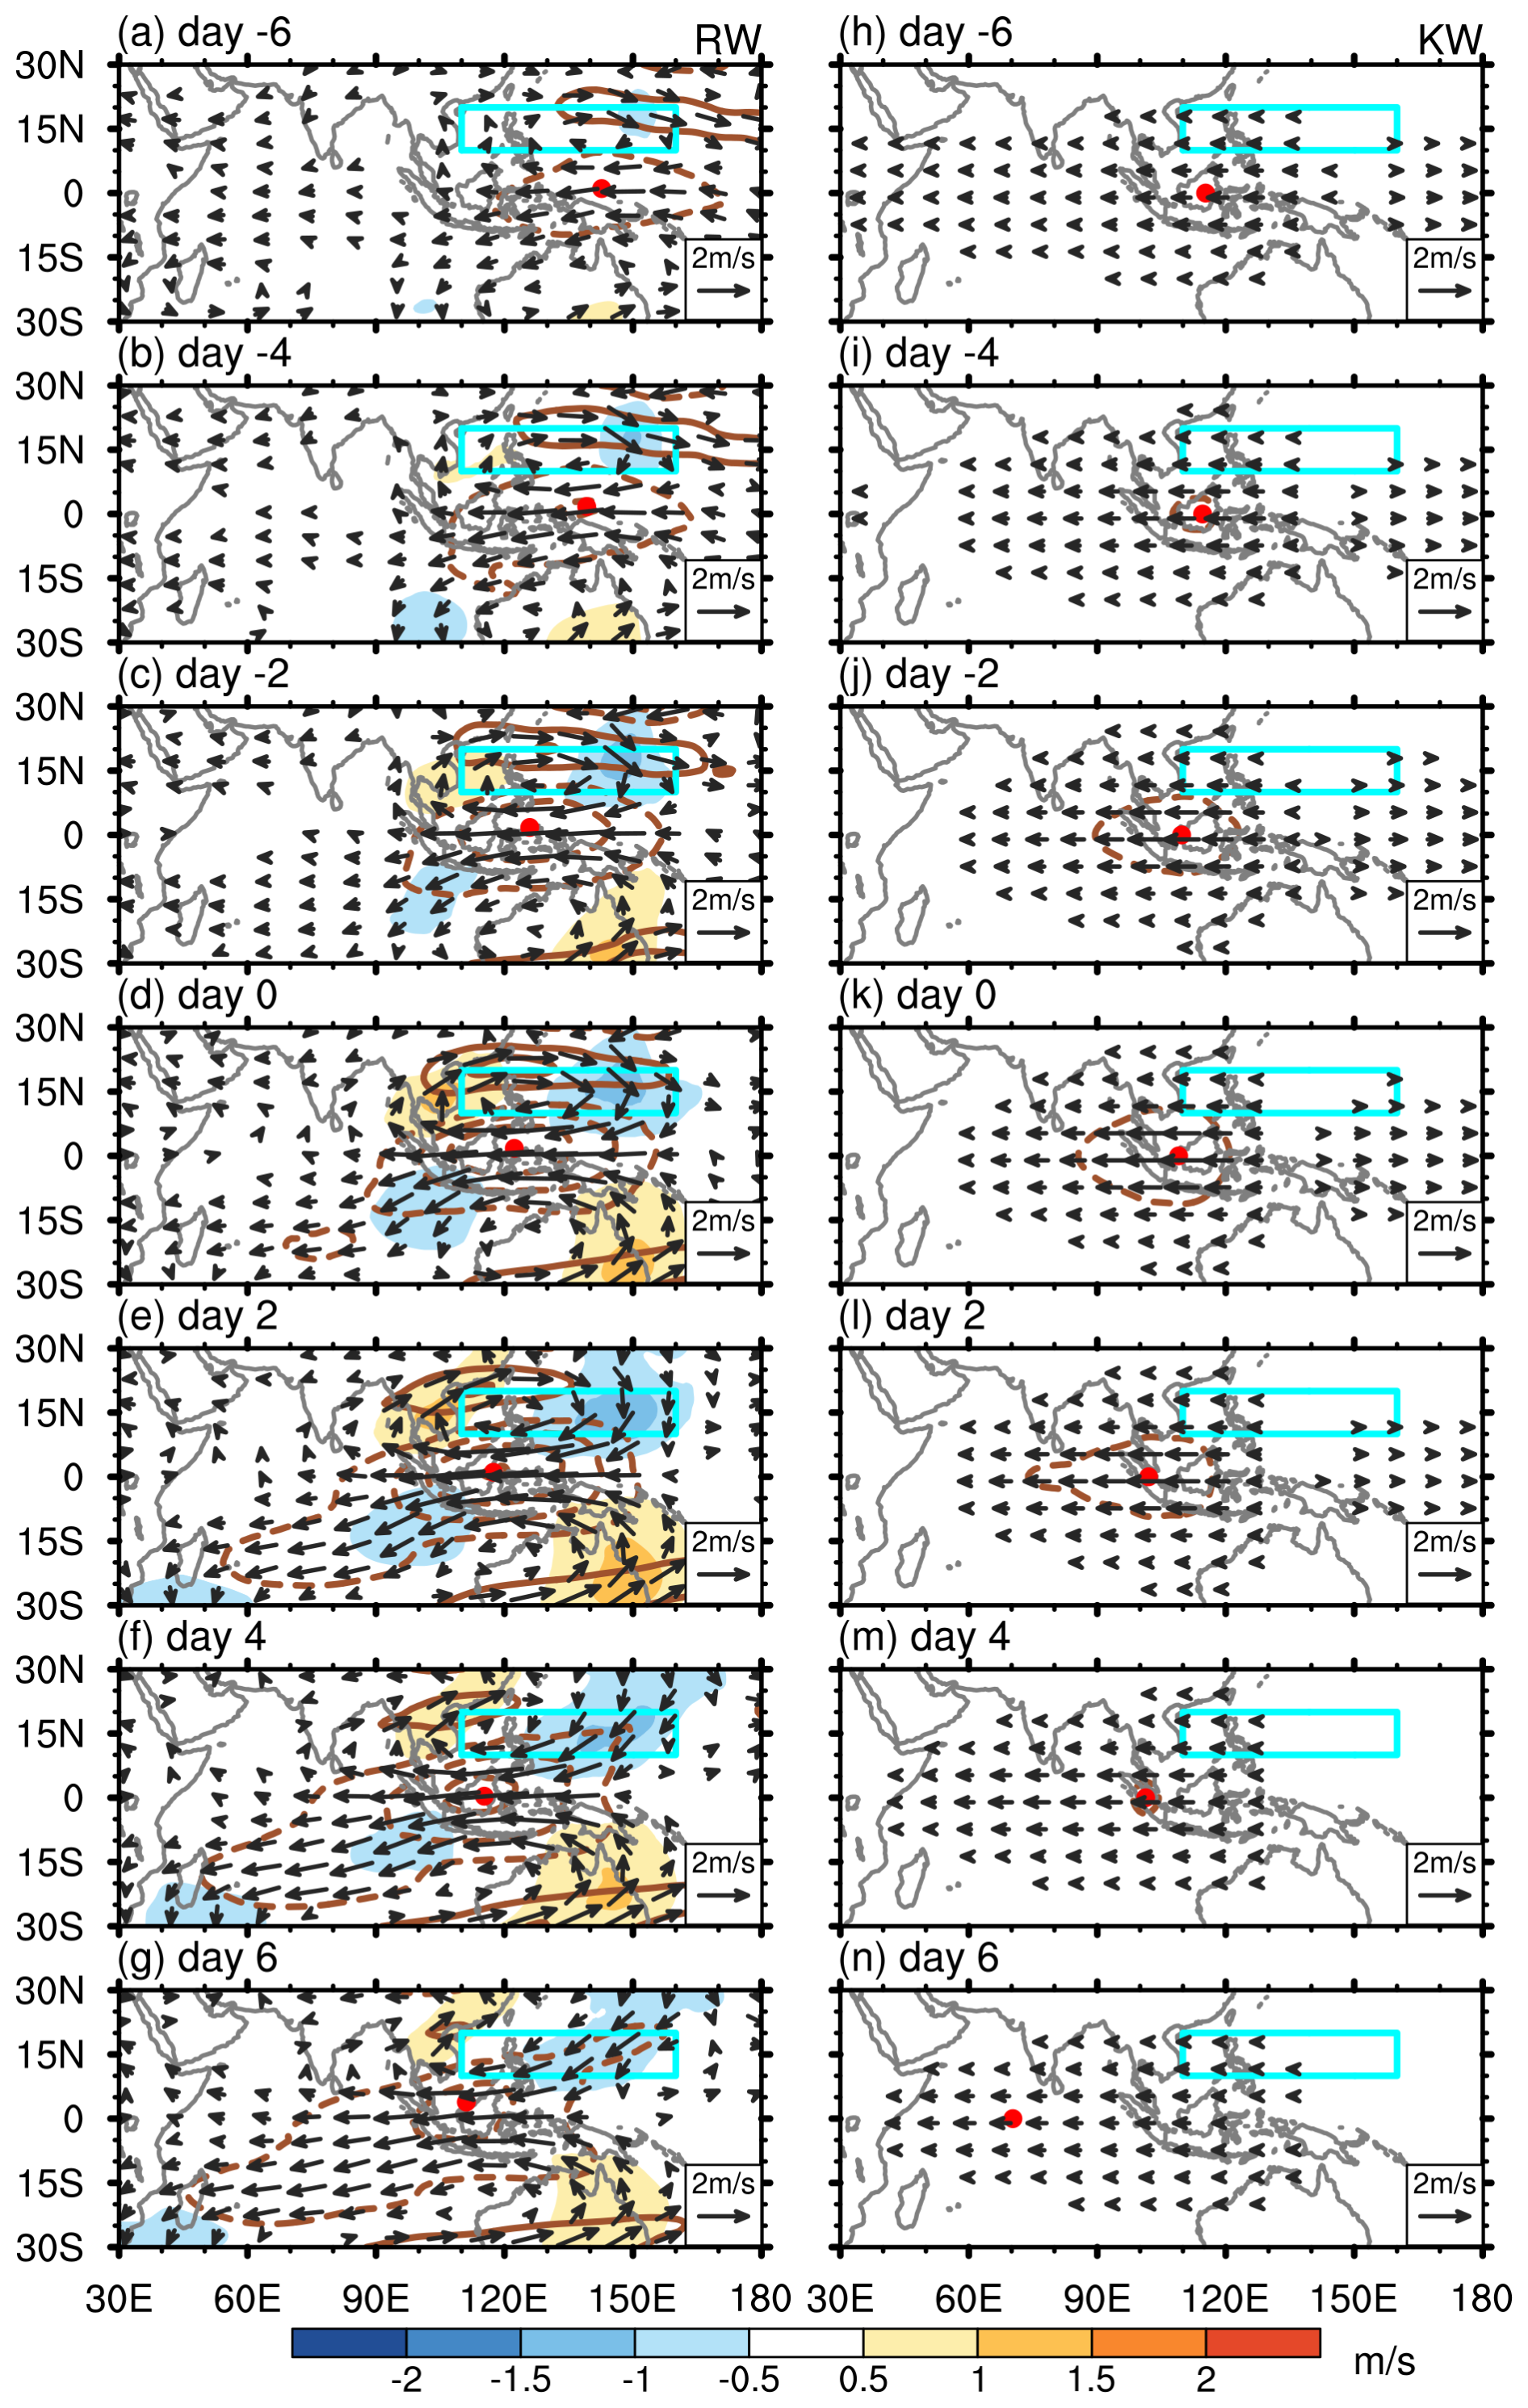
Figure 8As in Fig. 7a–g, but (a–g) the Rossby wave part and (h–n) the Kelvin wave part of the horizontal wind anomalies. The red dots denote the maximum zonal wind anomalies over the 10° S–10° N and 40–160° E. To show the weak meridional wind anomalies, the color bars in Figs. 8 and 9 are different from that in Fig. 7. Other details as in Fig. 4.
The n=1 Rossby-wave-resembling anomaly slowly moves westward from the Maritime Continent towards Africa (Fig. 8a–g). The centre of easterly wind anomaly at the equator moves from about 140° E at day −6 to 110° E at day 6, which gives a westward phase speed of about 3.2 m s−1. The OLR anomaly in Fig. 7 moves westward with a similar speed, but shifted about 10° to the east, in agreement with the Rossby-wave circulation response to subtropical heating in earlier studies by Chatterjee and Goswami (2004) and Liu et al. (2015).
The Kelvin wave variability associated with the lifespan of SWNP convection is much weaker than that of the Rossby waves. At day 6, the Kelvin wave signal closely resembles that at day −6, except for the disappearance of westerlies east of 150° E at day 6 (Fig. 8h–n). Overall, this picture suggests that the Kelvin wave response to enhanced convective activity over the SWNP region does not substantially modify the pre-existing, stationary Kelvin wave easterlies over the eastern hemisphere, which are typical for the boreal summer conditions (Žagar et al., 2022). The relative role of dynamical and diabatic forcing for this stationary Kelvin wave is a subject of ongoing research (Holube et al., 2025). A relatively localized enhancement of equatorial easterlies along with the SWNP convection from day −6 to day 0, is accompanied by a slight westward displacement. This minor westward shift of the Kelvin wave anomaly is consistent with advection by the background easterlies (Fig. 1).
3.2.3 IG and MRG waves
Figure 9 shows the evolution of IG wave part and MRG wave part of horizontal wind anomalies at 150 hPa associated with the SWNP convection variability. The IG wave circulation is a part of upper-tropospheric outflow over the SWNP region, which is strengthening from day −6 until day 0 (Fig. 9a–d). It consists of the northerly flow across the equatorial Maritime Continent and southerly flow in the subtropics north of 15° N. As the SWNP convection weakens following day 0, the southerly winds from the east of Australia expand towards the equator and produce the upper-level convergence over the Maritime Continent (Fig. 9e–g). Another part of the IG signal is found in the southern Indian Ocean and moves westward quickly, which tends to be decoupled with the outflow over the SWNP region (Fig. 9e–g). It is associated with the northerly component of the total cross-equatorial circulation in Fig. 7, which in the Rossby wave part in Fig. 8 is more zonal. This is the cross-equatorial flow missing in the Gill part of the circulation response to asymmetric heating. In the subtropics, the linear IG part of anticyclonic circulation is associated with the ageostrophic component of quasi-geostrophic dynamics (e.g. Žagar et al., 2023).
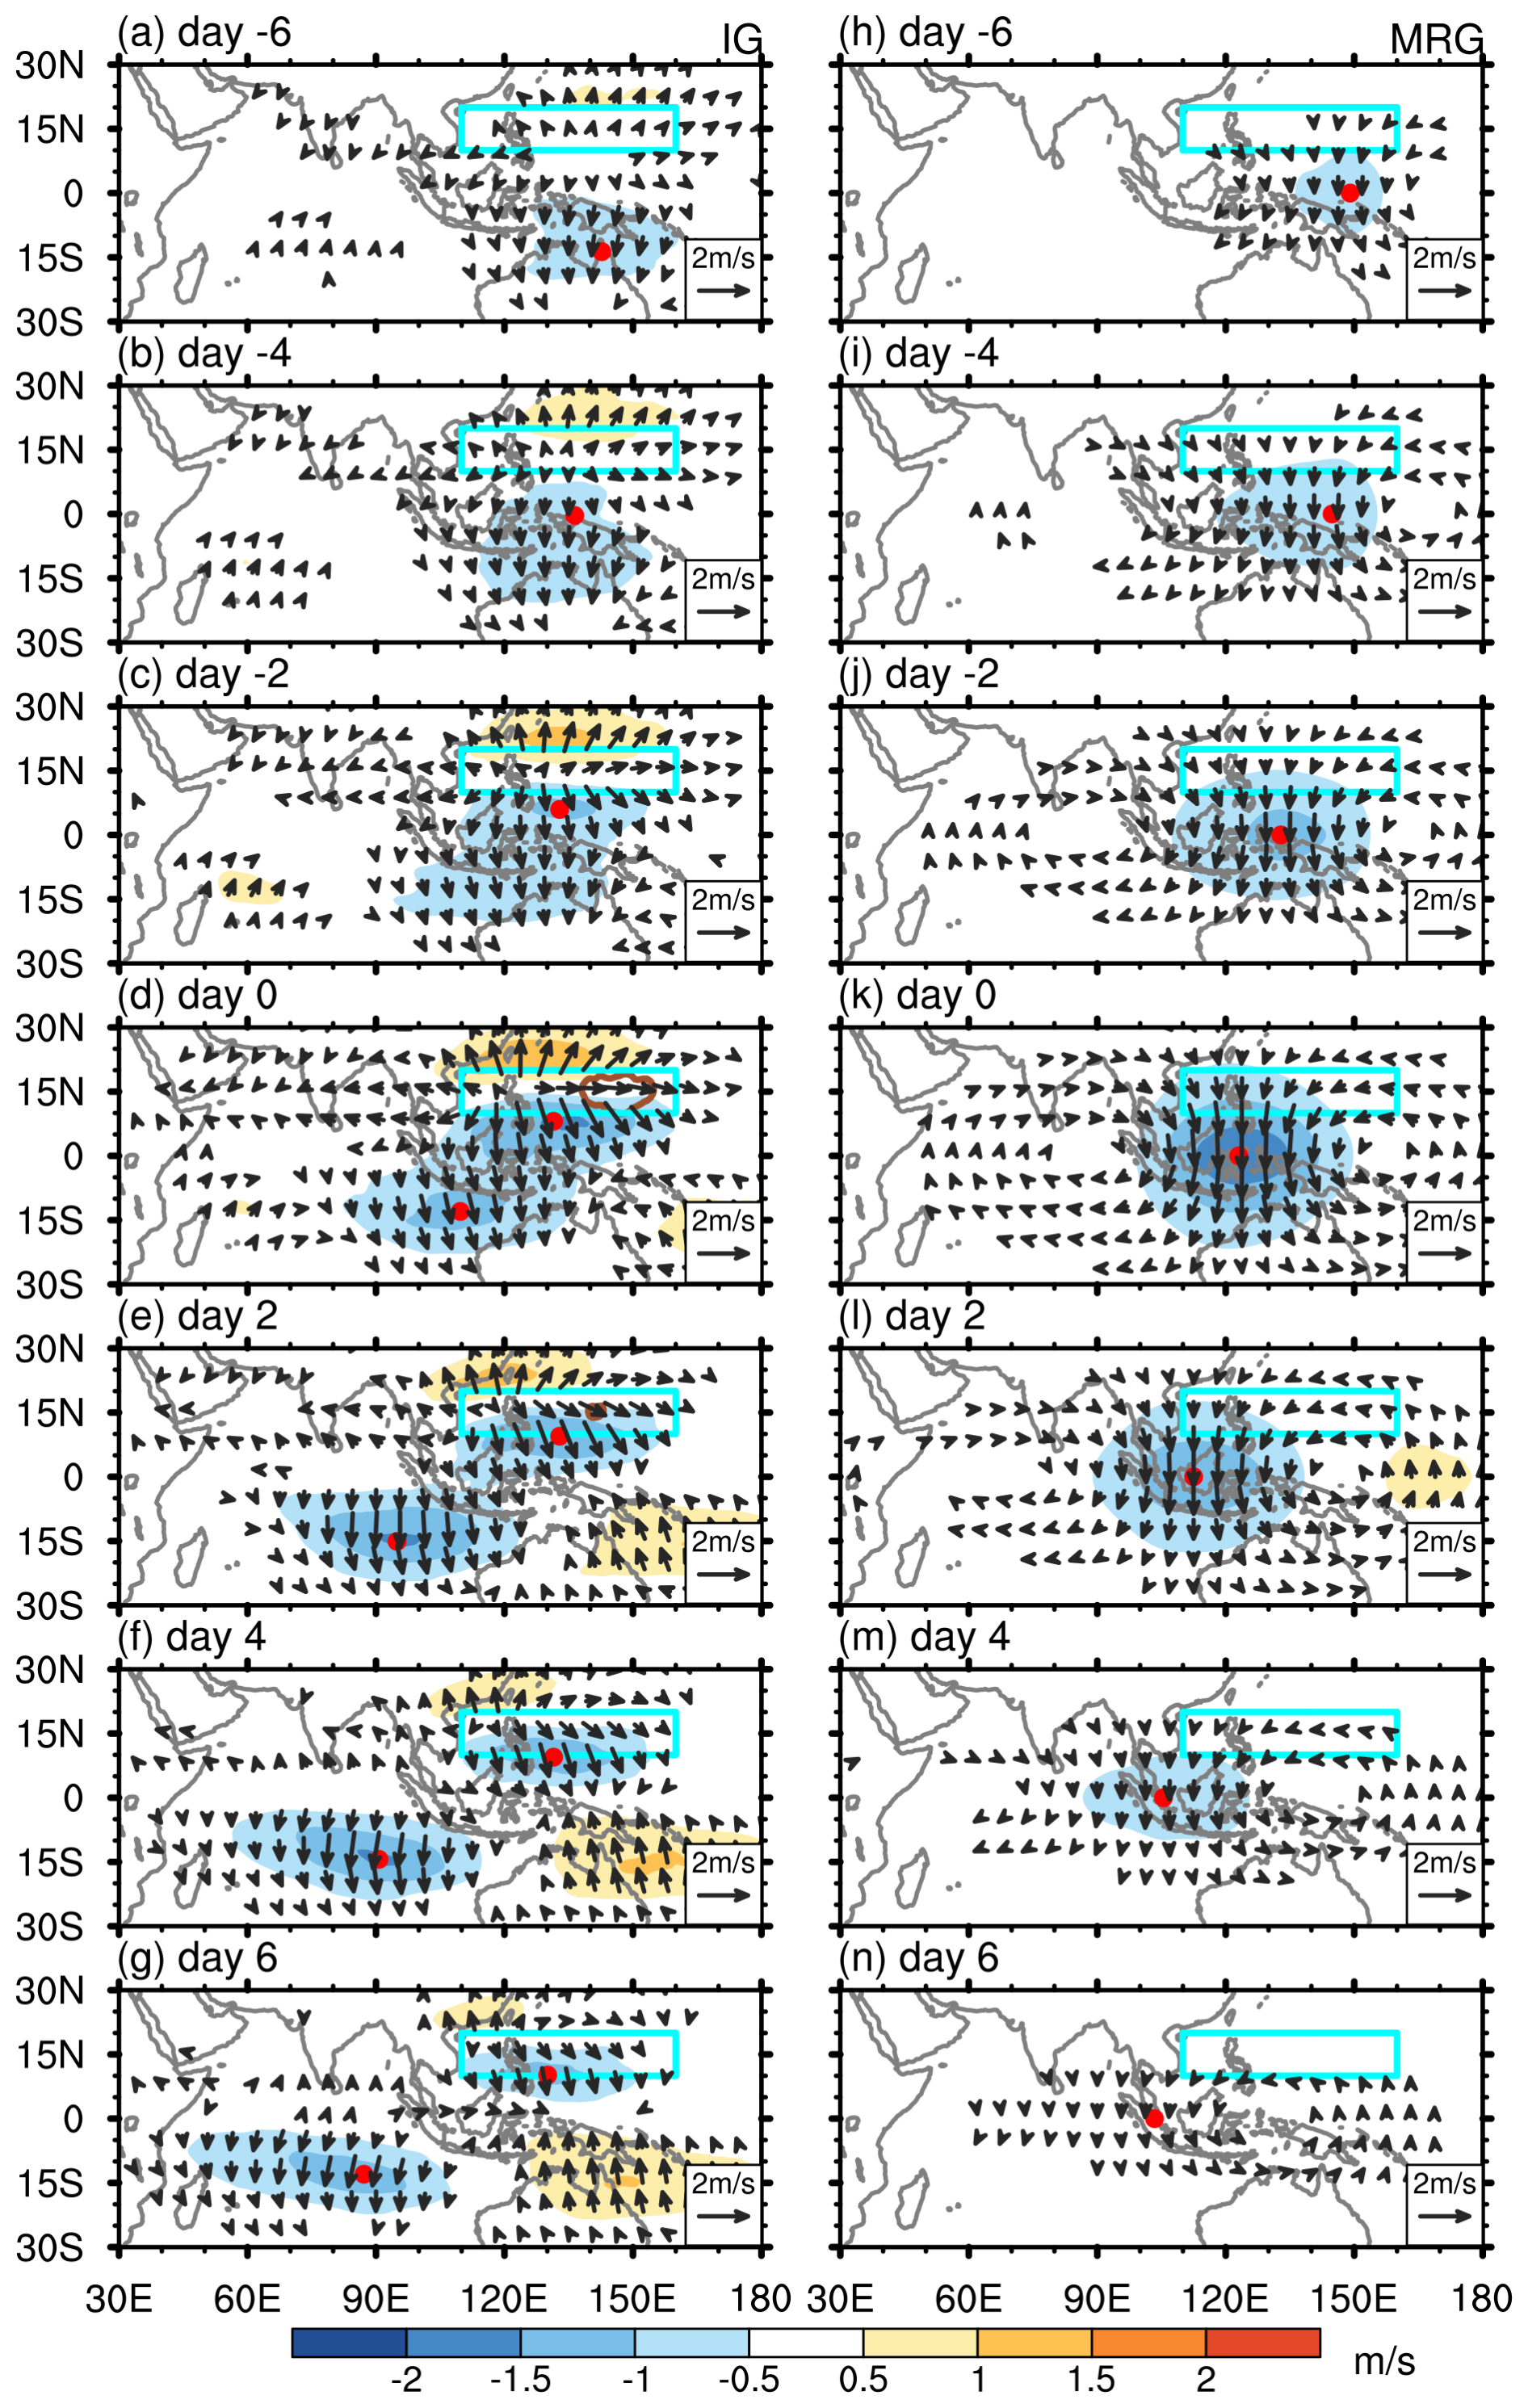
Figure 9As in Fig. 8, but for (a–g) IG waves and (h–n) MRG waves. The red dots denote locations of maximal meridional wind anomalies.
The upper-tropospheric MRG wave northerly winds across the equator also intensify along with the SWNP convection and are strongest at day 0 (Fig. 9h–k). The cross-equatorial flow of the MRG waves, combined with the IG waves, links with the northerly anomalies on the westward flank of the Rossby wave anticyclone over the Australia (Fig. 8a–d). This acts as an upper-level outflow extending from the SWNP region to the south-eastern Indian Ocean (Fig. 7a–d). For positive time lags, the MRG waves account for a large part of the cross-equatorial northerly winds across the Maritime Continent (Fig. 9l–n), while the contribution of IG waves is almost absent (Fig. 9e–g). The linkage between the MRG wave cross-equatorial flow over the Maritime Continent and the Rossby wave anticyclone in the subtropical SH gradually weakens (Fig. 8e–g), while the IG flow in the southern Indian Ocean moves westward, coupling with the westward-extending Rossby waves (Fig. 9e–g). As expected by linear theory, the MRG wave signal maximizes at the equator while propagating westward from about 149° E at day −6 to 102° E at day 6 (Fig. 9h–n). This speed (about 5 m s−1) is significantly faster than that of n=1 Rossby wave and might be associated with different shift due to the background easterlies and westward-moving convection.
The evolution of IG and MRG wave circulations at 925 hPa is shown in the Supplement (Fig. S4) and is similar to that at 150 hPa. Specifically, the IG wave inflow over the SWNP region varies with the intensity of SWNP convection, while the MRG waves constitute the dominant component of the westward-propagating, cross-equatorial southerly flow over the Maritime Continent. This flow has been identified as important for water vapor transport and for modulating precipitation over the SWNP region during boreal summer (Kubota et al., 2011; Li et al., 2018). In addition, the convergence of IG flow at 925 hPa intensifies more rapidly than the convection at day −2, which may indicate a positive feedback to the enhanced SWNP convection at later day 0 (Fig. S5). Consequently, both the upper-level divergence and lower-level convergence reach their maximum amplitude at day 0, coinciding with the peak in convective activity.
The above results suggest distinct dynamics between the IG waves and MRG waves. The IG waves couple with the enhanced SWNP convection through the upper-level outflow and lower-level inflow there. The upper-level outflow contributes to the cross-equatorial northerly flow over the Maritime Continent before day 0; afterward, however, the subtropical northerly flow in the SH becomes increasingly decoupled from the SWNP outflow, leading to a weaker cross-equatorial flow over the Maritime Continent. Moreover, the IG flow in the SH complements the Rossby wave-induced anticyclonic gyre over the southern Indian Ocean. In contrast, the MRG waves are excited by the asymmetric heating source and move westward along with the convection during its ≈ 10 d lifecycle.
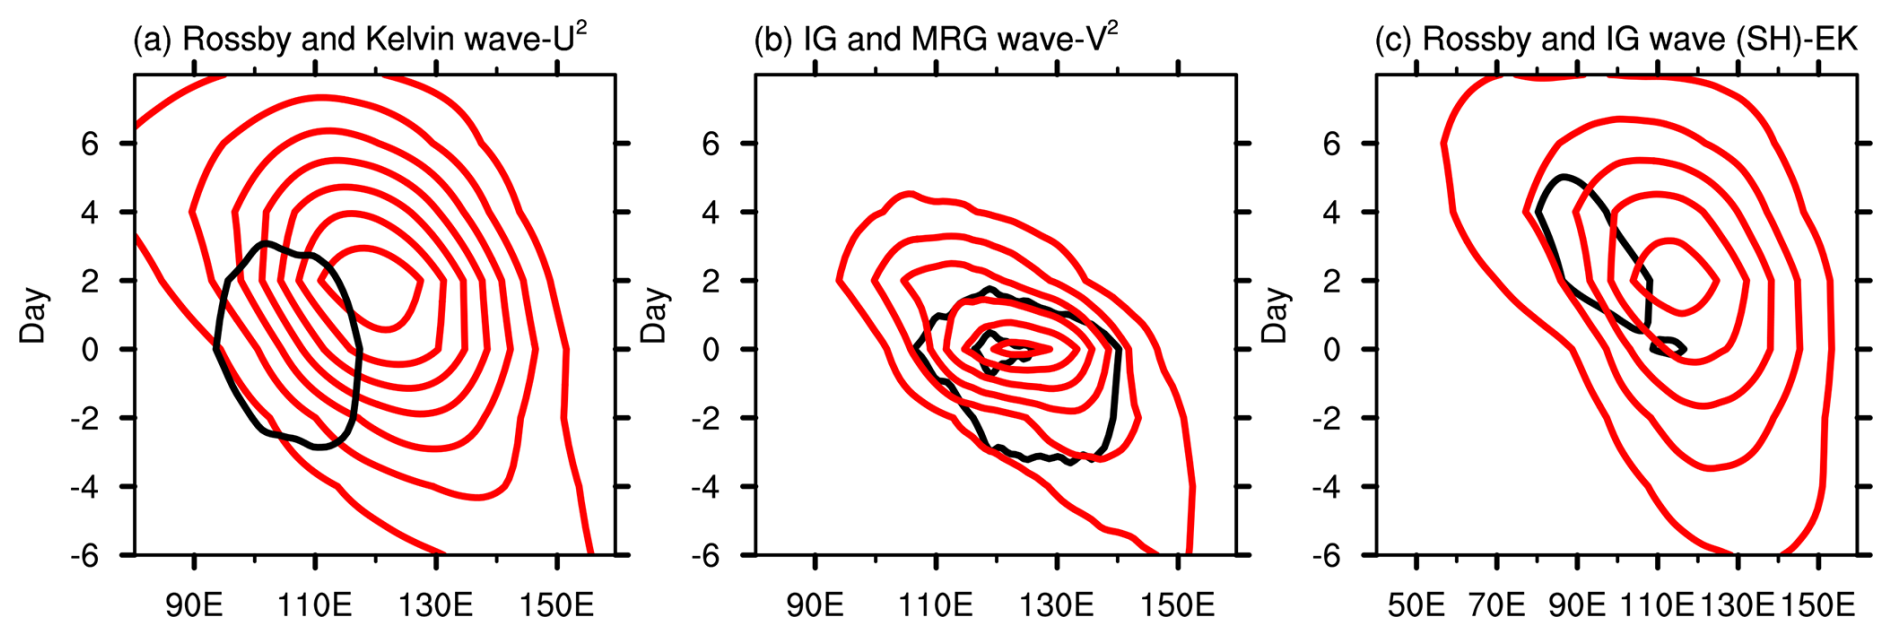
Figure 10Time-longitude cross sections of different modes at 150 hPa. (a) U2 of Rossby (red lines) and Kelvin (black lines) waves averaged over 15° S–15° N, (b) V2 of IG (black lines) and MRG (red lines) waves over 0°, (c) Kinetic energy of Rossby (red lines) and IG (black lines) waves averaged over 20–0° S, respectively. The contouring interval is 1 m2 s−2 for panel (a) and is 0.5 m2 s−2 for panels (b) and (c).
These results are summarized in Fig. 10 comparing time-longitude diagrams of the Rossby and Kelvin wave, IG and MRG wave, and the SH Rossby and IG wave energies. It shows that the Rossby waves exhibit a westward shift and play a dominant role in the equatorial zonal wind anomalies compared with Kelvin waves (Fig. 10a). On the other hand, Fig. 10b highlights the leading contribution of MRG waves to the westward-propagating cross-equatorial flow over the tropical Maritime Continent. Furthermore, both IG waves and Rossby waves over the southern Indian Ocean after day 0 are shown in Fig. 10c.
Utilizing wave decomposition of ERA5 reanalyses and wave regression with an OLR-based convection index, we investigated the roles of different equatorial waves in the evolution of atmospheric circulation anomalies associated with the convection over the subtropical western North Pacific (SWNP) region in boreal summer (JJA). In detail, and in response to our initial questions, we found:
-
During its approximately 10 d lifecycle, convective activity over the SWNP region intensifies from about day −6 to day 0, then gradually weakens until about day 6, featuring a westward shift. The intensification of SWNP convection is associated with a Rossby wave signal resembling an n=1 mode, with two developing anticyclonic gyres over the SWNP region and Australia, coupled with and strengthening upper-tropospheric easterlies at the equator. During the decaying phase of SWNP convection, the anticyclone gyre in the Southern Hemisphere (SH) continues to extend westward. While the Kelvin wave variability is weaker compared to the Rossby waves, it nonetheless enhances the equatorial easterly flow as a relatively localized response during the evolution of SWNP convection. The inertia-gravity (IG) waves couple with enhanced convection through intensified outflow to the SH in the upper troposphere until day 0, and this outflow induces cross-equatorial northerly flow over the Maritime Continent. After day 0, the IG northerly flow in the SH shifts westward, forming anticyclonic circulation over the southern Indian Ocean together with the Rossby wave gyre. Finally, the mixed Rossby–gravity (MRG) waves drive cross-equatorial meridional flow over the Maritime Continent during the period, propagating westward with a speed exceeding that of the associated SWNP convection.
-
The superposition of Kelvin and Rossby waves enhances the equatorward side of the anticyclonic/cyclonic circulation over the SWNP region during periods of stronger convection, with Rossby wave zonal winds being about three times stronger than those associated with Kelvin waves. Qualitatively, their zonal circulation resembles the Gill solution. On the other hand, the MRG and IG waves dominate the cross-equatorial northerly flow in the upper troposphere, with their amplitudes comparable to those of Rossby and Kelvin wave zonal circulations. Notably, MRG waves contribute more significantly to the extent and the westward propagation of the cross-equatorial northerly flow over the Maritime Continent compared to IG waves.
Our results serve as a cautionary note against relying solely on the Gill solution to interpret circulation associated with asymmetric heating in observations, reanalyses and models. Future analyses should consider the roles of MRG and IG cross-meridional flows, which are not included in the original Gill framework. Although our study focused on the SWNP region, we anticipate similar dynamics associated with subtropical convection in other regions.
One aspect of our results – extratropical circulation patterns associated with the SWNP convection – remains for further investigation. The results highlight the roles of IG and MRG flows in shaping the anticyclonic circulation in the SH subtropics, particularly the IG flow following peak convection. This complements earlier studies that identified coupling between the SWNP JJA convection, the Rossby wave train in the SH and its influence on the SH rainfall (Lin, 2009; Zhao et al., 2019; Sun and Tan, 2022). Wave-space regression offers a novel approach to further investigate this coupling and the role of SWNP convection in austral winter variability. Furthermore, while our study investigates the individual behavior of the different wave types, the normal-mode framework also allows for the more detailed analysis of the wave-wave and wave-mean flow interactions (e.g., Teruya et al., 2024). In this respect, the methodology applied by Holube et al. (2025) to Kelvin waves offers a starting point for further investigations on wave dynamics related to SWNP convection.
The ERA5 reanalysis data are openly available from https://cds.climate.copernicus.eu/datasets (last access: 24 October 2023). The interpolated OLR data are provided by the NOAA/OAR/ESRLPSL, Boulder, Colorado, USA (https://psl.noaa.gov/data/gridded/data.olrcdr.interp.html, last access: 11 September 2023). All data used in this work can be obtained from Peishan Chen through e-mail. The MODES software can be requested through https://modes.cen.uni-hamburg.de/software (last access: 24 October 2023).
The supplement related to this article is available online at https://doi.org/10.5194/wcd-6-1629-2025-supplement.
P.C.: conceptualization, formal analysis, funding acquisition, investigation, validation, project administration, visualization, writing – original draft, writing – review and editing; K.H.: formal analysis, writing – review and editing; F.L.: conceptualization, writing – review and editing; N.Ž.: conceptualization, formal analysis, funding acquisition, investigation, methodology, project administration, resources, software, supervision, visualization, writing – original draft, writing – review and editing; Y.Z.: data curation; R.L.: conceptualization, supervision, writing – review and editing.
The contact author has declared that none of the authors has any competing interests.
Publisher's note: Copernicus Publications remains neutral with regard to jurisdictional claims made in the text, published maps, institutional affiliations, or any other geographical representation in this paper. While Copernicus Publications makes every effort to include appropriate place names, the final responsibility lies with the authors. Views expressed in the text are those of the authors and do not necessarily reflect the views of the publisher.
Peishan Chen gratefully acknowledges the financial support granted by the China Scholarship Council (CSC). Nedjeljka Žagar, Katharina M. Holube and Yuan-Bing Zhao acknowledge the Deutsche Forschungsgemeinschaft (German Research Foundation). We are grateful to Dr. Breno Raphaldini and an anonymous reviewer for their constructive comments, and to Editor, Dr. Martin Singh for overseeing the review process.
This research has been supported by the China Scholarship Council (grant no. 202304910529) and the Deutsche Forschungsgemeinschaft (grant nos. 461186383 and 274762653).
This paper was edited by Martin Singh and reviewed by Breno Raphaldini and one anonymous referee.
Bellon, G. and Reboredo, B.: Scale Sensitivity of the Gill Circulation. Part II: Off-Equatorial Case, J. Atmos. Sci., 79, 19–30, https://doi.org/10.1175/JAS-D-21-0068.1, 2022. a
Boyd, J. P.: Dynamics of the Equatorial Ocean, Springer-Verlag GmbH Germany, https://doi.org/10.1007/978-3-662-55476-0, 2018. a, b
Chatterjee, P. and Goswami, B. N.: Structure, genesis and scale selection of the tropical quasi-biweekly mode, Q. J. Roy. Meteor. Soc., 130, 1171–1194, https://doi.org/10.1256/qj.03.133, 2004. a, b, c, d
Chen, G. and Sui, C.-H.: Characteristics and origin of quasi-biweekly oscillation over the western North Pacific during boreal summer, J. Geophys. Res.-Atmos., 115, https://doi.org/10.1029/2009JD013389, 2010. a, b
Chen, P. and Lu, R.: The Summer Atmospheric Convection Variability over the Tropical Western North Pacific Independent of and Dependent on the Preceding Winter ENSO, J. Climate, 36, 8695–8711, https://doi.org/10.1175/JCLI-D-23-0037.1, 2023. a, b, c
Di Capua, G., Runge, J., Donner, R. V., van den Hurk, B., Turner, A. G., Vellore, R., Krishnan, R., and Coumou, D.: Dominant patterns of interaction between the tropics and mid-latitudes in boreal summer: causal relationships and the role of timescales, Weather Clim. Dynam., 1, 519–539, https://doi.org/10.5194/wcd-1-519-2020, 2020. a
Feng, T., Yang, X.-Q., Yu, J.-Y., and Huang, R.: Convective Coupling in Tropical-Depression-Type Waves. Part I: Rainfall Characteristics and Moisture Structure, J. Atmos. Sci., 77, 3407–3422, https://doi.org/10.1175/JAS-D-19-0172.1, 2020a. a
Feng, T., Yu, J.-Y., Yang, X.-Q., and Huang, R.: Convective Coupling in Tropical-Depression-Type Waves. Part II: Moisture and Moist Static Energy Budgets, J. Atmos. Sci., 77, 3423–3440, https://doi.org/10.1175/JAS-D-19-0173.1, 2020b. a
Ferrett, S., Yang, G.-Y., Woolnough, S. J., Methven, J., Hodges, K., and Holloway, C. E.: Linking extreme precipitation in Southeast Asia to equatorial waves, Q. J. Roy. Meteor. Soc., 146, 665–684, https://doi.org/10.1002/qj.3699, 2019. a
Ferrett, S., Methven, J., Woolnough, S. J., Yang, G.-Y., Holloway, C. E., and Wolf, G.: Hybrid Dynamical–Statistical Forecasts of the Risk of Rainfall in Southeast Asia Dependent on Equatorial Waves, Mon. Weather Rev., 151, 2139–2152, https://doi.org/10.1175/MWR-D-22-0300.1, 2023. a
Gill, A. E.: Some simple solutions for heat-induced tropical circulation, Q. J. Roy. Meteor. Soc., 106, 447–462, https://doi.org/10.1002/qj.49710644905, 1980. a, b, c, d, e
Goyal, R., Jucker, M., Sen, G., Gupta, A. S., Hendon, H. H., and England, M. H.: Zonal wave 3 pattern in the Southern Hemisphere generated by tropical convection, Nat. Geosci., 14, 732–738, https://doi.org/10.1038/s41561-021-00811-3, 2021. a
Hersbach, H., Bell, B., Berrisford, P., Hirahara, S., Horányi, A., Muñoz-Sabater, J., Nicolas, J., Peubey, C., Radu, R., Schepers, D., Simmons, A., Soci, C., Abdalla, S., Abellan, X., Balsamo, G., Bechtold, P., Biavati, G., Bidlot, J., Bonavita, M., De Chiara, G., Dahlgren, P., Dee, D., Diamantakis, M., Dragani, R., Flemming, J., Forbes, R., Fuentes, M., Geer, A., Haimberger, L., Healy, S., Hogan, R. J., Hólm, E., Janisková, M., Keeley, S., Laloyaux, P., Lopez, P., Lupu, C., Radnoti, G., de Rosnay, P., Rozum, I., Vamborg. F., Villaume, S., and Thépaut, J.-N.: The ERA5 global reanalysis, Q. J. Roy. Meteor. Soc., 146, 1999–2049 [data set], https://doi.org/10.1002/qj.3803, 2020. a, b
Holube, K. M., Lunkeit, F., Vasylkevych, S., and Žagar, N.: Energy budget of the equatorial Kelvin wave: Comparing dynamical and diabatic sources, ESS Open Archive, https://doi.org/10.22541/essoar.174776017.78570412/v1, 2025. a, b
Huang, R. and Sun, F.: Impacts of the Tropical Western Pacific on the East Asian Summer Monsoon, J. Meteorol. Soc. Jpn. Ser. II, 70, 243–256, https://doi.org/10.2151/jmsj1965.70.1B_243, 1992. a, b, c, d
Jia, X. and Yang, S.: Impact of the quasi-biweekly oscillation over the western North Pacific on East Asian subtropical monsoon during early summer, J. Geophy. Res.-Atmos., 118, 4421–4434, https://doi.org/10.1002/jgrd.50422, 2013. a
Kikuchi, K. and Wang, B.: Global Perspective of the Quasi-Biweekly Oscillation, J. Clim., 22, 1340–1359, https://doi.org/10.1175/2008JCLI2368.1, 2009. a
Kobayashi, C., Maeda, S., Ito, A., Matsushita, Y., and Takano, K.: Relation between SSTs and Predictability of Seasonal Mean Precipitation over the Western Tropical Pacific, J. Meteorol. Soc. Jpn. Ser. II, 83, 919–929, https://doi.org/10.2151/jmsj.83.919, 2005. a
Kosaka, Y. and Nakamura, H.: Structure and dynamics of the summertime Pacific–Japan teleconnection pattern, Q. J. Roy. Meteor. Soc., 132, 2009–2030, https://doi.org/10.1256/qj.05.204, 2006. a, b, c
Kosaka, Y. and Nakamura, H.: Mechanisms of Meridional Teleconnection Observed between a Summer Monsoon System and a Subtropical Anticyclone. Part I: The Pacific–Japan Pattern, J. Climate, 23, 5085–5108, https://doi.org/10.1175/2010JCLI3413.1, 2010. a
Kubota, H., Shirooka, R., Hamada, J.-I., and Syamsudin, F.: Interannual Rainfall Variability over the Eastern Maritime Continent, J. Meteorol. Soc. Jpn., 89A, 111–122, https://doi.org/10.2151/jmsj.2011-A07, 2011. a
Lau, K.-M., Kim, K.-M., and Yang, S.: Dynamical and Boundary Forcing Characteristics of Regional Components of the Asian Summer Monsoon, J. Climate, 13, 2461–2482, https://doi.org/10.1175/1520-0442(2000)013<2461:DABFCO>2.0.CO;2, 2000. a
Li, C. and Li, S.: Interannual Seesaw between the Somali and the Australian Cross-Equatorial Flows and its Connection to the East Asian Summer Monsoon, J. Climate, 27, 3966–3981, https://doi.org/10.1175/JCLI-D-13-00288.1, 2014. a
Li, K., He, Q., Yang, Y., and Yu, W.: Equatorial Moisture Dynamics of the Quasi‐Biweekly Oscillation in the Tropical Northwestern Pacific during Boreal Summer, Geophys. Res. Lett., 47, e2020GL090929, https://doi.org/10.1029/2020GL090929, 2020. a
Li, S., Park, S., Lee, J. Y., Ha, K. J., Park, M. K., Jo, C. O., Oh, H., Muhle, J., Kim, K. R., Montzka, S. A., O'Doherty, S., Krummel, P. B., Atlas, E., Miller, B. R., Moore, F., Weiss, R. F., and Wofsy, S. C.: Chemical evidence of inter-hemispheric air mass intrusion into the Northern Hemisphere mid-latitudes, Sci. Rep., 8, 4669, https://doi.org/10.1038/s41598-018-22266-0, 2018. a
Li, X., Gollan, G., Greatbatch, R. J., and Lu, R.: Impact of the MJO on the interannual variation of the Pacific–Japan mode of the East Asian summer monsoon, Clim. Dynam., 52, 3489–3501, https://doi.org/10.1007/s00382-018-4328-7, 2019. a
Liebmann, B. and Smith, C. A.: Description of a complete (interpolated) outgoing longwave radiation dataset, B. Am. Meteorol. Soc., 77, 1274–1278 [data set], https://doi.org/10.1175/1520-0477-77.6.1274, 1996. a
Lin, H.: Global Extratropical Response to Diabatic Heating Variability of the Asian Summer Monsoon, J. Atmos. Sci., 66, 2697–2713, https://doi.org/10.1175/2009JAS3008.1, 2009. a, b
Liu, F., Huang, G., and Yan, M.: Role of SST meridional structure in coupling the Kelvin and Rossby waves of the intraseasonal oscillation, Theor. Appl. Climatol., 121, 623–629, https://doi.org/10.1007/s00704-014-1266-0, 2015. a
Longuet-Higgins, M. S.: Eigenfunctions of Laplaces tidal equations over a sphere, Philos. T. Roy. Soc. A, 262, 511–607, https://doi.org/10.1098/rsta.1968.0003, 1968. a
Lu, R. and Dong, B.: Westward Extension of North Pacific Subtropical High in Summer, J. Meteorol. Soc. Jpn. Ser. II, 79, 1229–1241, https://doi.org/10.2151/jmsj.79.1229, 2001. a, b, c, d
Matsuno, T.: Quasi-geostrophic motions in the equatorial area, J. Meteorol. Soc. Jpn., 44, 25–42, 1966. a, b
Neduhal, V., Žagar, N., Lunkeit, F., Polichtchouk, I., and Zaplotnik, V.: Decomposition of the Horizontal Wind Divergence Associated With the Rossby, Mixed Rossby-Gravity, Inertia-Gravity, and Kelvin Waves on the Sphere, J. Geophy. Res.-Atmos., 129, e2023JD040427, https://doi.org/10.1029/2023JD040427, 2024. a
Nitta, T.: Long-term variations of cloud amount in the western Pacific region, J. Meteorol. Soc. Jpn., 64, 373–390, https://doi.org/10.2151/jmsj1965.64.3_373, 1986. a
Nitta, T.: Convective Activities in the Tropical Western Pacific and Their Impact on the Northern Hemisphere Summer Circulation, J. Meteorol. Soc. Jpn. Ser. II, 65, 373–390, https://doi.org/10.2151/jmsj1965.65.3_373, 1987. a, b, c, d, e, f
Pedlosky, J.: A study of the time dependent ocean circulation, J. Atmos. Sci., 22, 267–272, 1965. a
Quinting, J. F., Grams, C. M., Chang, E. K.-M., Pfahl, S., and Wernli, H.: Warm conveyor belt activity over the Pacific: modulation by the Madden–Julian Oscillation and impact on tropical–extratropical teleconnections, Weather Clim. Dynam., 5, 65–85, https://doi.org/10.5194/wcd-5-65-2024, 2024. a
Reboredo, B. and Bellon, G.: Scale Sensitivity of the Gill Circulation. Part I: Equatorial Case, J. Atmos. Sci., 79, 3–17, https://doi.org/10.1175/JAS-D-21-0067.1, 2022. a
Schubert, W. H., Silvers, L. G., Masarik, M. T., and Gonzalez, A. O.: A Filtered Model of Tropical Wave Motions, J. Adv. Model. Earth Sy., 1, 3, https://doi.org/10.3894/JAMES.2009.1.3, 2009. a
Straub, K. H. and Kiladis, G. N.: Interactions between the Boreal Summer Intraseasonal Oscillation and Higher-Frequency Tropical Wave Activity, Mon. Weather Rev., 131, 945–960, https://doi.org/10.1175/1520-0493(2003)131<0945:IBTBSI>2.0.CO;2, 2003. a
Sun, Y. and Tan, B.: A new subseasonal atmospheric teleconnection bridging tropical deep convection over the western North Pacific and Antarctic weather, Atmos. Sci. Lett., 23, e1115, https://doi.org/10.1002/asl.1115, 2022. a, b, c
Sun, Y., Chen, G., and Tan, B.: Formation and maintenance mechanisms of the Pacific-Japan pattern as an intraseasonal variability mode, Clim. Dynam., 57, 2971–2994, https://doi.org/10.1007/s00382-021-05851-4, 2021. a, b, c, d
Swarztrauber, P. N. and Kasahara, A.: The vector harmonic analysis of Laplace tidal equations, SIAM J. Sci. Stat. Comp., 6, 464–491, https://doi.org/10.1137/0906033, 1985. a, b
Teruya, A. S. W., Raphaldini, B., Raupp, C. F. M., Peixoto, P. S., Mayta, V. C., and Silva-Dias, P. L.: Data-driven modeling of equatorial atmospheric waves: The role of moisture and nonlinearity on global-scale instabilities and propagation speeds, Chaos, 34, https://doi.org/10.1063/5.0201716, 2024. a
Wang, B., Wu, R., and Lau, K.-M.: Interannual Variability of the Asian Summer Monsoon: Contrasts between the Indian and the Western North Pacific–East Asian Monsoons, J. Climate, 14, 4073–4090, https://doi.org/10.1175/1520-0442(2001)014<4073:IVOTAS>2.0.CO;2, 2001. a, b, c
Wang, J., Wen, Z., Wu, R., Guo, Y., and Chen, Z.: The mechanism of growth of the low-frequency East Asia–Pacific teleconnection and the triggering role of tropical intraseasonal oscillation, Clim. Dynam., 46, 3965–3977, https://doi.org/10.1007/s00382-015-2815-7, 2016. a, b
Wu, Z., Battisti, D. S., and Sarachik, E. S.: Rayleigh Friction, Newtonian Cooling, and the Linear Response to Steady Tropical Heating, J. Atmos. Sci., 57, 1937–1957, https://doi.org/10.1175/1520-0469(2000)057<1937:RFNCAT>2.0.CO;2, 2000. a
Xue, F. and Fan, F.: Role of Local Air-Sea Interaction in a Significant Correlation of Convective Activity in the Western Pacific Warm Pool between June and August, J. Meteorol. Soc. Jpn. Ser. II, 97, 995–1008, https://doi.org/10.2151/jmsj.2019-054, 2019. a
Žagar, N. and Franzke, C. L. E.: Systematic decomposition of MJO into balanced and inertio-gravity modes, Geophys. Res. Lett., 42, 6829–6835, 2015. a
Žagar, N. and Tribbia, J., E.: Modal View Of Atmospheric Variability: Applications Of Normal-Mode Function Decomposition in Weather and Climate Research, Springer Nature, https://doi.org/10.1007/978-3-030-60963-4, 2020. a
Žagar, N., Tribbia, J., Anderson, J. L., and Raeder, K.: Uncertainties of estimates of inertio-gravity energy in the atmosphere. Part I: intercomparison of four analysis datasets, Mon. Weather Rev., 137, 3837–3857, 2009. a
Žagar, N., Kasahara, A., Terasaki, K., Tribbia, J., and Tanaka, H.: Normal-mode function representation of global 3-D data sets: open-access software for the atmospheric research community, Geosci. Model Dev., 8, 1169–1195, https://doi.org/10.5194/gmd-8-1169-2015, 2015. a
Žagar, N., Lunkeit, F., Sielmann, F., and Xiao, W.: Three-Dimensional Structure of the Equatorial Kelvin Wave: Vertical Structure Functions, Equivalent Depths, and Frequency and Wavenumber Spectra, J. Climate, 35, 2209–2230, https://doi.org/10.1175/JCLI-D-21-0342.1, 2022. a
Žagar, N., Neduhal, V., Vasylkevych, S., Ž. Zaplotnik, and Tanaka, H.: Decomposition of vertical velocity and its zonal wavenumber kinetic energy spectra in the hydrostatic atmosphere, J. Atmos. Sci., 80, 2747–2767, 2023. a
Zhao, S., Li, J., Li, Y., Jin, F.-F., and Zheng, J.: Interhemispheric influence of Indo-Pacific convection oscillation on Southern Hemisphere rainfall through southward propagation of Rossby waves, Clim. Dynam., 52, 3203–3221, https://doi.org/10.1007/s00382-018-4324-y, 2019. a, b
Zhao, X., Lu, R., Dong, B., Hong, X., Liu, J., and Sun, J.: Tropical Anomalies Associated with the Interannual Variability of the Cross-Equatorial Flows over the Maritime Continent in Boreal Summer, J. Climate, 35, 5591–5603, https://doi.org/10.1175/JCLI-D-21-0764.1, 2022. a, b
Zhao, X., Lu, R., and Sun, J.: Events of the Cross-Equatorial Flows over the Maritime Continent during 1979-2020, J. Climate, 36, 3083–3094, https://doi.org/10.1175/JCLI-D-22-0589.1, 2023. a, b, c, d, e
Zhu, Y., Wen, Z., Guo, Y., Chen, R., Li, X., and Qiao, Y.: The characteristics and possible growth mechanisms of the quasi-biweekly Pacific-Japan teleconnection in Boreal Summer, Clim. Dynam., 55, 3363–3380, https://doi.org/10.1007/s00382-020-05448-3, 2020. a, b, c