
the Creative Commons Attribution 4.0 License.
the Creative Commons Attribution 4.0 License.
 | 07 Jul 2026
A regime-based diagnosis of transition probabilities and changes in frequency and intensity of Indian Summer Monsoon rainfall
Bhupendra A. Raut
Aditi Deshpande
Devyani Kamble
Sandip Ingle
Parmeshwar Naik
Shwetal Walde
P. Pradeep Kumar
Purnendranath Sen
We present a diagnostic framework of daily rainfall regimes during the Indian Summer Monsoon (ISM) for June–September 1961–2018. Using high-resolution (0.25°) daily rainfall and unsupervised k-means clustering, eleven objectively defined spatial rainfall patterns were identified and linked with characteristic low-level winds, sea-level pressure and moisture fields, separating different synoptic patterns of ISM rainfall. The dataset provides (i) centroid rainfall patterns of each regime and (ii) daily cluster IDs, enabling reconstruction of the full temporal sequence of rainfall regimes and calculation of transition probabilities between states. Transition analysis confirms that break phases are the most persistent while monsoon depressions are more transient, mirroring observed synoptic life cycles. A decomposition of rainfall change between 1961–1989 and 1990–2018 shows that drying in Northeast India (∼ 9 %) is driven by a reduction in frequency of break clusters associated with localized rainfall over the region (Cluster 2), whereas Gangetic Plain drying (∼ 7 %) is linked to reduction in both rainfall intensity and frequency (Clusters 2 and 8). Over the western India, the increasing rainfall (∼ 15 %) is mainly driven by increasing remnants of depressions and mid-tropospheric cyclones (Cluster 9). This regime-based approach provides a powerful diagnostic tool to examine synoptic drivers, long-term changes in rainfall intensity and frequency, regime transition dynamics, and can be useful to evaluate model representation of ISM variability, teleconnections and trend attribution.
- Article
(9275 KB) - Full-text XML
- BibTeX
- EndNote


The Indian Summer Monsoon (ISM) is a planetary scale seasonal weather pattern characterized by changes in atmospheric pressure, seasonal reversal of continental-scale surface winds that bring consistent rainfall to the Indian subcontinent during the months of June–September (JJAS) (Ramage, 1966; Rao, 1976). ISM is a primary source of water for agriculture as well as industry and has a strong impact on the country's agricultural production and on the economy (Gadgil and Gadgil, 2006).
The primary processes attributed to this system is the differential heating of the Indian subcontinental landmass. However, the singular role of this land-sea temperature gradient has been disputed since the early 1920s (Simpson, 1921). Additionally, the influence of the Intertropical Convergence Zone (ITCZ) in governing the seasonal wind and rainfall shifts, particularly its northward progression that sets up the Asian summer monsoon circulation, has been highlighted by Sikka and Gadgil (1980). These strong moist southwesterly winds are integral to sustaining monsoon.
The pre-monsoon phase typically occurs from March to May and is characterized by hot and dry conditions over the Indian subcontinent. The monsoon onset phase typically occurs in June and is characterized by the arrival of the southwesterly winds and the beginning of heavy rainfall which is observed first over Kerala coast (Ananthakrishnan and Soman, 1988), beyond which the monsoon progresses and covers the entire country in the next few weeks. The seasonal mean rainfall is modulated by active/break monsoon phases which typically occur once the monsoon is established over the entire subcontinent, and is characterized by the strongest/weak winds and heaviest/low rainfall (Raghavan, 1973; Murakami, 1976; Goswami and Mohan, 2001). The monsoon withdrawal phase typically starts around September and is characterized by the weakening of the south-westerlies and the gradual decrease in rainfall (Rajeevan et al., 2006). The strength of the southwesterlies is driven by the meridional pressure gradient between low pressure over north India and Pakistan and high pressure over Mascarene Islands, named Mascarene High (Sikka and Gadgil, 1980). This gradient is also important in determining the strength of the cross-equatorial jet. In addition, synoptic systems such as monsoon depressions, monsoon trough, mid-tropospheric cyclones heavily modulate the distribution and variability of rainfall across the subcontinent (Rao, 1961).
The monsoon trough over north India extends east-west and dips in to the head Bay of Bengal and is a critical component of the meridional pressure gradient. The monsoon trough acts as a channel for the flow of moist air from the ocean onto the land, leading to the formation of clouds and heavy rainfall, with rainfall maxima observed to the south of the trough (Rao, 1976; Webster et al., 1998). The position of the monsoon trough modulates the distribution of rainfall over the Indian subcontinent and is also an important indicator of changes in active to break phases of monsoon. During active phases the trough is located further south than usual giving more rainfall over the southern and central parts of the subcontinent (Goswami et al., 2003). During the break phase, trough moves at the foothills of Himalaya, giving more rainfall near the foothills of Himalaya and north-eastern parts of the subcontinent (Rao, 1976).
Monsoon depressions form and propagate along the monsoon trough when the Indian Ocean sea surface temperature is anomalously high and move towards the Indian subcontinent causing heavy and prolonged rainfall along its path(Rajeevan et al., 2010; Hunt and Fletcher, 2019). Mid-tropospheric cyclones, exhibiting maximum intensity around the 500 mbar level during the summer are characterized by a distinct thermal structure, with a warm anomaly situated above the cyclone and a cold anomaly below (Krishnamurti and Hawkins, 1970). Such thermal configurations induce rising motions west of the cyclone and sinking motions to its east (Goswami et al., 1980). Their presence modulate monsoon rainfall, as they govern the ascent of moist air, leading to significant convective rainfall events (Choudhury et al., 2018).
In addition, orographic effects play a critical role in geographic distribution of rainfall patterns (Gadgil, 1977). The Western Ghats, in particular, exhibit a pronounced orographic effect on rainfall during the southwest monsoon (Sarker, 1966; Phadtare et al., 2022). The Himalayas, not only act as a barrier for cold mid-latitude winds but also increase the ascending motion and rainfall over the Gangetic plains during active phases and foothills of Himalayan region during break phases, with orography playing a significant role (Raghavan, 1973). Thus the complex interplay between orographic features and the prevailing atmospheric conditions, particularly the of lower tropospheric westerlies shapes the rainfall distribution.
Intraseasonal variations in monsoon rainfall is largely determined by the movement and interactions of the synoptic weather systems. However, these synoptic systems are modulated by large scale circulation and variablity that shows distinct signatures at intraseasonal, interannual and long term timescales in monsoon intensity and distribution (Gadgil, 2003; Webster et al., 1998; Suhas et al., 2013). The Madden–Julian Oscillation (MJO) (Dey et al., 2022) and the El Niño–Southern Oscillation (ENSO) (Kumar et al., 1999; Roxy et al., 2015) are the primary large-scale modes modulating ISM rainfall intensity and variability, along with the Indian Ocean Dipole (IOD), Pacific Decadal Oscillation (PDO), Atlantic Niño and the Arctic Oscillation (AO) (Saji et al., 1999; Ihara et al., 2007; Thompson and Wallace, 1998; Deshpande et al., 2014; Yadav et al., 2018). IOD modulates the impact of ENSO on the ISM (Ashok et al., 2007). Positive IOD enhances rainfall over the Indian subcontinent and the negative IOD can decrease rainfall over the subcontinent (Ashok et al., 2001; Deshpande et al., 2014). Gong et al. (2001) showed the linkage between the Arctic Oscillation and the East Asian winter monsoon and Bamzai and Shukla (1999) discussed the linkage between Eurasian snow cover and the Indian summer monsoon.
An analysis of APHRODITE data from 1951 to 2007 showed an increase inter-annual rainfall variations across India (Duncan et al., 2013). An increasing trend in drought severity is also observed in recent decades over south India and the Indo-Gangetic plains (Mallya et al., 2016). Bajrang et al. (2023) also observed a decrease in monsoonal precipitation extremes over Central India from 2005 to 2020. Over a longer term (1901 to 2022) individual spell contributions varied, however the total rainfall contributions remained consistent (Subrahmanyam et al., 2023). This is possibly due to multidecadal rainfall trend reversals (Chakra et al., 2023). Straus (2022) clustered pentad anomaly of 850 hPa horizontal winds from the ERA-Interim reanalysis to study active-break cycles and intra-seasonal oscillations. (Falga and Wang, 2022) found significant increases in extreme events in nine regions from 1901–2020 using clustering, linking them to urbanization and other climatological factors. Increasing extreme rainfall events (Ghosh et al., 2012; Roxy and Chaithra, 2018; Goswami et al., 2006) translates into increased floods and drought risks occurring in the same season. While there has been significant focus on extreme precipitation events, there are major gaps in our understanding of the changing rainfall patterns. Thus, it is evident that the quantification of changes in both frequency and intensity of rainfall over different region is necessary to gain a deeper understanding of evolving monsoon rainfall.
With changing climate, the behaviour of monsoon rainfall as well as extreme precipitation events is changing rapidly (Dhara et al., 2025). The moisture-holding capacity of the atmosphere increases at roughly 7 % per degree Celsius (Clausius–Clapeyron relation), suggesting a propensity for more intense rainfall events with increasing temperatures (Trenberth, 2011; Held and Soden, 2006). Additionally, climate projections indicate possible shifts in the timing of monsoon onset and retreat and an amplification of intraseasonal variability, all of which could adversely impact agriculture and water management (Roxy and Chaithra, 2018; Turner and Annamalai, 2012). Future projections show that rainfall is estimated to increase while monsoon circulation will weaken in the twenty first century (Kulkarni et al., 2020; Dhara et al., 2025).
To address the open question on the change in monsoon rainfall patterns, this study uses a clustering method with the aim to (1) characterize the synoptic-scale rainfall patterns of the Indian monsoon by linking them to known atmospheric circulations, (2) to understand the changes in synoptic patterns of rainfall through decades, and (3) to determine how changes in these patterns contribute to the spatially heterogeneous trends in monsoon rainfall. By providing a clustering analysis framework, this work offers a method understanding changing patterns of rainfall which may help improve model evaluation. Our clustering dataset will be useful in future studies examining monsoon teleconnections and model biases, following the precedents of regime-based analysis of (e.g., Raut et al., 2014, 2017).
2.1 IMD data
Indian Meteorological Department (IMD) has released high-resolution 0.25° × 0.25° daily rainfall data since 1901 over the Indian subcontinent (Pai et al., 2014; Srivastava et al., 2009). The dataset has been created using rain gauge data from 6955 rain gauge stations from the archives, with varying periods of availability. Three sets of data from IMD archives combined with Aphrodite data were used over the Indian subcontinent (Yatagai et al., 2012). The observatories are divided between IMD observatory stations, hydro meteorology observatories, agromet observatories. A detailed description of all four datasets and the methodology is given in Pai et al., 2014. We have used daily means of 0.25° × 0.25° rainfall data from the India Meteorological Department (IMD) over June-September from 1961 to 2018 to compute k-means clusters as per the methodology used in (Raut et al., 2014). Additional linear trends analysis, frequency, and intensity analysis were also conducted using this dataset.
2.2 NCEP-NCAR data
NCEP reanalysis data is produced by the National Centers for Environmental Prediction (NCEP) that provides a comprehensive record of global weather and climate conditions. The dataset is produced by combining observations from a variety of sources, including weather stations, and satellites, with a numerical weather prediction model. This allows researchers to create a consistent and complete record of weather and climate conditions, going back several decades.
In this study, we used 20° S–35° N to 40–120° E domain over the Indian region for studying synoptic environment. Daily anomalies for mean sea level pressure (MSLP), wind (at 850, 700 & 500 mbar), and specific humidity (at the surface) were calculated using the National Center of Environmental Prediction-National Center for Atmospheric Research (NCEP-NCAR) reanalysis-1 (https://psl.noaa.gov/data/gridded/data.ncep.reanalysis.html, last access: 27 June 2026) dataset (Kalnay et al., 1996). NCEP-NCAR have produced a 40-year record of global reanalyses of atmospheric fields keeping quality control and data assimilation system unchanged over the reanalysis period 1948 to present. The database has been enhanced with many sources of observations not available in real time for operations.
2.3 Trends Analysis
To quantify long-term changes in monsoon rainfall, we perform linear trend analysis on regional averaged rainfall. We also divided the 58-year record into two periods (1961–1989 and 1990–2018), and computed the difference in mean rainfall between these two periods as an estimate of long term change. Additionally, for selected regions we computed the linear trend of JJAS total rainfall over 1961–2018. The statistical significance of trends is evaluated using the Mann–Kendall test (not shown in detail for brevity, but significance at the 95 % level is noted where relevant). All trends are calculated on unsmoothed data, however we applied a 5-point Gaussian-weighted running mean for visualization in Fig. 3. Linear trends were not always appropriate, therefore, we used a LOESS (Locally Weighted Scatterplot Smoothing; Cleveland, 1979) curve to highlight multi-decadal fluctuations in cluster frequencies over time in Fig. 9.
2.4 Clustering Rainfall
2.4.1 k-means Clustering Algorithm
k-means is an unsupervised clustering algorithm that divides a dataset into a specified number of clusters (k) based on the similarity of the data points (Anderberg, 2014). It takes an n-dimensional data set comprising of m vectors and works by first selecting k initial centroids and then assigning each data point to the cluster whose centroid is closest to them in Euclidean space. The centroids are then updated to be the mean of the data points in their respective clusters, and the data points are reassigned to the new clusters based on the updated centroids. This process is repeated until the centroids converge and the assignments of data points to clusters become stable. The goal of k-means is to minimize the cumulative sum of the Euclidean distances across all points in the clusters, as illustrated in Eq. (1).
However, one limitation of the k-means algorithm is its dependence on the user specifying the precise number of clusters. Moreover, its efficacy can be influenced by the initial conditions for certain data sets and k values.
2.4.2 Finding Rainfall Threshold
Seasonal rainfall in Western Australia occurs in bursts due to frontal passage or easterly dips, causing approximately 38 % dry days, and close to 48 % light rain days. Hence, the dominant cluster could contains approximately 60 % members with all dry days and some light rain days. To mitigate this, Raut et. al. (2014) differentiated dry days from rainy days using a threshold and clustered the rainy days to capture more variability within the rainfall patterns. In contrast, during the Indian monsoons, the distribution of daily mean area rainfall across the entire domain, as depicted in Fig. 1, follows a Gaussian distribution with negligible occurrences of dry days. Even during the break monsoon periods, the Himalayan foothills and southern India often feature intense localized rain, while the rest of the subcontinent remains relatively dry. Therefore, we retained all days in our analysis and obtained the clusters of comparable sizes.
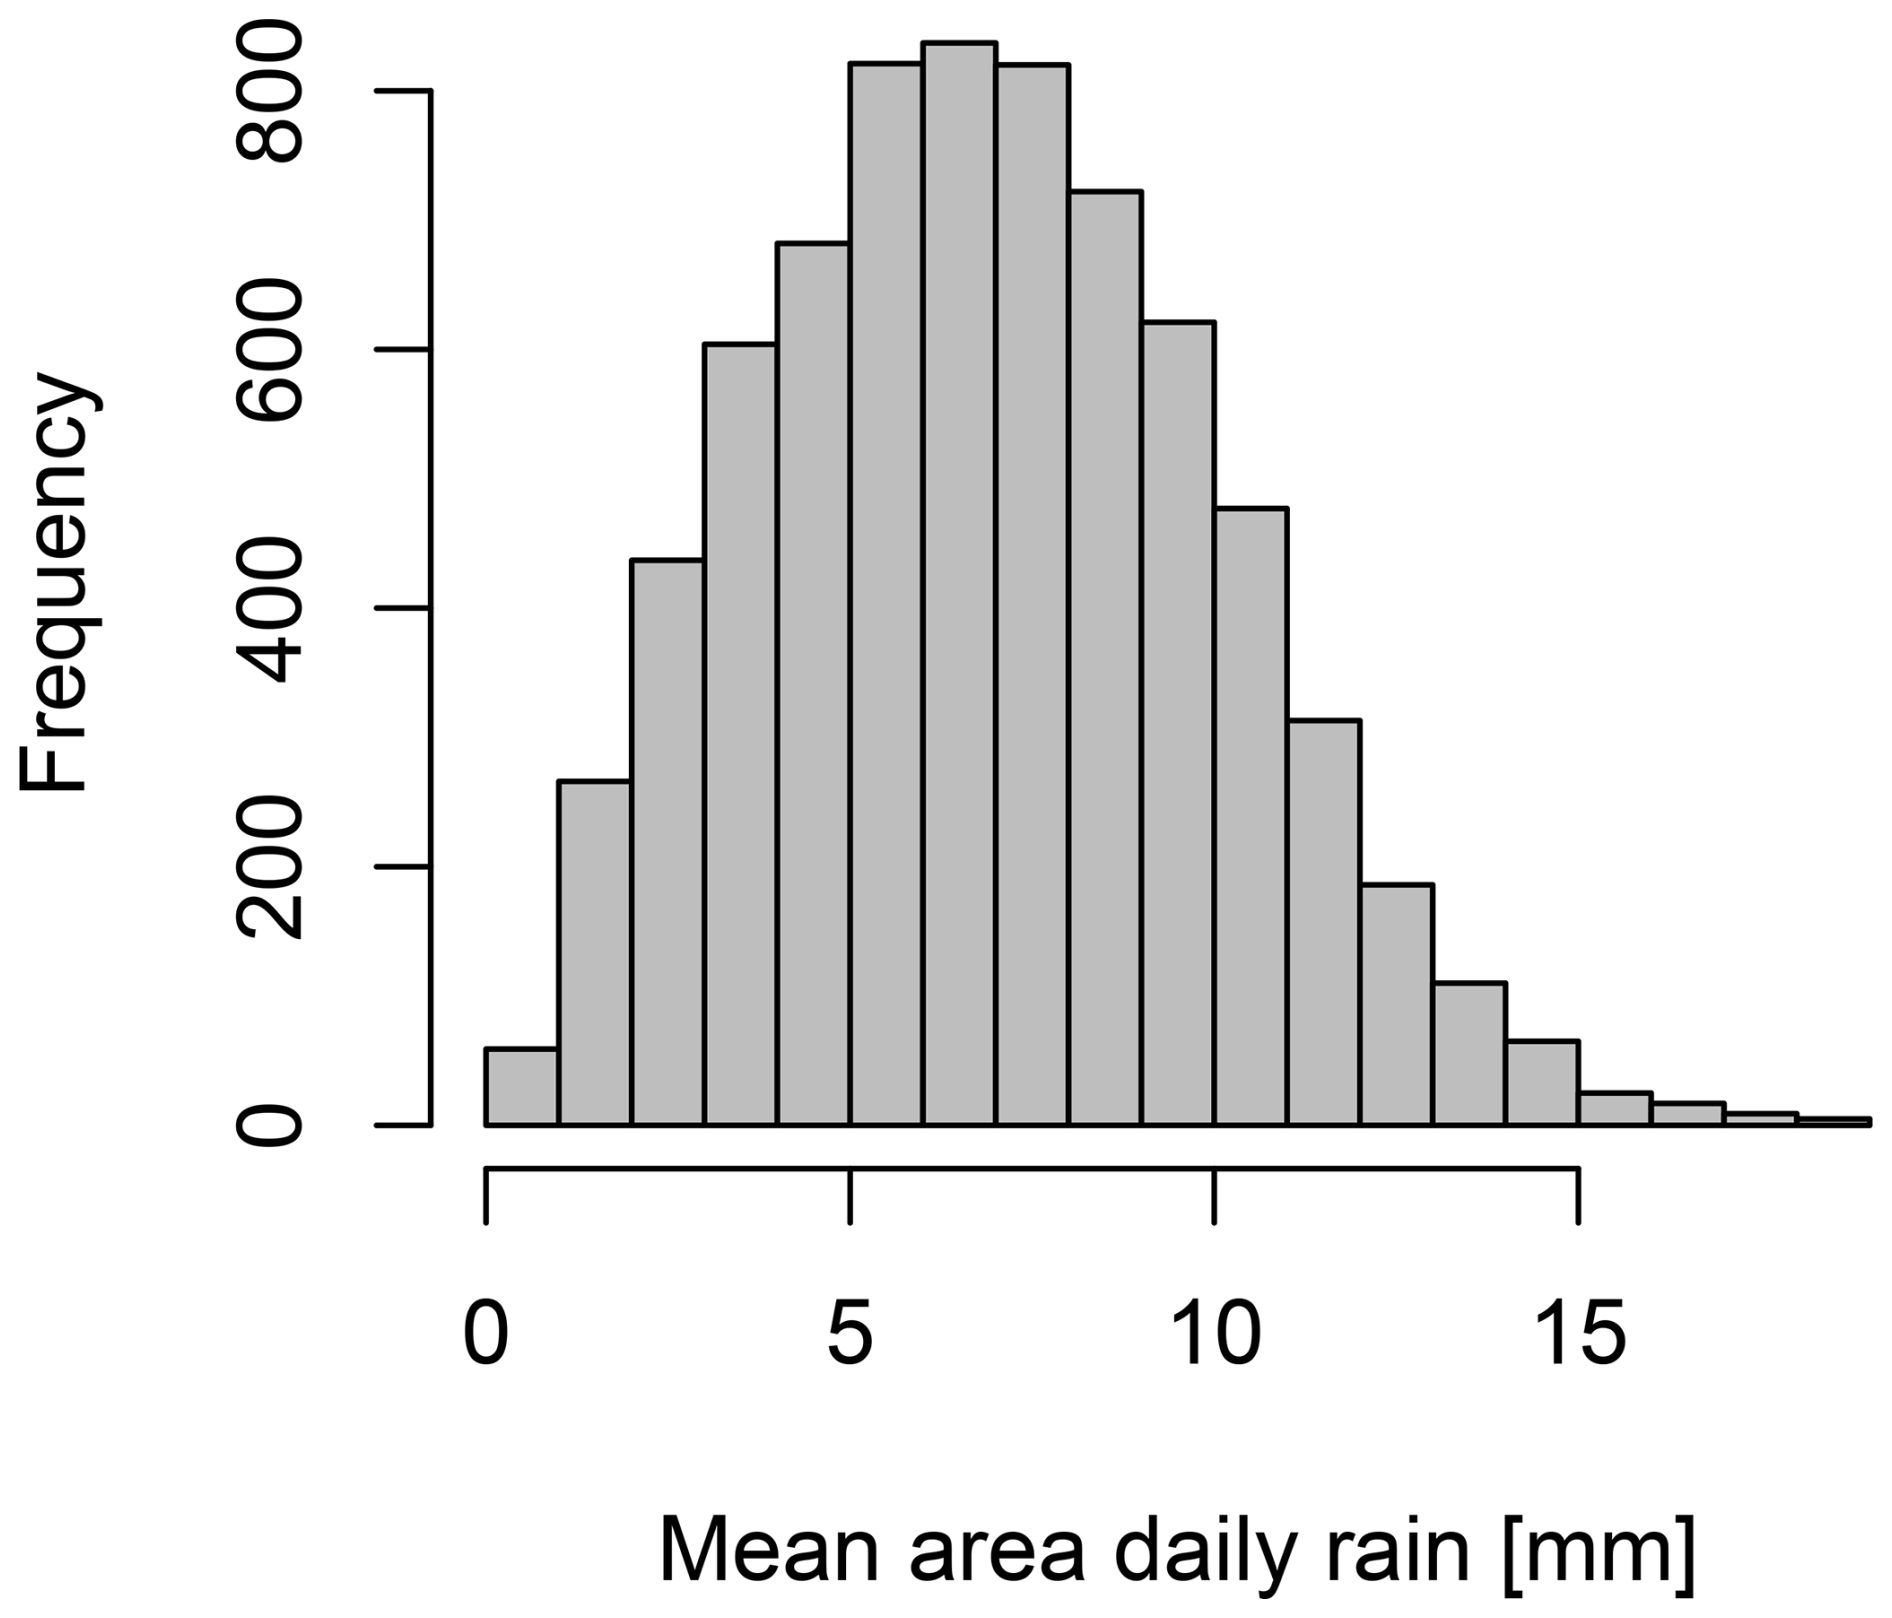
Figure 1The frequency distribution of daily area mean rainfall for the study region is normally distributed with approximately 1 % of days with no rain in the domain during JJAS. Therefore, all the days were clustered.
2.4.3 Finding Optimal k
While the determination of k can sometimes be guided by prior knowledge, theoretical insights, or objective methods, in situations where no pre-existing knowledge about the probable number of clusters in the dataset is available, various statistical metrics are used. We utilized the Elbow method as described by Bholowalia and Kumar (2014), as our recent studies established it as a robust method (Raut et al., 2021; Jackson et al., 2023). By executing the algorithm with incrementally increasing k from 3 to 20, we plotted the changes in the intra-cluster sum of squared Euclidean distances, known as the Within Cluster Sum of Squares (WCSS), and the inter-cluster sum of squared distances, termed the Between Cluster Sum of Squares (BCSS), as functions of k (See Fig. 2). A noticeable break in the downward/upward trends of WCSS/BCSS at k=11 suggested that 11 clusters are optimum.
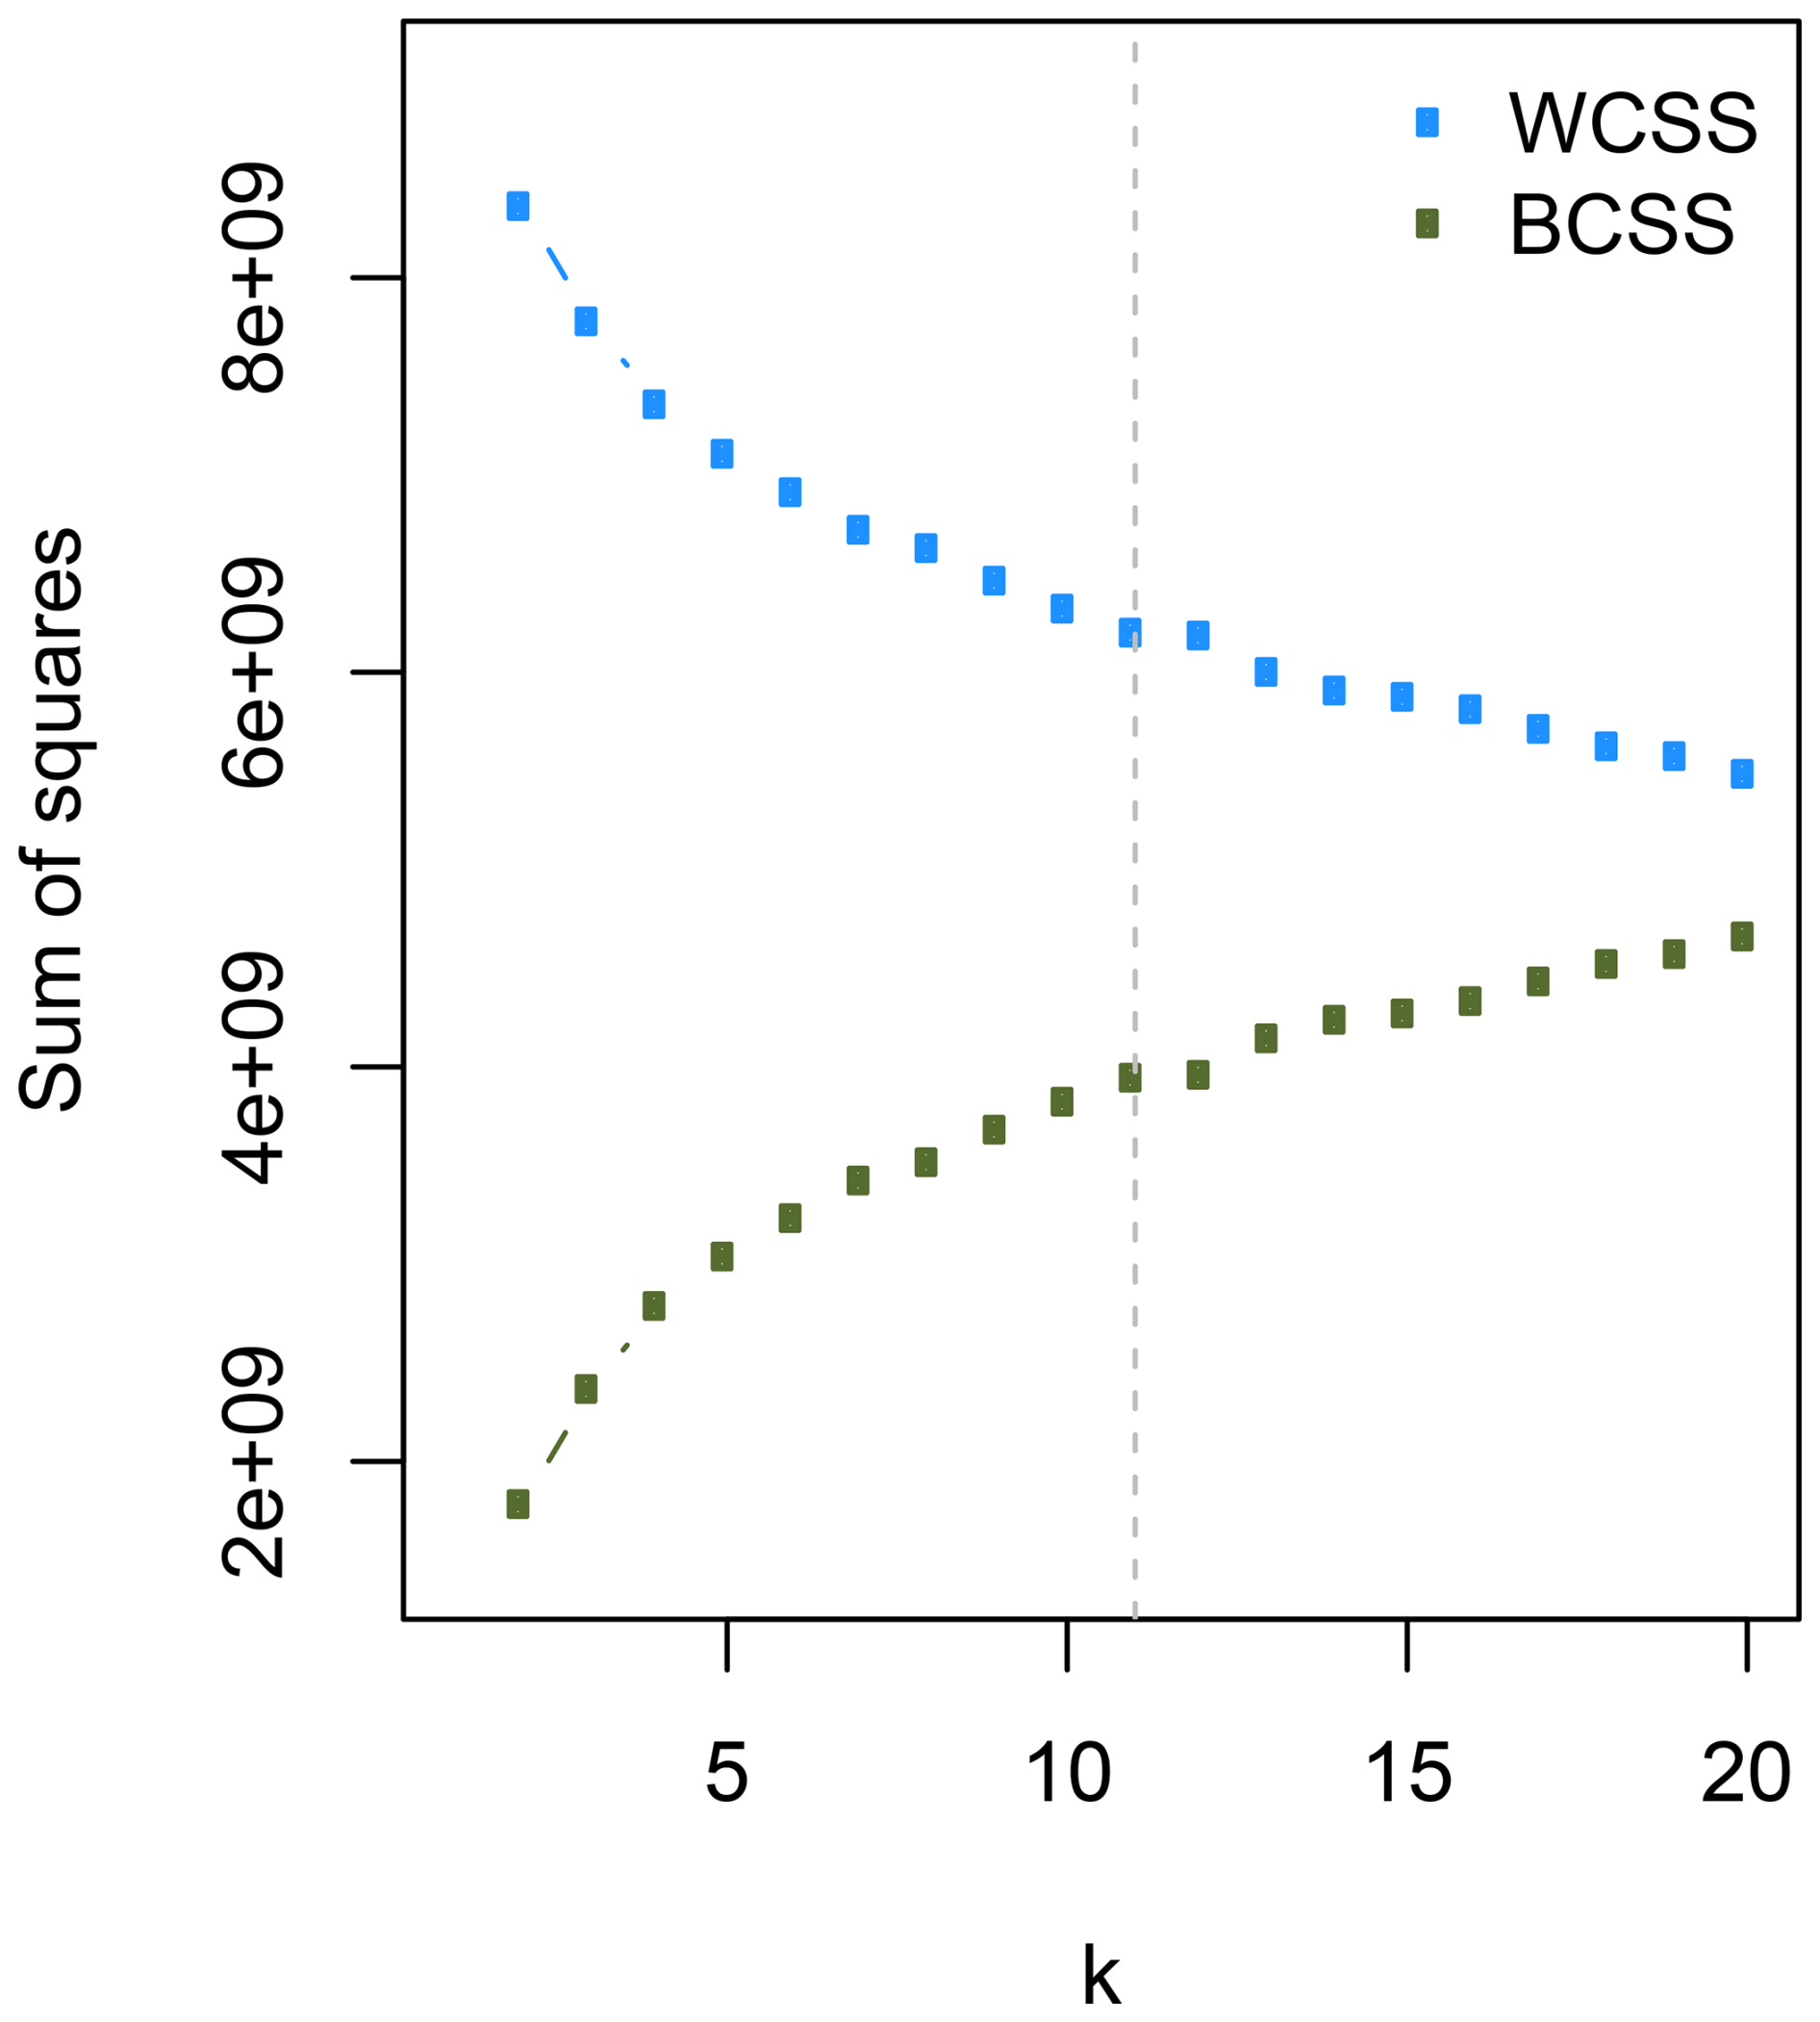
Figure 2In the k-means algorithm, the user has to provide k. We employed commonly used elbow criteria for two metrics as a function of k (a) change in WCSS and (b) change in BCSS. The optimal k is the smallest number of compact and separable clusters.
To mitigate potential issues arising from the algorithm's sensitivity to the initial seeding, we assessed the stability of our clustering by repeatedly initializing the k-means algorithm and observing any shifts in cluster assignments. Although this process can be computationally expensive for a large dataset, two random initialization converging to the same cluster centroids is sufficient to demonstrate cluster stability. We found that fewer than 0.1 % of any cluster's members altered their cluster affiliation, indicating the presence of stable clusters when k=11. The k-means function in R programming language, was employed on June–September 1961–2018 rainfall data, using the algorithm of Hartigan and Wong (1979), with initial seed equal to double the number of clusters (2×k) and a limit of 100 iterations.
2.5 Transition Probabilities
With each day labeled by a cluster, we analyzed the day-to-day transitions between rainfall regimes to understand the probabilities of transitioning from one cluster to another. The transition probability from state i to state j is denoted by Pij.
where Nij is the number of transitions from cluster i on day d to cluster j on day d+1, and the denominator is the total number of transitions originating from cluster i (minus one if the last day of a season is cluster i, since it has no subsequent day within the season; however, given the long period analyzed, this edge effect is negligible).
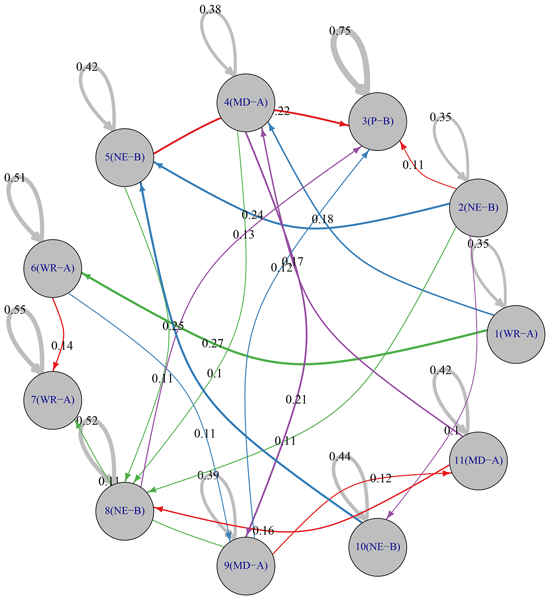
We use this transition matrix as a diagnostic summary of regime persistence and sequencing to characterize preferred transitions between rainfall regimes in Sect. 3.3.
2.6 Change analysis
The change in total rainfall across two periods, R1 and R2, can be parsed into two components 1. attributed to changes in intensity and 2. attributed to changes in frequency. To compute these changes for each cluster, we utilized the method described in Catto et al. (2012) and Raut et al. (2014).
Here, Ni and Pi denote the frequency of occurrence and intensity of the ith rainfall cluster during period 1, respectively. Meanwhile, ΔNi and ΔPi represent the changes in frequency and intensity for the ith cluster from period 1 to period 2.
The first and second terms in Eq. (3) can be understood as the modifications in rainfall attributed to changes in intensity and frequency, respectively. The third term is a higher-order Taylor series expansion component representing shifts in rainfall due to concurrent changes in intensity and frequency. Given that this term is a product of the two changes, it's usually small. However, if the dataset exhibits high variability, the third term could potentially exceed the changes attributed to intensity (first term), frequency (second term), or both. In such scenarios, any change term surpassed by the third term is deemed non-significant. The analysis of this decomposition of cluster rainfall is shown in Fig. 10 and dicussed in Sect. 3.4
3.1 Spatial Analysis of Trends
Before analyzing the clusters, we first describe the spatial distribution and recent trends of monsoon rainfall over India to provide context. Figure 3 depicts the average summer monsoon rainfall in India during the June–September (JJAS), highlighting the rainfall maxima over Western Ghats, Central India, and Northeast India regions. This distribution varies on multiple spatiotemporal scales. To explore the long-term variations in seasonal rainfall, the study period of 1961–2018 was split into two sub-periods: 1961–1989 (denoted as R1) and 1990–2018 (denoted as R2). Figure 3b and c illustrate the changes in rainfall between these periods, revealing a decline in rainfall in recent sub-period (R2) over most parts of the subcontinent, except over arid and semiarid regions of western India. Specifically, prominent changes in widespread rainfall were detected in the regions along the monsoon trough. There is an increase in rainfall over the Thar and Kutch region (T&K), while the Indo-Gangetic plains (IGP) (Dhara et al., 2025; Kulkarni et al., 2020) and Northeast India (NEI) (Zahan et al., 2021; Jain et al., 2013) witnessed a reduction. Figure 3c presents the rainfall change (R2 − R1) in percentage terms, whereas Fig. 3d–f show the linear trend in average rainfall for the aforementioned regions. Across the two periods, the T&K region (Fig. 3) experienced a consistent rise in rainfall with a large decadal fluctuations, in contrast to the steady decrease in the Indo-Gangetic plains (Fig. 3e) and Northeast India (Fig. 3f). Although recent studies have shown an increase in extreme rainfall events, (Goswami et al., 2006; Roxy and Chaithra, 2018), but a weakening in Indian circulation (Turner and Annamalai, 2012), as well as the change shown in Fig. 3 suggests that these shifts are not uniform throughout the subcontinent. In this study we have highlighted how these changes in rainfall patterns also reflect a change a in synoptic systems such as monsoon trough and the areas influenced by monsoon depressions, as these systems are the dominant drivers of daily and intraseasonal variability and critically shape the long-term distribution and trends of rainfall.
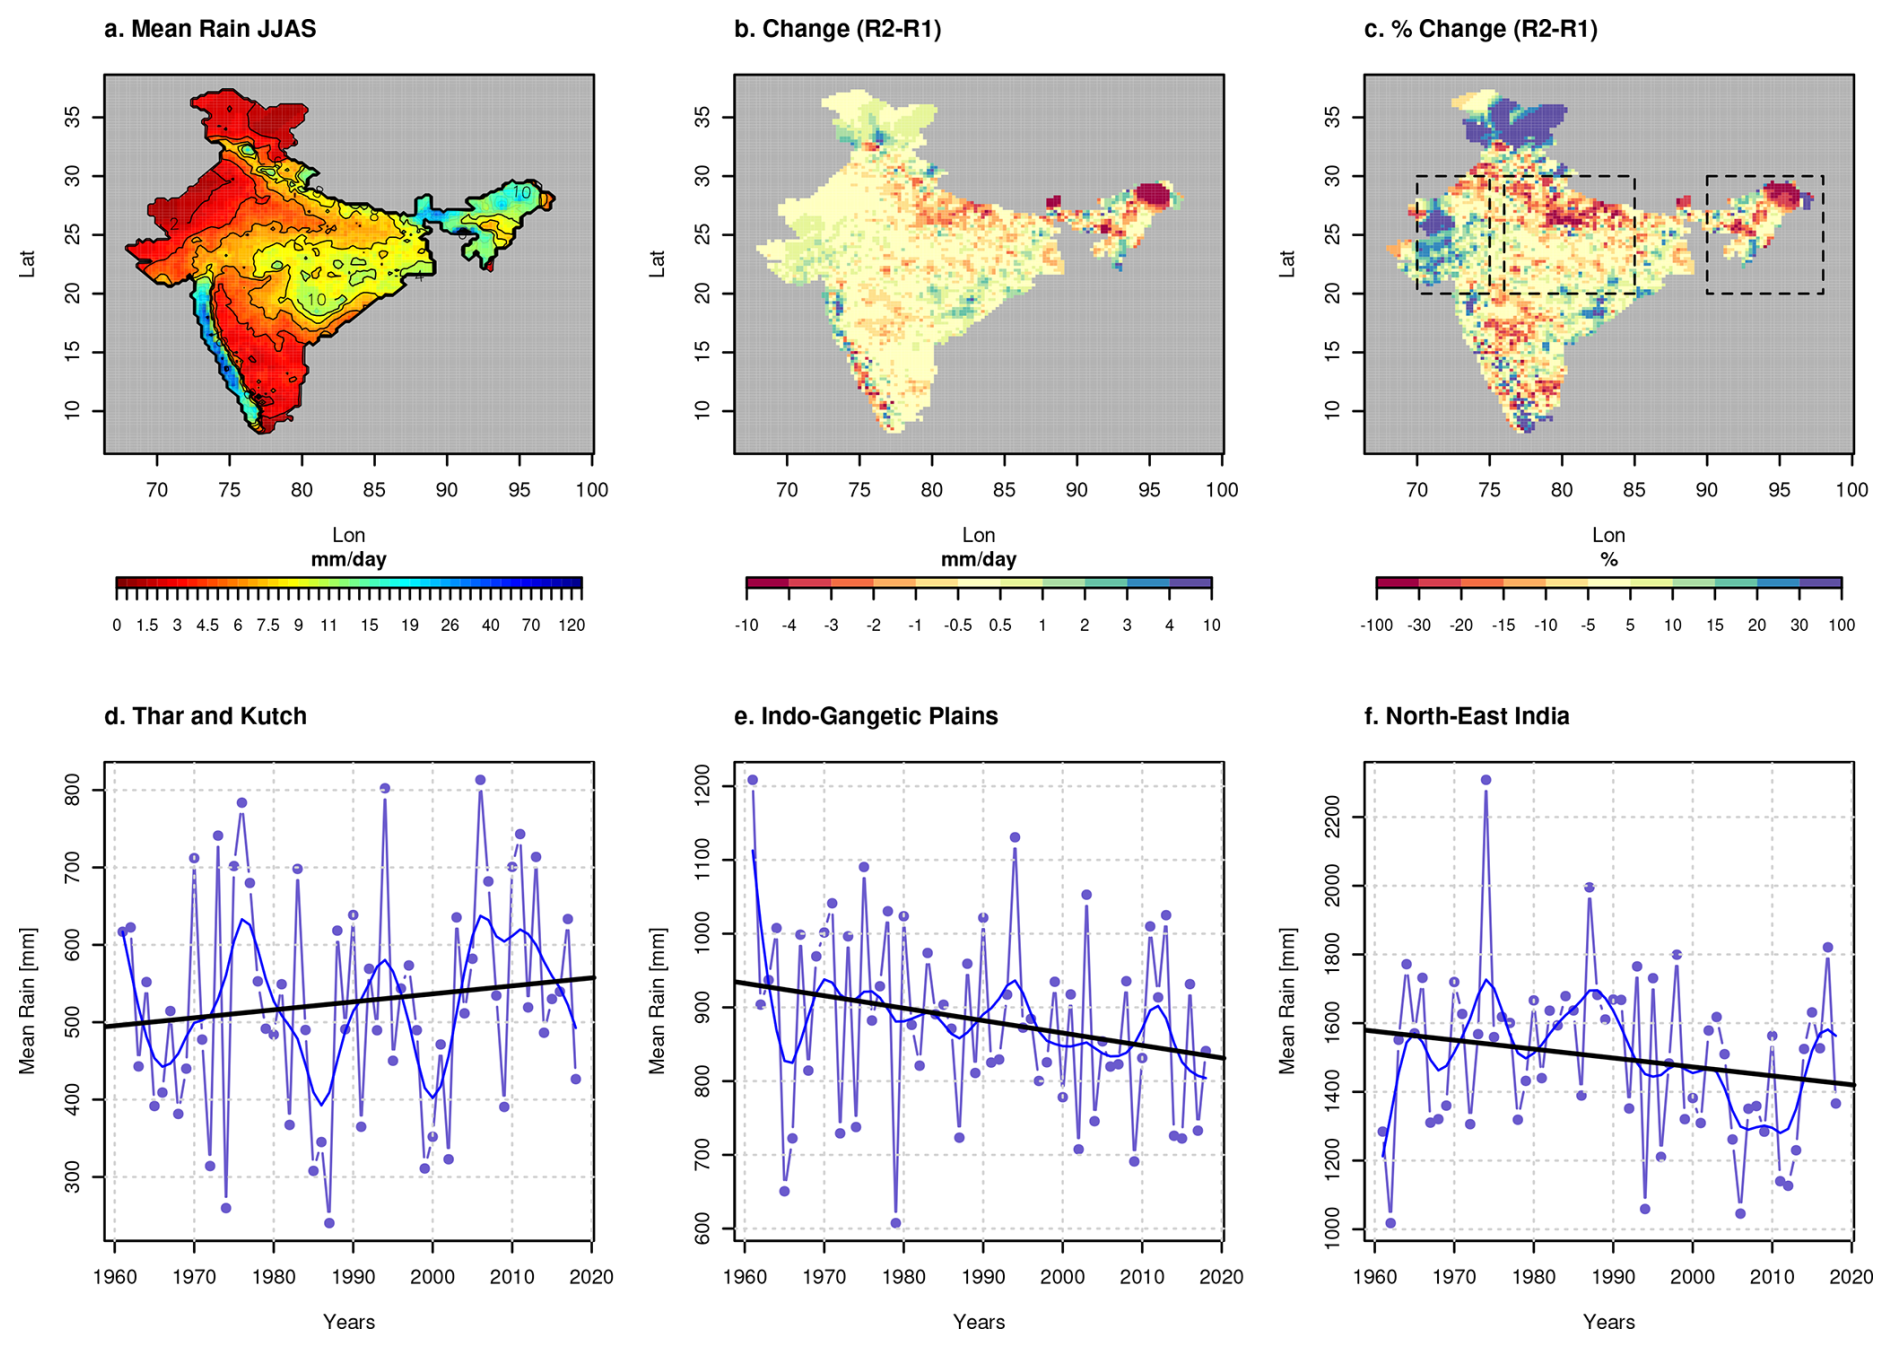
Figure 3(a) Daily mean area rainfall. (b) Change in daily mean rainfall between two periods 1961–1989 (R1) and 1990–2018 (R2). (c) Same as panel (b) but in percentages. The locally weighted smooth curves (blue lines) and linear trends (black line) in annual accumulations of rainfall in the regions bounded by the boxes shown in panel (c) for (d) Thar and Kutch, (e) Indo-Gangetic plains, and (f) Northeast Indian region.
3.2 Characteristics of Rainfall Regimes
Applying the k-means algorithm to the daily rainfall data yielded 11 distinct clusters, whose rainfall patterns are shown in Fig. 4 along with associated circulation patterns are shown with sea level pressure and 850 hPa wind anomalies in Fig. 5, while 850 hPa geopotential height and precipitable water anomalies are shown in Fig. 6. Although, cluster transitions are discussed in Sect. 3.3, we will refer to the Fig. 7 in the current section when necessary. The clusters are organized into four broad categories based on rainfall patterns, wind and specific humidity anomalies (at 1000 mbar), and mean sea level pressure. This grouping is introduced only to improve narrative flow and brevity in presentation. The analysis of circulation patterns has been discussed for all individual clusters. The active monsoon clusters have significantly higher and widespread rainfall, cyclonic anomaly in wind, pressure and higher moisture content (clusters 1, 4, 6, 7, 9 and 11) and the break monsoon clusters are with a lower rainfall, anticyclonic anomaly and lower moisture content in the subcontinent (clusters 2, 3, 5, 8, 10).
-
Prolong break (P-B) [Cluster 3]: Cluster 3 is the most frequent cluster (27.6 % of days) and the synoptic circulation pattern (Figs. 5 and 6) corresponds to the typical break-monsoon condition. Rainfall is largely suppressed across the entire subcontinent except for light rain along the Himalayan foothills, parts of the southeast peninsula and NEI. The widespread dryness is evident from the < 2 mm d−1 rainfall over most of India. The composite synoptic anomalies for this cluster (Fig. 5, third panel) show positive anomalies of sea-level pressure over India and anticyclonic wind anomalies at low levels (850 hPa) over the subcontinent, indicating an anomalous high-pressure. Correspondingly, moisture (precipitable water; Fig. 6) is below normal over the Indian landmass and slightly above normal over the equatorial Indian Ocean, reflecting a southward shift of the moisture convergence zone. This cluster's high self-transition probability (see Fig. 7) implies that once the monsoon enters a prolonged break state, it tends to persist for several days, which is consistent with observed breaks that often last for weeks (Raghavan, 1973).
-
Northeast rainfall, break phase (NE-B) [2, 5, 8, 10]: These four clusters, though distinct, share the characteristic of a rainfall maxima over NEI and the Himalayan foothills and below-normal rainfall over much of India. In Cluster 2 (8.9 % frequency), heavy rainfall is confined to the far northeast (north of 25° N, east of 90° E), possibly indicating days when the monsoon trough is stationed at the foothills of the Himalayas. Cluster 5 (6.7 %) and Cluster 10 (5.5 %) also show this northeast India rainfall maximum, with cluster 10 having a particularly strong focus over the Meghalaya hills (which include Cherrapunji, one of the rainiest places on Earth). During these clusters, central and peninsular India are generally dry. The 850 hPa wind anomaly composites (Fig. 5) for these clusters reveal anomalous anticyclonic flow over the Arabian Sea and peninsular India, indicating a weakened monsoon flow or even a slight reversal (easterlies over India). However, there is cyclonic circulation anomaly over the Bay of Bengal and into Northeast India, which, combined with moisture convergence (Fig. 6), leads to heavy rainfall in that region. We group these clusters as variants of a “Break with Northeast Rain” regime (NE-B). They likely correspond to the classic break-monsoon situations where the monsoon trough has shifted to the foothills of Himalayas with a rainfall maxima over Northeast India. Notably, Clusters 2 and 8 have moderate rainfall extending into the eastern Gangetic plains, whereas Cluster 10 is almost exclusively northeast-focused. Transitions among these clusters are common (Sect. 3.3), indicating they often succeed each other in time as part of a break spell.
-
Monsoon depressions, active phase (MD-A) [4, 9, 11]: These clusters represent active monsoon conditions dominated by the presence of monsoon low-pressure systems and/or monsoon depressions. Cluster 11 (4.6 % frequency) shows a classic monsoon depression pattern with very heavy rainfall (> 15 mm d−1) centered over the head of the Bay of Bengal and Bangladesh, extending into eastern India (Odisha, West Bengal). Cluster 4 (8.8 %) seems to depict the later stage of a monsoon depression that has moved inland; and shows a rainfall maximum over central India (Madhya Pradesh region) and secondary maxima in the Western Ghats and NEI. The 850 hPa winds for Cluster 11 (Fig. 5, last panel) show a pronounced cyclonic anomaly over the northern Bay of Bengal and eastern India, while Cluster 4 shows this anomaly shifted to central India, consistent with west-northwestward propagation of the system. In addition, the mean sea level anomalies also indicate the monsoon trough in its active phase position as seen in Fig. 5 for each of the three cluster composites.
Cluster 9 (3.9 %) is somewhat intermediate, it shows enhanced rainfall over northwest India (Thar and Kutch region) and adjoining Pakistan, as well as along the Himalayas. This suggests Cluster 9 could represent the remnants of a depression or a mid-tropospheric cyclone that has reached northwest India, bringing unusual rainfall to the desert region. The composite for Cluster 9 indeed shows a cyclonic circulation anomaly over Rajasthan (Fig. 5) and increased precipitable water in that normally dry region (Fig. 6). These three clusters collectively capture different stages and tracks of synoptic systems, from genesis in the Bay (Cluster 11) to mature phase over central India (Cluster 4) to decay or interaction with mid-level vortices in the northwest (Cluster 9). Their temporal succession (discussed in Sect. 3.3) often follows the life cycle of a monsoon depression.
-
Widespread rain, active phase (WR-A) [1, 6, 7]: The remaining three clusters depict active monsoon conditions characterized by widespread rainfall not necessarily tied to a monsoon depression. Cluster 7 (10.0 % frequency) has a broad region of moderate to heavy rainfall covering central India, the west coast, and extending into the IGP, with a maximum around central India. It likely corresponds to a typical active monsoon spell without a strong depression influence, possibly driven by an active monsoon trough and embedded smaller-scale systems. Its wind anomaly (Fig. 5) shows a weak cyclonic circulation spanning much of India and strong westerly anomalies over the Arabian Sea feeding moisture inland.
Cluster 1 (10.2 %) shows an intense and extremely widespread rainfall pattern, heavy rain along the Western Ghats and west-central India, and significant rain even in otherwise drier regions. This cluster appears to represent the peak of an active monsoon when the monsoon trough is optimally positioned south of its mean and multiple systems (off-shore vortex, depressions, strong monsoon jet) act together. The composite winds show deep westerlies and low-pressure anomalies covering virtually the entire subcontinent.
Cluster 6 (7.0 %) is somewhat similar to Cluster 1 but with its maximum shifted slightly westward (covering Rajasthan and the Western Ghats simultaneously). Interestingly, Cluster 6 brings notable rainfall into the Thar desert region (similar to Cluster 9 but with also strong west coast rains), its occurrence suggests episodes when a mid-level cyclone over the Arabian Sea or an unusual westward extension of the monsoon trough brings moisture into northwest India. Clusters 1, 6, and 7 represent different intensities and extents of active conditions, from moderate active spells (Cluster 7) to extreme widespread rainfall (Cluster 1). All the three clusters also show large scale cyclonic circulation over the regions with peak rainfall intensity in addition to the active phase position of the monsoon trough as seen in sea level anomalies (Fig. 5).
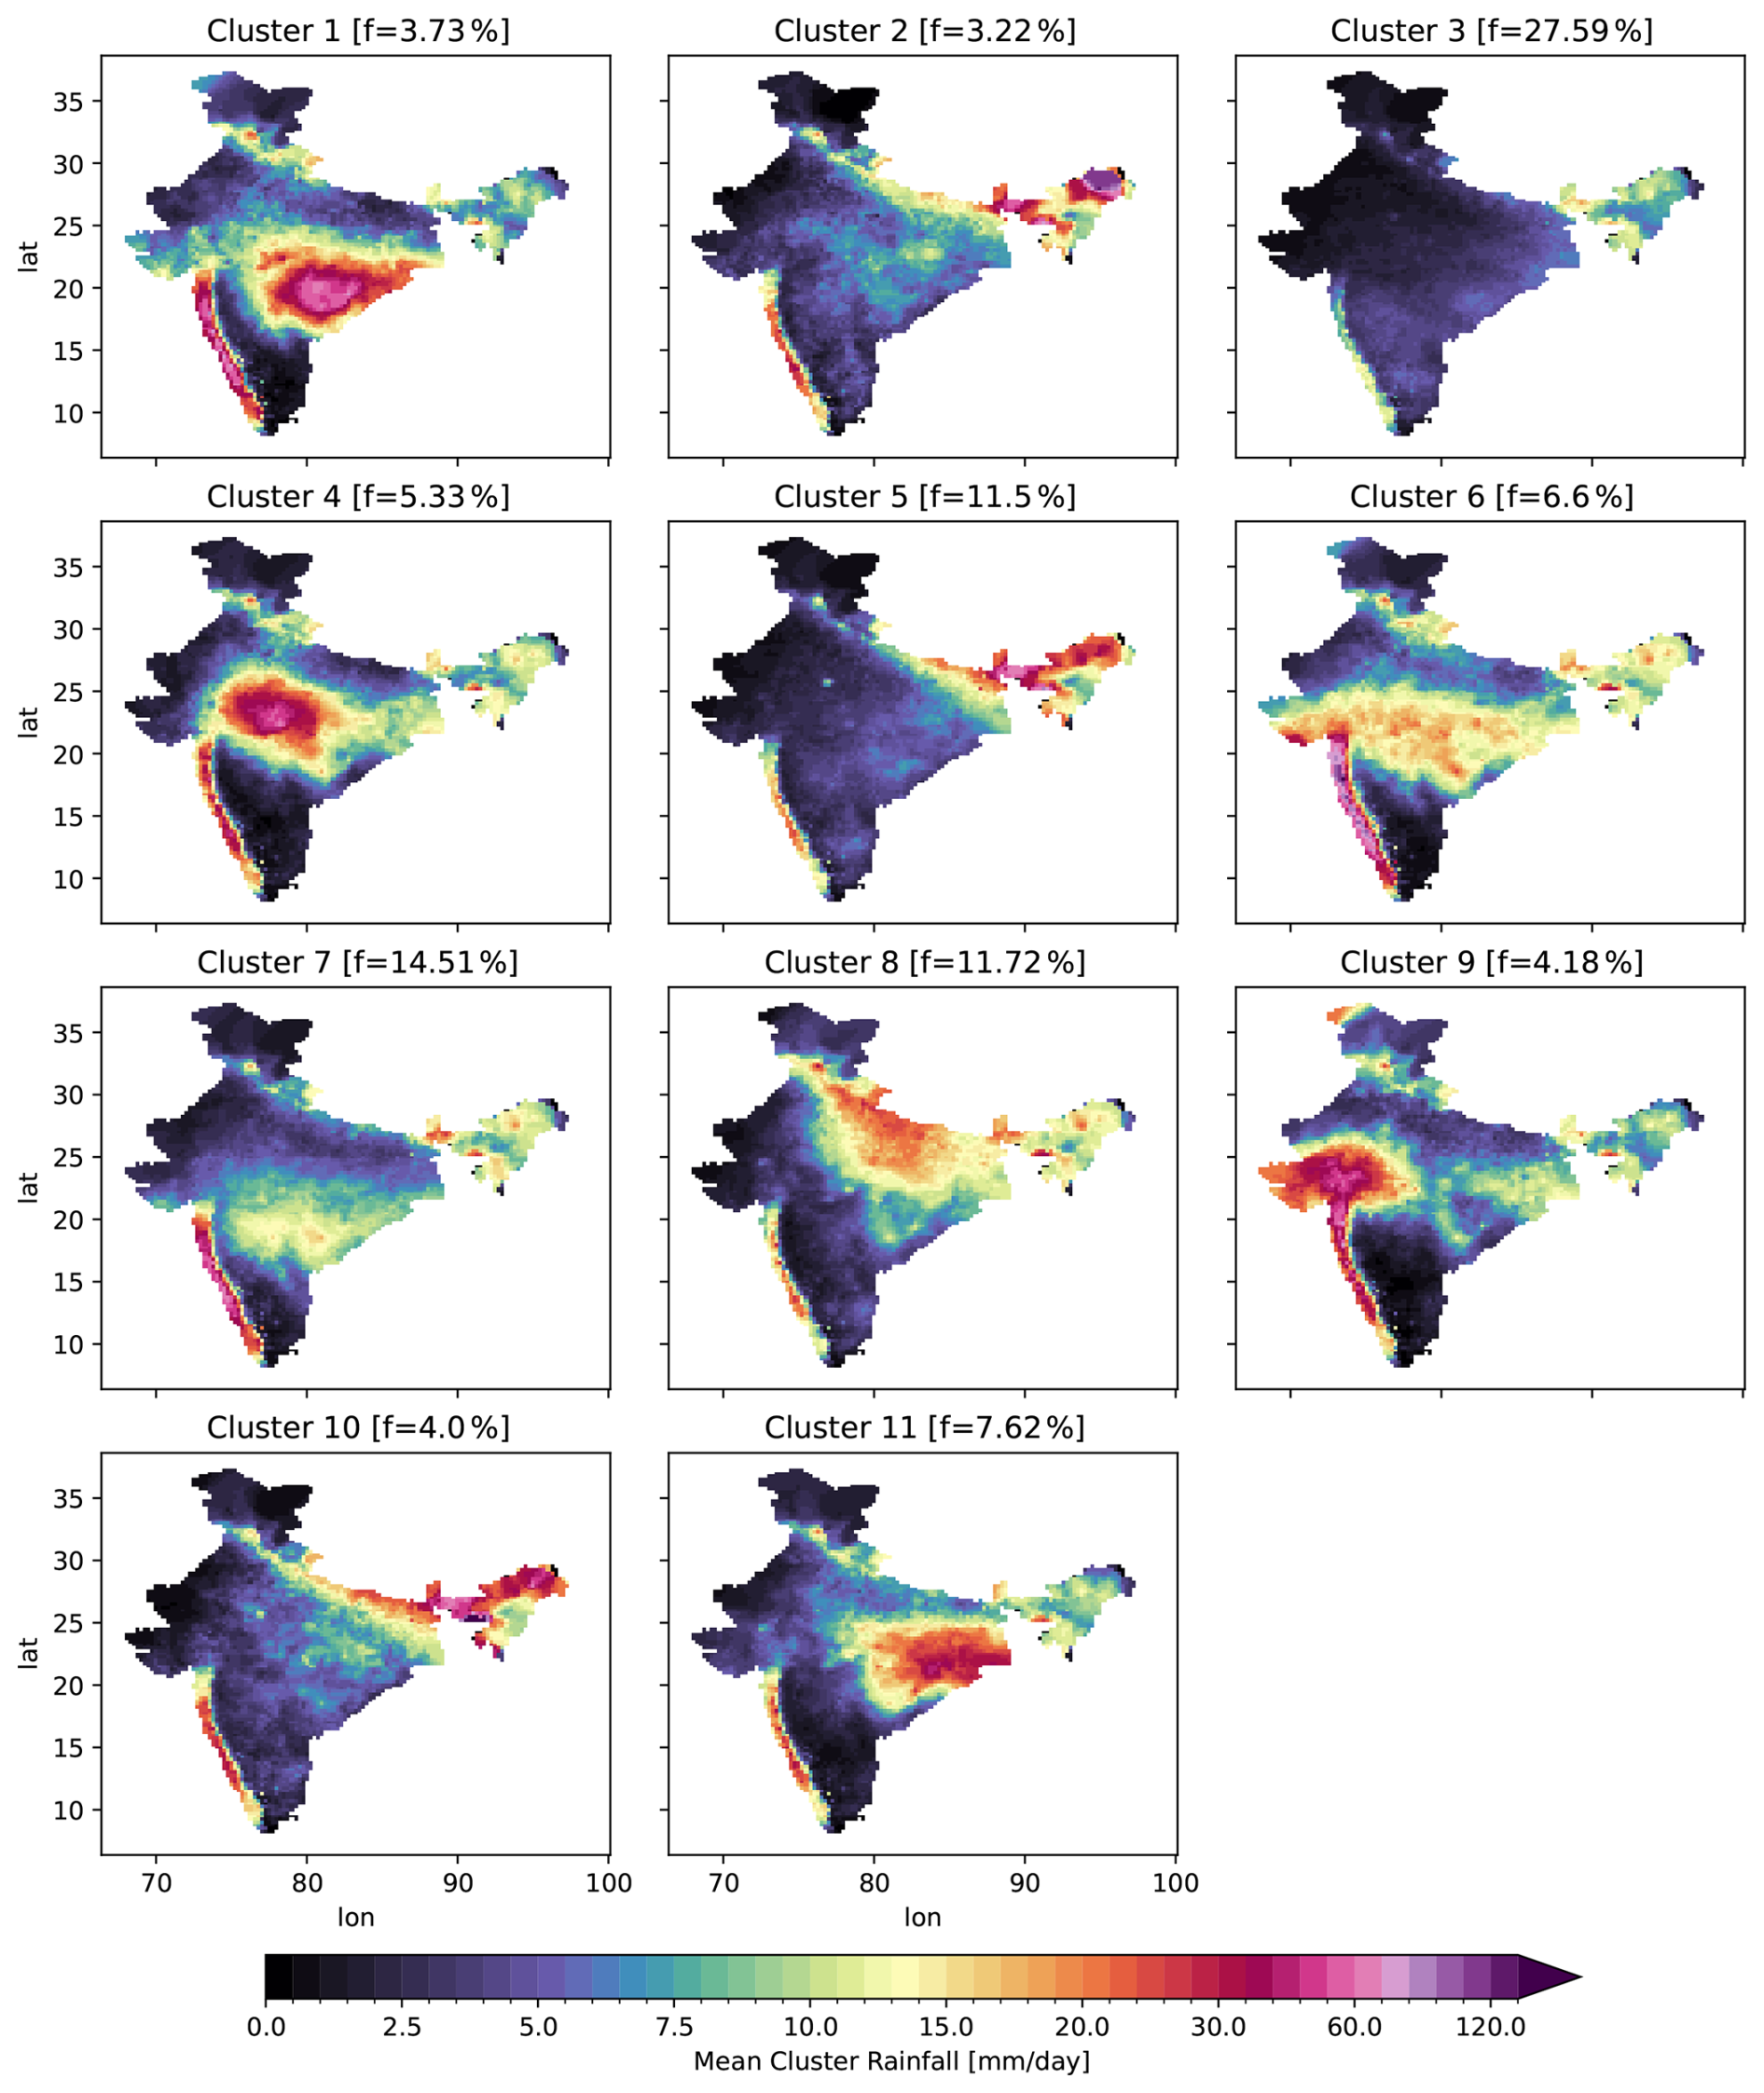
Figure 4Mean spatial patterns of eleven clusters of gridded rainfall computed over Indian landmass using the methodology described in the Sect. 2.4 and their percent frequency of occurrence.
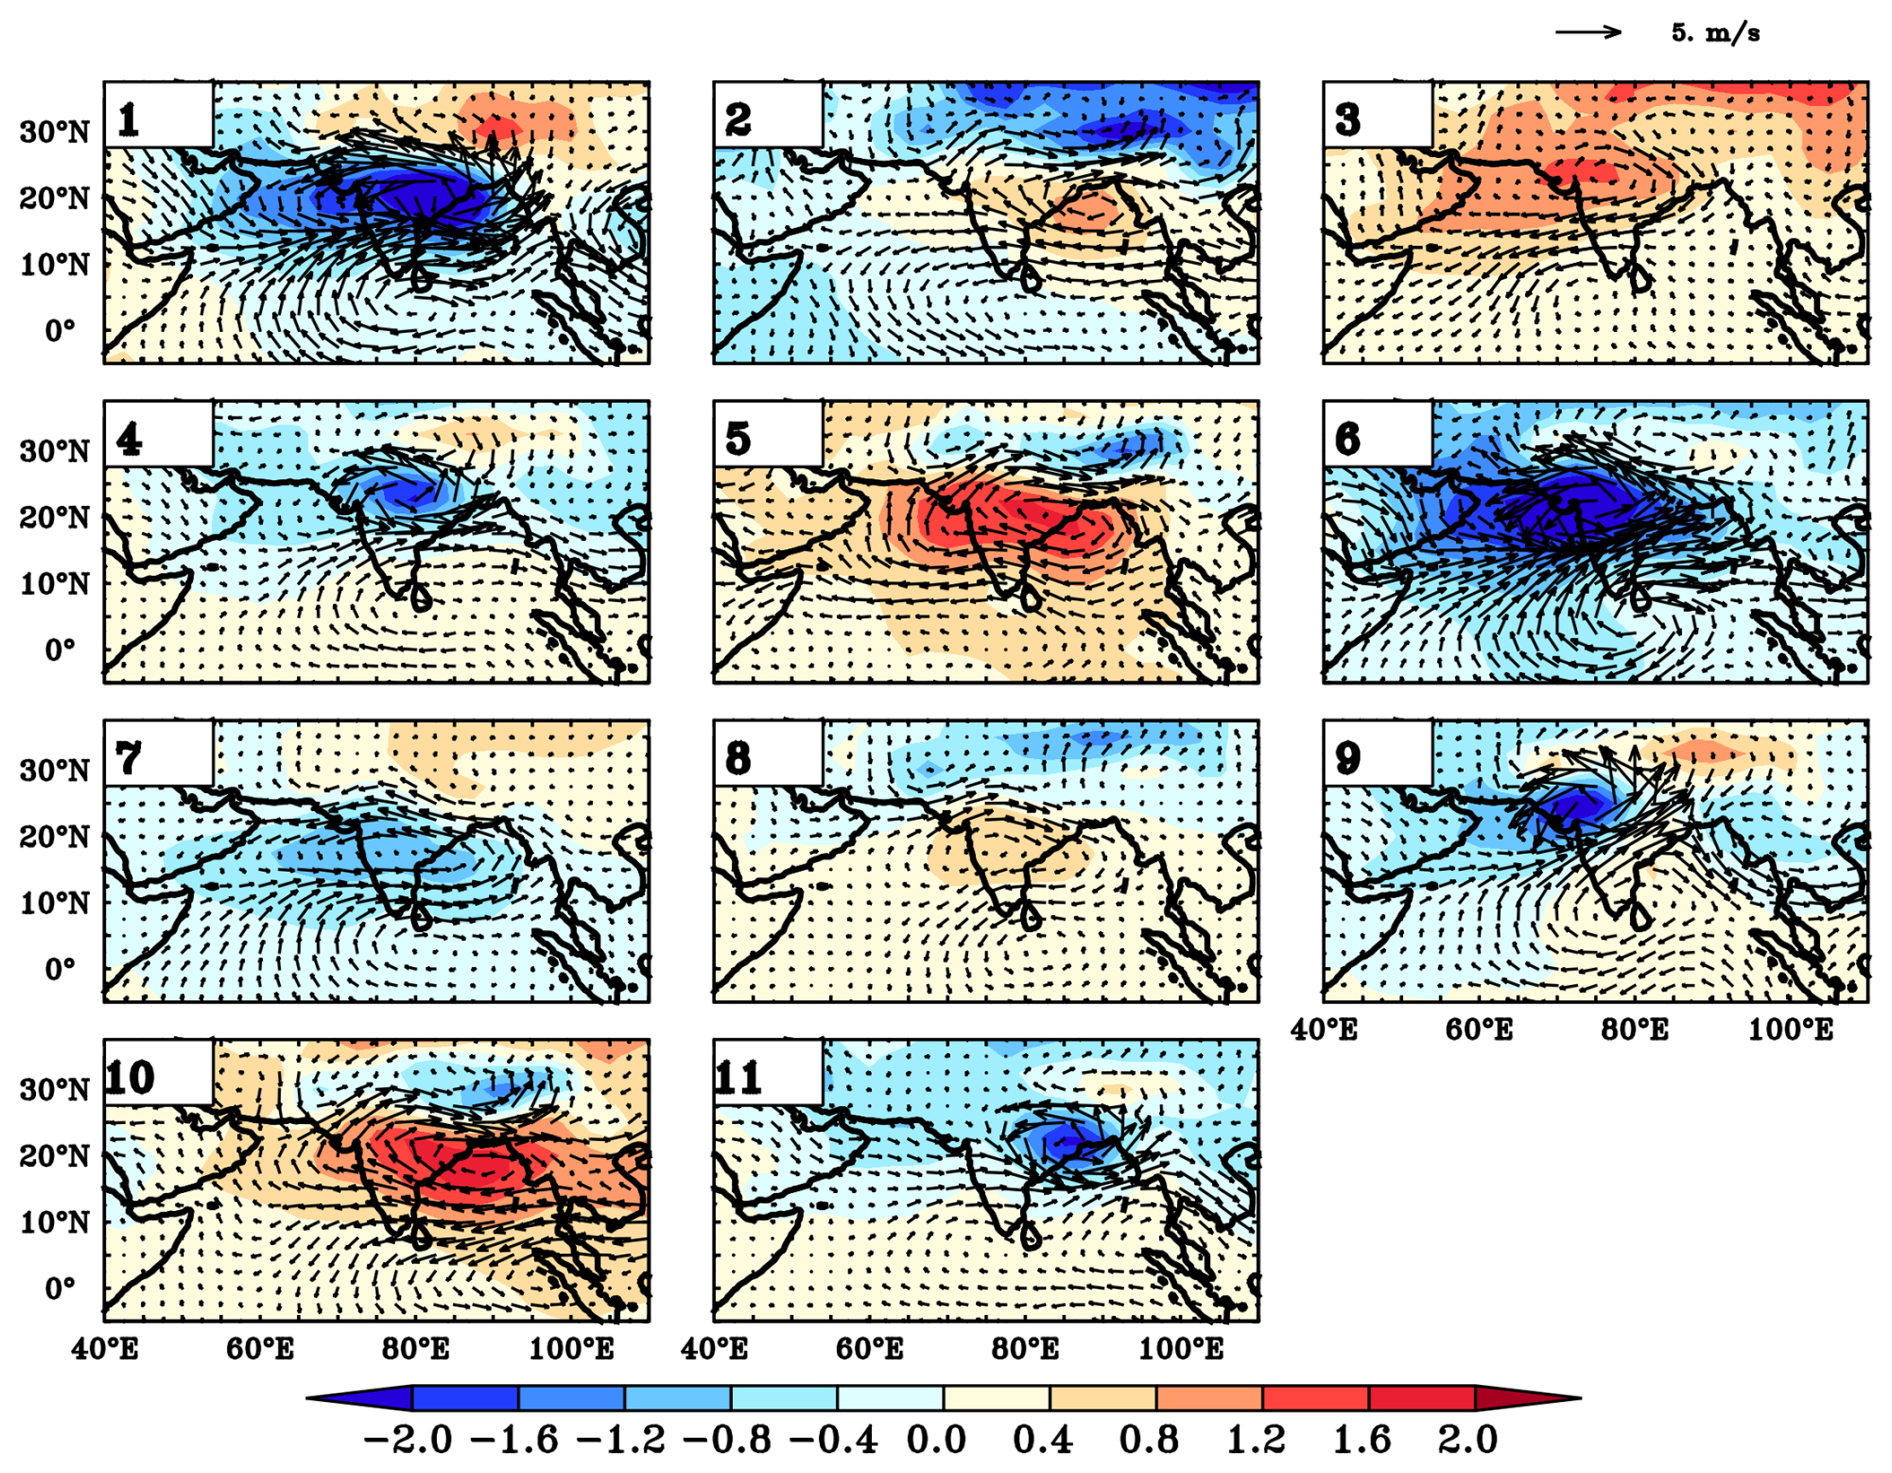
Figure 5Composites of mean sea pressure anomalies (shaded) overlaid with 850 mbar wind anomalies (vectors) for 11 clusters over larger region using the methodology described in the Sect. 2.
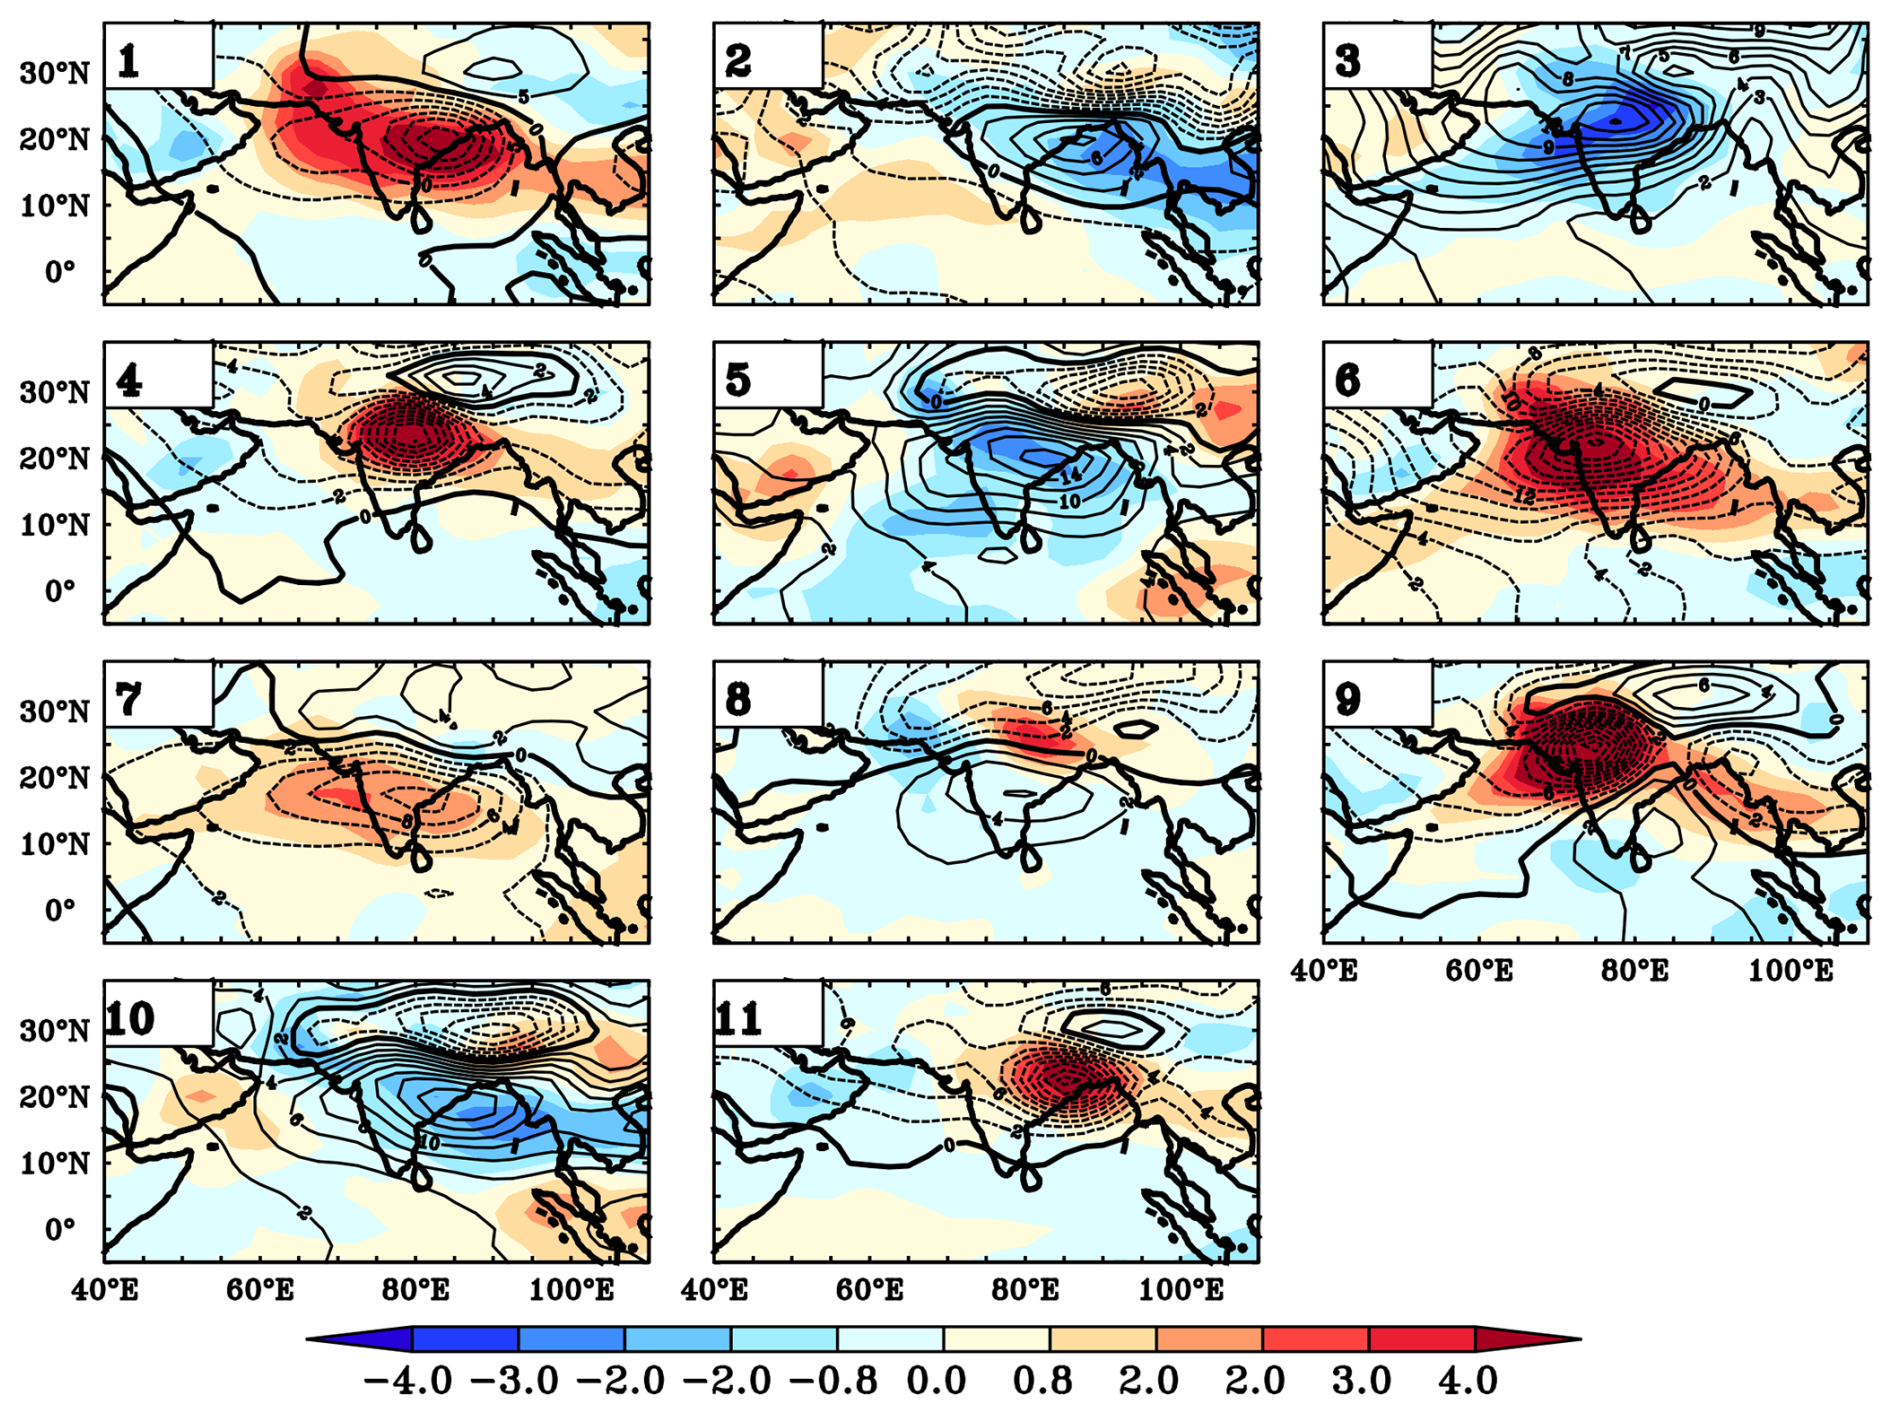
Figure 6Composites of geopotential height anomalies (shaded) (850 mbar) overlaid with precipitable water (contours) for each of the clusters.
3.3 Cluster Transition Dynamics
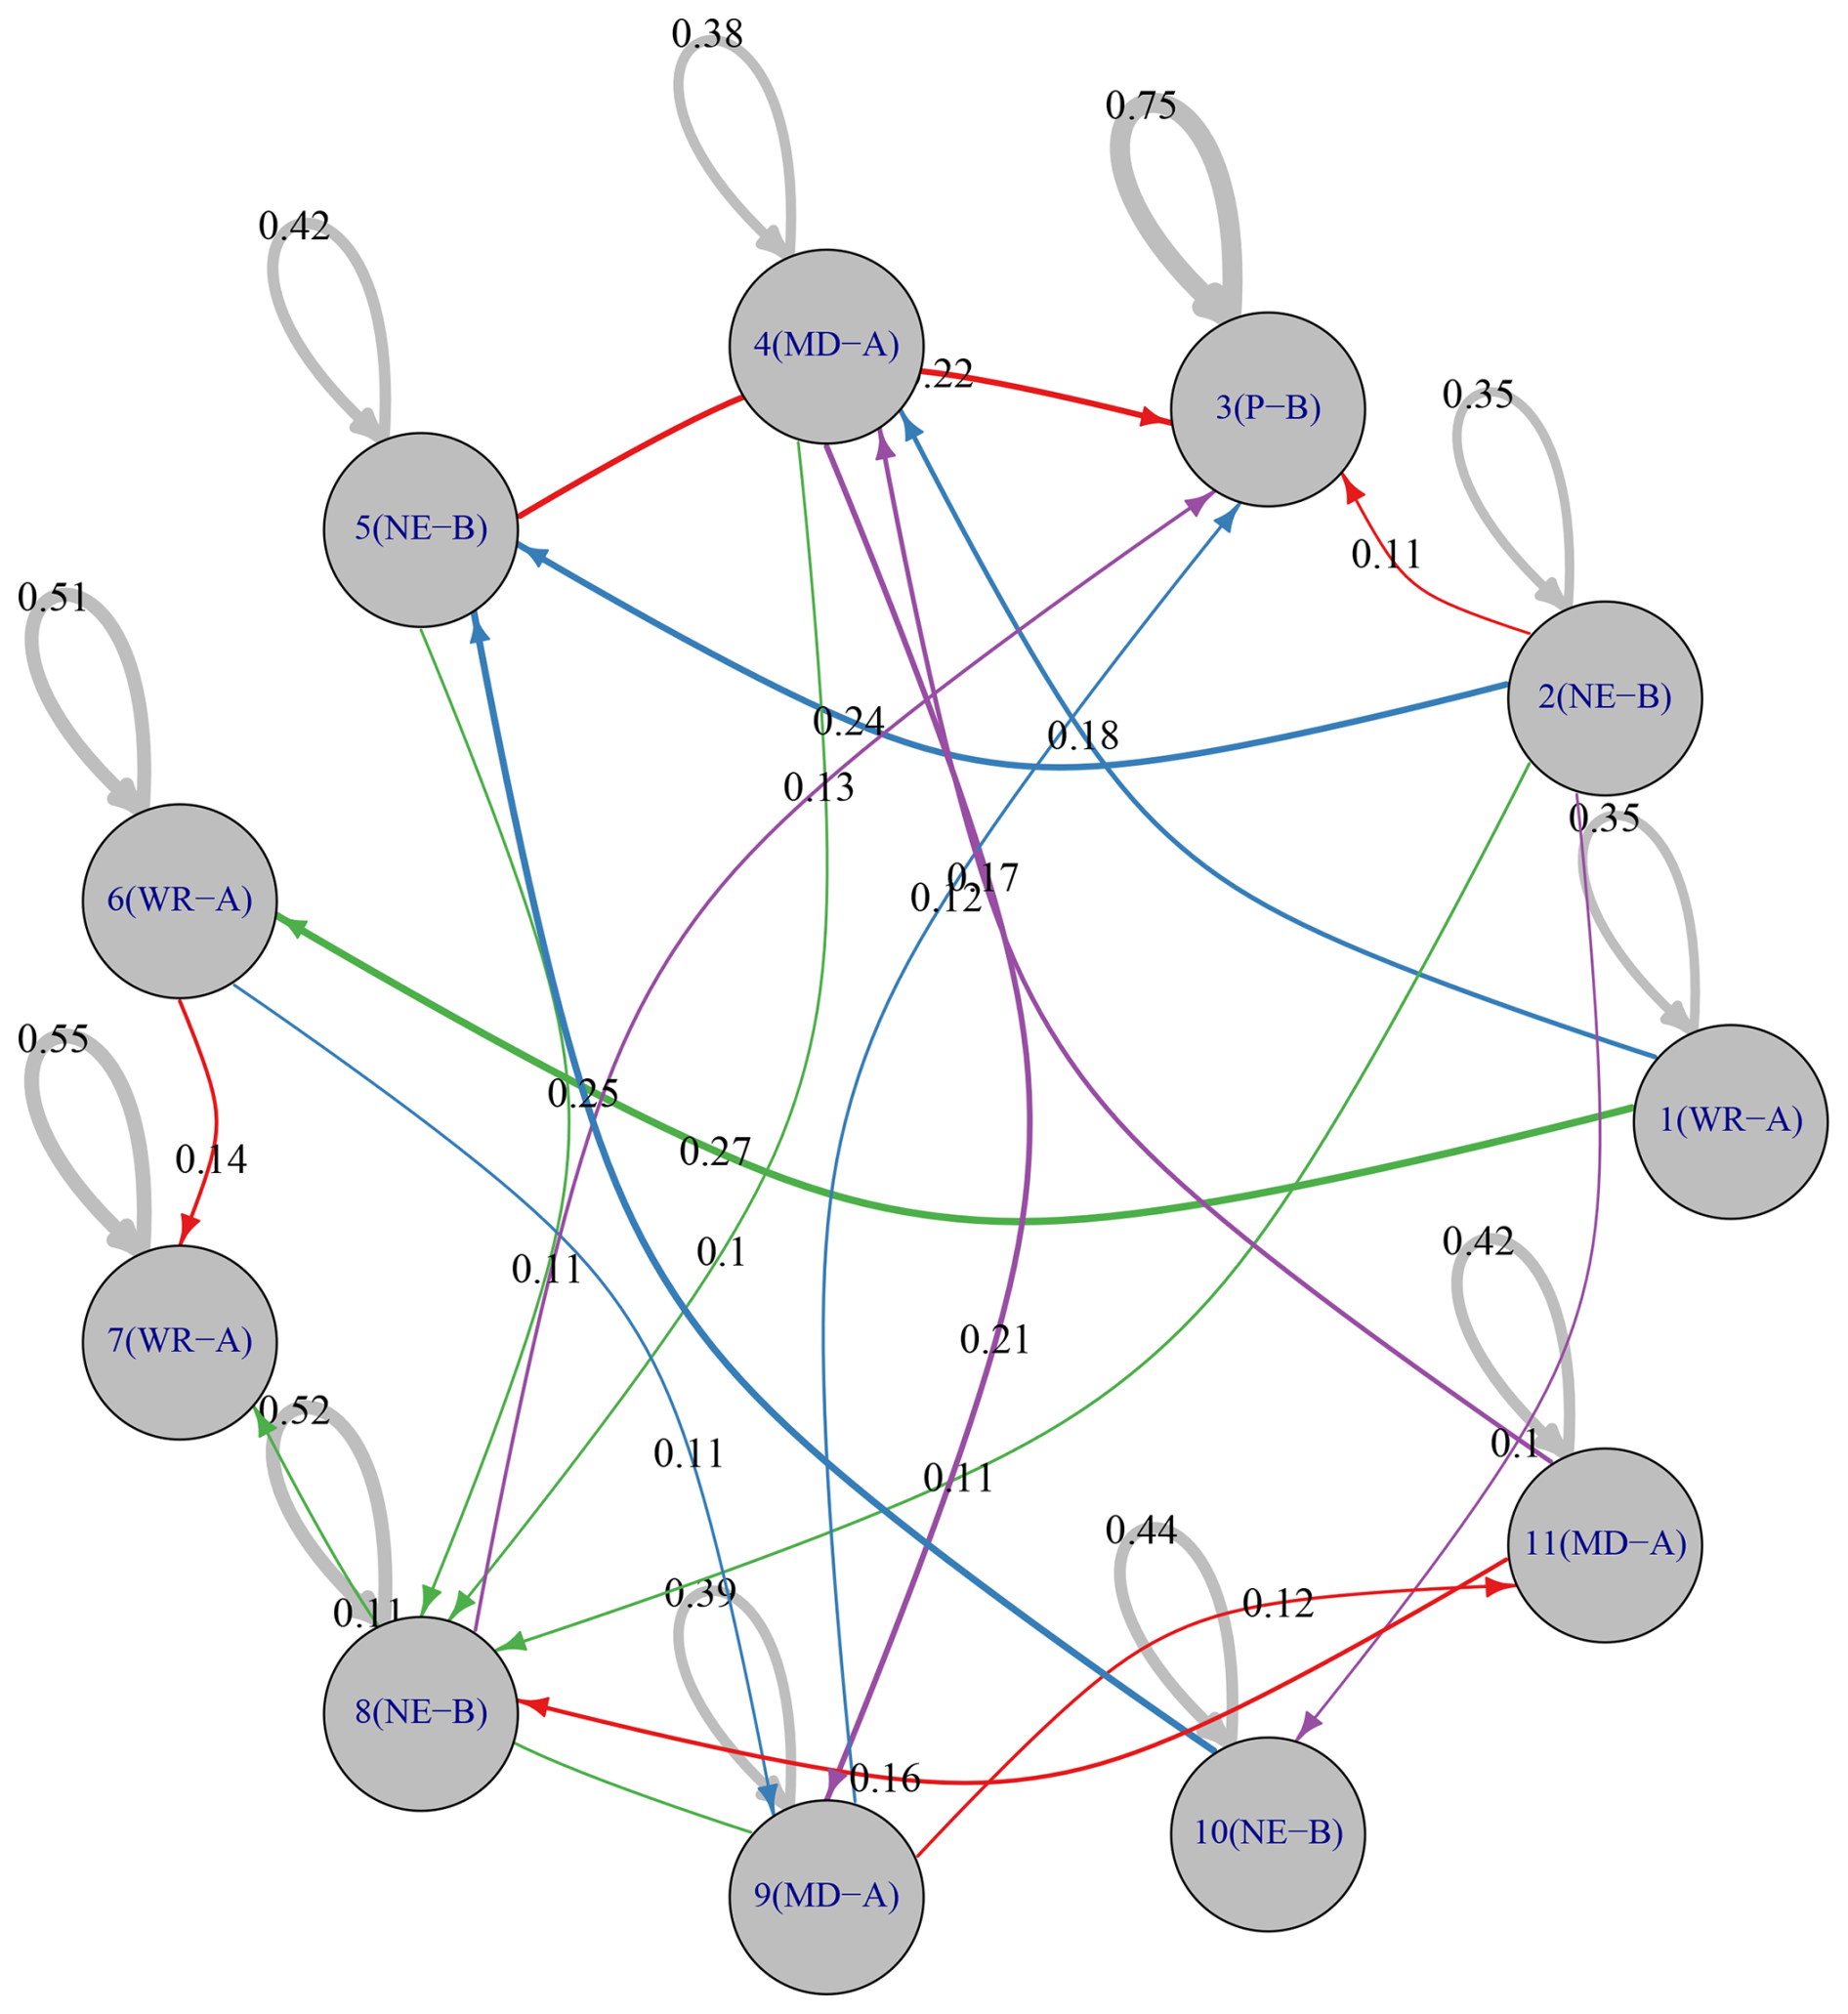
Transitions from one cluster to another on day-to-day basis with probability Pij>0.1 are shown in the Fig. 7, while transition probabilities of all clusters are provided in Table 1. A high Pii on the diagonal indicates day-to-day persistence of the clusters, whereas off-diagonal high values indicate transitions. The most prominent feature is the strong persistence (high self-transition probability Pii) of Cluster 3, the prolonged break monsoon state. Table 1 shows P33≈0.746, meaning that nearly 75 % of the time, a break-monsoon day is followed by another break-monsoon day. This aligns with the well-known tendency for breaks to last several days to weeks (Raghavan, 1973). In contrast, the active monsoon clusters with monsoon depression (Clusters 4, 9, 11), are less persistent with Pii≈0.4, indicating that active conditions tend to continue, but with less persistence than the breaks. Cluster 1 (extremely widespread rain) has a notably lower persistence (P11≈0.35), which is reasonable since such intense widespread rainfall is usually a transient peak of an active spell and often transitions to a slightly weaker state afterward (e.g., Cluster 6 or 7). The high persistence of Cluster 6 (P66≈0.514) is interesting because Cluster 6 represents an active state focused on the western India (including Thar/Kutch and West Coast), which might be linked to mid-level vortex circulations that can linger quasi-stationarily over the Arabian Sea/western India, producing several consecutive days of rainfall there.
Table 1Transition probability matrix of Indian summer monsoon rainfall clusters. Significant transitions (P ≥ 0.1) shown in Fig. 7 are emphasized with bold notations.
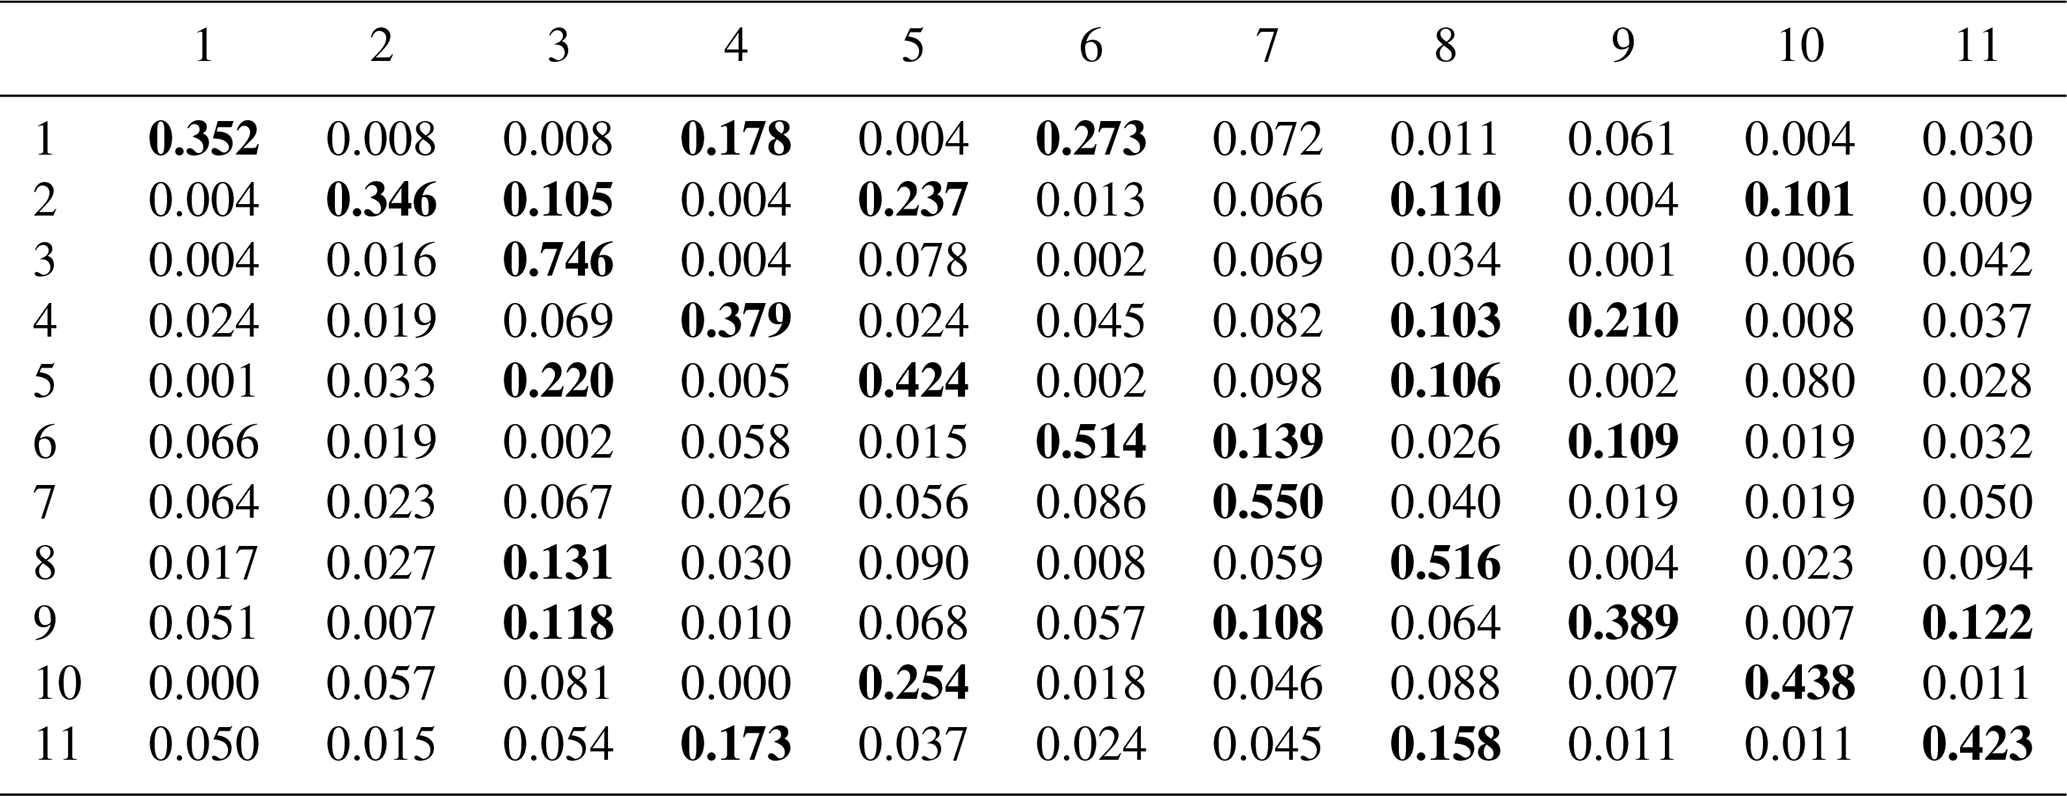
Break clusters (2, 5, 8, 10) generally have a tendency to transition to other break-type clusters or to the prolonged break Cluster 3. For example, Cluster 2 and 10 (both NE-focused break) frequently transitions to Cluster 5 (another NE-Break clusters) (with high probability around 0.24) and Cluster 2 also has transition probability of > 0.1 % to go to Cluster 3, 8 and 10 (see Table 1). Similarly, Cluster 8 (which has rainfall in central India but with break-like circulation) often transitions to Cluster 3 (with P83=0.131). These indicate that once the monsoon enters a weak phase, it often oscillates among the break-type patterns (with rainfall shifting between NE India and perhaps the foothills) before eventually either recovering to an active state or intensifying to a different pattern. Conversely, transitions from break clusters directly to strong active clusters are rare (typically P<0.05 for break to active transitions in Table 1). This suggests that the onset of an active spell usually is not a sudden jump from a full break to a full active; rather, the monsoon goes through intermediate steps.
Cluster 8 appears to act as intermediate state. It features moderate rainfall over the northern Gangetic plains and NE India, with break-like circulation anomalies. Cluster 8 has a relatively high probability of transitioning to Cluster 3 (break, P83=0.131) but also a moderate chance to transition to Cluster 4 (P84=0.03) and Cluster 11 (). Cluster 4 and 11 are active depression clusters. This suggests that Cluster 8 could be a transient phase that can either lapse back into a full break (Cluster 3) or, if a Bay depression forms, transition to an active state (Cluster 11). In other words, Cluster 8 might correspond to conditions when the monsoon trough is re-forming southward from the foothills but before a robust depression or widespread rain kicks in – a phase that can swing either way.
Another cluster that shows interesting transition behavior is Cluster 9 (northwest-focused active). It has a significant probability to transition to Cluster 3 (), meaning after a rain event in the northwest (often due to a mid-level cyclone or dying depression), the monsoon likely goes into a break. Cluster 9 also transitions with significant probability to Cluster 11 () and Cluster 4 (), which implies that a new depression might form in the Bay (Cluster 11) or a continuing active phase persists (Cluster 4) even after a northwest rain event. But the transition to break is more common, consistent with the idea that once a system travels across to NW India and rains out, there is a lull before the next system forms.
The clusters associated with monsoon depressions (11 to 4 to 9) show a logical temporal sequence. Cluster 11 (depression over Bay/east India) often transitions to Cluster 4 (depression moved inland; ) and to Cluster 8 (minor break conditions in between; ). Cluster 4 then has a high chance to transition to Cluster 9 (), reflecting the westward movement of the system. Cluster 9, as mentioned, can go to break phase (Cluster 3). Thus, a common evolution is, formation of a depression over Bay of Bengal region (Cluster 11) and rains over central India (Cluster 4), moves to northwestern region along the monsoon trough (Cluster 9) and likely transition in to monsoon break (Cluster 3) or a new depression is formed in the Bay (Cluster 11). Such a sequence corresponds well to observed behavior that active monsoon spells are terminated by a westward-moving depression that ends up producing rain in normally dry areas and then the system dissipates leading to a break (Krishnan et al., 2000). Sometimes multiple depressions come in succession without a break, which could be seen as Cluster 11 transitioning to another active cluster rather than to break.
Cluster 7 (widespread moderate active) shows a strong self-transition (55 %), but it also can transition to Cluster 1 (extensive heavy rain; ) or to Cluster 6 (west-heavy rain; ). Cluster 1 in turn often transitions back to Cluster 6 or 7 (, ) rather than sustaining itself. These interactions imply that during an active monsoon, the spatial focus of rainfall shifts on a daily basis from extremely widespread rain (Cluster 1), more rain on the west (Cluster 6) or settle to a moderate widespread rain (Cluster 7), but staying within active regimes. Direct transitions from these active clusters to break (Cluster 3) are low probability (around 0.002 to 0.069), meaning active spells usually decay gradually (perhaps via cluster 8 or via a depression moving out).
Within the break clusters, there is a significant transitioning except for Cluster 3 (prolonged break). For example, Cluster 2 (NE heavy rain break) can go to Cluster 5 or 10 (other NE rain variants) with notable probabilities, as well as to Cluster 8 (which has some central India rain) with . Cluster 5 (NE focus) transitions to Cluster 8 and 10 quite often. So, even during an overall break spell (with trough at foothills), the exact distribution of rainfall can oscillate among NE India, the Himalayas, and maybe a weak low in central India that briefly brings some rain there (Cluster 8). These transitions likely correspond to Intraseasonal oscillation related to westward propagating sub-seasonal modes (such as Suhas et al., 2013).
3.4 Seasonality of Clusters and Long-Term Changes
Figure 8 shows (June–September) rainfall contributions of each cluster to total monthly rainfall for Thar & Kutch (T&K), Indo-Gangetic Plains (IGP), and Northeast India (NEI) regions as shown in the Fig. 3. For each region and month, the plotted contribution of a cluster is the sum of daily rainfall over all days assigned to that cluster, expressed as a percentage of the JJAS total rainfall of that region.
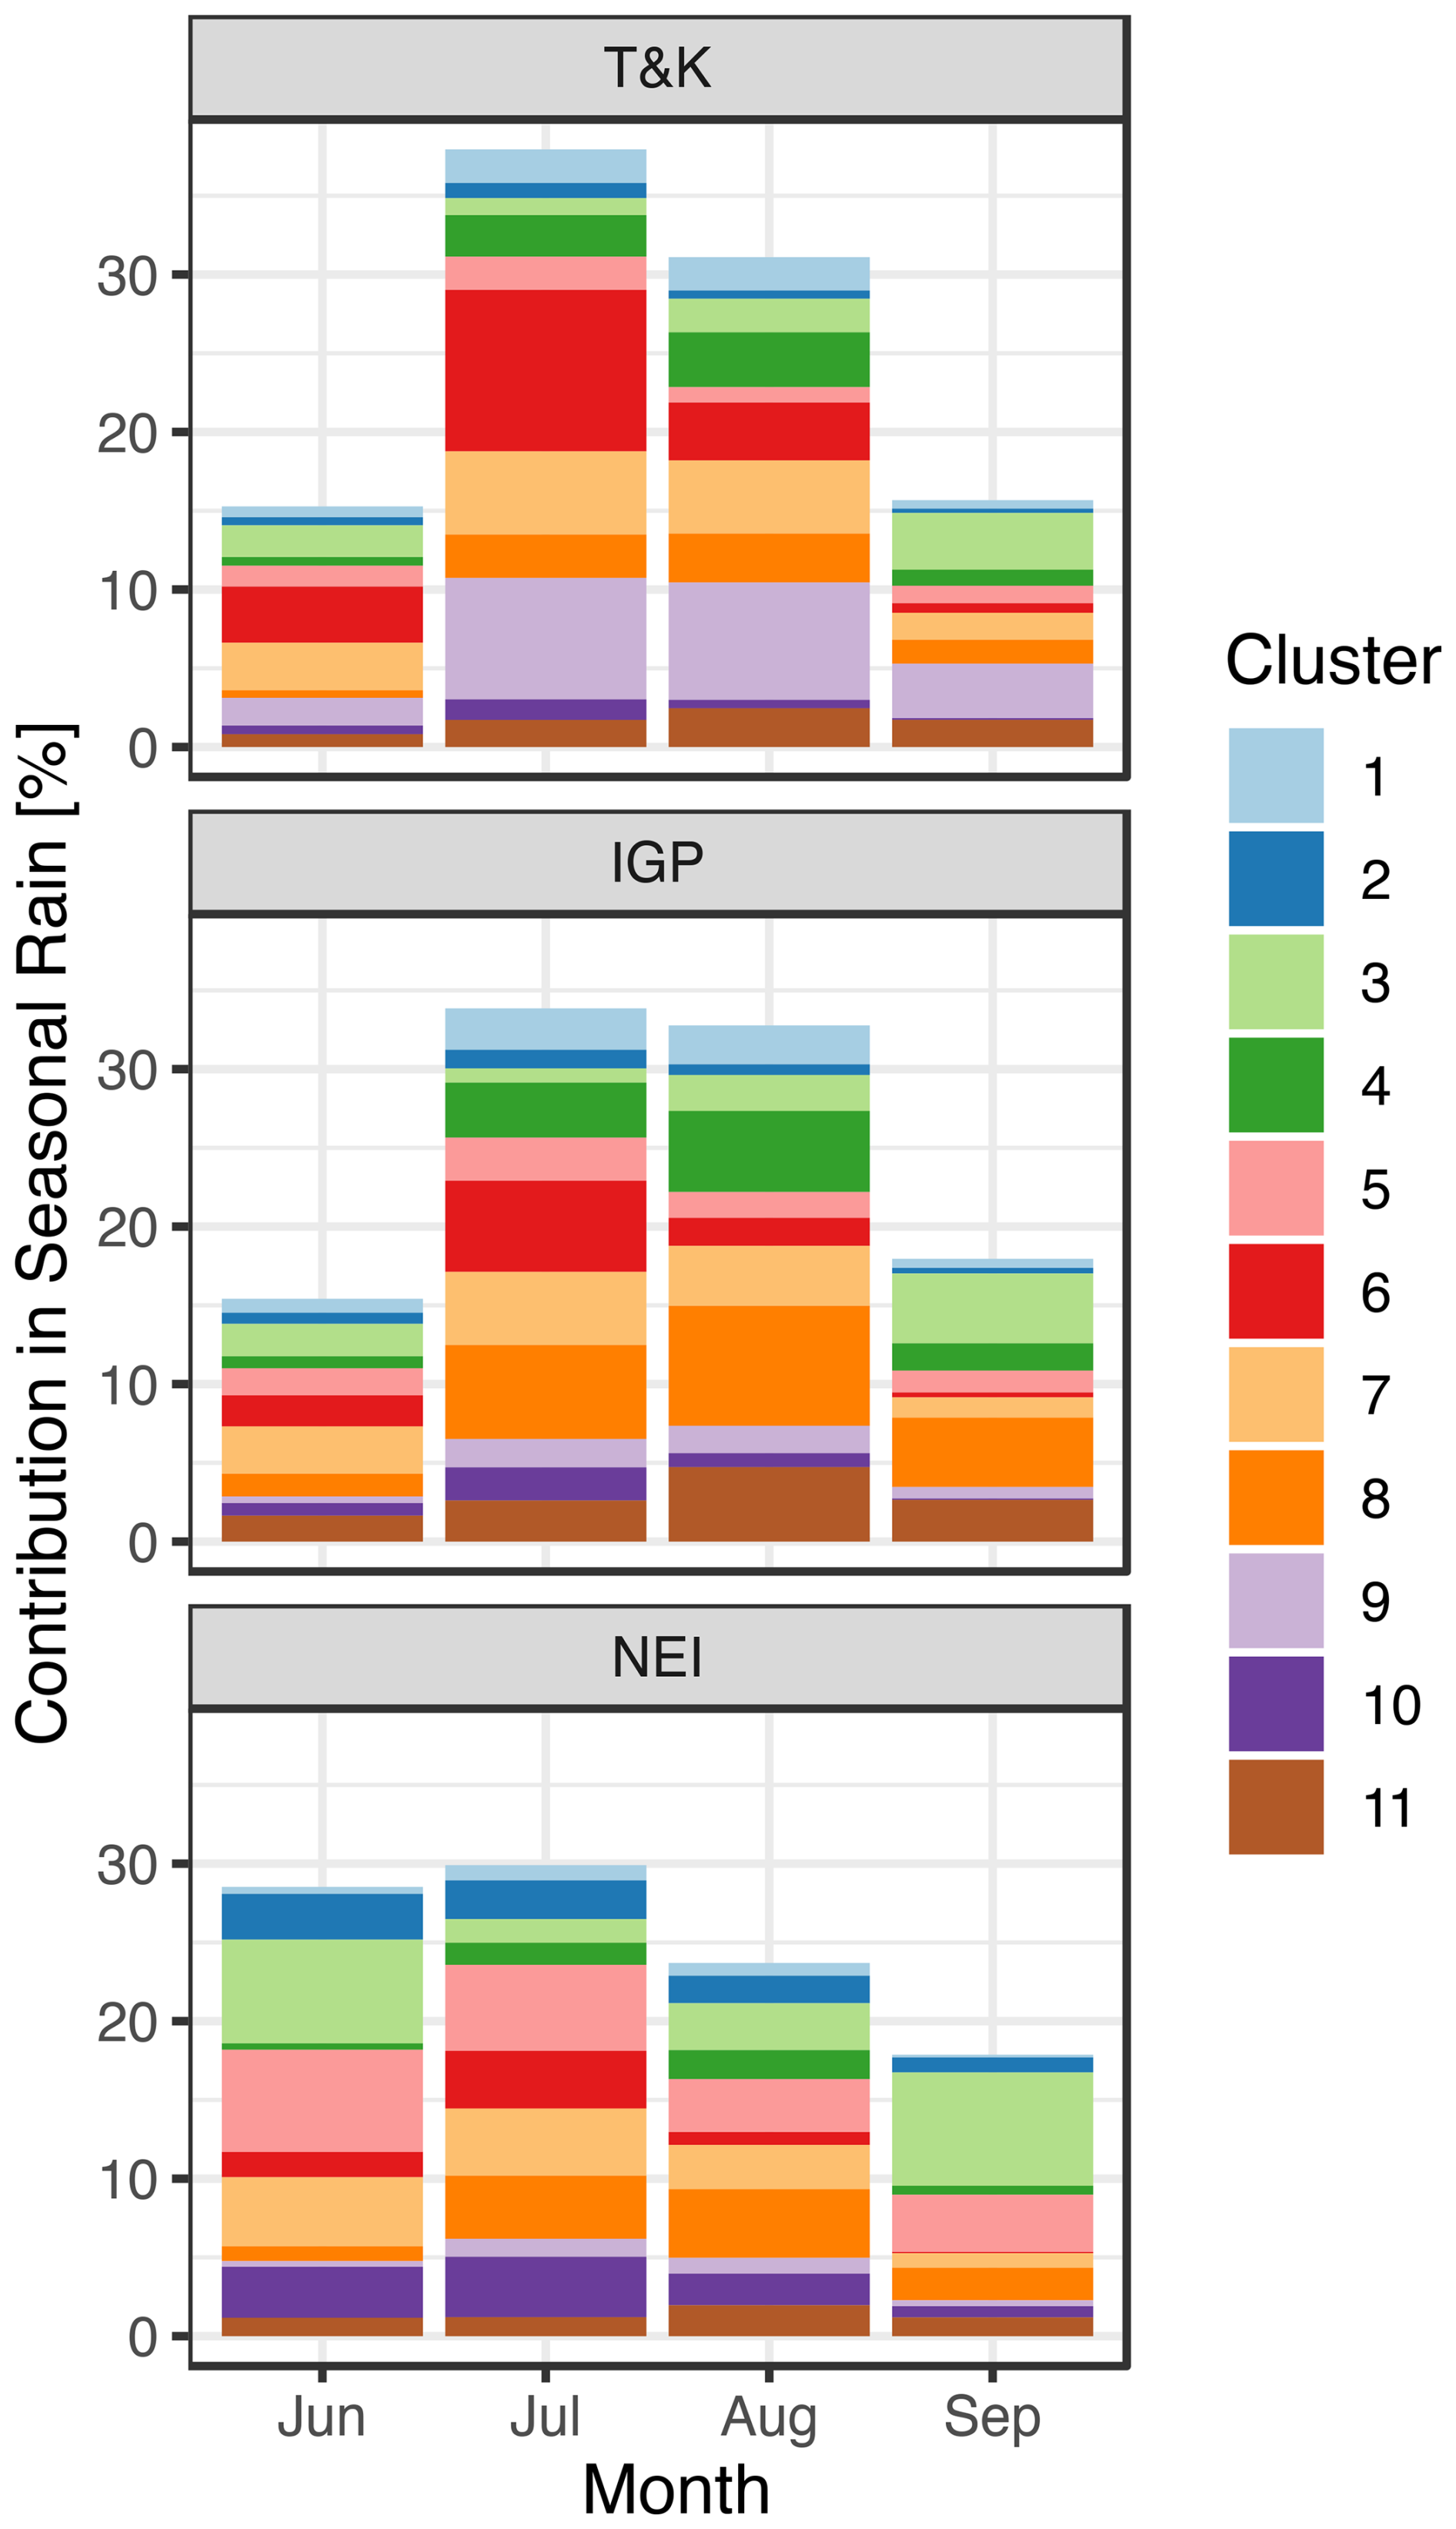
Figure 8The monthly contributions of each cluster (stacked color strips) and total (total height of the bars) are shown as percentages of seasonal rainfall in T&K, IGP, and NEI regions.
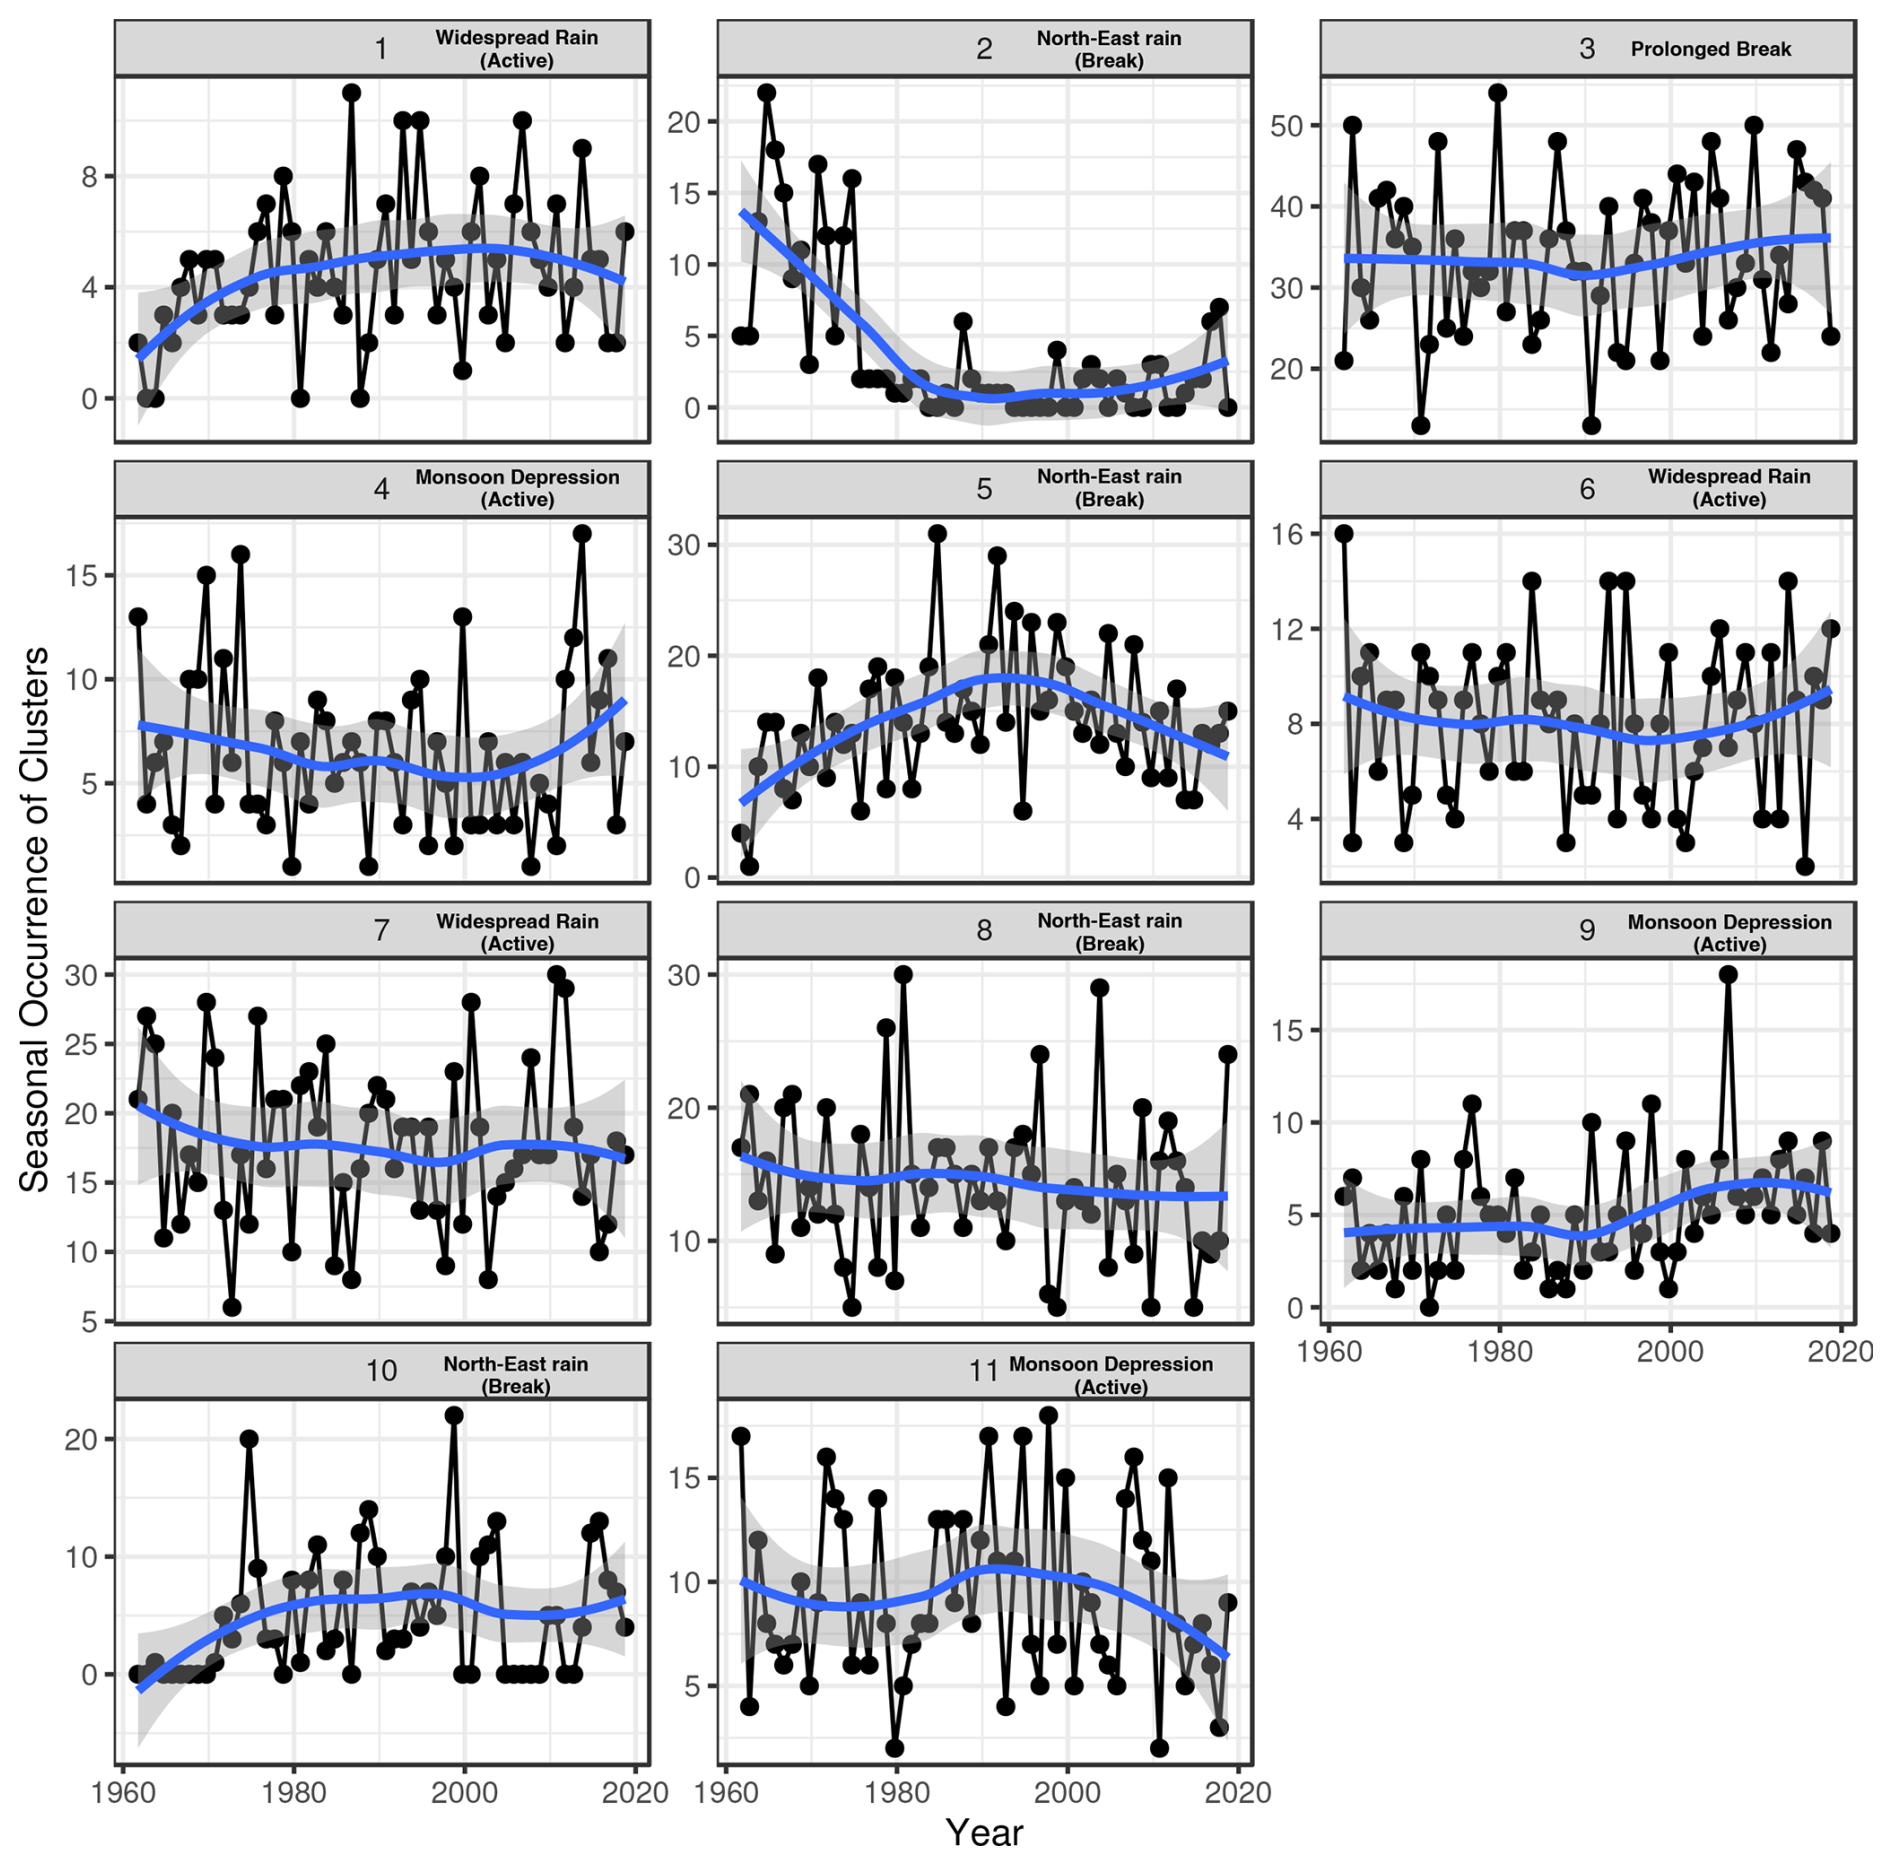
Figure 9Seasonal frequency of occurrence of clusters from 1961 to 2018. The blue line shows smoothed data obtained using locally weighted smoothing (LOESS). Rapid decline in rainfall for NEI clusters 2 and 5 is evident.
In T&K, most seasonal rainfall occurs in July–August, dominated by Cluster 6 and 9; Cluster 6 alone exceeds 30 %. June and September have higher shares of Cluster 3 (break phase), consistent with shorter active spells during the onset and withdrawal phase. In the IGP, contributions are more evenly distributed among active clusters, with Cluster 1 and 7 prominent in July–August; Clusters 2 and 8 contribute moderate rainfall over the foothill regions even during break-like phases. NEI receives substantial rainfall during break-phase, with Clusters 2, 5, and 10 contributing large early-season fractions; active clusters (1, 4, 7) add mid-season rainfall, but break clusters remain important.
Figure 9 presents trends in JJAS cluster-frequency for 1961–2018. Cluster 3 (break conditions) shows statistically non-significant upward tendency, which indicates a weak (non significant) increase in the frequency of prolonged break phase. Clusters 2 and 5 (NEI rainfall during breaks) display a pronounced decline, with Cluster 2 virtually absent after 1975. This indicates a general decrease in the rainfall over NEI especially as contributed by clusters 2 and 5. This is consistent with the observed Northeast India drying (such as Zahan et al., 2021; Jain et al., 2013; Dhara et al., 2025). Cluster 8 (intermediate rainfall) remains relatively stable, whereas Clusters 4 and 9 (monsoon depressions) show modest increase after 2000. This also is consistent with the increase in rainfall over T&K region (Dhara et al., 2025). Cluster 6 is stable to slightly rising in recent years indicating an increase in rainfall over Western Ghats, central Indian region as well. Cluster 1 shows an increasing trend before 1980 but stabilizes thereafter. Cluster 9 is too infrequent for robust detection though it may have increased. Figure 9 along with Figs. 4 and 5 shows the changing patterns of rainfall through changes in the frequencies of individual clusters.
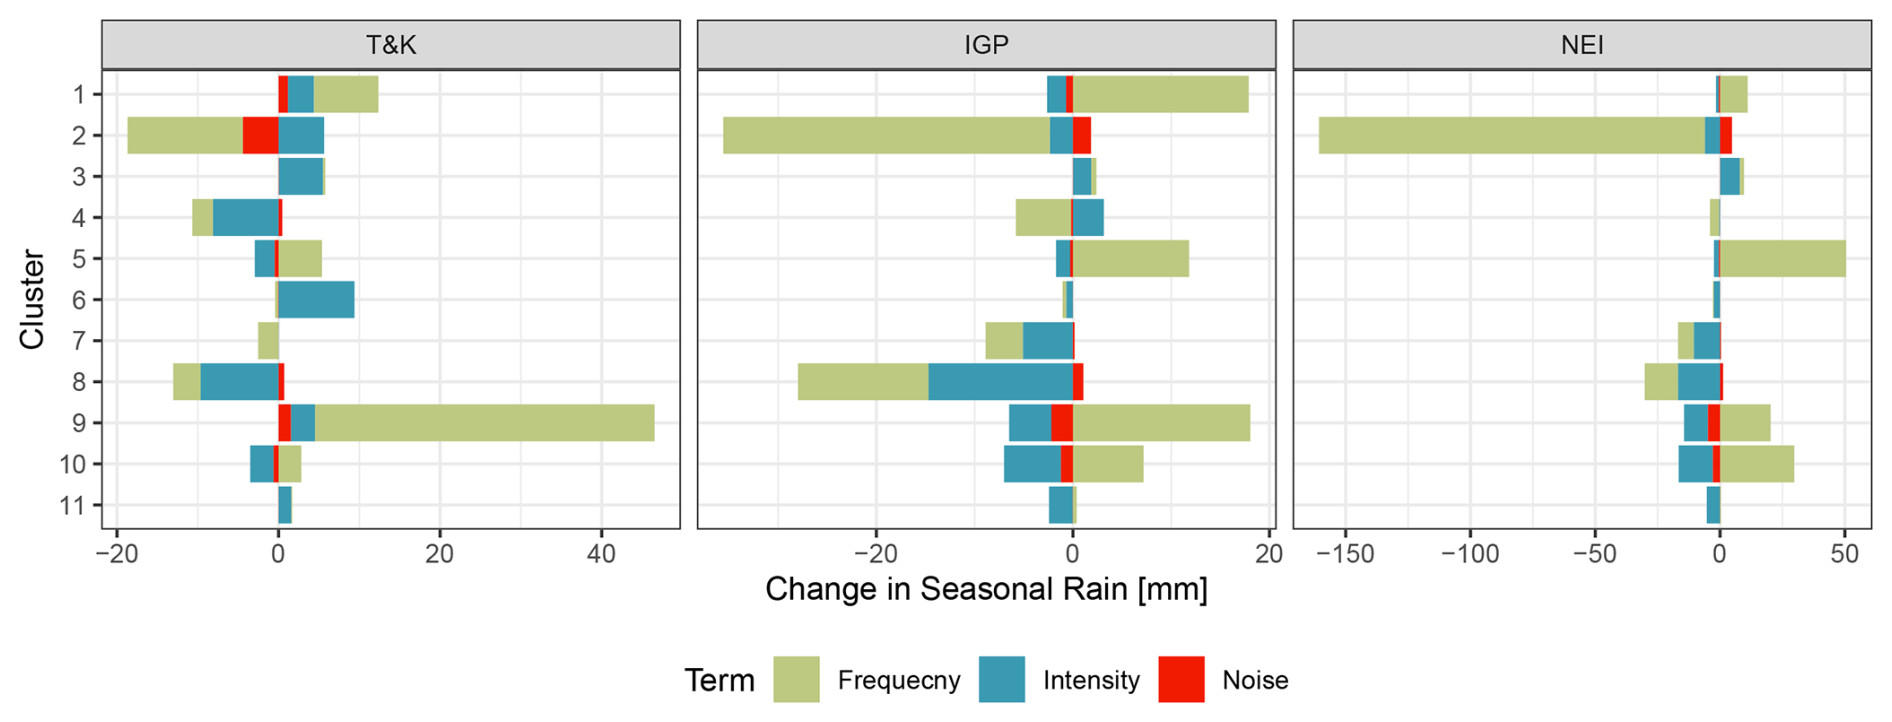
Figure 10Contribution of cluster frequency and intensity components to the total change in seasonal rainfall between 1961–1989 and 1990–2018 over the T&K, IGP, and NEI regions, computed using Eq. (3). The smaller residual (“noise”) term shows second-order variations, showing the significance of frequency and intensity terms in the total change.
Figure 10 additionally quantifies regional rainfall changes between 1961–1989 (R1) and 1990–2018 (R2) in terms of intensity and frequency contributions (computed in Sect. 2.6) and links them with the long-term cluster trends in Fig. 9. It is important to note that Fig. 8 shows the contribution of clusters in total monthly rainfall while Fig. 10 shows the contribution of individual clusters to total change in rainfall. Thus, the cluster that contributes maximum rainfall over a particular region may not be the one that changed the most. In T&K, the ∼ +30 mm (+15 %) increase arises mainly from Cluster 9 frequency gains (+40 mm) together with slight intensity increases, and a ∼ +10 mm contribution from Cluster 6 intensity rise. The cluster 2 on the other hand shows 20 mm decline due to frequency reduction. This is consistent with the gradual post-1990 increase of Cluster 6 and 9 frequencies visible in Fig. 9. Over the IGP, rainfall decreases by ∼ 50 mm (−7 %), driven equally by reduction in frequency and intensity of Cluster 8 (−25 mm) and Cluster 2 frequency reduction (−15 mm). These declines match the downward trend of Cluster 2 frequency and the relatively stagnant or declining Cluster 8 frequency in Fig. 9. However, increased occurrences of Clusters 1, 5, 9 and 10 are adding rainfall to the total seasonal rainfall. CMIP5 and CMIP6 projections similarly indicate increasing monsoon rainfall over this region, a signal already evident in the observed cluster changes (Kulkarni et al., 2020).
The ∼ 150 mm (−9 %) rainfall decline over NEI is driven by the largest reduction in Cluster 2 frequency. In addition, cluster 8 shows reduction in both intensity and frequency. Although clusters 5, 9 and 10 show frequency increases comparable in magnitude to the Cluster 2 loss, the cluster 5 has increasing trend in the frequency before 1990 and declining since then which this decomposition analysis (Eq. 3) is not able to capture. In addition clusters 9 and 10 contribution is offset by intensity reductions across Clusters 7–11 (7, 8, 9, 10 and 11), yielding a net deficit. This highlights a shift in NEI focused rainfall during Cluster 2 and 5 break-season mode to other mix clusters and monsoon depressions.
This study presents a diagnostic framework associating unsupervised rainfall clusters with composite synoptic-scale anomaly patterns and long-term trends of the Indian Summer Monsoon (ISM). By combining IMD high-resolution rainfall data with NCEP–NCAR reanalysis fields, eleven distinct rainfall regimes were objectively identified and associated with low-level circulation, sea-level pressure, and moisture anomalies to reveal clear separation between active and break phases, quantified regime transitions, and attribute regional rainfall trends to changes in frequency and intensity of specific clusters.
Over T&K, increased rainfall since 1990 is associated mainly with increased occurrence of northwest-focused active regimes (Clusters 6 and 9), whose composite anomalies indicate enhanced cyclonic circulation and moisture transport into western India. In contrast, Indo-Gangetic Plains (IGP) and Northeast India (NEI) experienced significant drying, driven by decreased frequency and weaker intensity of break-phase clusters embedded within the monsoon trough (especially Cluster 2) and more persistent dry-break regimes (Cluster 3). The cluster transition analysis confirms that break spells are highly persistent while monsoon depressions are more transient, evolving systematically from formation over the Bay (Cluster 11) to inland propagation (Cluster 4) and decay over northwest India (Cluster 9). These dynamics closely mirror observed synoptic life cycles and show that active spells typically decay gradually via intermediate states rather than abrupt shifts to break conditions.
Seasonality analysis highlights that T&K rainfall peaks in July–August due to active-phase clusters, while NEI rainfall has historically been dominated by break-phase clusters, which have declined sharply after the late 1970s (Jain et al., 2013). The decomposition of rainfall change between 1961–1989 and 1990–2018 shows that NEI drying (∼ 150 mm or −9 %) stems from decrease of Cluster 2 frequency and reduced intensities across several active clusters, whereas IGP drying (∼ 50 mm or −7 %) reflects fewer intermediate active regimes and weaker break-phase rainfall. Conversely, T&K rainfall increase (∼ +15 %) arises from more frequent northwest-focused active systems. These findings suggest that regional monsoon rainfall changes cannot be explained solely by large-scale weakening of the mean monsoon flow (Turner and Annamalai, 2012), but rather by the modulation of synoptic regimes and their transitions.
This study demonstrates that regime-based analysis provides a powerful diagnostic tool to evaluate changes in synoptic systems, model simulations, and understand intraseasonal-to-decadal variability. Future work should focus on high-resolution modeling to resolve trough displacement, vortex dynamics, and orographic–flow interactions that govern cluster evolution. The presented cluster dataset (Raut, 2026) offers a benchmark for investigating teleconnections (ENSO, IOD, MJO) and assessing model biases in reproducing ISM rainfall regimes and their transitions.
The cluster data produced in this study and code utilized in the analysis can be accessed at https://doi.org/10.5281/zenodo.20099064 (Raut, 2026).
India Meteorological Department (IMD) binary rainfall files and Grid Analysis and Display System (GrADS) control files were acquired from the India Meteorological Department, Pune, available at https://www.imdpune.gov.in/cmpg/Griddata/Rainfall_25_Bin.html (last access: 27 June 2026). National Centers for Environmental Prediction (NCEP) and National Center for Atmospheric Research (NCAR) reanalysis-1 data were obtained from the Physical Sciences Laboratory of the National Oceanic and Atmospheric Administration (NOAA), accessible at https://psl.noaa.gov/data/gridded/data.ncep.reanalysis.html (last access: 27 June 2026).
BR and AD contributed to the writing, editing and revision of the paper. BR provided the original idea, leading the methodology design, conducting sensitivity tests, statistical analysis, and plotting. AD was responsible for analyzing synoptic data and plotting key figures. SW, SI and DK handled data procurement and curation. DK and PN conducted initial analysis under the guidance of AD and BR. PS and PK provided general advice and guidance.
The contact author has declared that none of the authors has any competing interests.
This work was not part of any institutional or externally sponsored project, and was completed in authors' personal time. Bhupendra Raut's work at Argonne National Laboratory is based on work supported by the U.S. Department of Energy under contract DE-AC02-06CH11357.
Publisher's note: Copernicus Publications remains neutral with regard to jurisdictional claims made in the text, published maps, institutional affiliations, or any other geographical representation in this paper. The authors bear the ultimate responsibility for providing appropriate place names. Views expressed in the text are those of the authors and do not necessarily reflect the views of the publisher.
The authors gratefully acknowledge the India Meteorological Department (IMD), Pune, for providing high-resolution daily rainfall data, and the NCEP–NCAR for the Reanalysis data. We sincerely thank the editors and the journal for kindly waiving the publication fees for this work. We also acknowledge the constructive comments by reviewers Adway Mitra, Nima Zafarmomen and two anonymous reviewers, which helped improve the clarity and robustness of the manuscript.
This paper was edited by Nili Harnik and reviewed by three anonymous referees.
Ananthakrishnan, R. and Soman, M.: The onset of the southwest monsoon over Kerala: 1901–1980, J. Climatol., 8, 283–296, 1988. a
Anderberg, M. R.: Cluster analysis for applications: Probability and mathematical statistics: A series of monographs and textbooks, vol. 19, Academic press, ISBN 9781483191393, 2014. a
Ashok, K., Guan, Z., and Yamagata, T.: Impact of the Indian Ocean dipole on the relationship between the Indian monsoon rainfall and ENSO, Geophys. Res. Lett., 28, 4499–4502, 2001. a
Ashok, K., Behera, S. K., Rao, S. A., Weng, H., and Yamagata, T.: El Niño Modoki and its possible teleconnection, J. Geophys. Res.-Oceans, 112, https://doi.org/10.1029/2006JC003798, 2007. a
Bajrang, C., Attada, R., and Goswami, B.: Possible factors for the recent changes in frequency of central Indian Summer Monsoon precipitation extremes during 2005–2020, npj Clim. Atmos. Sci., 6, 120, https://doi.org/10.1038/s41612-023-00450-y, 2023. a
Bamzai, A. S. and Shukla, J.: Relation between Eurasian snow cover, snow depth, and the Indian summer monsoon: An observational study, J. Climate, 12, 3117–3132, 1999. a
Bholowalia, P. and Kumar, A.: EBK-means: A clustering technique based on elbow method and k-means in WSN, Int. J. Comput. Appl., 105, https://www.ijcaonline.org/archives/volume105/number9/18405-9674/ (last access: 30 June 2026), 2014. a
Catto, J. L., Jakob, C., and Nicholls, N.: The influence of changes in synoptic regimes on north Australian wet season rainfall trends, J. Geophys. Res.-Atmos., 117, https://doi.org/10.1029/2012JD017472, 2012. a
Chakra, S., Ganguly, A., Oza, H., Padhya, V., Pandey, A., and Deshpande, R.: Multidecadal summer monsoon rainfall trend reversals in South Peninsular India: A new approach to examining long-term rainfall dataset, J. Hydrol., 624, 129975, https://doi.org/10.1016/j.jhydrol.2023.129975, 2023. a
Choudhury, A. D., Krishnan, R., Ramarao, M., Vellore, R., Singh, M., and Mapes, B.: A phenomenological paradigm for midtropospheric cyclogenesis in the Indian summer monsoon, J. Atmos. Sci., 75, 2931–2954, 2018. a
Cleveland, W. S.: Robust locally weighted regression and smoothing scatterplots, J. Am. Stat. Assoc., 74, 829–836, 1979. a
Deshpande, A., Chowdary, J., and Gnanaseelan, C.: Role of thermocline–SST coupling in the evolution of IOD events and their regional impacts, Clim. Dynam., 43, 163–174, 2014. a, b
Dey, A., Chattopadhyay, R., Joseph, S., Kaur, M., Mandal, R., Phani, R., Sahai, A., and Pattanaik, D.: The intraseasonal fluctuation of Indian summer monsoon rainfall and its relation with monsoon intraseasonal oscillation (MISO) and Madden Julian oscillation (MJO), Theor. Appl. Climatol., 148, 819–831, 2022. a
Dhara, C., Deshpande, A., Roxy, M. K., Dalpadado, P., and Shrestha, M. S.: A post-AR6 update on observed and projected climate change in India, PLOS Climate, 4, e0000724, https://doi.org/10.1371/journal.pclm.0000724, 2025. a, b, c, d, e
Duncan, J. A., Dash, J., and Atkinson, P. M.: Analysing temporal trends in the Indian Summer Monsoon and its variability at a fine spatial resolution, Climatic Change, 117, 119–131, 2013. a
Falga, R. and Wang, C.: The rise of Indian summer monsoon precipitation extremes and its correlation with long-term changes of climate and anthropogenic factors, Sci. Rep., 12, 11985, https://doi.org/10.1038/s41598-022-16240-0, 2022. a
Gadgil, S.: Orographic effects on the southwest monsoon: A review, Pure Appl. Geophys., 115, 1413–1430, 1977. a
Gadgil, S.: The Indian monsoon and its variability, Annu. Rev. Earth Pl. Sc., 31, 429–467, 2003. a
Gadgil, S. and Gadgil, S.: The Indian monsoon, GDP and agriculture, Econ. Polit. Weekly, 4887–4895, https://www.jstor.org/stable/4418949 (last access: 30 June 2026), 2006. a
Ghosh, S., Das, D., Kao, S.-C., and Ganguly, A. R.: Lack of uniform trends but increasing spatial variability in observed Indian rainfall extremes, Nat. Clim. Change, 2, 86–91, 2012. a
Gong, D.-Y., Wang, S.-W., and Zhu, J.-H.: East Asian winter monsoon and Arctic oscillation, Geophys. Res. Lett., 28, 2073–2076, 2001. a
Goswami, B. N. and Mohan, R. A.: Intraseasonal oscillations and interannual variability of the Indian summer monsoon, J. Climate, 14, 1180–1198, 2001. a
Goswami, B. N., Keshavamurty, R., and Satyan, V.: Role of barotropic, baroclinic and combined barotropic-baroclinic instability for the growth of monsoon depressions and mid-tropospheric cyclones, P. Indian A. S.-Earth, 89, 79–97, 1980. a
Goswami, B. N., Ajayamohan, R., Xavier, P. K., and Sengupta, D.: Clustering of synoptic activity by Indian summer monsoon intraseasonal oscillations, Geophys. Res. Lett., 30, https://doi.org/10.1029/2002GL016734, 2003. a
Goswami, B. N., Venugopal, V., Sengupta, D., Madhusoodanan, M., and Xavier, P. K.: Increasing trend of extreme rain events over India in a warming environment, Science, 314, 1442–1445, 2006. a, b
Hartigan, J. and Wong, M.: A K-means clustering algorithm., J. R. Stat. Soc. Ser. C Appl. Stat., 28, 100–108, 1979. a
Held, I. M. and Soden, B. J.: Robust responses of the hydrological cycle to global warming, J. Climate, 19, 5686–5699, 2006. a
Hunt, K. M. and Fletcher, J. K.: The relationship between Indian monsoon rainfall and low-pressure systems, Clim. Dynam., 53, 1859–1871, 2019. a
Ihara, C., Kushnir, Y., Cane, M. A., and De La Peña, V. H.: Indian summer monsoon rainfall and its link with ENSO and Indian Ocean climate indices, Int. J. Climatol., 27, 179–187, 2007. a
Jackson, R. C., Raut, B. A., Dematties, D., Collis, S. M., Ferrier, N., Beckman, P., Sankaran, R., Kim, Y., Park, S., Shahkarami, S., and Newsom, R.: ARMing the Edge: Designing Edge Computing-capable Machine Learning Algorithms to Target ARM Doppler Lidar Processing, Artificial Intelligence for the Earth Systems, American Meteorological Society, Vol. 2, 1–38, https://doi.org/10.1175/AIES-D-22-0062.1, 2023. a
Jain, S. K., Kumar, V., and Saharia, M.: Analysis of rainfall and temperature trends in northeast India, Int. J. Climatol., 33, 968–978, 2013. a, b, c
Kalnay, E., Kanamitsu, M., Kistler, R., Collins, W., Deaven, D., Gandin, L., Iredell, M., Saha, S., White, G., Woollen, J., Zhu, Y., Chelliah, M., Ebisuzaki, W., Higgins, W., Janowiak, J., Mo, K. C., Ropelewski, C., Wang, J., Leetmaa, A., Reynolds, R., Jenne, R., and Joseph, D.: The NCEP/NCAR 40-Year Reanalysis Project, B. Am. Meteorol. Soc., 77, 437–472, https://doi.org/10.1175/1520-0477(1996)077<0437:TNYRP>2.0.CO;2, 1996. a
Krishnamurti, T. and Hawkins, R.: Mid-tropospheric cyclones of the southwest monsoon, J. Appl. Meteorol. Clim., 9, 442–458, 1970. a
Krishnan, R., Zhang, C., and Sugi, M.: Dynamics of breaks in the Indian summer monsoon, J. Atmos. Sci., 57, 1354–1372, 2000. a
Kulkarni, A., Sabin, T. P., Chowdary, J. S., Rao, K. K., Priya, P., Gandhi, N., Bhaskar, P., Buri, V. K., Sabade, S. S., Pai, D. S., Ashok, K., Mitra, A. K., Niyogi, D., and Rajeevan, M.: Precipitation Changes in India, Springer Singapore, Singapore, 47–72, https://doi.org/10.1007/978-981-15-4327-2_3, 2020. a, b, c
Kumar, K. K., Rajagopalan, B., and Cane, M. A.: On the weakening relationship between the Indian monsoon and ENSO, Science, 284, 2156–2159, 1999. a
Mallya, G., Mishra, V., Niyogi, D., Tripathi, S., and Govindaraju, R. S.: Trends and variability of droughts over the Indian monsoon region, Weather and Climate Extremes, 12, 43–68, 2016. a
Murakami, M.: Analysis of summer monsoon fluctuations over India, J. Meteorol. Soc. Jpn. Ser. II, 54, 15–31, 1976. a
Pai, D., Rajeevan, M., Sreejith, O., Mukhopadhyay, B., and Satbha, N.: Development of a new high spatial resolution (0.25 × 0.25) long period (1901–2010) daily gridded rainfall data set over India and its comparison with existing data sets over the region, Mausam, 65, 1–18, 2014. a
Phadtare, J. A., Fletcher, J. K., Ross, A. N., Turner, A. G., and Schiemann, R. K.: Froude-number-based rainfall regimes over the Western Ghats mountains of India, Q. J. Roy. Meteor. Soc., 148, 3388–3405, 2022. a
Raghavan, K.: Break-monsoon over India, Mon. Weather Rev., 101, 33–43, 1973. a, b, c, d
Rajeevan, M., Bhate, J., Kale, J., and Lal, B.: High resolution daily gridded rainfall data for the Indian region: Analysis of break and active monsoon spells, Current Science, 91, 296–306, https://www.jstor.org/stable/24094135 (last access: 30 June 2026), 2006. a
Rajeevan, M., Gadgil, S., and Bhate, J.: Active and break spells of the Indian summer monsoon, J. Earth Syst. Sci., 119, 229–247, 2010. a
Ramage, C. S.: The summer atmospheric circulation over the Arabian Sea, J. Atmos. Sci., 23, 144–150, 1966. a
Rao, Y.: Some characteristics of the Southwest Monsoon circulation, Mausam, 12, 413–418, 1961. a
Rao, Y.: Southwest Monsoon, India Meteorological Department, Meteorological Monograph No. 1/1976, https://imetsociety.org/wp-content/pdf/docs/swmonsoon_yprao.pdf (last access: 27 June 2026), 1976. a, b, c
Raut, B.: RBhupi/monsoon_clusters: WCD EGUSPHERE-2025-4585 Discussion (0.6), Zenodo [code], https://doi.org/10.5281/zenodo.20099064, 2026. a, b
Raut, B. A., Jakob, C., and Reeder, M. J.: Rainfall changes over southwestern Australia and their relationship to the Southern Annular Mode and ENSO, J. Climate, 27, 5801–5814, 2014. a, b, c
Raut, B. A., Reeder, M. J., and Jakob, C.: Trends in CMIP5 Rainfall Patterns over Southwestern Australia, J. Climate, 30, 1779–1788, 2017. a
Raut, B. A., Konwar, M., Murugavel, P., Kadge, D., Gurnule, D., Sayyed, I., Todekar, K., Malap, N., Bankar, S., and Prabhakaran, T.: Microphysical origin of raindrop size distributions during the Indian monsoon, Geophys. Res. Lett., 48, e2021GL093581, https://doi.org/10.1029/2021GL093581, 2021. a
Roxy, M. and Chaithra, S.: Impacts of climate change on the Indian summer monsoon, in: Climate Change and Water Resources in India, Ministry of Environment, Forest and Climate Change (MoEF&CC), Government of India, ISBN 978-81-933131-6-9, 21–37, 2018. a, b, c
Roxy, M. K., Ritika, K., Terray, P., Murtugudde, R., Ashok, K., and Goswami, B.: Drying of Indian subcontinent by rapid Indian Ocean warming and a weakening land-sea thermal gradient, Nat. Commun., 6, 7423, https://doi.org/10.1038/ncomms8423, 2015. a
Saji, N., Goswami, B. N., Vinayachandran, P., and Yamagata, T.: A dipole mode in the tropical Indian Ocean, Nature, 401, 360–363, 1999. a
Sarker, R.: A dynamical model of orographic rainfall, Mon. Weather Rev., 94, 555–572, 1966. a
Sikka, D. and Gadgil, S.: On the maximum cloud zone and the ITCZ over Indian longitudes during the southwest monsoon, Mon. Weather Rev., 108, 1840–1853, 1980. a, b
Simpson, G. C.: The south-west monsoon, Q. J. Roy. Meteor. Soc., 47, 151–171, 1921. a
Srivastava, A., Rajeevan, M., and Kshirsagar, S.: Development of a high resolution daily gridded temperature data set (1969–2005) for the Indian region, Atmos. Sci. Lett., 10, 249–254, 2009. a
Straus, D. M.: Preferred intra-seasonal circulation patterns of the Indian summer monsoon and active-break cycles: A new view of the active-break cycle, Clim. Dynam., 59, 1415–1434, 2022. a
Subrahmanyam, K. V., Ramana, M., and Chauhan, P.: Long-term changes in rainfall epochs and intensity patterns of Indian summer monsoon in changing climate, Atmos. Res., 106997, https://doi.org/10.1016/j.atmosres.2023.106997, 2023. a
Suhas, E., Neena, J., and Goswami, B.: An Indian monsoon intraseasonal oscillations (MISO) index for real time monitoring and forecast verification, Clim. Dynam., 40, 2605–2616, 2013. a, b
Thompson, D. W. and Wallace, J. M.: The Arctic Oscillation signature in the wintertime geopotential height and temperature fields, Geophys. Res. Lett., 25, 1297–1300, 1998. a
Trenberth, K. E.: Changes in precipitation with climate change, Clim. Res., 47, 123–138, 2011. a
Turner, A. G. and Annamalai, H.: Climate change and the South Asian summer monsoon, Nat. Clim. Change, 2, 587–595, 2012. a, b, c
Webster, P. J., Magana, V. O., Palmer, T., Shukla, J., Tomas, R., Yanai, M., and Yasunari, T.: Monsoons: Processes, predictability, and the prospects for prediction, J. Geophys. Res.-Oceans, 103, 14451–14510, 1998. a, b
Yadav, R. K., Srinivas, G., and Chowdary, J. S.: Atlantic Niño modulation of the Indian summer monsoon through Asian jet, Npj Clim. Atmos. Sci., 1, 23, https://doi.org/10.1038/s41612-018-0029-5, 2018. a
Yatagai, A., Kamiguchi, K., Arakawa, O., Hamada, A., Yasutomi, N., and Kitoh, A.: APHRODITE: Constructing a long-term daily gridded precipitation dataset for Asia based on a dense network of rain gauges, B. Am. Meteorol. Soc., 93, 1401–1415, 2012. a
Zahan, Y., Mahanta, R., Rajesh, P., and Goswami, B.: Impact of climate change on North-East India (NEI) summer monsoon rainfall, Climatic Change, 164, 2, https://doi.org/10.1007/s10584-021-02994-5, 2021. a, b