the Creative Commons Attribution 4.0 License.
the Creative Commons Attribution 4.0 License.
 | 12 Mar 2026
The impact of Aeolus observations on wind and rainfall predictions
Peter Knippertz
Michael Rennie
Martin Weissmann
Previous studies showed substantial improvements in upper-level wind and mass field forecasts from assimilating Aeolus wind observations. This study extends those analyses using the improved reprocessed Aeolus dataset (version B16) in experiments with the global ECMWF forecasting system spanning more than three years. Results show that zonal wind forecasts improve through most of the troposphere during the first forecast week, with smaller gains in Northern Hemisphere midlatitudes. The impact extends into the stratosphere, reducing Root Mean Square Errors by about 0.5 %, up to 1.5 % in the tropical upper troposphere. These improvements lead to more accurate rainfall forecasts in some regions and seasons, as measured by the Fraction Skill Score (FSS) and the Stable Equitable Error in Probability Space (SEEPS). They are largest during the winter half-year in the extratropics, particularly in the Southern Hemisphere, and appear primarily at the grid scale. The largest FSS improvements, reaching several percent, occur for 5–10 d leads and heavy rainfall categories, while SEEPS indicates modest but consistent gains in categorical precipitation skill. These results show co-occurring improvements in wind and precipitation, particularly in winter, which may reflect an influence of Aeolus winds on the large-scale circulation that governs the organization of cyclones, fronts, and heavy rainfall.
- Article
(16469 KB) - Full-text XML
- BibTeX
- EndNote


Accurate rainfall forecasts are essential for various socio-economic sectors, including agriculture, water management, transportation, and energy production. Reliable predictions enable better planning and decision-making, from optimizing irrigation and managing reservoirs to minimizing transport disruptions and supporting energy scheduling. Furthermore, precise precipitation forecasts are vital for mitigating the impacts of extreme events such as floods, landslides, and droughts by supporting early warning systems and risk management strategies. While most dynamical processes can be resolved in global Numerical Weather Prediction (NWP) models, phenomena such as radiation, turbulence, convection, clouds and precipitation are inherently too small in scale and must therefore be parameterized. Global NWP models such as the European Centre for Medium-Range Weather Forecasts' (ECMWF) Integrated Forecasting System (IFS) have made significant advances in recent years with respect to the accuracy of precipitation forecasts. In particular, advancements in the parameterization of cloud processes have improved the prediction of rainfall rates as well as their frequency distribution (Bechtold et al., 2014; Forbes et al., 2015). Despite these advancements, the accuracy of forecasts remains limited, in particular regarding predictions of the location, timing, and intensity of convective precipitation events. This arises from the inherent complexity of their rapid evolution and the involved multi-scale interactions, which are not fully captured by current global NWP models using a grid spacing of about 10 km (Yang and Slingo, 2001; De Meutter et al., 2015; Prein et al., 2015; Feng et al., 2016; Taylor et al., 2017). Another key ingredient for improving precipitation forecasts is to better constrain model initial conditions through the assimilation of observations. In particular, the assimilation of spatio-temporal high-resolution satellite data, such as all-sky radiances within the ECMWF operational 4D-Variational Data Assimilation system (4D-Var), has demonstrated a significant positive impact on rainfall predictions (Bauer et al., 2010; Geer et al., 2010). In addition, the inclusion of GPS Radio Occultation (GPSRO) measurements further improved precipitation predictions by providing accurate vertical profiles of temperature and moisture (Bonafoni et al., 2019). Among the various types of atmospheric observations, wind measurements provide a particularly strong positive impact on forecast as consistently shown in several impact studies (Marseille and Stoffelen, 2003; Stoffelen et al., 2005, 2006; Žagar et al., 2008; Baker et al., 2014; Weissmann and Cardinali, 2007; Weissmann et al., 2012; Žagar, 2004). However, observations of wind are still sparse compared to satellite radiance observations that mainly constrain the mass field (Baker et al., 2014).
In response to these limitations, the European Space Agency (ESA) launched the Aeolus satellite in 2018. Aeolus was the first spaceborne Doppler wind lidar that provided direct, vertically resolved profiles of line-of sight wind across the globe (Stoffelen et al., 2005; Reitebuch, 2012; Straume et al., 2020). Operating until 2023, Aeolus filled a crucial observational gap by supplying high-accuracy wind data at altitudes important for atmospheric dynamics, such as the Upper Troposphere and Lower Stratosphere (UTLS). While previous studies have demonstrated the positive impact of Aeolus wind data on upper-air wind and mass fields (Rennie et al., 2021, 2022; Borne et al., 2023; Martin et al., 2023a; Chou and Kushner, 2024; Žagar et al., 2025), the implications for precipitation forecasting remain largely unexplored. Horizontal wind fields are dynamically linked to precipitation processes, particularly through their influence on vertical motion, storm track evolution, and moisture transport. In the mid-latitudes, precipitation is strongly associated with the evolution of baroclinic systems (Dong et al., 2013; Ma and Chang, 2017). These are governed by upper-tropospheric jet stream dynamics and large-scale potential vorticity structures, which are highly sensitive to initial wind conditions. In the Southern Hemisphere (SH), the observational network is particularly sparse over the ocean, where midlatitude storms play a crucial role in modulating the global energy and moisture budgets. These cyclones are the primary drivers of extreme weather events during the cold season, including high winds, heavy precipitation, and abrupt temperature changes (Campbell and Renwick, 2023). In the tropics, precipitation is primarily driven by moist convection and modulated by large-scale circulation features such as Equatorial Waves (EWs) and the Madden–Julian Oscillation (MJO) (Matsuno, 1966; Wheeler and Kiladis, 1999).
The goal of this study is to assess the impact of assimilating Aeolus wind profile observations on precipitation forecasts within the ECMWF IFS. Using Observing System Experiments (OSEs) spanning more than three years (about of the operational lifetime of the Aeolus satellite), we investigate the mean impact as well as the regional and seasonal variability of Aeolus' influence on zonal wind forecasts and its relationship to rainfall forecasts. This analysis aims to support the planning of future Aeolus follow-on missions for NWP. This paper is organized as follows. We first describe the OSEs and the datasets used to validate rainfall and wind. Next, we outline the verification metrics applied to assess the impact of Aeolus on both variables. The results are then presented in two parts: the first addresses the impact of Aeolus on zonal wind predictions, and the second examines the downstream effects on precipitation forecasts.
2.1 Data
In this section, we describe the experiments as well as the precipitation and reanalysis data used for verification in this study. The forecast data for both wind and precipitation are derived from two recent OSEs conducted at ECMWF, which were run with and without the assimilation of Aeolus observations. For wind, we use the ERA5 reanalysis for verification, while for precipitation, we utilize the Global Precipitation Measurement (GPM) of the Integrated Multi-satellitE Retrievals for GPM (IMERG) product.
2.1.1 Aeolus Observing System Experiments
Precipitation and wind forecast data were obtained from two OSEs, a widely used method in NWP to evaluate the impact of specific observation types (Bouttier and Kelly, 2001; Kelly et al., 2004). OSEs typically involve running two assimilation experiments. One of the experiments excludes the observation group of interest that are in our case Aeolus observations. In this study, two OSEs conducted at ECMWF were utilized, incorporating all operational observations plus wind observations from the Aeolus FM-B laser 4th reprocessing (DISC prototype L2B BUFR) using Baseline 16 (L1A/L1B v7.14.3 and L2B v3.90). The OSEs cover two periods: 28 June 2019 to 9 October 2020, and 10 October 2020 to 4 October 2022. Both experiments were conducted using the IFS cycle CY48R1, with a 4D-Var outer loop at TcO639 resolution, equivalent to a horizontal grid spacing of approximately 18 km. It should be noted that the data quality from the FM-B laser was initially very good but degraded over time, which has likely influenced the varying NWP impact of Aeolus observations across the two periods (Lux et al., 2025).
The processing algorithm of Aeolus wind observations distinguishes between two main types of retrievals based on atmospheric conditions: Rayleigh-clear observations, which measure backscatter from air molecules, and Mie-cloudy observations, which measure backscatter from particulates such as hydrometeors and aerosol particles. Both Rayleigh and Mie products were used in the Aeolus OSEs. For Rayleigh-clear observations, the observation error is based on the estimated Level 2B (L2B) error, specifically the instrument error standard deviation provided by the L2B processor. The B16 configuration provides a more accurate estimate of instrument error by accounting for factors such as readout noise and dark current offset noise. For Mie-cloudy, standard error scaling is used, which includes a 2 m s−1 representativity error due to its higher resolution (∼ 12 km) than the effective ECMWF model resolution. Quality control is performed using a first-guess check that rejects observations if the magnitude of departure is larger than the square root of the combined observation and background error variances multiplied by a tolerance factor of 3.5. To evaluate forecast performance, 12 h accumulated precipitation as well as wind fields are analyzed for the 12:00 and 00:00 UTC runs, with forecast days 1 to 10. The analysis spans the entire time of the OSEs from June 2019 to October 2022.
2.1.2 GPM IMERG precipitation product
For the precipitation reference product, we use the globally gridded Rainfall Integrated Multi-satellite Retrievals (IMERG) dataset (Huffman et al., 2015), which is derived from the GPM satellite constellation and other data sources and processed using the IMERG precipitation algorithm. The GPM mission is a continuation of the Tropical Rainfall Measuring Mission (TRMM), with the IMERG algorithm applied alongside additional data, including monthly surface precipitation gauge analyses, to produce a high-resolution global precipitation record. GPM IMERG is preferred over reanalysis products such as ERA5 because it relies predominantly on direct satellite observations, whereas ERA5 represents a synthesis of model output and observational data. The incorporation of model physics in such reanalyses can introduce systematic biases, particularly in regions characterized by complex topography or sparse observational coverage, thereby reducing the reliability of pointwise precipitation estimates. Nevertheless, GPM IMERG is not without limitations. Its precision decreases in regions with complex topography, such as mountain areas, where it often misinterprets cold surfaces as precipitation, leading to significant errors (Hirpa et al., 2010; Hobouchian et al., 2017). Moreover, heavy precipitation is often underestimated in warm orographic clouds (Dinku et al., 2010; Derin and Yilmaz, 2014). IMERG data can be unreliable in areas with few ground observations, complicating validation efforts (Hirpa et al., 2010). Nevertheless, the satellite product generally provides more accurate estimates in tropical wet and dry zones than in mountainous and semi-arid regions (Thiemig et al., 2012; Prakash et al., 2016; Derin et al., 2019). This dataset is gridded to a spatial resolution of 0.1° × 0.1° and a temporal resolution of 30 min, providing near-global coverage from 60° N to 60° S. For this study, we use the “Late” (IMERG-L) product run, which is calibrated monthly with ca. 7000 ground-based meteorological stations worldwide. The precipitation data have been aggregated to match the resolution of ECMWF forecasts, i.e. a 12 h temporal resolution on a 0.25° horizontal grid, covering the period 2000 to 2022, which provides a sufficiently long dataset suitable for building a reference climatology.
2.1.3 ERA5 wind reanalysis
Reanalysis datasets are widely used to evaluate changes in observing systems and to provide an independent reference for atmospheric winds. In this study, wind forecast accuracy is evaluated against the ERA5 reanalysis produced by ECMWF, which does not assimilate Aeolus wind observations (Hersbach et al., 2020). ERA5 is generated using an earlier version of the ECMWF Integrated Forecasting System (IFS CY41R2) with 4D-Var data assimilation and a horizontal resolution of about 31 km. While ERA5 does not assimilate Aeolus winds, it shares the same model and assimilation system as the forecasts, so it is not fully independent. Recent comparisons demonstrate that ERA5 provides a suitable wind reference, including in the tropics where geostrophic balance is weak. Zonal-mean zonal winds and tropical wave signatures show very good agreement between ERA5 and Aeolus, with mean differences typically below 2 m s−1 and smaller than for other modern reanalyses (Ern et al., 2023). Consistent results are found in comparisons with radio-occultation-derived winds, which also indicate differences generally within ±2 m s−1, apart from localized deviations near subtropical jet regions (Nimac et al., 2025). These results support the use of ERA5 as a robust reference for wind evaluation in this study.
2.2 Methods
2.2.1 Verification metrics
In this section, we outline the metrics employed to evaluate the impact of Aeolus on precipitation and wind forecasts within the ECMWF IFS. Specifically, we use the Fractions Score (FSS), the Stable Equitable Error in Probability Space (SEEPS), and the Root Mean Square Error (RMSE) as detailed below.
The relative improvement is calculated differently for each verification metric. For RMSE and SEEPS, which are negatively oriented, the relative improvement is computed as . For FSS, a positively oriented metric, it is calculated as . This way, positive values correspond to forecast improvement for all three metrics. Throughout the paper, regional domains are defined as follows: Northern Hemisphere (NH) from 20 to 60° N, Tropics from 20° S to 20° N, and Southern Hemisphere (SH) from 60 to 20° S. These boundaries are chosen to align with the latitudinal coverage of GPM IMERG precipitation data (60° S to 60° N). Beyond 60° latitude, IMERG coverage exists but with reduced accuracy, especially for extreme rainfall due to limited ground validation.
2.2.2 Fractions Skill Score (FSS)
The Fractions Skill Score (FSS) is a widely used spatial verification metric designed to evaluate the quality of both deterministic and probabilistic forecasts, particularly for binary events such as precipitation exceedance. The FSS compares the fraction of grid points within a specified neighborhood that exceed a given threshold in both the forecast and observations (Roberts, 2008). By calculating the squared differences between these fractions over increasing neighborhood sizes, the FSS effectively quantifies displacement errors without automatically penalizing minor location discrepancies. This approach mitigates the “double penalty” problem, where forecasts with sharp gradients are unfairly penalized if structures are slightly misplaced in space or time (Ebert, 2008).
A perfect forecast will have an FSS of 1, while a forecast with no skill will have a score of 0. Values above 0.5 are usually considered to be useful. However, the FSS becomes undefined if neither the prediction nor the observed field exceeds the threshold, unless a threshold of zero is used, in which case the score would be 1. The FSS evolves as a function of neighborhood size, providing insight into the spatial scales at which forecasts and observations are in agreement, and indicating the spatial scale at which the forecast achieves sufficient quality (Gilleland et al., 2009). Overall, the FSS provides a robust means of assessing spatial forecast accuracy, while allowing flexibility in accounting for small-scale location and intensity errors.
2.2.3 Stable Equitable Error in Probability Space (SEEPS)
The SEEPS score (Rodwell et al., 2010) is designed to evaluate the performance of deterministic precipitation forecasts.
The SEEPS score employs variable thresholds to classify precipitation into three categories: “dry”, “light precipitation”, and “heavy precipitation”, based on a climatological cumulative distribution of precipitation. For this purpose, a global 20-year extended probabilistic climatology (Walz et al., 2021) from GPM IMERG observations is utilized, which aggregates all observations from previous years on a given day of the year, to have a sufficiently large window to assess rainfall probability during that day of a year. To account for interannual variability, precipitation data within a ±15 d window around the target date are aggregated to estimate the day-of-year rainfall distribution. The “dry” category, in accordance with World Meteorological Organization guidelines, is defined as all cases with precipitation strictly less than 0.2 mm d−1. The upper limit to the “dry” probability is set to 0.85 (very dry regions) in order to reduce sampling uncertainty in area-mean scores (Rodwell et al., 2010). This reduces the effective observation availability, especially in the sub-tropics.
Figure 1a displays the annual mean probability of dry days, defined as days with precipitation below 0.2 mm d−1, while Fig. 1b shows the annually averaged thresholds separating the light and heavy precipitation categories. These thresholds reflect local precipitation climatology, distinguishing arid from humid regions. Regions with a probability of dry days exceeding 0.85 are excluded from the analysis and are shown as hatched white areas in both panels. These masked areas typically correspond to persistently dry zones, particularly in parts of the subtropics and outer tropics, where rare precipitation events reduce the reliability of categorical verification. The light and heavy precipitation categories are defined based on local percentiles such that light precipitation occurs twice as frequently as heavy precipitation, allowing regionally consistent verification despite climatological differences.
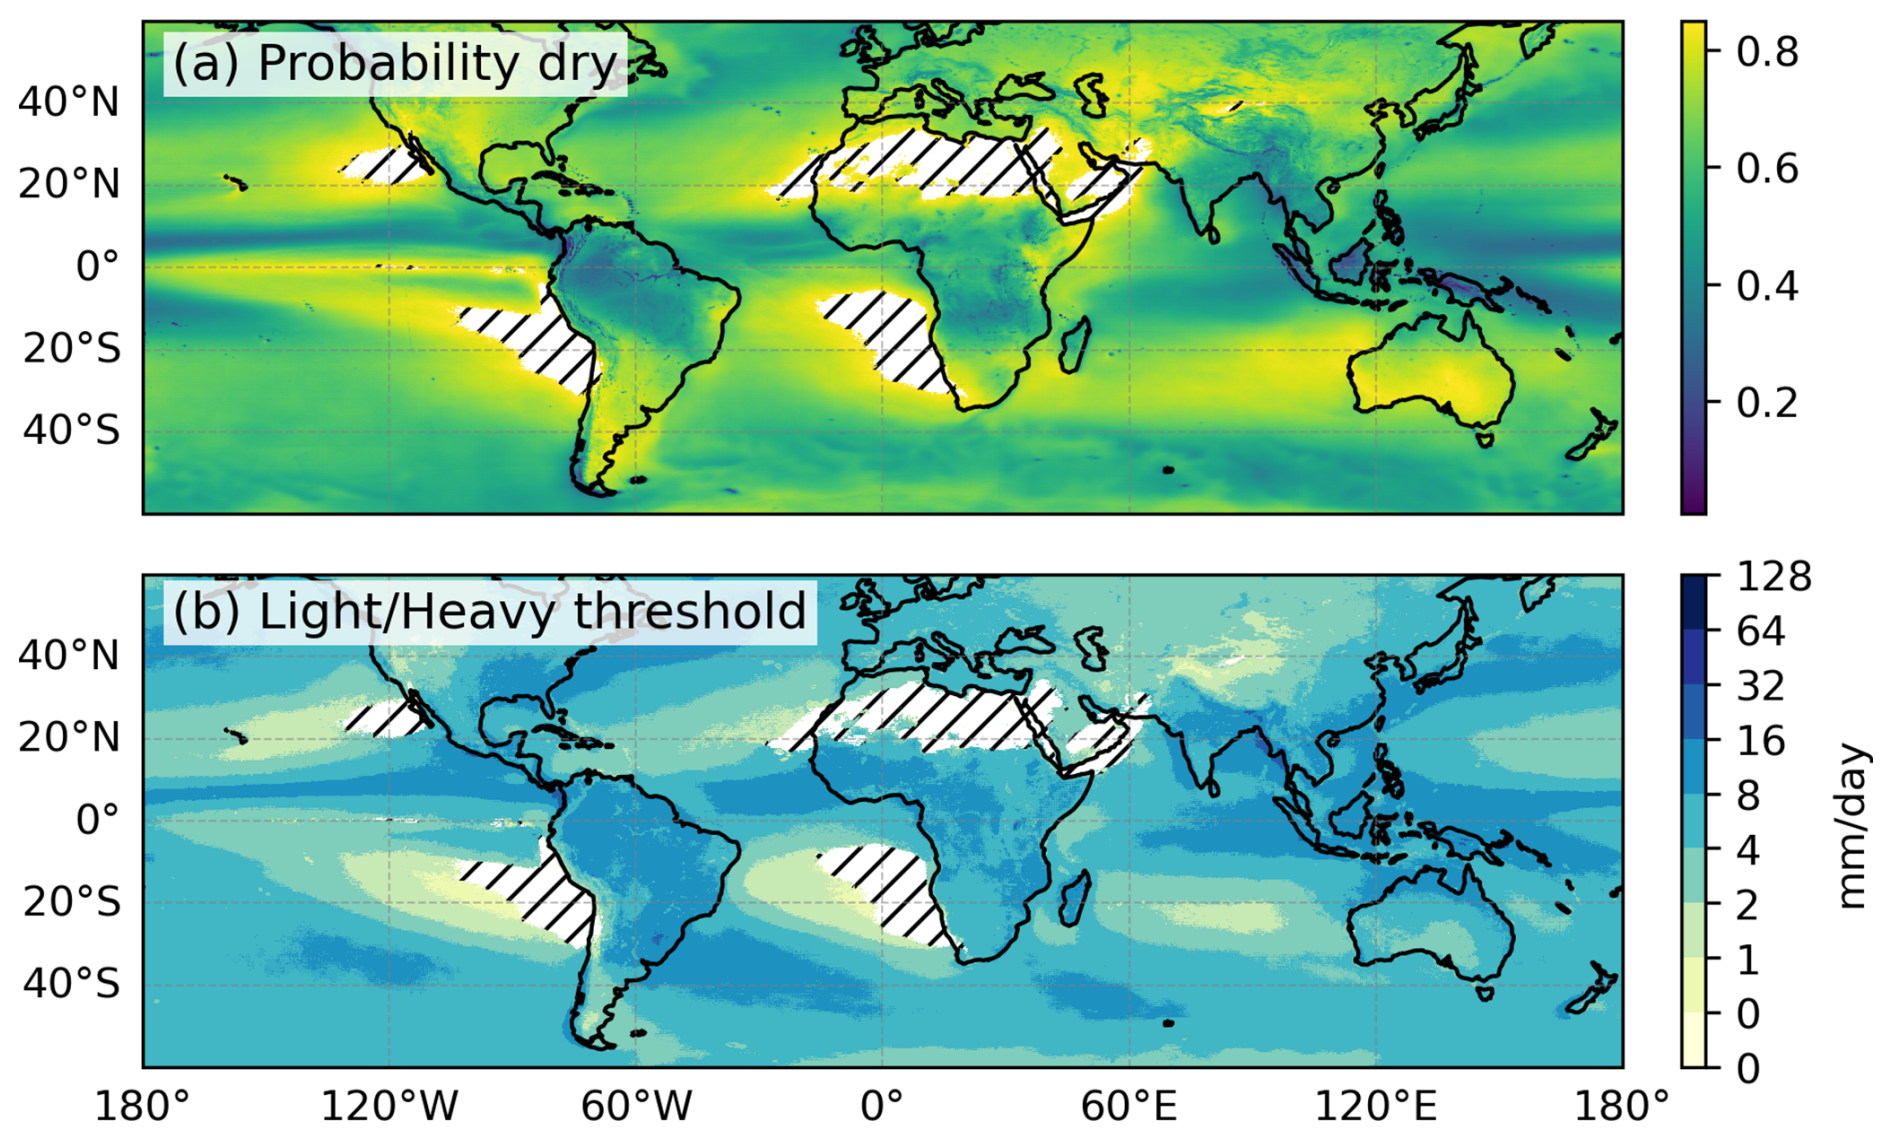
Figure 1Geographical distribution of (a) the annual mean probability of dry conditions with respect to a day and (b) the threshold separating light and heavy precipitation categories, based on the extended GPM IMERG climatology (2000–2022). Regions where the annual probability of being dry exceeds 0.85 are indicated by hatched white areas in both panels.
The SEEPS score thus serves as a diagnostic to identify model errors and, as its name suggests, is constructed to ensure equitability (Murphy and Winkler, 1987; Gandin and Murphy, 1992), i.e. both constant and random forecasts receive a comparable score. In addition, SEEPS is designed to be stable, minimizing sensitivity to sampling uncertainty and allowing more accurate trends to be extracted from noisy data. Furthermore, the score operates in probability space, allowing precipitation categories to be defined in a way that adapts to the local climate, ensuring its applicability across different climatic regions.
Following Gandin and Murphy (1992), the SEEPS score is calculated as the scalar product of the scoring matrix and the 3 × 3 contingency table of category pairs. The scoring matrix is defined as:
In this matrix, the rows f and columns o correspond to the forecast and observed categories, respectively: “dry”, “light precipitation” and “heavy precipitation”. The structure of SEEPS allows for the extraction of individual score components, providing insights into the contribution of each observed-forecast category to the overall score. In this paper, the following abbreviations are used to represent the different components of the SEEPS score: observed dry/forecast light (ODFL), observed dry/forecast heavy (ODFH), observed light/forecast dry (OLFD), observed light/forecast heavy (OLFH), observed heavy/forecast dry (OHFD), and observed heavy/forecast light (OHFL). Matching categories are represented as observed dry/forecast dry (ODFD), observed light/forecast light (OLFL), and observed heavy/forecast heavy (OHFH). Finally, note that SEEPS is a negatively oriented score, ranging from 0 to 1, where 0 represents a perfect forecast.
2.2.4 Root Mean Square Error (RMSE)
To evaluate the impact of Aeolus on both precipitation and wind forecasts, we also compute the traditional Root Mean Square Error (RMSE), comparing forecasts and observations at each individual location. In both OSEs, wind forecasts are verified against the ERA5 reanalysis, while precipitation forecasts are verified against GPM IMERG data. While RMSE is well-suited for normally distributed variables like wind, it is less suitable for precipitation forecasts, particularly when heavy rainfall is predicted in the wrong location. In such cases, forecasts with sharp gradients are penalized twice, once for incorrect location and again for the intensity of the event. To mitigate this “double penalty” effect, the RMSE for precipitation is computed after regridding to a coarser 1° resolution, reducing the sensitivity to slight spatial displacements of predicted rainfall events.
2.2.5 Significance
To evaluate the significance of forecast improvements, we apply a paired t-test at each grid point. For RMSE, the test compares the squared errors of the control and experimental forecasts relative to the reference dataset (ERA5 for wind and GPM IMERG for precipitation). For SEEPS, the test assesses the difference in SEEPS between the two forecasts. The null hypothesis is that the mean error is equal between the control and experimental forecasts. A significance level of 0.05 is used to identify statistically significant differences.
In the first part of this section, we assess the impact of Aeolus assimilation on zonal wind forecasts, with emphasis on seasonal variations and different precipitation regimes. In the second part, we analyze the impact on precipitation forecasts using categorical and spatial verification metrics.
3.1 Standard verification of zonal wind forecasts
3.1.1 Impact of Aeolus on zonal wind forecasts
Figure 2 shows a latitude–height cross-section of the relative improvement in the RMSE of zonal wind for forecast days 1 to 10, when assimilating Aeolus HLOS wind observations. Hatched regions indicate areas where the improvement is not statistically significant. Results for day one in the stratosphere should be treated with caution, given uncertainty in the verification data set that may be larger than the difference between the experiments. The most pronounced impacts are observed near the equator and at high latitudes, consistent with preceding studies (Rennie and Isaksen, 2024; Rennie et al., 2021; Martin et al., 2023a). At the equator, the largest forecast improvements occur at 20–200 hPa in the first two days and 20–100 hPa at longer forecast days. The lower maximum corresponds to the upper-Tropospheric Easterly Jet (TEJ) during boreal summer, although the TEJ is not present year-round and is confined to certain longitudes (Borne et al., 2023). The upper-level maximum lies in the stratosphere and may be linked to phases of the Quasi-Biennial Oscillation (QBO) present during the experiment period, even though both easterly and westerly phases occurred. The signal could also reflect other stratospheric variability, as noted in previous studies reporting large improvements during QBO-related events (Martin et al., 2023b; Žagar et al., 2025). Notable improvements are also evident in the SH troposphere, reaching approximately 1 %, along with consistent positive impact north of 60° N in the polar region. In contrast, the NH midlatitude region between 30 and 60° N only reveals small, mostly not significant, impact. The improvements in the tropics and SH are likely due to the limited coverage of conventional wind observations, such as radiosondes, and the inability of mass-field information to constrain the wind with a weaker geostrophic balance in the tropics. In high latitudes, the impact of Aeolus may be more pronounced due to the reduced reliability of cloud-motion vectors from geostationary satellites, as the viewing geometry becomes increasingly oblique and less effective for wind retrievals. In the NH, the synoptic-scale flow is more stable, slower-evolving, and better constrained by other observations from radiosondes and aircraft. This reduces the model's sensitivity to new observations like those from Aeolus. Overall, the forecast improvements remain robust through day 7, with a gradual upward propagation into the stratosphere. From day 8 onward, the tropospheric impact is more mixed with some smaller areas of degradation.
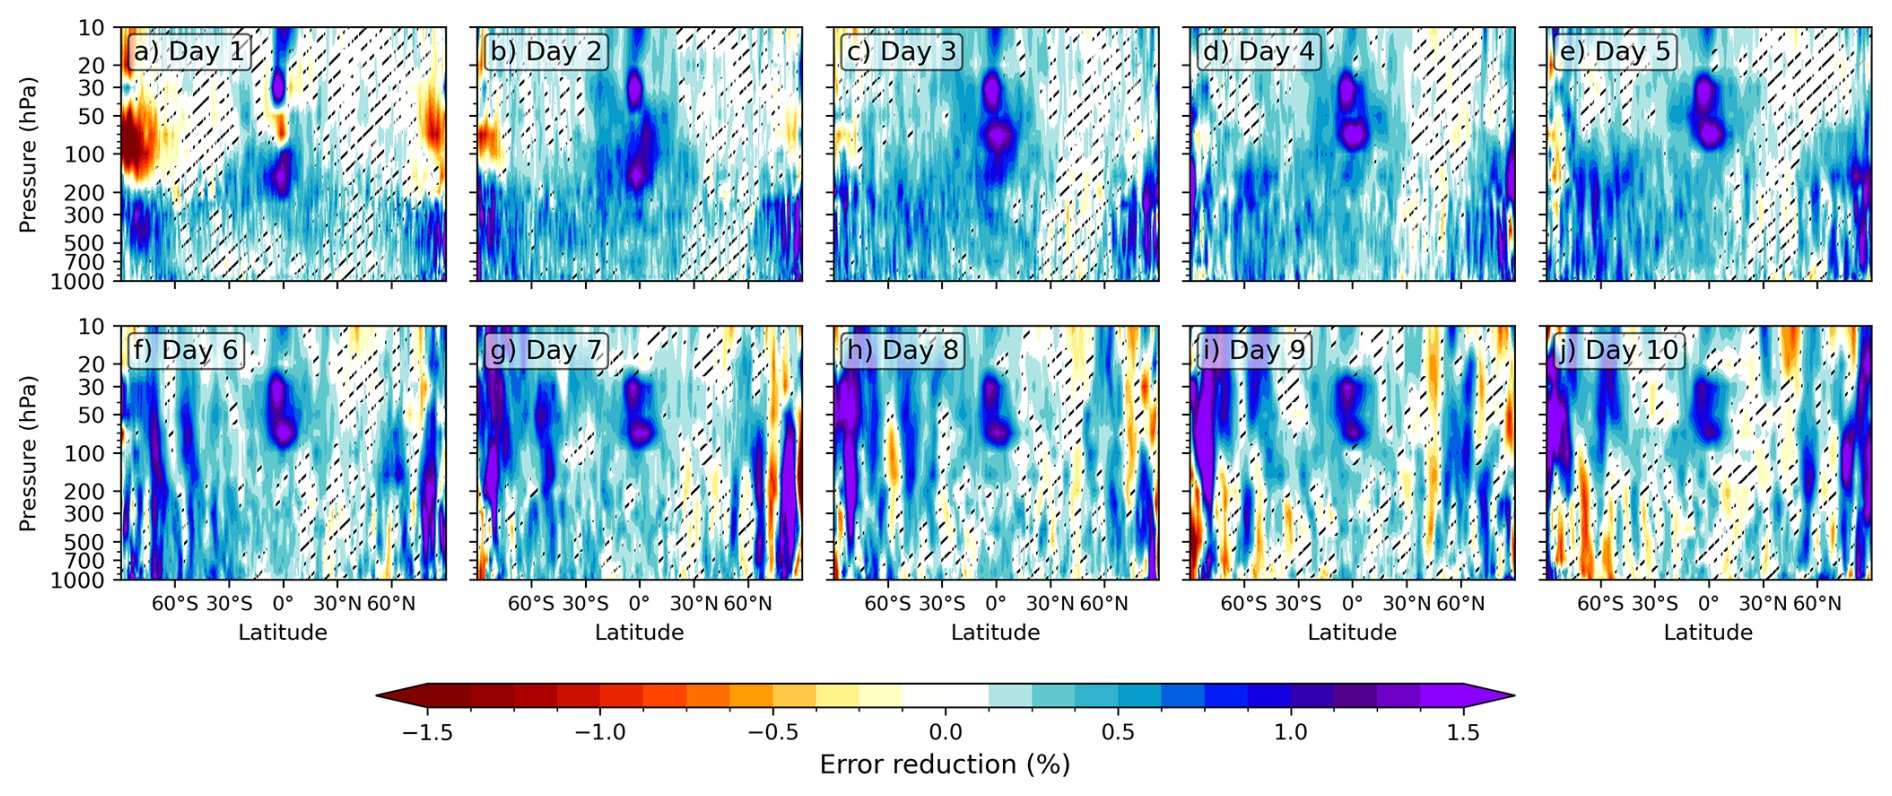
Figure 2Zonally averaged error reduction in RMSE of zonal wind forecasts vs. ERA5 from day 1 to 10 when assimilating Aeolus wind observations, during the period 2019–2022. Positive impact is indicated in blue, while degradation is shown in red. Hatched areas denote regions where changes are not statistically significant.
Figure 3 illustrates the impact of Aeolus assimilation on 3 d wind forecasts at pressure levels of 100, 200, 500, and 850 hPa. Overall, mean improvements are observed globally across all levels. At 100 hPa, the most pronounced improvements occur in the eastern Pacific near Central America, the western Pacific near the Maritime Continent, and a patchy region stretching from the western Indian Ocean across East Africa into the tropical eastern Atlantic, associated with the TEJ during boreal summer (see Borne et al., 2023).
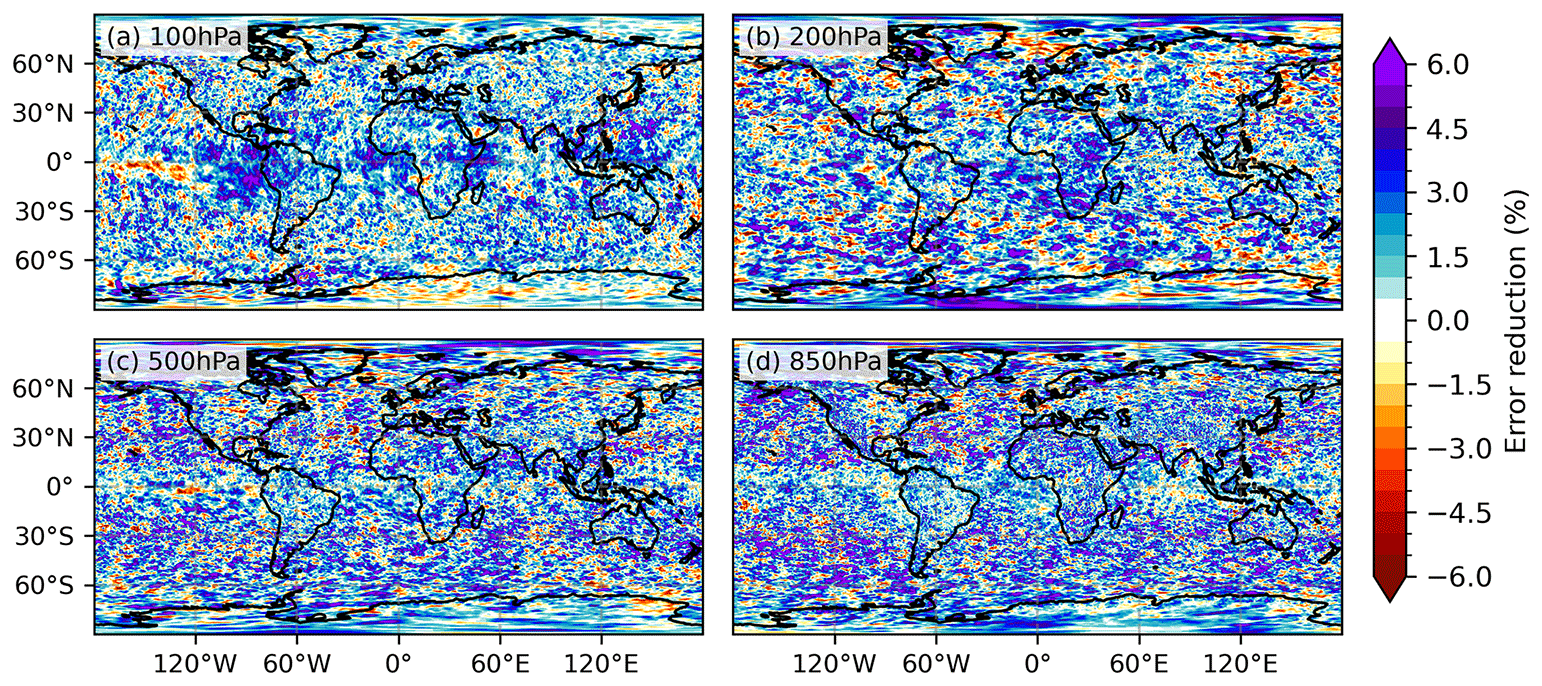
Figure 3Error reduction in RMSE of zonal wind forecasts when assimilating Aeolus compared to ERA5 at a 3 d forecast range for pressure levels of (a) 100 hPa, (b) 200 hPa, (c) 500 hPa and (d) 850 hPa.
At 200 hPa (Fig. 3b), the impact of Aeolus assimilation is more spatially heterogeneous, with significant positive improvements exceeding 4 %, particularly over Africa and the tropical Atlantic. Similar positive patterns, but with an increasing level of noisiness, are observed at 500 hPa (Fig. 3c) and 850 hPa (Fig. 3d), with the strongest effects in extratropical regions. The smaller impact in the tropical lower troposphere is attributed to Aeolus' limited ability to sample winds beneath convective cloud cover.
3.1.2 Seasonal Dependence on Wind Forecast
To examine the seasonal behavior of zonal wind forecast improvement, Fig. 4 shows the relative RMSE reduction from Aeolus wind observation assimilation for the extended boreal winter (NDJFMA, blue line) and the extended austral winter (MJJASO, orange line) during the first five forecast days, stratified by hemisphere (NH, Tropics, and SH).
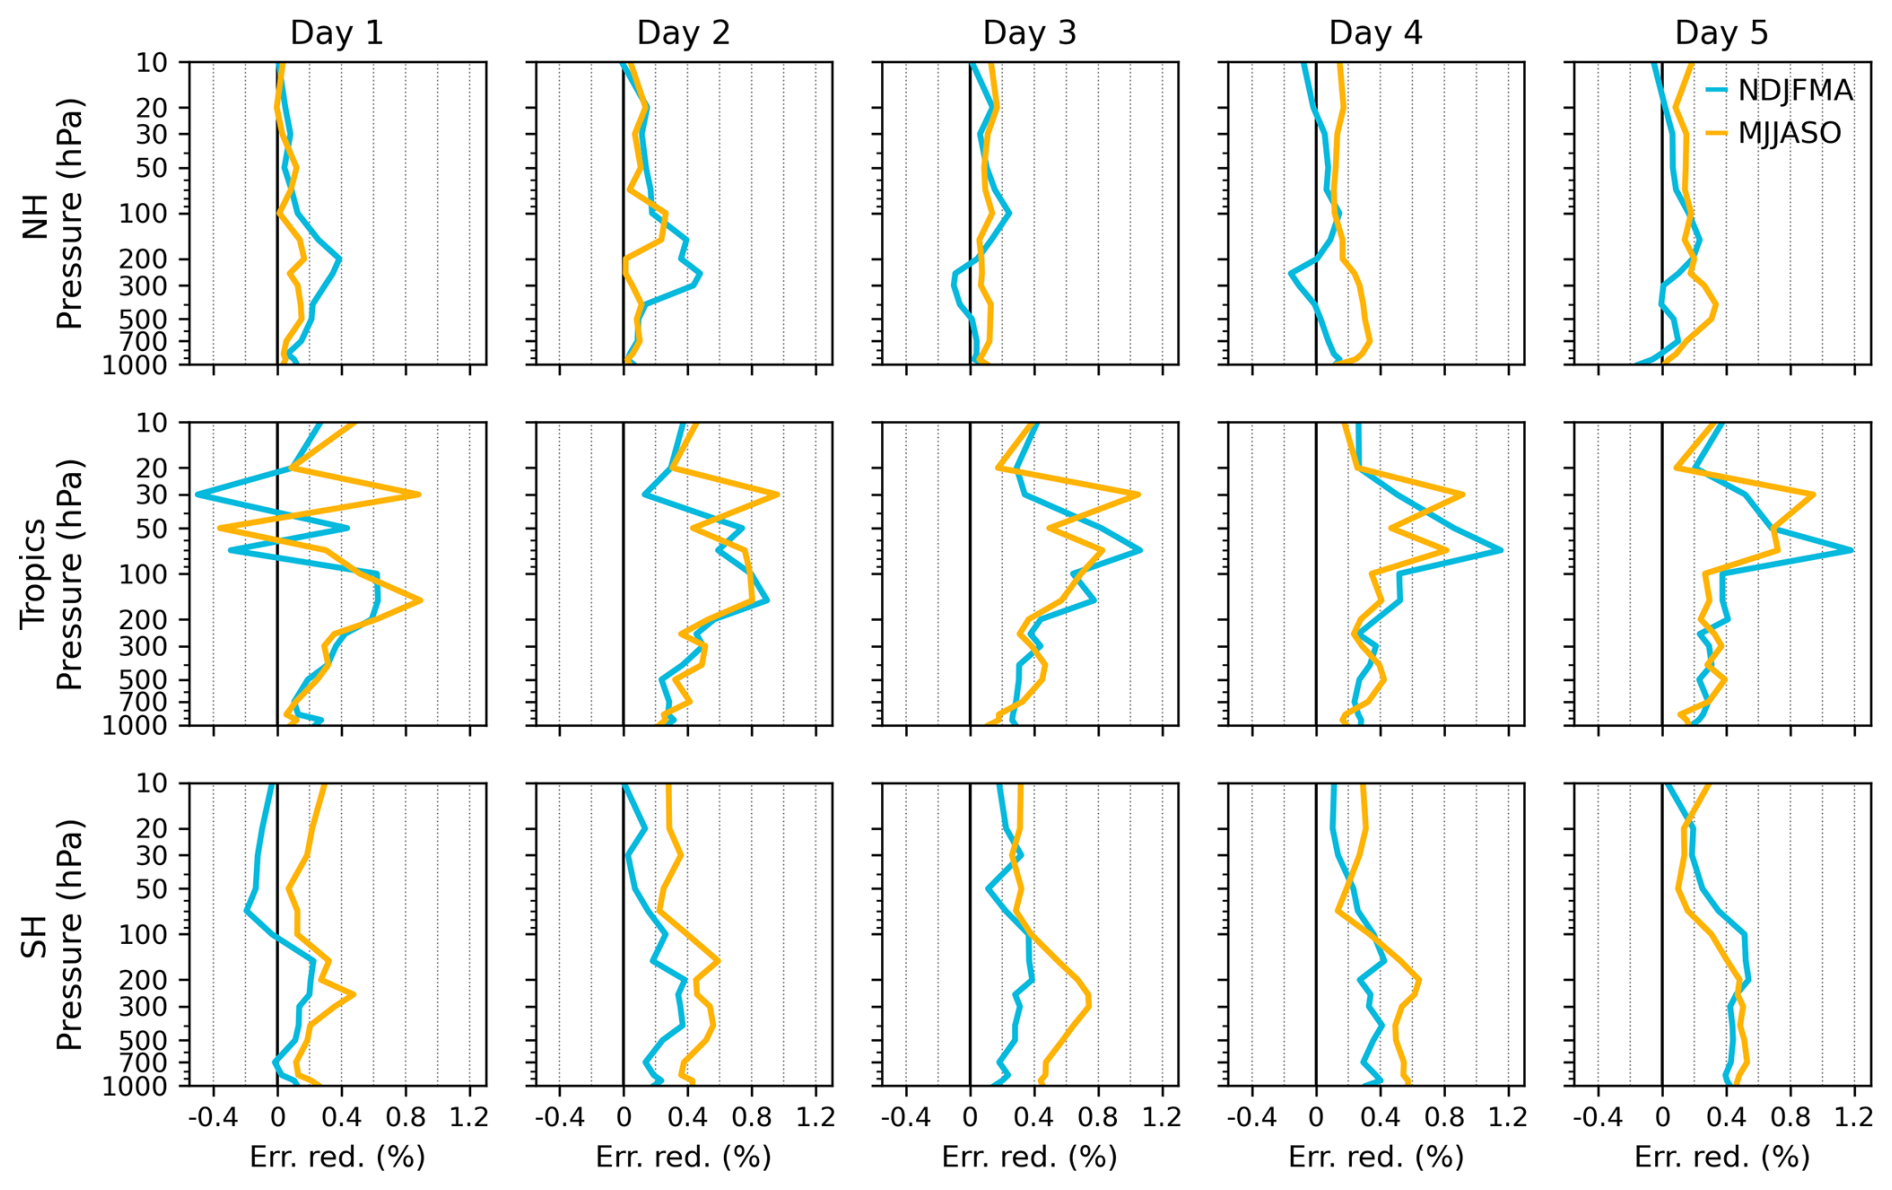
Figure 4Reduction of RMSE in zonal wind forecasts through the assimilation of Aeolus observations relative to ERA5, averaged over the Northern Hemisphere (20–60° N), Tropics (20° S–20° N), and Southern Hemisphere (60–20° S), for forecast days 1 to 5. Results are stratified by extended season: NDJFMA (extended boreal winter, blue) and MJJASO (extended austral winter, orange).
In the NH (top row), during the extended boreal winter, a notably stronger improvement is observed in the upper troposphere (500–100 hPa) for forecast days 1 and 2, with error reductions reaching up to 0.4 %, compared to 0.1–0.2 % during the extended summer. Above 100 hPa, in the stratosphere, both seasons show similar performance. From day 3 onward, the improvement during boreal winter declines, particularly below 200 hPa, resulting in a near-neutral impact. In contrast, during summer, the impact is more consistent for different forecast days, with an average error reduction of 0.2 %–0.3 %.
In the Tropics (middle row), seasonal differences are minimal throughout the vertical profile, reflecting the weak seasonality of the tropical circulation, where inter-seasonal variability is often larger than the seasonal cycle due to phenomena such as the MJO and EWs. In contrast, in the tropical stratosphere, Aeolus assimilation exhibits clear seasonal peaks in forecast improvements, for example around 30 hPa during MJJASO and 50 hPa during NDJFMA. The seasonal difference in peak altitude could reflect the vertical shift of the tropical stratospheric eastward wind, which is typically stronger and lower (∼ 30 hPa) in boreal summer (MJJASO) and higher (∼ 50 hPa) in boreal winter (NDJFMA), so Aeolus observations have the largest impact where the zonal wind is strongest.
In the SH (bottom row), a clear seasonal signal is evident with consistently larger impact during the extended austral winter than during the extended austral summer. The error reduction extends from the surface to the lower stratosphere with a peak in the UTLS region. For day 3 and 4, the benefit during austral winter increases to a maximum of 0.6 %–0.8 % RMSE reduction near 300 hPa, compared to 0.4 % during austral summer. Above 100 hPa, the seasonal contrast is less distinct and by day 5, the contrast between seasons becomes less pronounced overall; forecast improvement remains slightly larger for austral winter below 200 hPa, while above this level, summer forecasts show larger improvement. The larger Aeolus impact in the SH during austral winter may be due to increased baroclinic activity and associated rapidly growing forecast errors, as well as the sparse coverage of observations, such as radiosondes, in this region (Durre et al., 2018). In such conditions, Aeolus wind profiles likely help to better constrain the atmosphere and thereby improve forecasts.
3.1.3 Wind Forecast Improvements in Different Precipitation Regimes
In this section, we investigate how the impact of Aeolus wind assimilation varies under different precipitation regimes. The underlying hypothesis is that Aeolus winds are less beneficial in regions of deep convection and thick cloud cover, where lidar signal attenuation or blockage reduces measurement quality, and where moist convective processes introduce greater forecast uncertainty. To evaluate the sensitivity of Aeolus wind assimilation to precipitation regimes, we applied a rainfall mask to categorize forecast conditions into dry, light, heavy, and all conditions without masking. While precipitation categories do not perfectly reflect cloud presence or type, since non-precipitating clouds and both convective and stratiform systems can occur, they still provide a statistical tendency to distinguish conditions more likely to involve deep, thick clouds (heavy or light precipitation) from those generally associated with clearer skies (dry conditions). This distinction is relevant because Aeolus wind quality has been shown to degrade in cloudy environments due to signal attenuation and contamination, particularly in the presence of thick cloud (Borne et al., 2024). Dry surface conditions do not always imply cloud-free profiles, but they still serve as a useful proxy for lidar measurement quality.
Figure 5 presents the relative RMSE reduction in zonal wind forecasts over the first five forecast days for each precipitation category across three regions: the NH (20–60° N), the tropics (20° S–20° N), and the SH (60–20° S). The clearest signal emerges in the tropics, where dry conditions consistently show greater forecast improvements compared to light or heavy precipitation cases. At 150 hPa on forecast day 1, RMSE reductions reach up to 1 % under dry conditions, compared to approximately 0.3 %–0.4 % in rainy regimes. The strongest improvements occur in persistently dry regions (Fig. 1a) and may be linked to key areas of forecast enhancement in the UTLS depicted in Fig. 3. This contrast across precipitation regimes gradually decreases with forecast days and becomes negligible by day 5. Additionally, we observe a vertical shift of the maximum impact into the stratosphere (above 100 hPa) at longer forecast days, where differences across precipitation categories also become minimal. These levels are generally above most deep cloud layers and therefore less affected by surface precipitation regimes. In the SH, peak improvements are observed near 300 hPa, with dry conditions showing slightly greater RMSE reductions (0.4 %–0.5 %) compared to rainy regimes. In the SH stratosphere, however, the impact remains limited, with reductions around 0.2 % across all categories. In the NH, the response is more uniform across precipitation regimes, with relatively consistent improvements of 0.1 %–0.2 % throughout the vertical profile. This weaker signal likely reflects the denser observational network in the NH compared to the tropics and the SH.
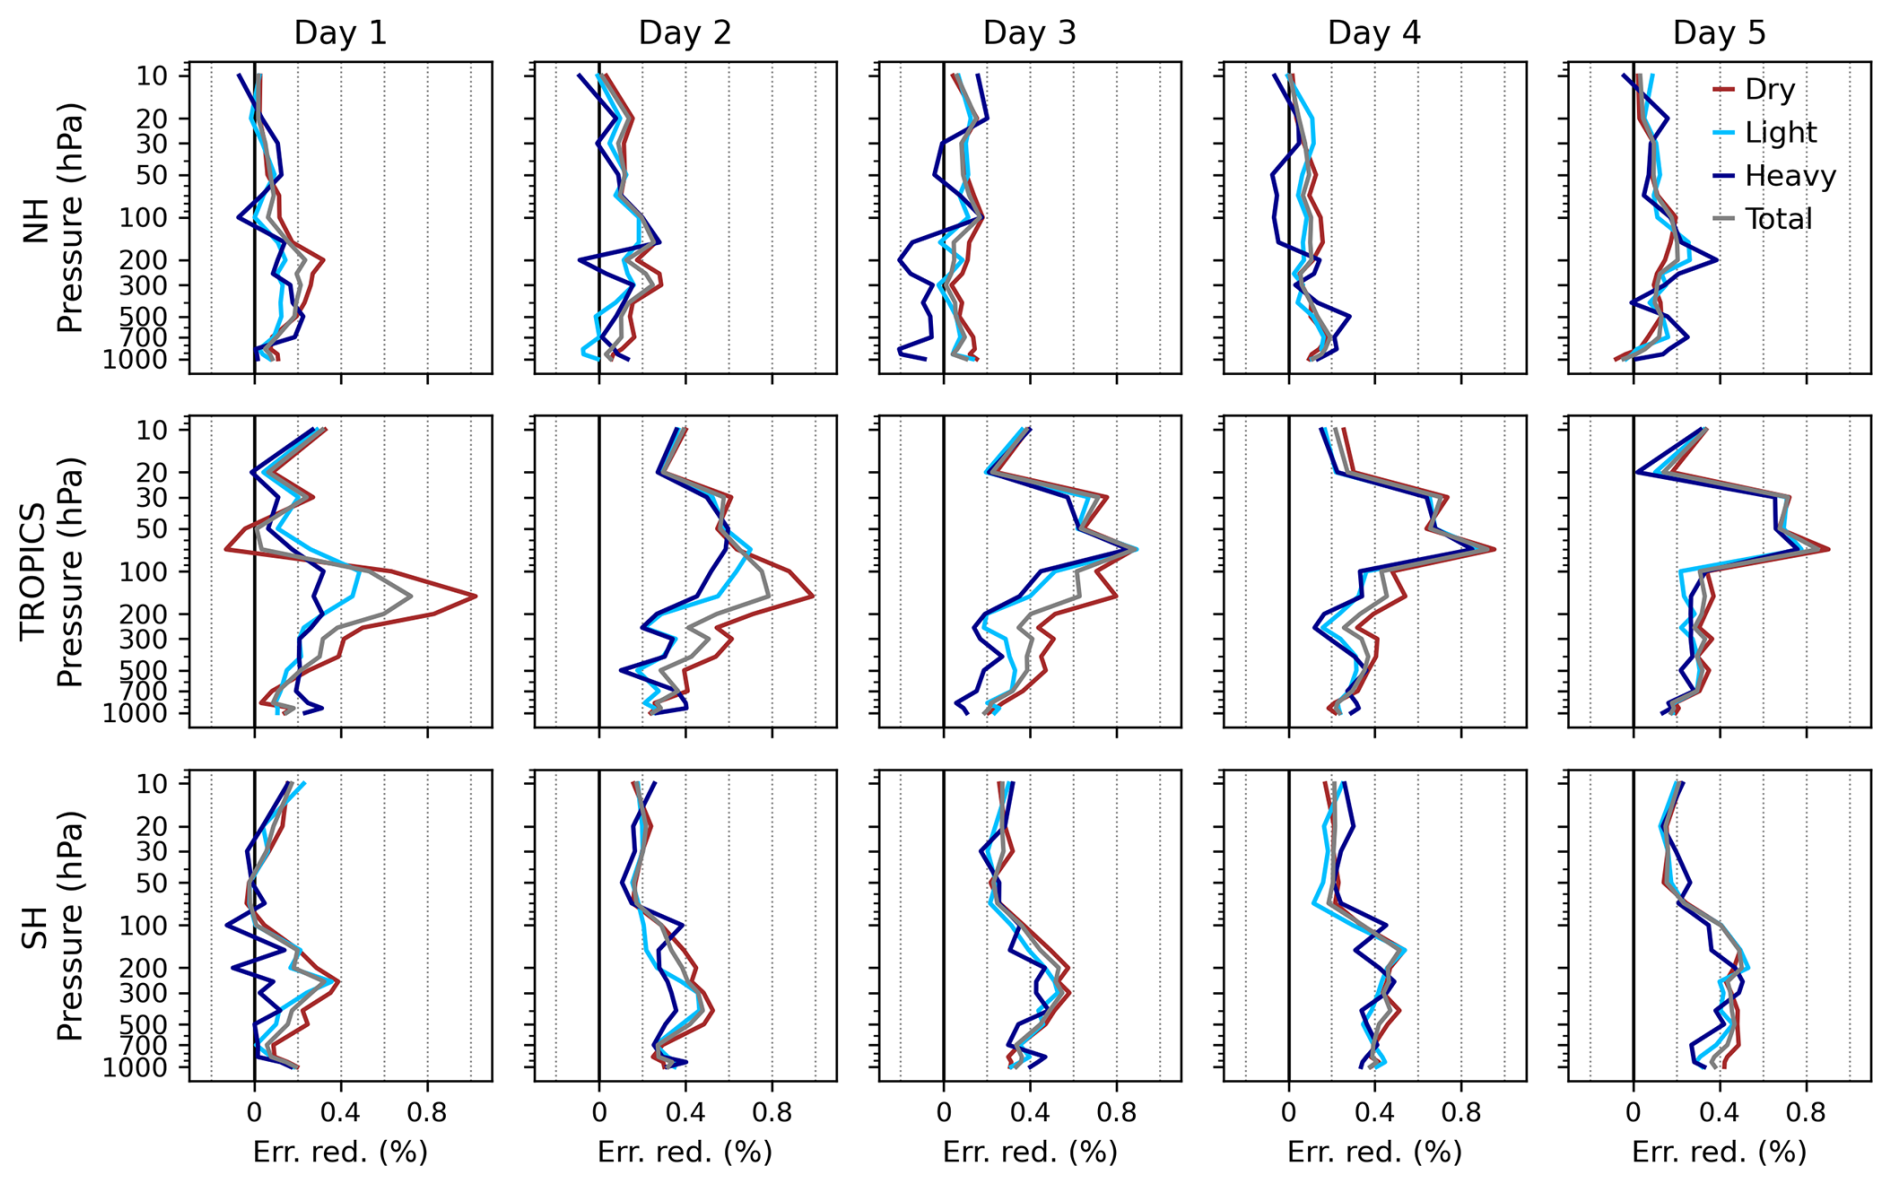
Figure 5Reduction of RMSE in zonal wind forecasts through the assimilation of Aeolus observations relative to ERA5, averaged over the Northern Hemisphere (20–60° N), Tropics (20° S–20° N), and Southern Hemisphere (60–20° S), for forecast days 1 to 5. Results are stratified by precipitation intensity using rainfall masks: dry (brown), light (light blue), heavy (dark blue), and without a precipitation mask (grey) conditions.
3.2 Precipitation Forecast Verification
This section evaluates the impact of Aeolus wind assimilation on precipitation forecasts using FSS and SEEPS (see Sect. 2.2.1 for their descriptions). These metrics provide complementary insights into categorical and spatial-scale forecast performance, respectively.
3.2.1 Spatial-Scale Dependence: Fractions Score (FSS)
Figure 6 presents the FSS across spatial scales ranging from approximately 25 to 2500 km and for three precipitation thresholds (0.2, 3, and 10 mm d−1). Results are shown separately for the Northern Hemisphere (NH), Tropics, and Southern Hemisphere (SH), together with the corresponding error reduction in FSS when assimilating Aeolus wind observations.
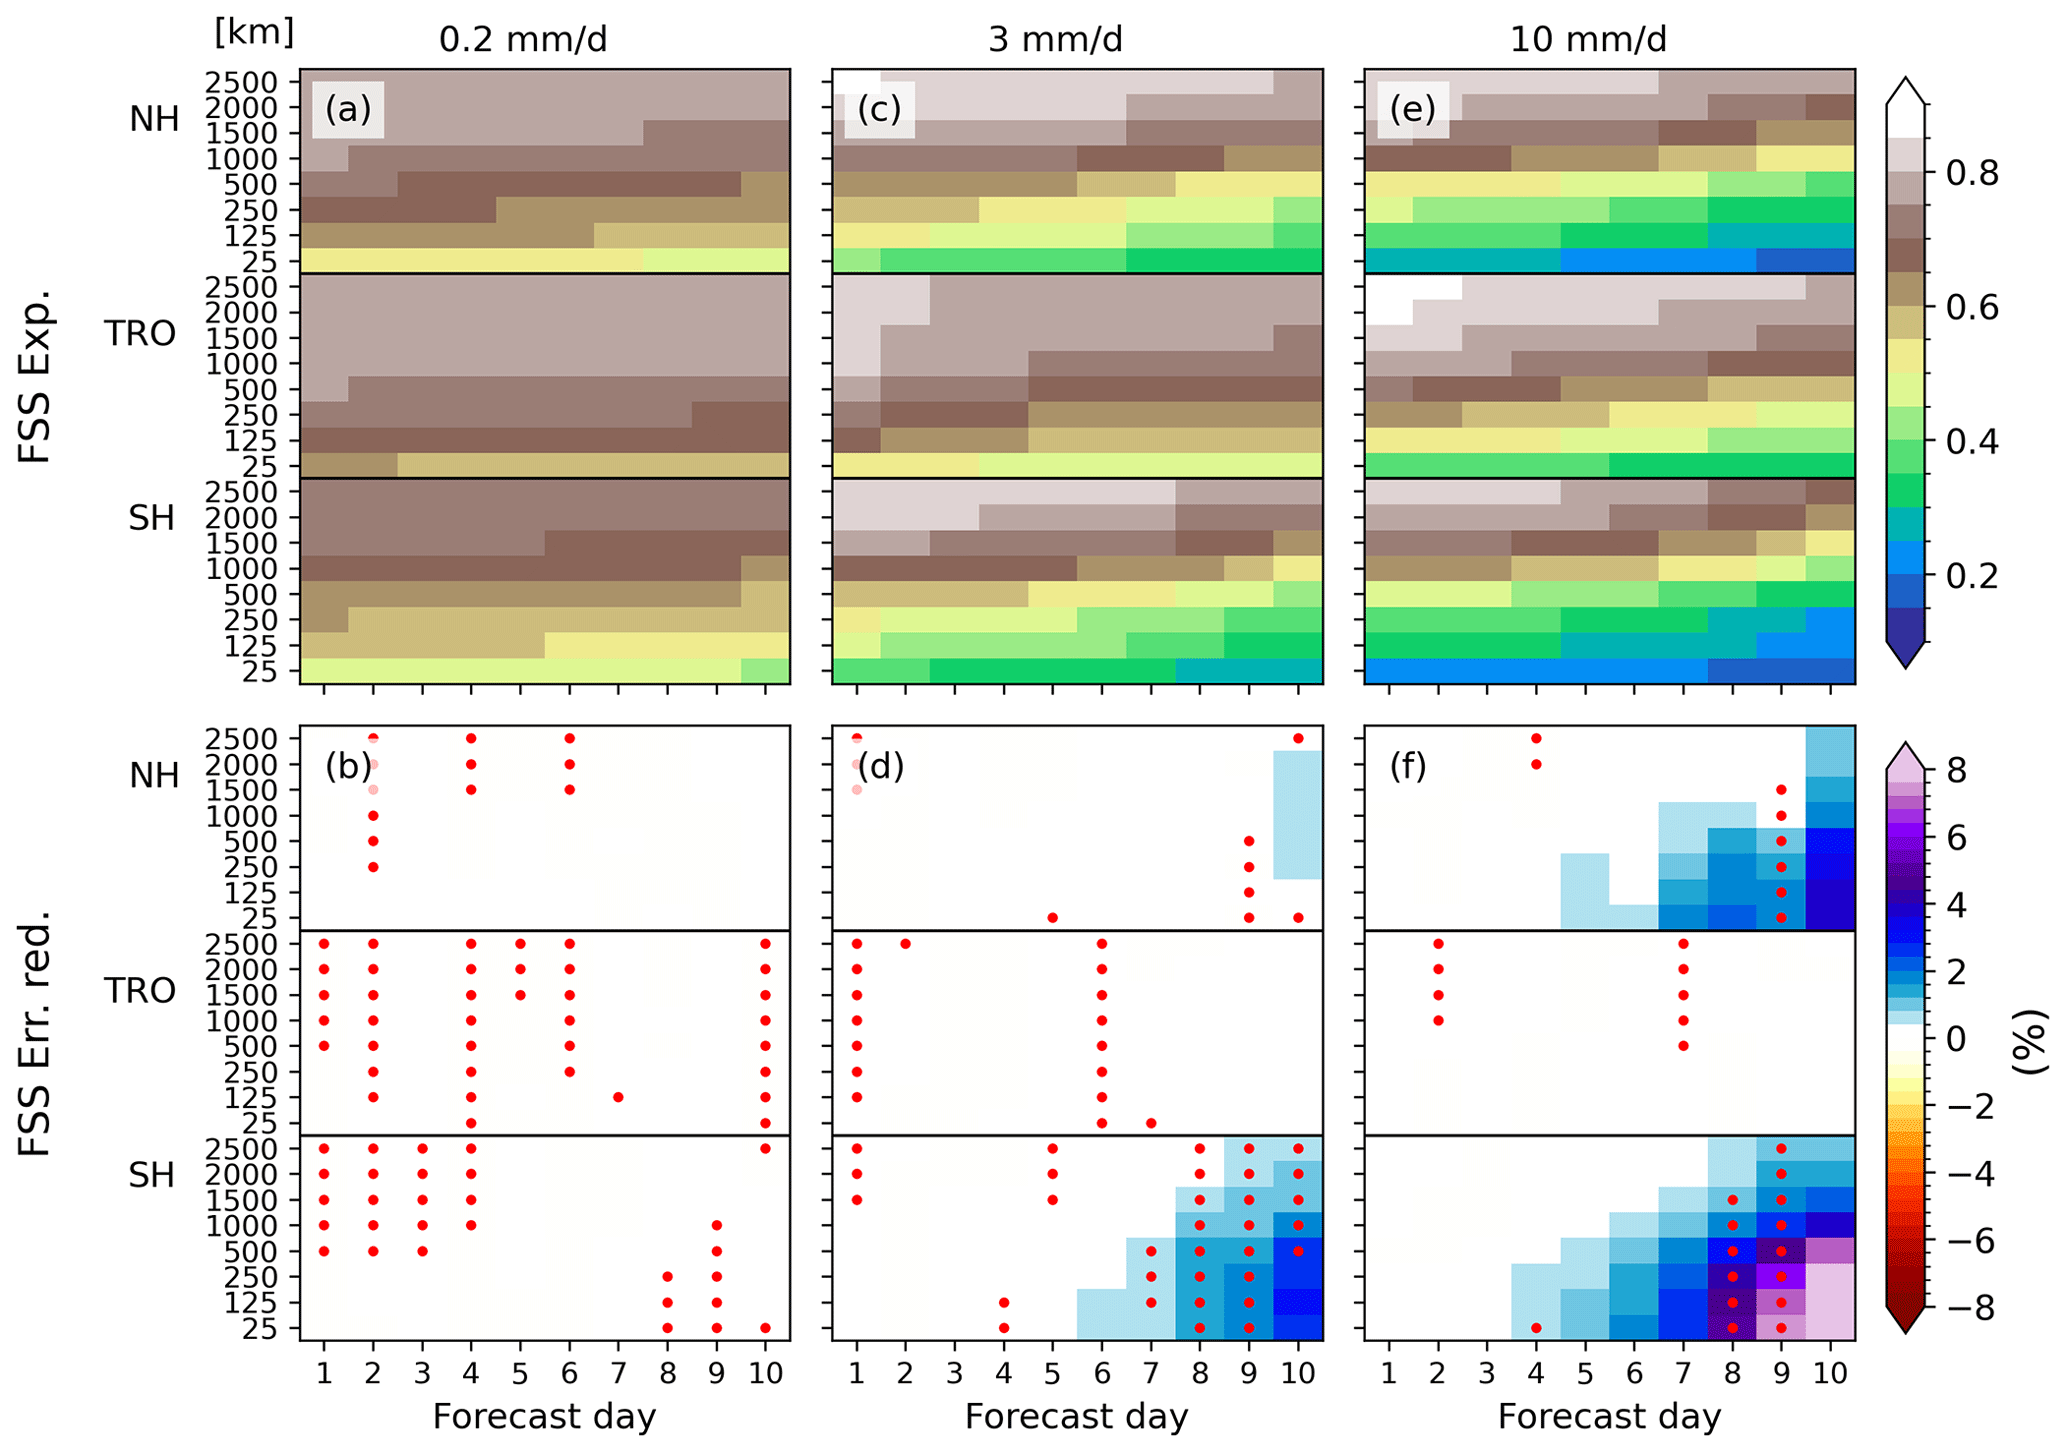
Figure 6(a, c, e) Fraction Score (FSS, absolute values) of the experiment assimilating Aeolus (Exp), displayed across different scales and regions (Northern Hemisphere (NH), Tropics (TRO) and Southern Hemisphere (SH)) for thresholds of 0.2 mm d−1 (a), 3 mm d−1 (c), and 10 mm d−1 (e). (b, d, f) Relative improvement in FSS (%) due to Aeolus assimilation, computed as the percentage difference between Exp and the control experiment (CTRL), presented in the same format. Red dots indicate statistically significant improvements at the 95 % confidence level (paired t-test).
FSS values decrease with increasing precipitation thresholds and decreasing spatial scales (Fig. 6a, c, e), reflecting the increasing difficulty of accurately forecasting heavier precipitation at finer scales. This behavior is particularly pronounced in the extratropics (Fig. 6b, d, f).
The assimilation of Aeolus winds shows a clear positive impact in both hemispheres, with the SH exhibiting the most consistent and substantial improvements, particularly at small and medium spatial scales. At higher thresholds (10 mm d−1), FSS improvements emerge as early as forecast day 4 at the smallest scales (approximately 25 km), reaching more than 8 % by day 10. At lower thresholds (0.2 mm d−1), no visible improvement is detected, indicating negligible impact on light precipitation. The spatial structure of the improvements indicates that gains are largest where forecast skill is low (FSS < 0.5). Moreover, the range of affected scales broadens with forecast days, eventually encompassing the largest scales (approximately 2500 km) by day 5. Statistically significant improvements are most evident for days 7–10 at the 3 mm d−1 threshold and for days 8–9 at 10 mm d−1, suggesting that Aeolus contributes to a better representation of heavy rainfall events in the SH, likely due to the limited availability of in situ wind observations in this region.
In the NH, the response is qualitatively similar but weaker in magnitude. The largest improvements occur for the 10 mm d−1 threshold after forecast day 5, exceeding 2 % beyond day 7. In contrast, at lower thresholds (0.2 and 3 mm d−1), no appreciable impact is observed, suggesting that Aeolus assimilation exerts little influence on light precipitation while providing clearer benefits for intense rainfall events.
In the Tropics, Aeolus assimilation has negligible impact across all thresholds, with error reductions close to zero and no discernible spatial or temporal pattern. Although isolated areas exhibit statistically significant signals, their magnitude remains minimal, indicating that the significance arises from small but systematic differences rather than from substantial forecast improvements.
3.2.2 Categorical Dependence: Stable Equitable Error in Probability Space (SEEPS)
Having assessed the impact of Aeolus assimilation on precipitation forecasts using the FSS, which revealed the largest improvements at the grid scale, we now examine a grid-scale categorical verification metric, SEEPS, to further quantify forecast skill.
Figure 7 presents the relative error reduction in SEEPS (brown line), alongside the corresponding reduction in RMSE of rainfall forecasts (red line), with RMSE values aggregated to a 1° grid to reduce the double-penalty effect commonly seen in precipitation verification. Statistical significance is indicated by dots (significant) and crosses (not significant). In addition, the colored bars identify the dominant precipitation category (dry, light, or heavy) contributing to changes in the SEEPS score at each forecast day. Overall, the average impact of Aeolus assimilation on precipitation forecasts, as measured by SEEPS and RMSE over the full study period, is relatively modest. In the NH (Fig. 7a), SEEPS improvements remain close to zero across all forecast days, although most values are statistically significant. The RMSE of rainfall forecasts exhibits minor fluctuations around zero, indicating limited and inconsistent forecast improvement in this region. In the Tropics (Fig. 7b), SEEPS shows predominantly non-significant changes during the first five days. From day 6 onwards, small but statistically significant improvements emerge, reaching approximately 0.03 % by day 9. However, no precipitation forecast category dominates the contribution to this improvement. The corresponding RMSE displays a similarly variable pattern with no strong trend, highlighting the challenge of achieving consistent forecast gains in convectively active regions. In contrast, the SH (Fig. 7c) demonstrates more coherent improvements. Statistically significant increases in SEEPS become evident from day 4 onward, rising steadily to about 0.15 % by day 9. Notably, from days 7 to 10, the SEEPS gains are primarily driven by improvements in the OHFD (Observed Heavy, Forecast Dry) category, suggesting that Aeolus contributes to reducing false dry and light forecasts during heavy precipitation events. The rainfall RMSE in the SH also shows a clear signal of consistent and significant improvements from day 3 to day 9, averaging around 0.05 %.
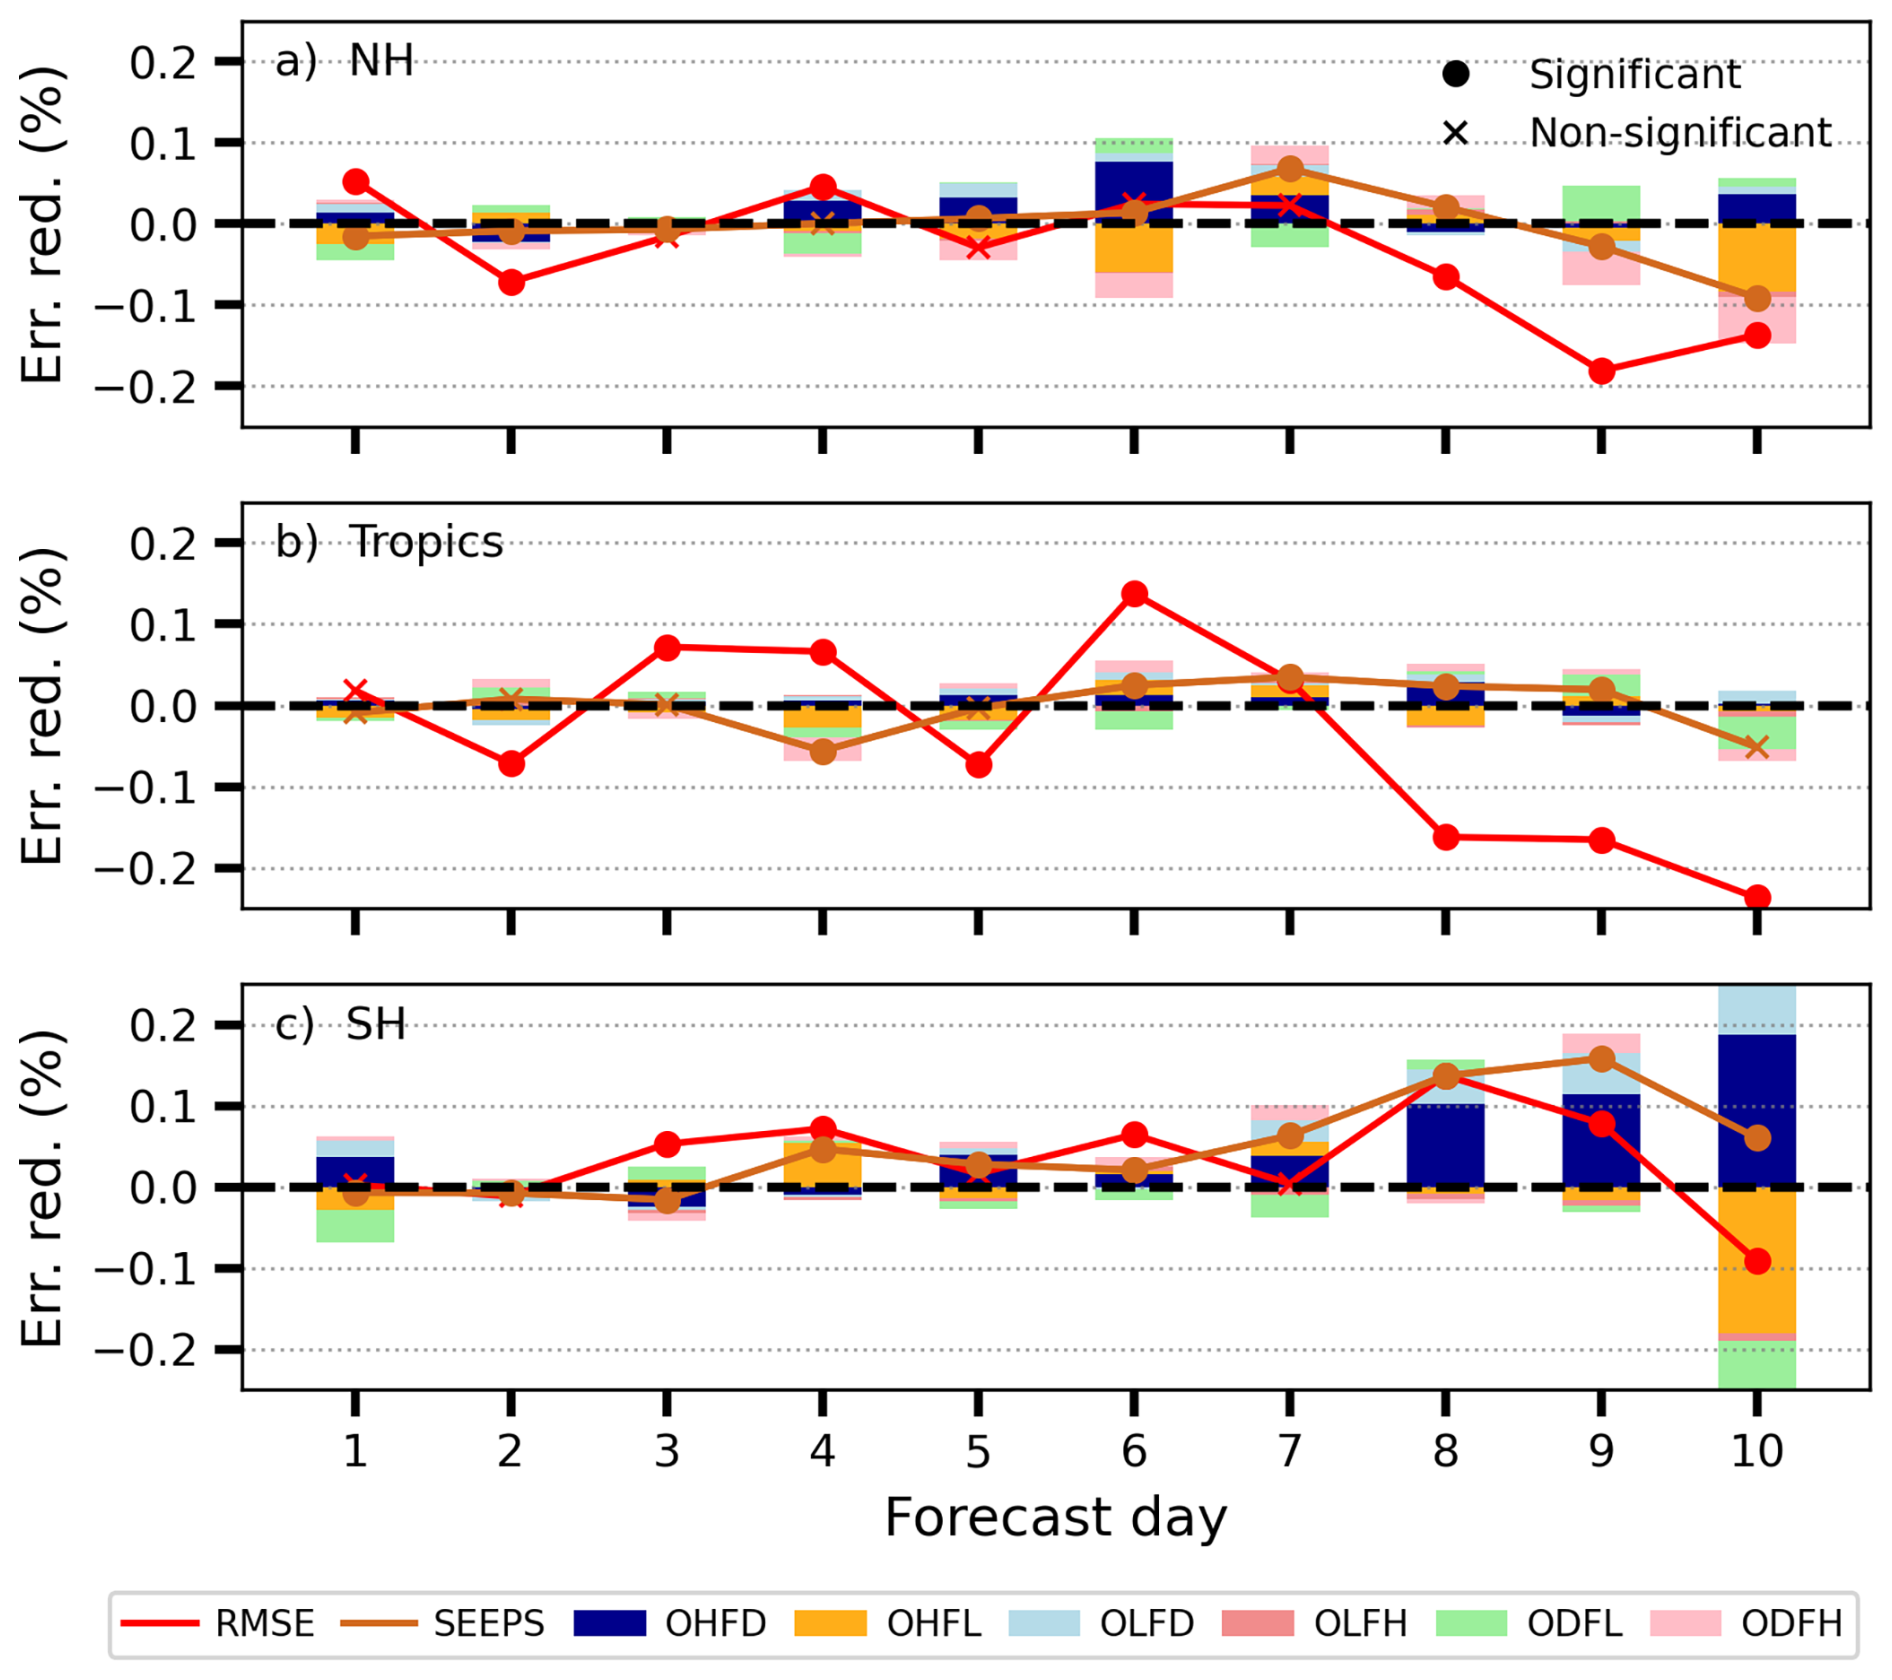
Figure 7Relative improvement in RMSE (red line) and SEEPS score (brown line), alongside the SEEPS score subcategories (bars), when assimilating Aeolus for different regions: Northern Hemisphere (20–60° N) (a), Tropics (20° S–20° N) (b), and Southern Hemisphere (20–60° S) (c). The scores are expressed as percentages, with positive values indicating a benefit from Aeolus assimilation. Circles indicate statistically significant results, while crosses denote non-significant scores.
Figure 8 presents the geographical distribution of relative changes in the SEEPS score across forecast days. Overall, the impact of Aeolus assimilation on precipitation forecasts is spatially heterogeneous, with no region showing consistently strong or persistent signals. However, the amplitude of relative score variations is notably larger in the Tropics compared to the NH and SH during the first three forecast days, suggesting greater forecast sensitivity in this region. While patterns of error reduction vary over time, some regions show notable early improvements. For example, at forecast days 1 and 2 (Fig. 8a, b), localized enhancements in SEEPS of up to 1 % are seen over northeastern Africa, a climatologically rather dry area. These early tropical signals are consistent with the dry-region patterns identified in Fig. 1 and correspond to the upper-tropospheric zonal wind improvements shown in Fig. 3a. At longer forecast days, particularly after day 7, more pronounced improvements are observed in the SH, especially over the Southern Ocean.
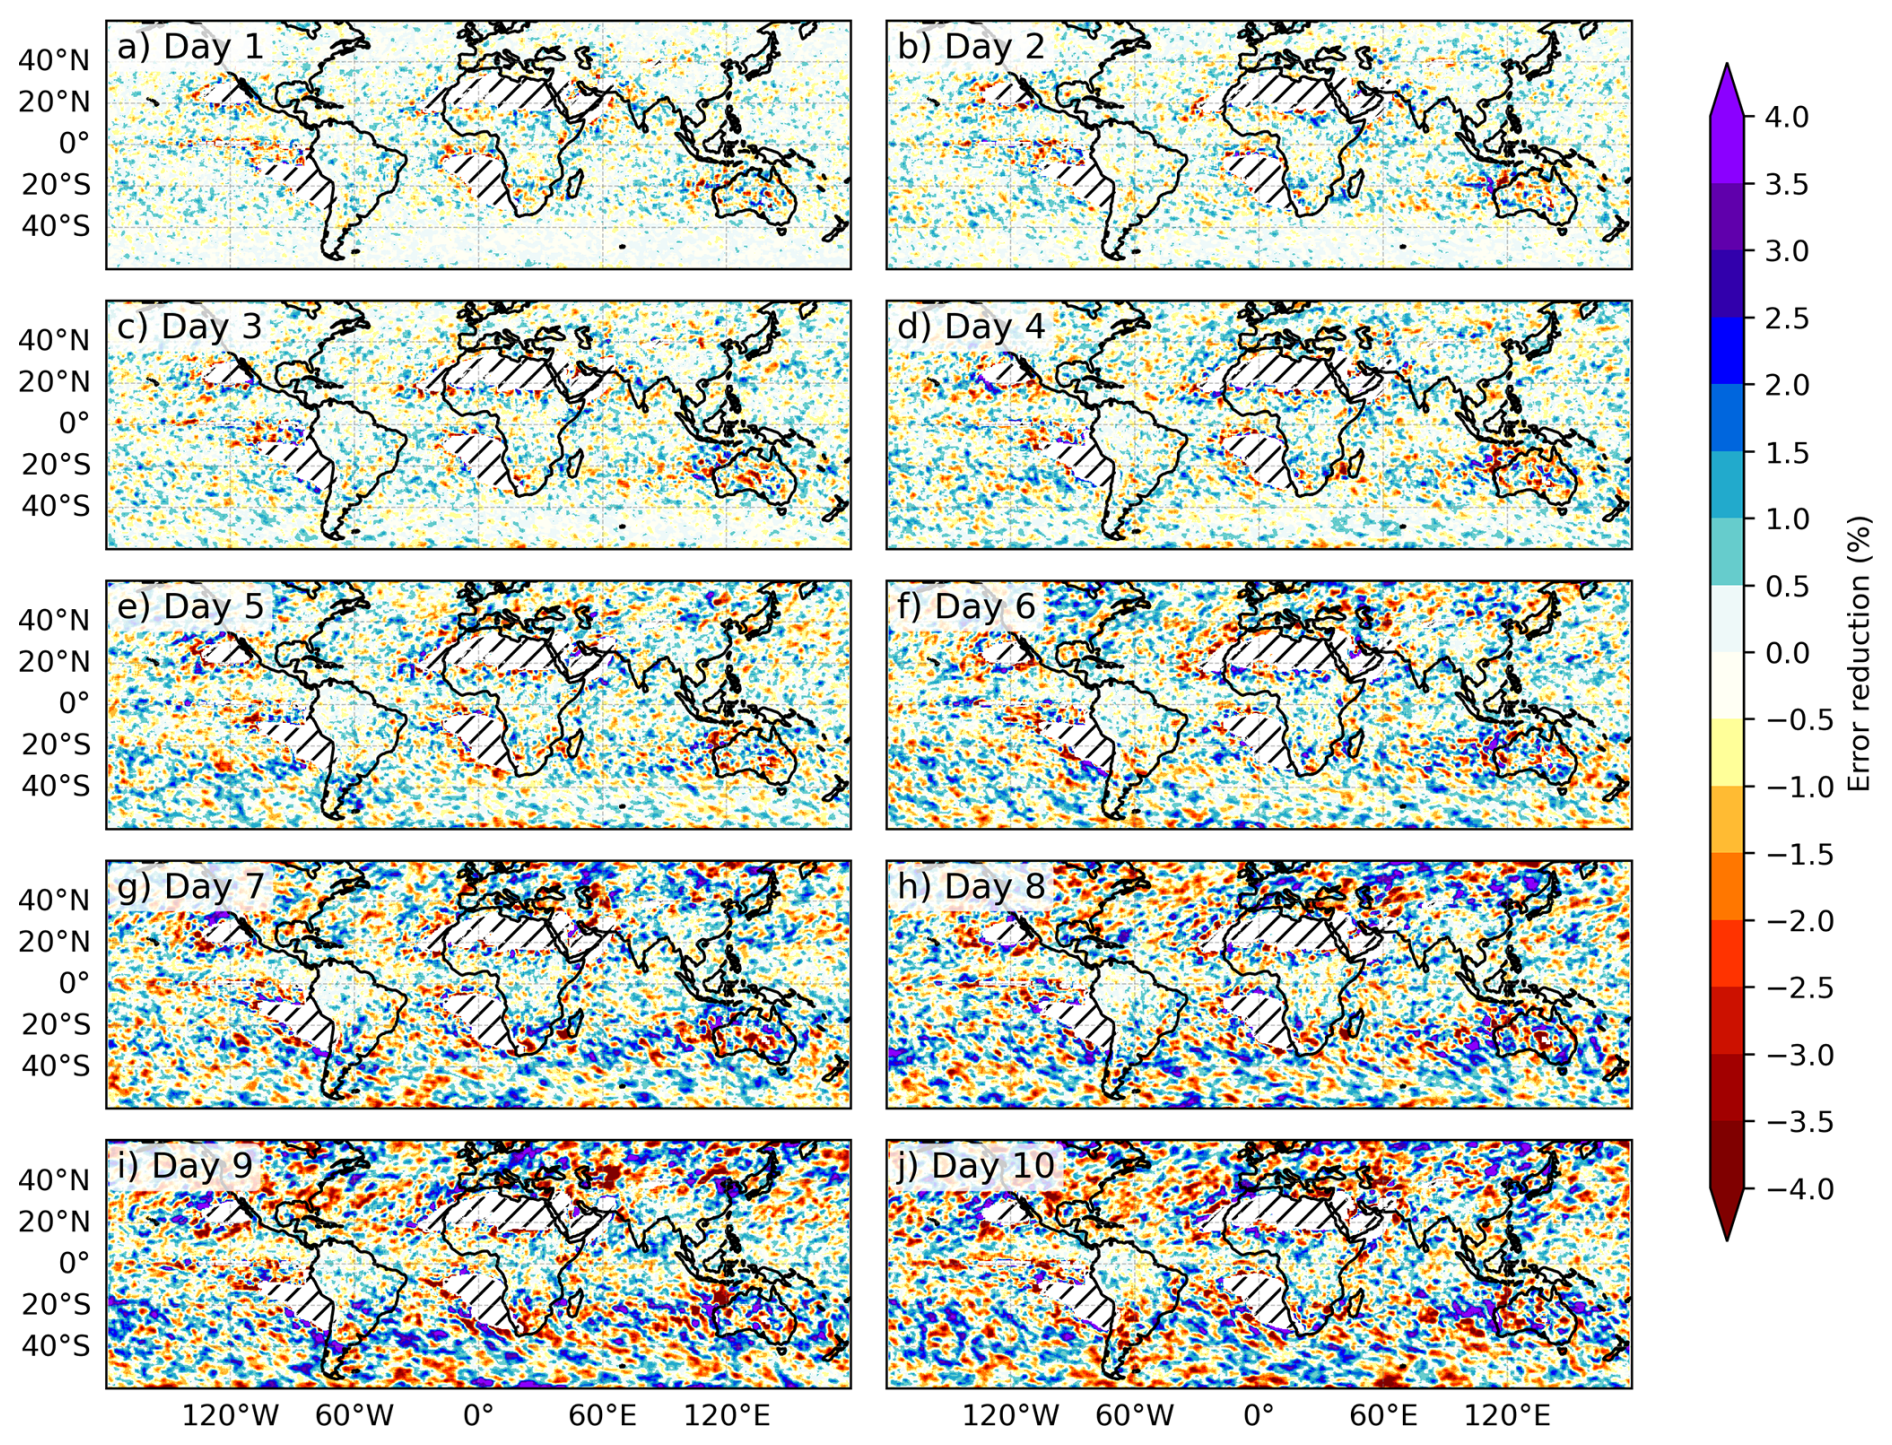
Figure 8SEEPS error reduction for forecast days 1 to 10. Positive values indicate forecast improvement, following the convention defined in Sect. 2.2.1, where relative SEEPS improvement is computed as . A 5-grid-point rolling window has been applied to spatially smooth the signal and reduce noise. Hatched white areas denote regions where the probability of dry conditions exceeds 85 % throughout the year (see Fig. 1).
These gains align with the positive trends seen in Fig. 7c, highlighting Aeolus's extended-range contribution to precipitation forecast in this region.
Next, we assess changes in ECMWF categorical precipitation forecasts. Figure 9 presents the relative changes in the proportion of correctly predicted precipitation categories for ODFD (a), OLFL (b), and OHFH (c), which represent correct forecasts of dry, light, and heavy precipitation, respectively. The evaluation is performed across the Tropics, Northern Hemisphere (NH), Southern Hemisphere (SH), and globally (TOT). Importantly, this analysis includes all available forecast–observation pairs, including cases where the probability of dryness exceeds 0.85 %. This ensures a more complete assessment of categorical forecast performance, beyond the subset used for SEEPS. Statistical significance of the differences is assessed using a χ2 test, with circles indicating significant improvement and crosses indicating non-significant changes. For the ODFD category (Observed Dry Forecast Dry), a small but statistically significant increase across all regions (up to 0.02 %) is observed at forecast days 2 and 3, followed by a decline between days 4–7, and a modest rise again toward day 9.
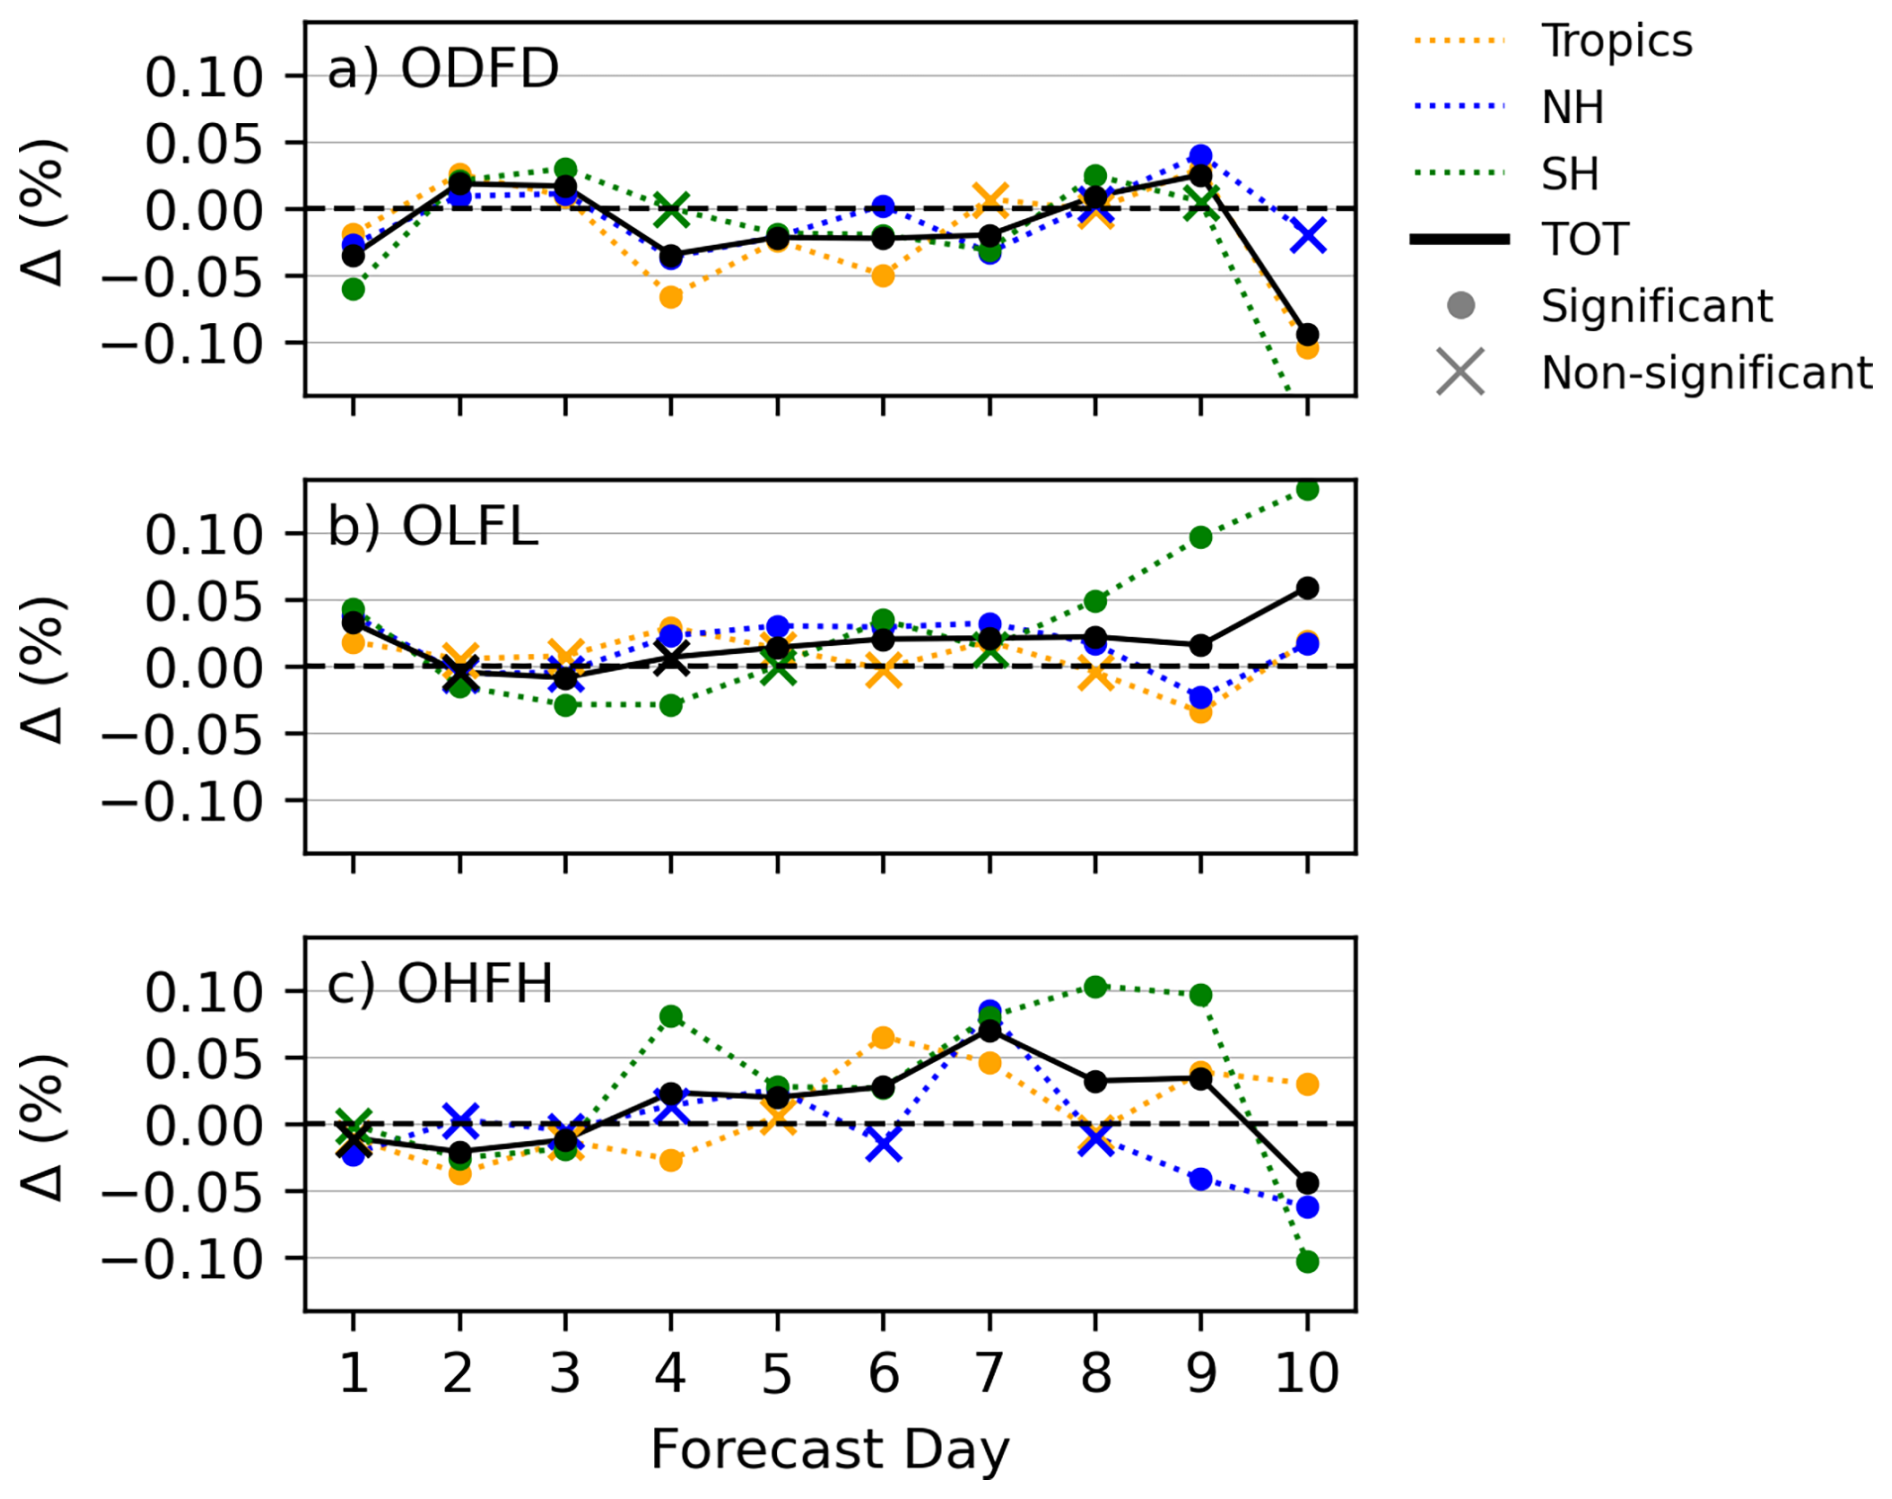
Figure 9Change in correct rain category forecasts (%) with Aeolus wind assimilation over forecast day for ODFD (a), OLFL (b), and OHFH (c), relative to total OD, OL, and OH events, respectively. Results are shown for the Tropics (orange), NH (blue), SH (green), and global (black). Circles indicate statistically significant changes (p<0.05) based on a χ2 test; crosses denote non-significant changes.
The OLFL category (Observed Light Forecast Light) shows a more sustained improvement, starting around day 4 and increasing gradually to 0.05 % by day 9. The enhancement is most pronounced in the NH during early leads, while the SH reveals a modest degradation for days 2–4 followed by increased improvement at longer forecast days, reaching up to 0.15 % by day 10. Changes in the tropics are inconsistent between forecast days and often rather small. Here light rain often occurs at the edges of convective systems, e.g. in the stratiform part of big organized clusters. The lack of improvement therefore, once again, appears to reflect the difficulty to forecast tropical convection in a more general sense.
The OHFH category (Observed Heavy Forecast Heavy) displays the most substantial and statistically significant gains. An increase begins around day 4, peaking near 0.07 % at day 7, then slightly tapering off by day 10. The signal is primarily driven by the SH and the Tropics, while NH improvements remain more modest. These results suggest that Aeolus assimilation improves the prediction of heavy precipitation events.
3.2.3 Seasonal Dependence of Precipitation Forecast Improvements
Figure 10 presents the seasonal impact of assimilating Aeolus wind profiles on precipitation forecast error reduction, assessed using SEEPS and FSS metrics, for the extended boreal winter (NDJFMA) and summer (MJJASO) periods.
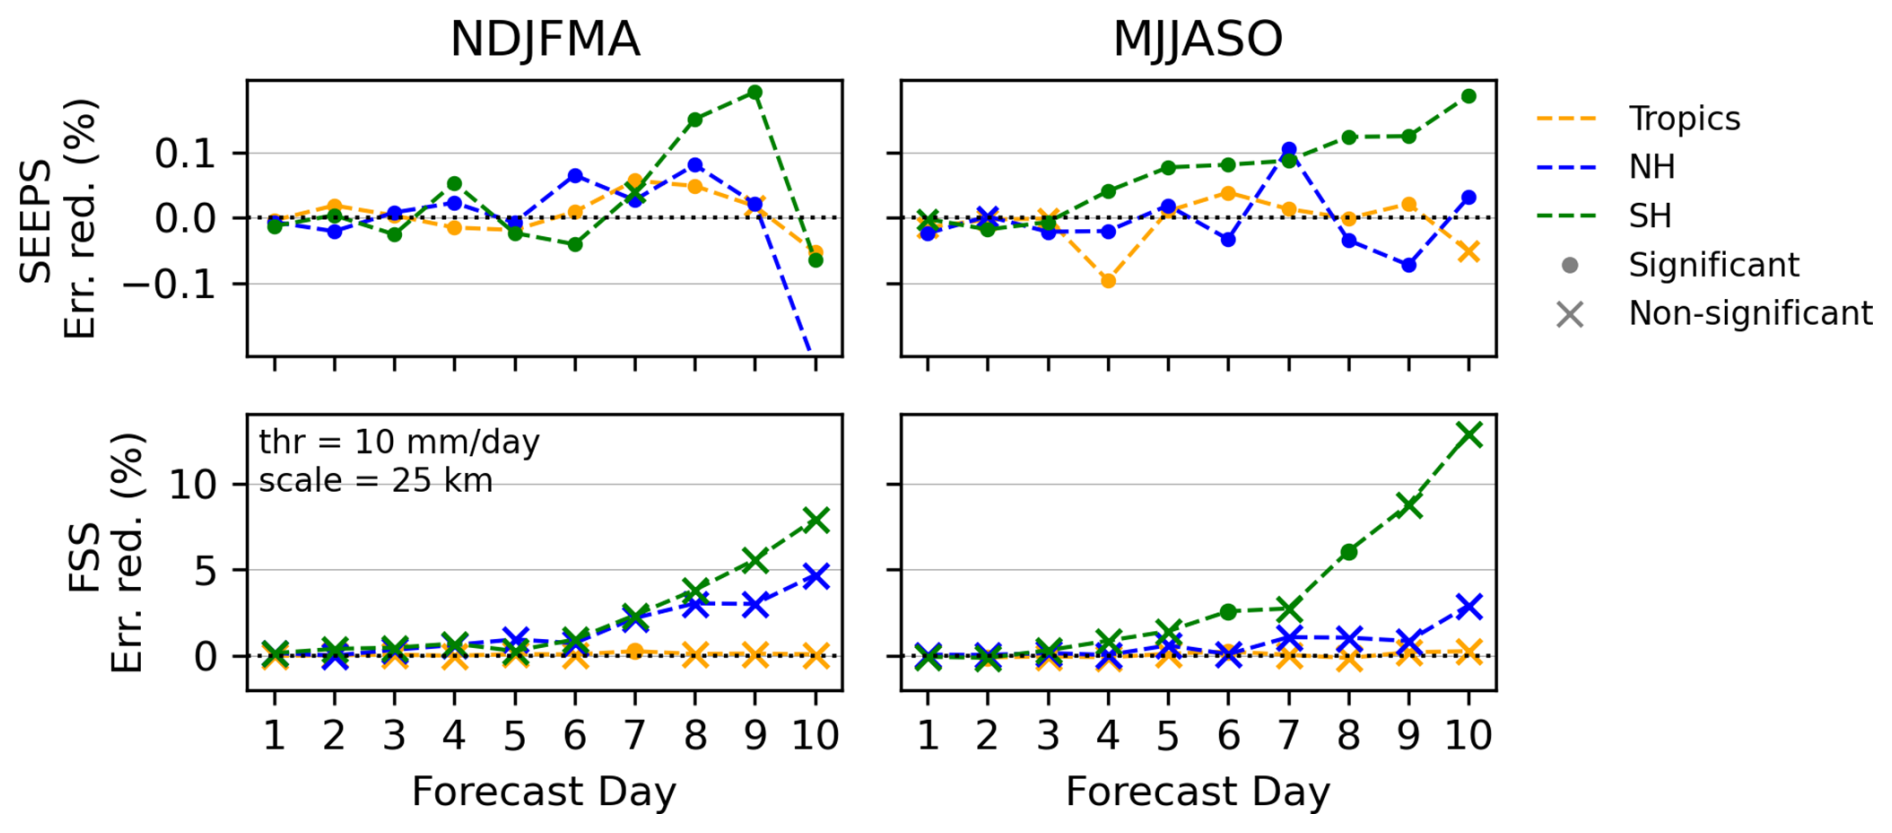
Figure 10SEEPS (top) and FSS (bottom) error reduction for NDJFMA (left) and MJJASO (right) seasons, shown by forecast day (1–10) across three regions: Tropics, NH, and SH. Dots indicate statistically significant improvements, and crosses denote non-significant differences. FSS is computed using a 10 mm d−1 threshold and 25 km spatial scale.
In the NH, forecast improvements are notably greater during the extended boreal winter season. SEEPS error reduction becomes statistically significant after forecast day 3, peaking at approximately 0.08 % by day 6. Similarly, FSS shows meaningful improvements from day 5 onward, reaching around 5 % error reduction by day 10. In contrast, during the extended summer season, SEEPS displays more variable error reduction, with only modest improvements. FSS shows a slight increase after day 7, rising from about 1 % to 3 % by day 10. This pronounced seasonal dependence likely reflects the dominance of baroclinic systems during boreal winter, which are more dynamically predictable and highly sensitive to initial condition errors in the wind field. The presence of a stronger, more coherent polar jet stream during winter enhances the value of accurate upper-tropospheric wind observations, such as those provided by Aeolus. This interpretation is supported by the marked improvement in NH zonal wind forecasts during NDJFMA (Fig. 4), suggesting that enhanced wind initializations translate into more skillful precipitation forecasts under wintertime dynamics. During extended summer, weaker dynamical forcing result in lower predictability and smaller, less consistent forecast gains.
In the SH, the seasonal pattern is largely consistent with that of the NH. While some marginal improvement is observed in the extended austral summer (NDJFMA), forecast gains are notably greater during the extended austral winter (MJJASO). SEEPS improvements become detectable from day 4 (∼ 0.05 %) and steadily increase to 0.2 % by day 10, while FSS improvements rise sharply from 1 % to 15 %. These gains coincide with marked improvements in SH zonal wind forecasts (Fig. 4). This enhanced performance is likely linked to the stronger SH jet stream, especially over the large ocean areas where conventional observations are limited. Aeolus thus provides a valuable source of upper-level wind data over the SH oceans, improving the representation of dynamically active regions such as mid-latitude storm tracks, and consequently leading to more skillful precipitation forecasts.
In the Tropics, improvements are generally weaker and less seasonally dependent. SEEPS shows modest gains after day 6 in both NDJFMA and MJJASO, but FSS indicates negligible error reduction. This likely reflects the inherent predictability limits of tropical convection, which is strongly influenced by mesoscale and sub-grid processes such as moist convection and diurnal heating, phenomena that are less sensitive to synoptic-scale wind information.
This study evaluates the impact of assimilating Aeolus wind profiles on both wind and precipitation forecast performance within the European Centre for Medium-Range Weather Forecasts (ECMWF) Integrated Forecasting System (IFS). Based on a three-year Observing System Experiment (OSE) using Baseline 16 of the fourth reprocessing dataset, the results highlight significant improvements in upper-tropospheric wind forecasts and demonstrate downstream benefits for precipitation forecasts in some regions and seasons.
Aeolus has its strongest influence on wind fields in the upper troposphere and lower stratosphere of the tropics, where conventional wind data are limited and mass fields provide only weak constraints. In this region, zonal wind forecast errors decrease by as much as 1 % during the first week of the forecast, with particularly clear benefits over the Maritime Continent, the tropical Atlantic–African sector near the Tropical Easterly Jet, and the eastern Pacific. The strongest gains occur in climatologically dry areas, where conventional wind data are limited, no cloud-motion vector winds exist, and reduced cloud contamination further improves measurement quality. Seasonal variations in the troposphere are small, since tropical circulation is more strongly controlled by EWs and convection than by the annual cycle. While some tropical wave signals and larger-scale organized convection may benefit from the improved winds, most tropical rainfall remains convective and highly stochastic, such that impacts on precipitation are modest. The chosen verification metrics may not fully capture small-scale improvements: SEEPS improvements appear only after Forecast day 7 and remain near 0.03 %, while Fraction Skill Score (FSS) picks up a slight but consistent signal at thresholds above 10 mm d−1, reaching about 0.1 %.
The largest impacts in the Southern Hemisphere (SH) occur during the extended austral winter (May to October) when the polar jet strengthens and becomes more zonal. In this season, zonal wind error declines by more than 1.5 % in the troposphere and the reduction gradually propagates upward into the stratosphere by day 10. These dynamical improvements are also propagated into the precipitation forecasts. The FSS, which is highly sensitive to the spatial organization of rainfall, exhibits clear improvements, particularly at the grid scale and for heavy precipitation and long forecast days. During the austral winter season, gains appear as early as day 3, exceed 2 % by day 8, and reach approximately 15 % by day 10. The SEEPS metric corroborates these results, showing a steady reduction in categorical errors from around 0.05 % at day 3 to 0.2 % by day 10. At the grid scale, FSS improvements for heavy rainfall reflect improved spatial placement, whereas SEEPS, which accounts for all rainfall categories, exhibits smaller yet consistent gains, indicating overall improvements in both the spatial distribution and categorical accuracy of precipitation forecasts. While no direct causal relationship is established, the spatial and seasonal alignment of wind and precipitation improvements points to a coherent large-scale pattern that may reflect the organization of jet streams, Rossby waves, and synoptically driven cyclones and fronts. These gains are particularly pronounced in the SH partly due to the sparse conventional wind and radiosonde network (Durre et al., 2018), which likely increases the relative impact of Aeolus observations compared to better-observed regions.
In the Northern Hemisphere (NH), the impact on zonal wind forecast is generally weaker than in the SH, but follows a similar seasonal pattern. One possible reason is that the NH jet tends to be less zonal and more dynamically variable, which may reduce the benefit from Aeolus wind observations, in addition to the already dense conventional observing network. During the extended boreal winter (December–February), when storm tracks are most active and the polar jet reaches peak strength, wind forecast error declines by about 1 % in the troposphere during the first week of the forecast. These gains translate into small but consistent improvements in rainfall categories, with SEEPS rising to around 0.05 % by day 10. FSS shows gains of about 2 % for heavy rainfall thresholds above 10 mm d−1 at grid-scale after forecast day 7–8. Similar to the SH, the co-occurrence of improvements in the NH is most pronounced during winter, the time of stronger storm track activity. During boreal summer, when storm tracks are weaker and large-scale wind–rain coupling is reduced, the benefits are smaller and more variable.
Although the absolute magnitude of the precipitation improvements is typically in the percent range, it is statistically robust and operationally relevant given the already high baseline skill of the ECMWF forecasting system. Importantly, the largest FSS gains occur at spatial scales and lead times where the baseline FSS is around or below 0.5, corresponding to forecasts with limited skill and those approaching useful performance. While these improvements are strongest at smaller spatial scales, where skill tends to degrade most rapidly with lead time, they also extend toward larger spatial scales. This indicates that Aeolus wind assimilation contributes to improve precipitation predictability across a range of spatial scales, including those of greatest relevance for medium-range forecasting.
Aeolus has demonstrated substantial benefits for NWP, particularly notable for a single satellite instrument with limited horizontal coverage. The strongest downstream impacts are found during winter in both hemispheres, when jet dynamics play a central role in storm development. The co-occurrence of wind and precipitation improvements during these seasons suggests a possible link between more accurate wind initial conditions and better predictability of synoptically driven systems, including cyclones and fronts, which may in turn contribute to improved heavy rainfall. They also highlight the importance of sustaining and extending satellite wind lidar missions to further advance global weather forecasting.
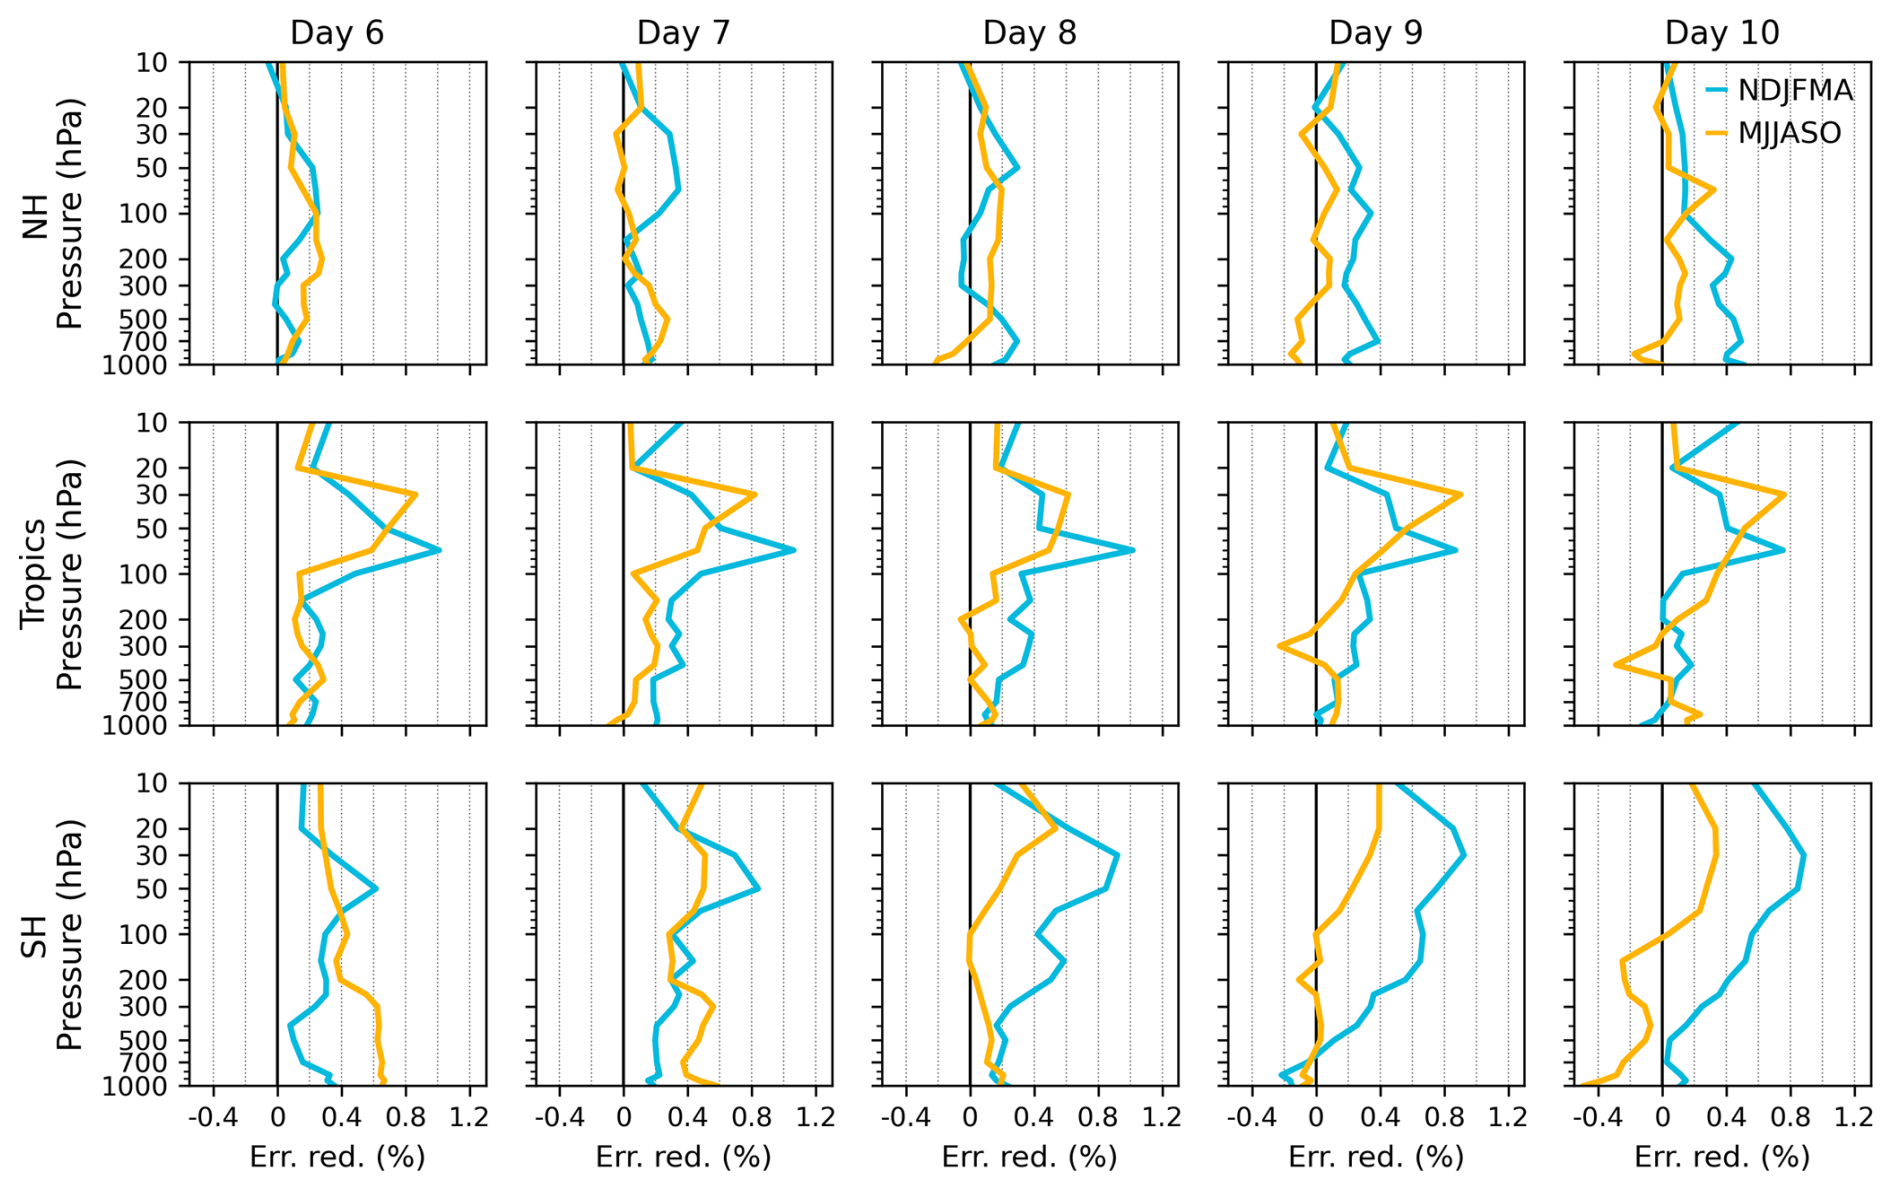
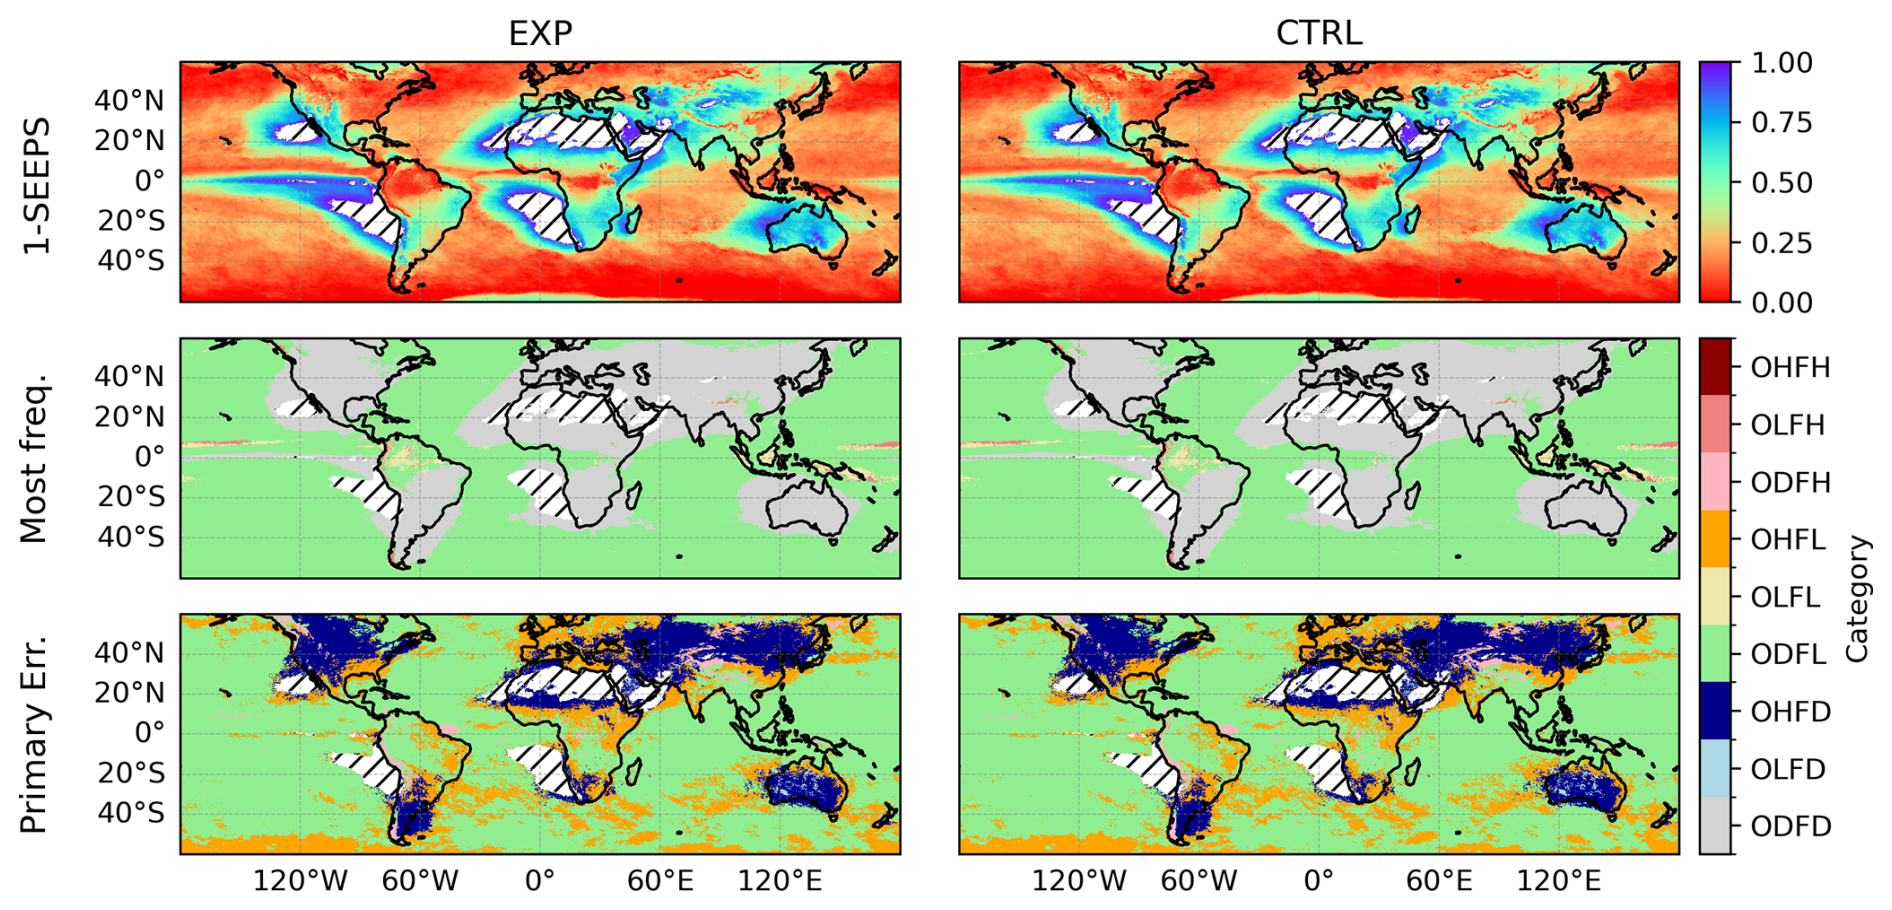
Figure A2Day-3 precipitation forecast performance comparing the experiment with Aeolus wind assimilation (EXP, left column) to the control without Aeolus data (CTRL, right column). The top panels show the 1-SEEPS score, where values near 1 represent higher forecast. The middle panels illustrate the most frequently occurring observation–forecast category. The bottom panels identify the primary observation–forecast category that contributes most significantly to the SEEPS errors.
The analysis was conducted using the Python language and the code can be provided on request.
The forecast data from the Observing System Experiment (OSE), were provided by the European Centre for Medium-Range Weather Forecasts (ECMWF). Aeolus HLOS wind data (Rayleigh and Mie) are available at https://aeolus.services (last access: 6 March 2026). ERA5 reanalysis data are openly available from the Copernicus Climate Data Store (https://cds.climate.copernicus.eu/, last access: 6 March 2026). Precipitation observations from the Global Precipitation Measurement (GPM) mission, including the Integrated Multi-satellite Retrievals for GPM (IMERG) product, are freely accessible via NASA's Precipitation Measurement Missions (PMM) archive (https://pmm.nasa.gov/, last access: 6 March 2026). More information and download instructions are available on the respective data portals.
MB, PK, and MW conceptualized the study and developed the methodology. MR performed the Observing System Experiments. PK provided funding acquisition and project supervision. MB was responsible for data curation, conducted the formal analysis, and wrote the original draft of the manuscript. All authors contributed to the interpretation of the results and reviewed and edited the manuscript.
At least one of the (co-)authors is a member of the editorial board of Weather and Climate Dynamics. The peer-review process was guided by an independent editor, and the authors also have no other competing interests to declare.
Publisher's note: Copernicus Publications remains neutral with regard to jurisdictional claims made in the text, published maps, institutional affiliations, or any other geographical representation in this paper. The authors bear the ultimate responsibility for providing appropriate place names. Views expressed in the text are those of the authors and do not necessarily reflect the views of the publisher.
We gratefully acknowledge the European Space Agency (ESA) for providing the Aeolus wind profile observations, and the European Centre for Medium-Range Weather Forecasts (ECMWF) for generating and sharing the observing system experiment (OSE) datasets. Their support and infrastructure made this research possible.
This research has been supported by the Deutsche Forschungsgemeinschaft (grant no. SFB/TRR 165 (B6)).
The article processing charges for this open-access publication were covered by the Karlsruhe Institute of Technology (KIT).
This paper was edited by Dariusz Baranowski and reviewed by two anonymous referees.
Baker, W. E., Atlas, R., Cardinali, C., Clement, A., Emmitt, G. D., Gentry, B. M., Hardesty, R. M., Källén, E., Kavaya, M. J., Langland, R., Ma, Z., Masutani, M., McCarty, W., Pierce, R. B., Pu, Z., Riishojgaard, L. P., Ryan, J., Tucker, S., Weissmann, M., and Yoe, J. G.: Lidar-measured wind profiles: The missing link in the global observing system, B. Am. Meteorol. Soc., 95, 543–564, 2014. a, b
Bauer, P., Geer, A. J., Lopez, P., and Salmond, D.: Direct 4D-Var assimilation of all-sky radiances. Part I: Implementation, Q. J. Roy. Meteor. Soc., 136, 1868–1885, 2010. a
Bechtold, P., Semane, N., Lopez, P., Chaboureau, J.-P., Beljaars, A., and Bormann, N.: Representing equilibrium and nonequilibrium convection in large-scale models, J. Atmos. Sci., 71, 734–753, 2014. a
Bonafoni, S., Biondi, R., Brenot, H., and Anthes, R.: Radio occultation and ground-based GNSS products for observing, understanding and predicting extreme events: A review, Atmos. Res., 230, 104624, https://doi.org/10.1016/j.atmosres.2019.104624, 2019. a
Borne, M., Knippertz, P., Weissmann, M., Martin, A., Rennie, M., and Cress, A.: Impact of Aeolus wind lidar observations on the representation of the West African monsoon circulation in the ECMWF and DWD forecasting systems, Q. J. Roy. Meteor. Soc., 149, 933–958, 2023. a, b, c
Borne, M., Knippertz, P., Weissmann, M., Witschas, B., Flamant, C., Rios-Berrios, R., and Veals, P.: Validation of Aeolus L2B products over the tropical Atlantic using radiosondes, Atmos. Meas. Tech., 17, 561–581, https://doi.org/10.5194/amt-17-561-2024, 2024. a
Bouttier, F. and Kelly, G.: Observing-system experiments in the ECMWF 4D-Var data assimilation system, Q. J. Roy. Meteor. Soc., 127, 1469–1488, 2001. a
Campbell, I. and Renwick, J. A.: Southern Hemisphere storm tracks and large-scale variability: What do the latest reanalyses say?, J. Climate, 36, 5549–5567, 2023. a
Chou, C.-C. and Kushner, P. J.: Scale-dependent impact of Aeolus winds on a global forecast system, Q. J. Roy. Meteor. Soc., 150, 373–387, 2024. a
De Meutter, P., Gerard, L., Smet, G., Hamid, K., Hamdi, R., Degrauwe, D., and Termonia, P.: Predicting small-scale, short-lived downbursts: Case study with the NWP limited-area ALARO model for the Pukkelpop thunderstorm, Mon. Weather Rev., 143, 742–756, 2015. a
Derin, Y. and Yilmaz, K. K.: Evaluation of multiple satellite-based precipitation products over complex topography, J. Hydrometeorol., 15, 1498–1516, 2014. a
Derin, Y., Anagnostou, E., Berne, A., Borga, M., Boudevillain, B., Buytaert, W., Chang, C.-H., Chen, H., Delrieu, G., Hsu, Y. C., Lavado-Casimiro, W., Manz, B., Moges, S., Nikolopoulos, E., Sahlu, D., Salerno, F., Rodríguez-Sánchez, J.-P., Vergara, H., and Yilmaz, K.: Evaluation of GPM-era global satellite precipitation products over multiple complex terrain regions, Remote Sens., 11, 2936, https://doi.org/10.3390/rs11242936, 2019. a
Dinku, T., Connor, S. J., and Ceccato, P.: Comparison of CMORPH and TRMM-3B42 over mountainous regions of Africa and South America, Satellite rainfall applications for surface hydrology, 193–204, https://doi.org/10.1007/978-90-481-2915-7_11, 2010. a
Dong, B., Sutton, R. T., Woollings, T., and Hodges, K.: Variability of the North Atlantic summer storm track: mechanisms and impacts on European climate, Environ. Res. Lett., 8, 034037, https://doi.org/10.1088/1748-9326/8/3/034037, 2013. a
Durre, I., Yin, X., Vose, R. S., Applequist, S., and Arnfield, J.: Enhancing the data coverage in the integrated global radiosonde archive, J. Atmos. Ocean. Tech., 35, 1753–1770, 2018. a, b
Ebert, E. E.: Fuzzy verification of high-resolution gridded forecasts: a review and proposed framework, Meteorol. Appl., 15, 51–64, 2008. a
Ern, M., Diallo, M. A., Khordakova, D., Krisch, I., Preusse, P., Reitebuch, O., Ungermann, J., and Riese, M.: The quasi-biennial oscillation (QBO) and global-scale tropical waves in Aeolus wind observations, radiosonde data, and reanalyses, Atmos. Chem. Phys., 23, 9549–9583, https://doi.org/10.5194/acp-23-9549-2023, 2023. a
Feng, Z., Leung, L. R., Hagos, S., Houze, R. A., Burleyson, C. D., and Balaguru, K.: More frequent intense and long-lived storms dominate the springtime trend in central US rainfall, Nat. Commun., 7, 13429, https://doi.org/10.1038/ncomms13429, 2016. a
Forbes, R., Haiden, T., and Magnusson, L.: Improvements in IFS forecasts of heavy precipitation, ECMWF Newsletter, 144, 21–26, 2015. a
Gandin, L. S. and Murphy, A. H.: Equitable skill scores for categorical forecasts, Mon. Weather Rev., 120, 361–370, 1992. a, b
Geer, A. J., Bauer, P., and Lopez, P.: Direct 4D-Var assimilation of all-sky radiances. Part II: Assessment, Q. J. Roy. Meteor. Soc., 136, 1886–1905, 2010. a
Gilleland, E., Ahijevych, D., Brown, B. G., Casati, B., and Ebert, E. E.: Intercomparison of spatial forecast verification methods, Weather Forecast., 24, 1416–1430, 2009. a
Hersbach, H., Bell, B., Berrisford, P., Hirahara, S., Horányi, A., Muñoz-Sabater, J., Nicolas, J., Peubey, C., Radu, R., Schepers, D., Simmons, A., Soci, C., Abdalla, S., Abellan, X., Balsamo, G., Bechtold, P., Biavati, G., Bidlot, J., Bonavita, M., De Chiara, G., Dahlgren, P., Dee, D., Diamantakis, M., Dragani, R., Flemming, J., Forbes, R., Fuentes, M., Geer, A., Haimberger, L., Healy, S., Hogan, R. J., Holm, E., Janiskova, M., Keeley, S., Laloyaux, P., Lopez, P., Radnoti, G., de Rosnay, P., Rozum, I., Vamborg, F., Villaume, S., and Thepaut, J.-N.: The ERA5 global reanalysis, Q. J. Roy. Meteor. Soc., 146, 1999–2049, 2020. a
Hirpa, F. A., Gebremichael, M., and Hopson, T.: Evaluation of high-resolution satellite precipitation products over very complex terrain in Ethiopia, J. Appl. Meteorol. Clim., 49, 1044–1051, 2010. a, b
Hobouchian, M. P., Salio, P., Skabar, Y. G., Vila, D., and Garreaud, R.: Assessment of satellite precipitation estimates over the slopes of the subtropical Andes, Atmos. Res., 190, 43–54, 2017. a
Huffman, G. J., Bolvin, D. T., Braithwaite, D., Hsu, K., Joyce, R., Xie, P., and Yoo, S.-H.: NASA global precipitation measurement (GPM) integrated multi-satellite retrievals for GPM (IMERG), Algorithm Theoretical Basis Document (ATBD) Version, 4, 26, https://doi.org/10.1007/978-3-030-24568-9_19, 2015. a
Kelly, G., McNally, T., Thépaut, J.-N., and Szyndel, M.: OSEs of all main data types in the ECMWF operation system, in: Proc. Third WMO Workshop on the Impact of Various Observing Systems on Numerical Weather Prediction, WMO/TD 1228, Alpbach, Austria, WMO, 63–94, 2004. a
Lux, O., Rennie, M., de Kloe, J., and Reitebuch, O.: Five years of Aeolus wind profiling: global coverage and data quality, EGUsphere [preprint], https://doi.org/10.5194/egusphere-2025-4596, 2025. a
Ma, C.-G. and Chang, E. K.: Impacts of storm-track variations on wintertime extreme weather events over the continental United States, J. Climate, 30, 4601–4624, 2017. a
Marseille, G. and Stoffelen, A.: Simulation of wind profiles from a space-borne Doppler wind lidar, Q. J. Roy. Meteor. Soc., 129, 3079–3098, 2003. a
Martin, A., Weissmann, M., and Cress, A.: Impact of assimilating Aeolus observations in the global model ICON: A global statistical overview, Q. J. Roy. Meteorol. Soc., 149, 2962–2979, 2023a. a, b
Martin, A., Weissmann, M., and Cress, A.: Investigation of links between dynamical scenarios and particularly high impact of Aeolus on numerical weather prediction (NWP) forecasts, Weather Clim. Dynam., 4, 249–264, https://doi.org/10.5194/wcd-4-249-2023, 2023b. a
Matsuno, T.: Quasi-geostrophic motions in the equatorial area, J. Meteorol. Soc. Jpn. Ser. II, 44, 25–43, 1966. a
Murphy, A. H. and Winkler, R. L.: A general framework for forecast verification, Mon. Weather Rev., 115, 1330–1338, 1987. a
Nimac, I., Danzer, J., and Kirchengast, G.: The added value and potential of long-term radio occultation data for climatological wind field monitoring, Atmos. Meas. Tech., 18, 265–286, https://doi.org/10.5194/amt-18-265-2025, 2025. a
Prakash, S., Mitra, A. K., Pai, D., and AghaKouchak, A.: From TRMM to GPM: How well can heavy rainfall be detected from space?, Adv. Water Resour., 88, 1–7, 2016. a
Prein, A. F., Langhans, W., Fosser, G., Ferrone, A., Ban, N., Goergen, K., Keller, M., Tölle, M., Gutjahr, O., Feser, F., Brisson, E., Kollet, S., Schmidli, J., van Lipzig, N. P. M., and Leung, R.: A review on regional convection-permitting climate modeling: Demonstrations, prospects, and challenges, Rev. Geophys., 53, 323–361, 2015. a
Reitebuch, O.: The spaceborne wind lidar mission ADM-Aeolus, in: Atmospheric physics: Background–methods–trends, Springer, 815–827, ISBN 978-3-642-30182-7, 2012. a
Rennie, M. and Isaksen, L.: The NWP impact of Aeolus Level-2B winds at ECMWF, ECMWF, https://doi.org/10.21957/d4ea1c09d4, 2024. a
Rennie, M., Healy, S., Abdalla, S., McLean, W., and Henry, K.: Aeolus positive impact on forecasts with the second reprocessed dataset, ECMWF Newsletter, 173, 14–20, 2022. a
Rennie, M. P., Isaksen, L., Weiler, F., de Kloe, J., Kanitz, T., and Reitebuch, O.: The impact of Aeolus wind retrievals on ECMWF global weather forecasts, Q. J. Roy. Meteorol. Soc., 147, 3555–3586, 2021. a, b
Roberts, N.: Assessing the spatial and temporal variation in the skill of precipitation forecasts from an NWP model, Meteorol. Appl., 15, 163–169, 2008. a
Rodwell, M. J., Richardson, D. S., Hewson, T. D., and Haiden, T.: A new equitable score suitable for verifying precipitation in numerical weather prediction, Q. J. Roy. Meteorol. Soc., 136, 1344–1363, 2010. a, b
Stoffelen, A., Pailleux, J., Källén, E., Vaughan, J. M., Isaksen, L., Flamant, P., Wergen, W., Andersson, E., Schyberg, H., Culoma, A., Meynart, R., Endemann, M., and Ingmann, P.: The atmospheric dynamics mission for global wind field measurement, B. Am. Meteorol. Soc., 86, 73–88, 2005. a, b
Stoffelen, A., Marseille, G.-J., Bouttier, F., Vasiljevic, D., De Haan, S., and Cardinali, C.: ADM-Aeolus Doppler wind lidar observing system simulation experiment, Q. J. Roy. Meteor. Soc., 132, 1927–1947, 2006. a
Straume, A.-G., Rennie, M., Isaksen, L., de Kloe, J., Marseille, G.-J., Stoffelen, A., Flament, T., Stieglitz, H., Dabas, A., Huber, D., Reitebuch, O., Lemmerz, C., Lux, O., Marksteiner, U., Weiler, F., Witschas, B., Meringer, M., Schmidt, K., Nikolaus, I., Geiss, A., Flamant, P., Kanitz, T., Wernham, D., von Bismarck, J., Bley, S., Fehr, T., Floberghagen, R., and Parinello, T.: ESA's space-based Doppler wind lidar mission Aeolus–First wind and aerosol product assessment results, in: EPJ Web of Conferences, vol. 237, 01007, EDP Sciences, https://doi.org/10.1051/epjconf/202023701007, 2020. a
Taylor, C. M., Belušić, D., Guichard, F., Parker, D. J., Vischel, T., Bock, O., Harris, P. P., Janicot, S., Klein, C., and Panthou, G.: Frequency of extreme Sahelian storms tripled since 1982 in satellite observations, Nature, 544, 475–478, 2017. a
Thiemig, V., Rojas, R., Zambrano-Bigiarini, M., Levizzani, V., and De Roo, A.: Validation of satellite-based precipitation products over sparsely gauged African river basins, J. Hydrometeorol., 13, 1760–1783, 2012. a
Walz, E.-M., Maranan, M., van der Linden, R., Fink, A. H., and Knippertz, P.: An IMERG-based optimal extended probabilistic climatology (EPC) as a benchmark ensemble forecast for precipitation in the tropics and subtropics, Weather Forecast., 36, 1561–1573, 2021. a
Weissmann, M. and Cardinali, C.: Impact of airborne Doppler lidar observations on ECMWF forecasts, Q. J. Roy. Meteor. Soc., 133, 107–116, 2007. a
Weissmann, M., Langland, R. H., Cardinali, C., Pauley, P. M., and Rahm, S.: Influence of airborne Doppler wind lidar profiles near Typhoon Sinlaku on ECMWF and NOGAPS forecasts, Q. J. Roy. Meteor. Soc., 138, 118–130, https://doi.org/10.1002/qj.896, 2012. a
Wheeler, M. and Kiladis, G. N.: Convectively coupled equatorial waves: Analysis of clouds and temperature in the wavenumber–frequency domain, J. Atmos. Sci., 56, 374–399, 1999. a
Yang, G.-Y. and Slingo, J.: The diurnal cycle in the tropics, Mon. Weather Rev., 129, 784–801, 2001. a
Žagar, N.: Assimilation of equatorial waves by line-of-sight wind observations, J. Atmos. Sci., 61, 1877–1893, 2004. a
Žagar, N., Stoffelen, A., Marseille, G.-J., Accadia, C., and Schlüssel, P.: Impact assessment of simulated Doppler wind lidars with a multivariate variational assimilation in the tropics, Mon. Weather Rev., 136, 2443–2460, 2008. a
Žagar, N., Pilch Kedzierski, R., De Chiara, G., Healy, S., Rennie, M., and Sielmann, F.: ESA's Aeolus mission reveals uncertainties in tropical wind and wave-driven circulations, Geophys. Res. Lett., 52, e2025GL114832, https://doi.org/10.1029/2025GL114832, 2025. a, b