the Creative Commons Attribution 4.0 License.
the Creative Commons Attribution 4.0 License.
 | 27 May 2026
Dry and moist convective upper bounds for near-surface temperatures
Quentin Nicolas
Belinda Hotz
The current pace of climate change challenges the statistical methods used for bounding heatwave intensities, prompting the need for a physics-based upper bound to extreme surface temperatures (Ts). A recently proposed approach for deriving such a bound uses the hypothesis that convective instability limits the development of heat extremes. Here, we show that under this hypothesis, the absolute upper bound for extreme Ts – obtained in the limit of zero surface humidity – is set by dry convection. This bound is reached when the mid-troposphere and the surface are connected by a dry adiabat. Previous work suggested that this upper bound is instead set by moist convective instability and exceeds the dry convective limit. We resolve this discrepancy by showing that moist convection only limits heatwave development in the presence of enough surface specific humidity, and that the moist convective upper bound cannot exceed the dry limit. Yet, numerous temperature profiles in observational and reanalysis records do exceed the dry convective limit. We show that these occur exclusively in regions where the boundary layer top reaches deep into the mid-troposphere, and that a near-surface superadiabatic layer (an expected feature of convective boundary layers) controls the amount by which the limit is exceeded. Our work suggests that deriving physical limits on boundary layer depth and superadiabatic layer strength, two quantities largely influenced by land surface properties, may better help constrain the intensity of future dry heatwaves. We conclude with an overview of the different upper bounds applicable in dry and moist scenarios, including the roles of processes such as entrainment and convective inhibition.
- Article
(3232 KB) - Full-text XML
-
Supplement
(5485 KB) - BibTeX
- EndNote


Extreme heat is on the rise over vast swaths of our planet, with surface temperature records being broken at increasing rates over the past four decades (Fischer et al., 2025). These records come with adverse impacts on human health, ecosystems, and economy (e.g. Bastos et al., 2021; Lesk et al., 2022; Callahan and Mankin, 2022; Hermann et al., 2023; Matthews et al., 2025). In this context, it is natural to ask whether there is an upper limit to heatwave intensity. This question can be tackled using statistical methods such as extreme value theory (Coles, 2001; Ghil et al., 2011). However, the current pace of climate change challenges such methods, even when they are extended to take into account a background warming rate (Kharin and Zwiers, 2005; Zeder and Fischer, 2023; Zhang et al., 2024). A complementary approach, which is the one considered here, is to address the question from an atmospheric dynamics standpoint – in other words, to derive a physics-based upper bound for near-surface temperatures.
In tropical dynamics, it is well known that the surface and free troposphere are strongly coupled in convective regions. This happens as moist convection removes positive buoyancy anomalies in the tropospheric column much more rapidly than these are created by large-scale processes. This process, known as convective quasi-equilibrium (Arakawa and Schubert, 1974; Emanuel et al., 1994), leads vertical temperature profiles in tropical convective regions to be close to moist adiabatic above the subcloud layer. For such profiles, the boundary layer equivalent potential temperature θe equals the free-tropospheric saturation equivalent potential temperature , which is a function of temperature and pressure only; i.e. free-tropospheric temperature has a one-to-one relationship with boundary layer temperature and moisture (In reality, the entrainment of dry air into convective clouds leads boundary layer θe to be higher than this theoretical value – e.g. Singh and O'Gorman, 2013.). This idea has been exploited to understand the response of near-surface temperatures (Byrne and O'Gorman, 2013) and extreme moist heat (Zhang et al., 2021) to climate change in the tropics.
Zhang and Boos (2023, hereafter ZB23) explored the hypothesis that moist convection may also constrain temperature profiles over midlatitude land in summer. For a given free-tropospheric temperature profile, there is a surface temperature threshold beyond which the atmospheric column becomes unstable to moist convection; beyond this threshold, the release of instability leads to downdrafts, cooling the surface air. Making use of a simple non-entraining parcel model, along with the hypothesis that surface temperatures cannot exceed the threshold for moist convection, they derived an upper bound for near-surface temperature over midlatitude land that depends on two quantities: mid-tropospheric temperature and surface elevation. They showed that surface temperature extremes can get close to but rarely exceed this bound. The success of this theory prompted its application to policy-relevant work (e.g. Noyelle et al., 2023; Risser et al., 2025).
ZB23 discuss two upper bound formulations: one for parcels with a minimum amount of near-surface specific humidity qs, and a more general one obtained in the limit of zero qs. One peculiar aspect of this general bound (and of the first bound, for high mid-tropospheric temperature or low qs) is that it is higher than an upper bound derived assuming neutrality to dry convection instead of moist convection. This contradicts the elementary expectation that instability to moist convection arises before instability to dry convection. The first goal of this manuscript is to clarify the reasons for this behavior, and to show that in the absence of any constraints on surface humidity, dry convection ultimately limits surface temperatures. The second goal is to explore the behavior of temperature profiles that exceed the surface temperature limit set by dry convective neutrality. We show that these happen in arid regions where extremely deep boundary layers develop and near-surface superadiabatic layers are present. We finish by discussing the implications of these findings for the derivation of surface temperature upper bounds in dry and moist environments.
The analyses presented in Sect. 4 rely on two data products. The first is the ERA5 reanalysis (Hersbach et al., 2020), from which we use June–July–August (JJA) model-level data at 0.5° horizontal resolution from 2001 to 2021. We also use ERA5 2-m temperature data, a post-processed variable obtained by interpolating between the lowest model level and the surface skin temperature following Monin–Obukhov similarity theory (ECMWF, 2016). Our second data source is the Integrated Global Radiosonde Archive (IGRA, Durre et al., 2016), from which we use observational vertical profiles of temperature, geopotential height, and wind speed over the same time period. We select profiles that have valid temperature measurements from the surface to at least 400 hPa; this represents between 58 %–72 % of days depending on the location. We use soundings from three stations, all located in the western US: Elko, NV (WMO ID: 72582), Salt Lake City, UT (WMO ID: 72572), and Riverton, WY (WMO ID: 72672).
One important variable for our analysis is the planetary boundary layer (PBL) top pressure. We follow the ECMWF methodology (ECMWF, 2016) and define the boundary layer top as the first level above the surface at which the bulk Richardson number Rib exceeds 0.25. Because moisture retrievals are frequently missing in IGRA data, we neglect virtual effects in the calculation (and in the rest of this work); Rib is defined as
where cp is the heat capacity of air at constant pressure (hereafter approximated as that of dry air, 1004 ), T is temperature, v is the horizontal wind vector, and z is the geopotential height. The subscript s indicates the lowest available level (which lies near the surface) for IGRA soundings. For ERA5, we use the 2 m level; thus, our calculation deviates from standard ECMWF practice (which uses the lowest model level) in order to be comparable to the IGRA soundings. PBL top pressures obtained from the two methods closely match in most circumstances (Fig. S1 in the Supplement), although at the hottest time of day over midlatitude land, differences of 100 hPa or more do exist in extreme cases. Around 0.5 % of the IGRA soundings have missing wind speed data, which precludes estimation of the PBL top; these soundings are excluded from all analyses involving PBL top data.
The starting point of our discussion is the following question: given a set of environmental parameters, what is the maximum achievable 2-m temperature Ts at a given location on Earth? For simplicity and consistency with previous work, we take a local point of view: we seek to constrain Ts as a function of environmental quantities (e.g. free-tropospheric temperature and near-surface humidity) at the location of interest. The central hypothesis of this section is that Ts is limited by the onset of convective instability. As in ZB23, we assume that the free-tropospheric temperature profile is imposed by large-scale dynamics; Ts may increase until the point where an air parcel lifted from the surface into the free troposphere becomes positively buoyant. ZB23 chose to evaluate this buoyancy criterion at a fixed pressure level, namely 500 hPa: this level is low enough to always lie below the tropopause, and high enough not to be strongly affected by surface processes (although we will see that this does not hold true in all cases). Our question then becomes: what is the highest value such that any adiabatically1 lifted parcel, starting from the surface with a temperature , is negatively or neutrally buoyant at the 500 hPa level?
To answer this question, we need to know what sets the temperature of an adiabatically lifted parcel. Several quantities may be used for that purpose (Romps, 2015). Among these, moist static energy (MSE) is the most convenient analytically, although it is not exactly conserved following adiabatic parcel motion (we come back to this point in Sect. 3.4). That is the choice ZB23 made, and that is the choice we start with. Neglecting the presence of the ice phase, which likely has little importance below 500 hPa during midlatitude land heatwaves, MSE is
where z(p) is the hydrostatic geopotential height profile of the environment, Lv the latent heat of vaporization (taken as 2.5×10⁶ J kg−1), and q is specific humidity. Heuristically, MSE is conserved for unsaturated parcels because both specific humidity q and dry static energy are conserved following adiabatic motion (adiabatically lifted dry parcels cool with a lapse rate , keeping DSE constant). For saturated parcels, a decrease Δq in the parcel's specific humidity increases the parcel's DSE by LvΔq through latent heating, thereby keeping its MSE constant. The MSE of a saturated parcel will be a useful quantity in the following analysis; we denote it
where q* is the saturation specific humidity. We now use the approximation that MSE is conserved during adiabatic parcel ascent to evaluate parcel buoyancy at 500 hPa.
3.1 Case where the parcel is saturated at 500 hPa
Let us start with the case in which the adiabatically lifted surface parcel reaches saturation before the 500 hPa level. This means pLCL>500 hPa, where pLCL is the pressure of the lifted condensation level. The parcel's initial MSE is denoted MSEs, and is conserved during its entire ascent. Above its LCL, neglecting any effects of subsaturation, its MSE is also equal to , where Tparc is the parcel's temperature at level p. In summary,
The condition that the parcel be negatively or neutrally buoyant at 500 hPa is Tparc(500 hPa)≤T500, where T500 is the environment's temperature at 500 hPa. The key point is: because MSE* is an increasing function of temperature, Tparc(500 hPa)≤T500 is equivalent to . Thus, a negatively or neutrally buoyant parcel requires
i.e.
where z500=z(500 hPa) and . We will soon see that for parcels that attain the upper bound, the last term on the right-hand side can only be negative.
The gray line in Fig. 1 illustrates the case of a neutrally buoyant parcel, i.e. for which Eq. (6) is an equality. The reference T500 is indicated by a purple star. The parcel is unsaturated at the surface, and rises dry adiabatically until it reaches saturation around 700 hPa. During this initial ascent phase, both the parcel's DSE and q are conserved. Thereafter, it rises moist adiabatically, that is, along a line of constant MSE*. The parcel's Ts and qs were chosen such that this line passes exactly through our reference T500: that is, such that .
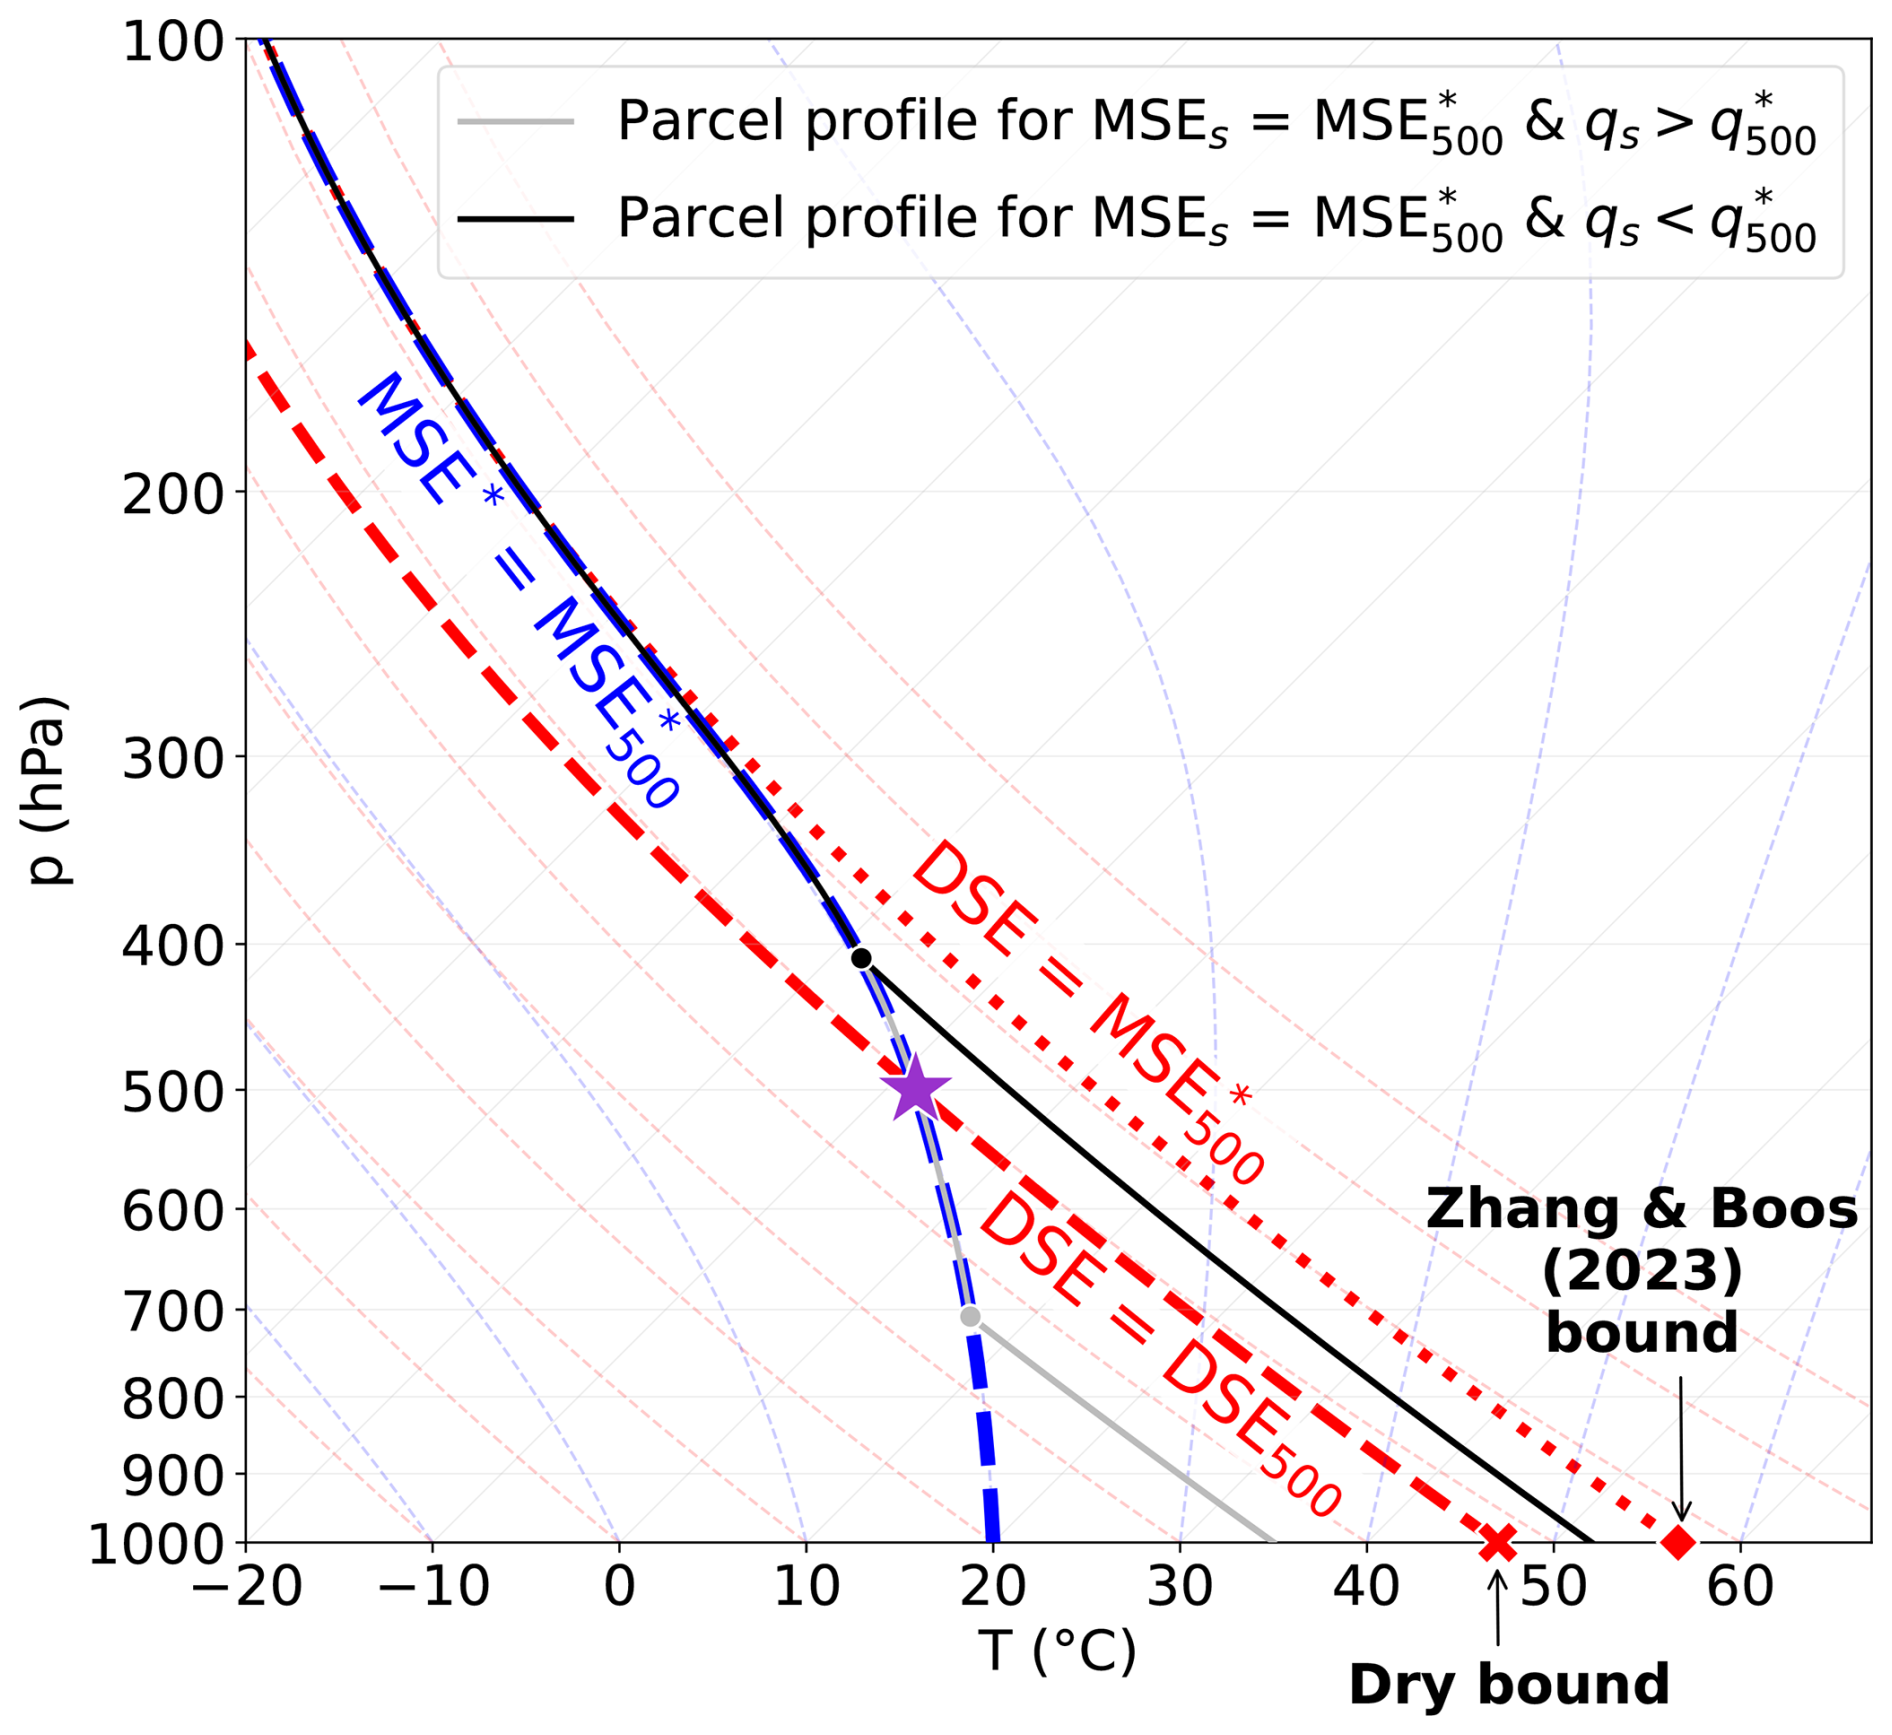
Figure 1Skew-T log-p diagram illustrating the derivation of upper bounds for surface temperature based on MSE conservation, for an example where the reference 500 hPa temperature, T500, is −8 °C. T500 is shown as a purple star, and the moist adiabat passing through it (a line of constant MSE*) as a dashed blue line. A dry adiabatic upper bound is derived using conservation of DSE by following the dashed red line from the 500 hPa level down to the surface. The ZB23 bound is the result of following the moist adiabat up into the upper troposphere, then following the constant DSE line (dotted red) that it asymptotes to back down to the surface. The profiles of two adiabatically lifted parcels that have the same but different qs are shown in gray and black, and their LCLs are shown as thick dots. The environmental temperature profile used to calculate z(p) is the dashed blue line.
3.2 Case where the parcel is unsaturated at 500 hPa
What happens when pLCL≤500 hPa, as regularly happens over arid regions in summer? In that case, at 500 hPa, so using MSE* to measure the parcel's temperature at 500 hPa will not be of any use as we do not know its value. Instead, we can use the fact that the parcel's DSE is conserved between the surface and 500 hPa, because the parcel's q does not change below the LCL: . Using this relationship, Tparc≤T500 is now equivalent to
The line of constant DSE that yields neutral buoyancy at 500 hPa is illustrated in dashed red in Fig. 1. The surface temperature value above which parcels having pLCL<500 hPa are convectively unstable is marked as a red cross, and will hereafter be referred to as the dry adiabatic bound, or simply dry bound.
3.3 Why the dry adiabatic bound cannot be exceeded for convectively neutral parcels
We now show that the right-hand side of Eq. (6) can never exceed the dry adiabatic bound; in other words, that is the highest attainable surface temperature for negatively or neutrally buoyant parcels (under the approximation that MSE is conserved). For this, we consider a parcel which attains the bound in Eq. (6) – that is, a parcel for which Tparc(500 hPa)=T500. The condition pLCL>500 hPa, which is the first hypothesis in the derivation of Eq. (6), is equivalent to . Thus, the term involving moisture quantities in Eq. (6) is always negative, achieving the proof.
Equations (6) and (7) can be summarized into an upper bound valid for all values of qs under the hypothesis that Ts is limited by convective instability:
To derive their upper bound (their Eq. 3), ZB23 take qs to zero in Eq. (6): this is at odds with our assumption that pLCL>500 hPa. The graphical construction leading to their upper bound is illustrated in Fig. 1: one follows the moist adiabat passing through T500 into the upper troposphere (dashed blue line), then descends along a constant DSE line (dashed red). A parcel profile that respects the ZB23 bound but exceeds the dry upper bound (Eq. 7) is shown in black: such a parcel is neutrally buoyant in the upper troposphere, but clearly positively buoyant at the 500 hPa level.
The analysis presented above results from our own reading of ZB23, which we interpreted to rest on the assumption that a parcel lifted from the surface must be neutrally buoyant at 500 hPa. During the review process, we learned about a different interpretation of ZB23's upper bound (Yi Zhang and William R. Boos, personal communication, 2026). It appears when one removes the assumption that the parcel must be neutrally buoyant at the 500 hPa level, but considers the assumption stated in ZB23 that the environment has a moist adiabatic temperature profile above the 500 hPa level. Under this interpretation, a surface parcel can warm until it triggers cloud formation if lifted to some level a above the 500 hPa level, even if it is unstable to dry convection at 500 hPa. Such a parcel would thus have . The additional assumption on the environment's temperature profile yields . Thus, . In Fig. 1, the black line illustrates the profile of a parcel that exactly attains this limit: it is positively buoyant at 500 hPa, but condenses around 410 hPa, and is neutrally buoyant thereafter. There is no lower bound on the humidity of such a parcel, so in the limit where qs,parc goes to zero and cloud formation happens infinitely high in the atmosphere, then , which is exactly ZB23's upper bound. In this framework, the PBL top must always stay below the 500 hPa level; we shall see in Sect. 4 that this condition is violated for almost all profiles exceeding the dry bound in ERA5.
3.4 An aside on the non-conservation of DSE
Careful readers may notice in Fig. 1 that constant DSE lines slightly differ from the reference dry adiabats, which are lines of constant potential temperature θ. This is because DSE (and MSE) is not exactly conserved following adiabatic parcel displacements (Romps, 2015). The easiest way to understand this fact is to use conservation of enthalpy: a parcel that is lifted by an amount dz, thereby undergoing a pressure change dp, experiences an enthalpy change . Because the parcel's pressure equals that of the environment at all heights and the environment is hydrostatic, . Hence,
A parcel that is hotter than the environment, hence less dense, will experience a decrease in DSE during adiabatic ascent; that is essentially because its enthalpy loss has a larger magnitude than . This explains why the dry adiabats are steeper than the constant DSE lines in Fig. 1.
A more accurate version of the dry bound (Eq. 7) uses conservation of potential temperature and reads θs≤θ500, or equivalently
where R is taken as the gas constant for dry air, 287 . This bound is slightly less practical than Eq. (7) because it requires knowledge of ps. In practice, the bound of Eq. (10) is on average 1.7 K higher than that of Eq. (7), a sizable difference. We strive to use this bound in the rest of the paper, except for Figs. 2a and 4.
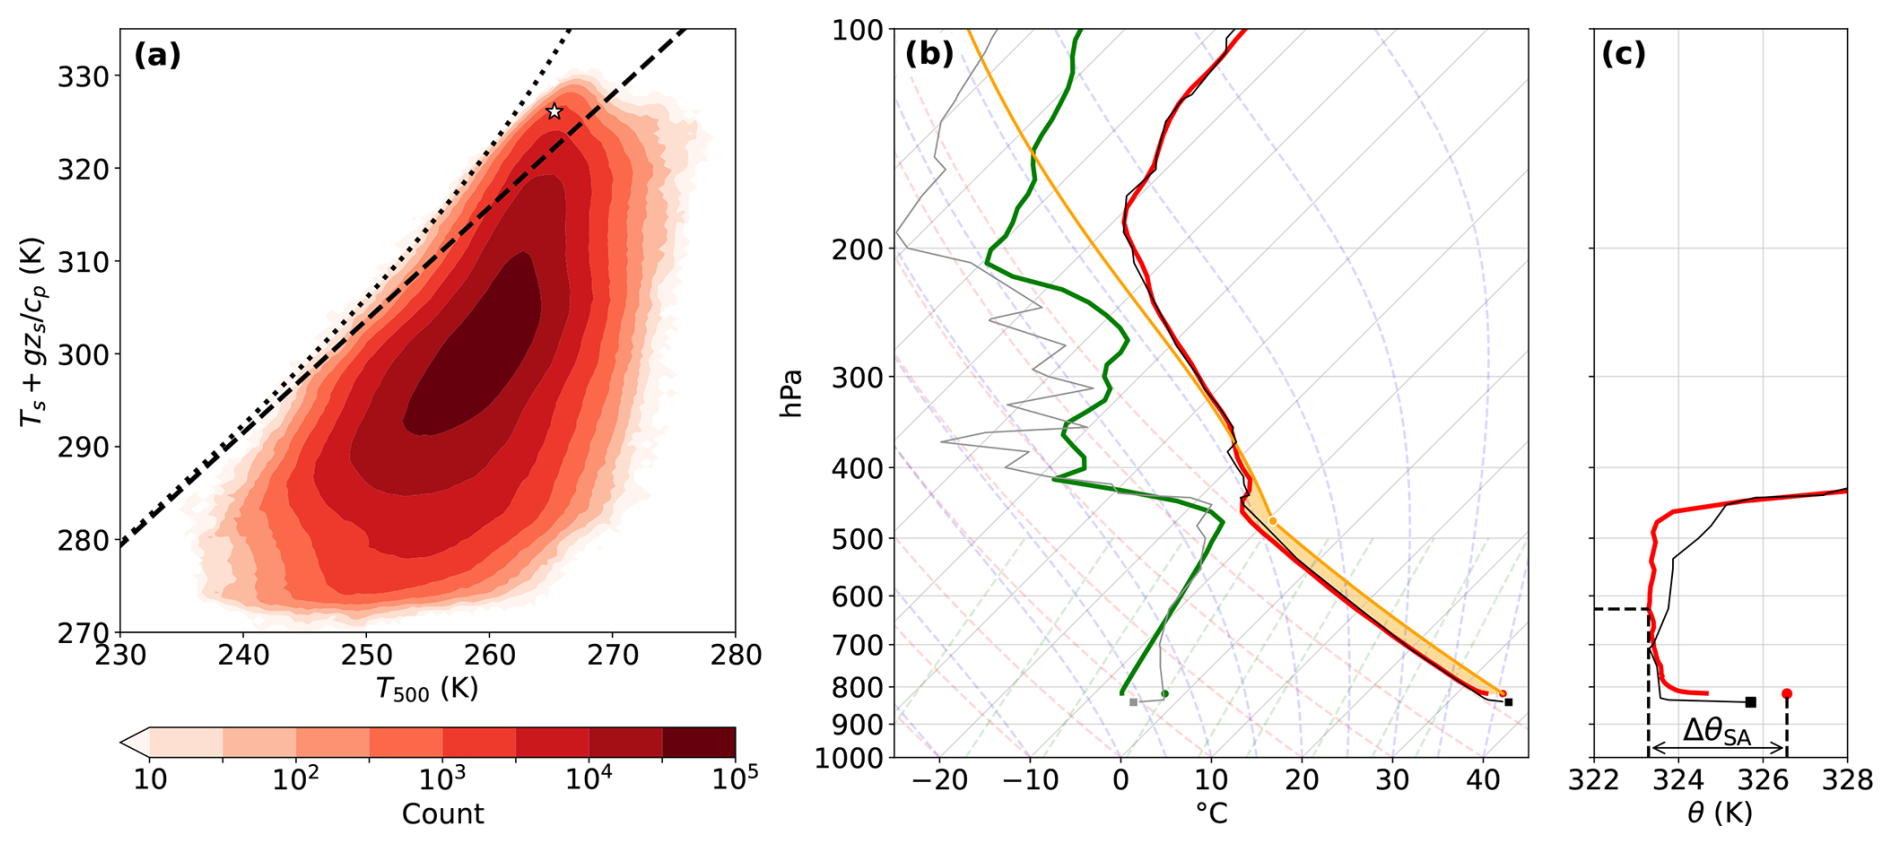
Figure 2(a) Joint histogram of daily maximum and simultaneous T500 (binned every 0.5 K) for land grid points between 40–65° N (values from ERA5). The upper bound of ZB23 (dotted) and the DSE-based dry adiabatic upper bound (Eq. 7, dashed) are overlaid. The white star marks the position of the sounding shown in (b) and (c). (b) Skew-T log-p diagram for an example profile exceeding the dry adiabatic upper bound, at 00:00 UTC on 8 July 2014, at 41° N, 116° W. ERA5 temperature (red line) and dew point (green line) start from the lowest model level. Dots show the 2-m values. The profile of a non-entraining parcel rising adiabatically from the 2-m level (orange line), its LCL (orange dot), and its region of positive buoyancy (orange shading) are shown. Thin black and gray lines show a simultaneous observational sounding from Elko, NV, USA (40.86° N, 115.74° W). (c) Potential temperature profiles from ERA5 (red, dot shows the 2-m value) and observation (black). The leftmost dashed lines show the minimum θ value and corresponding pressure level. The arrow illustrates the calculation of the superadiabatic layer strength ΔθSA in ERA5.
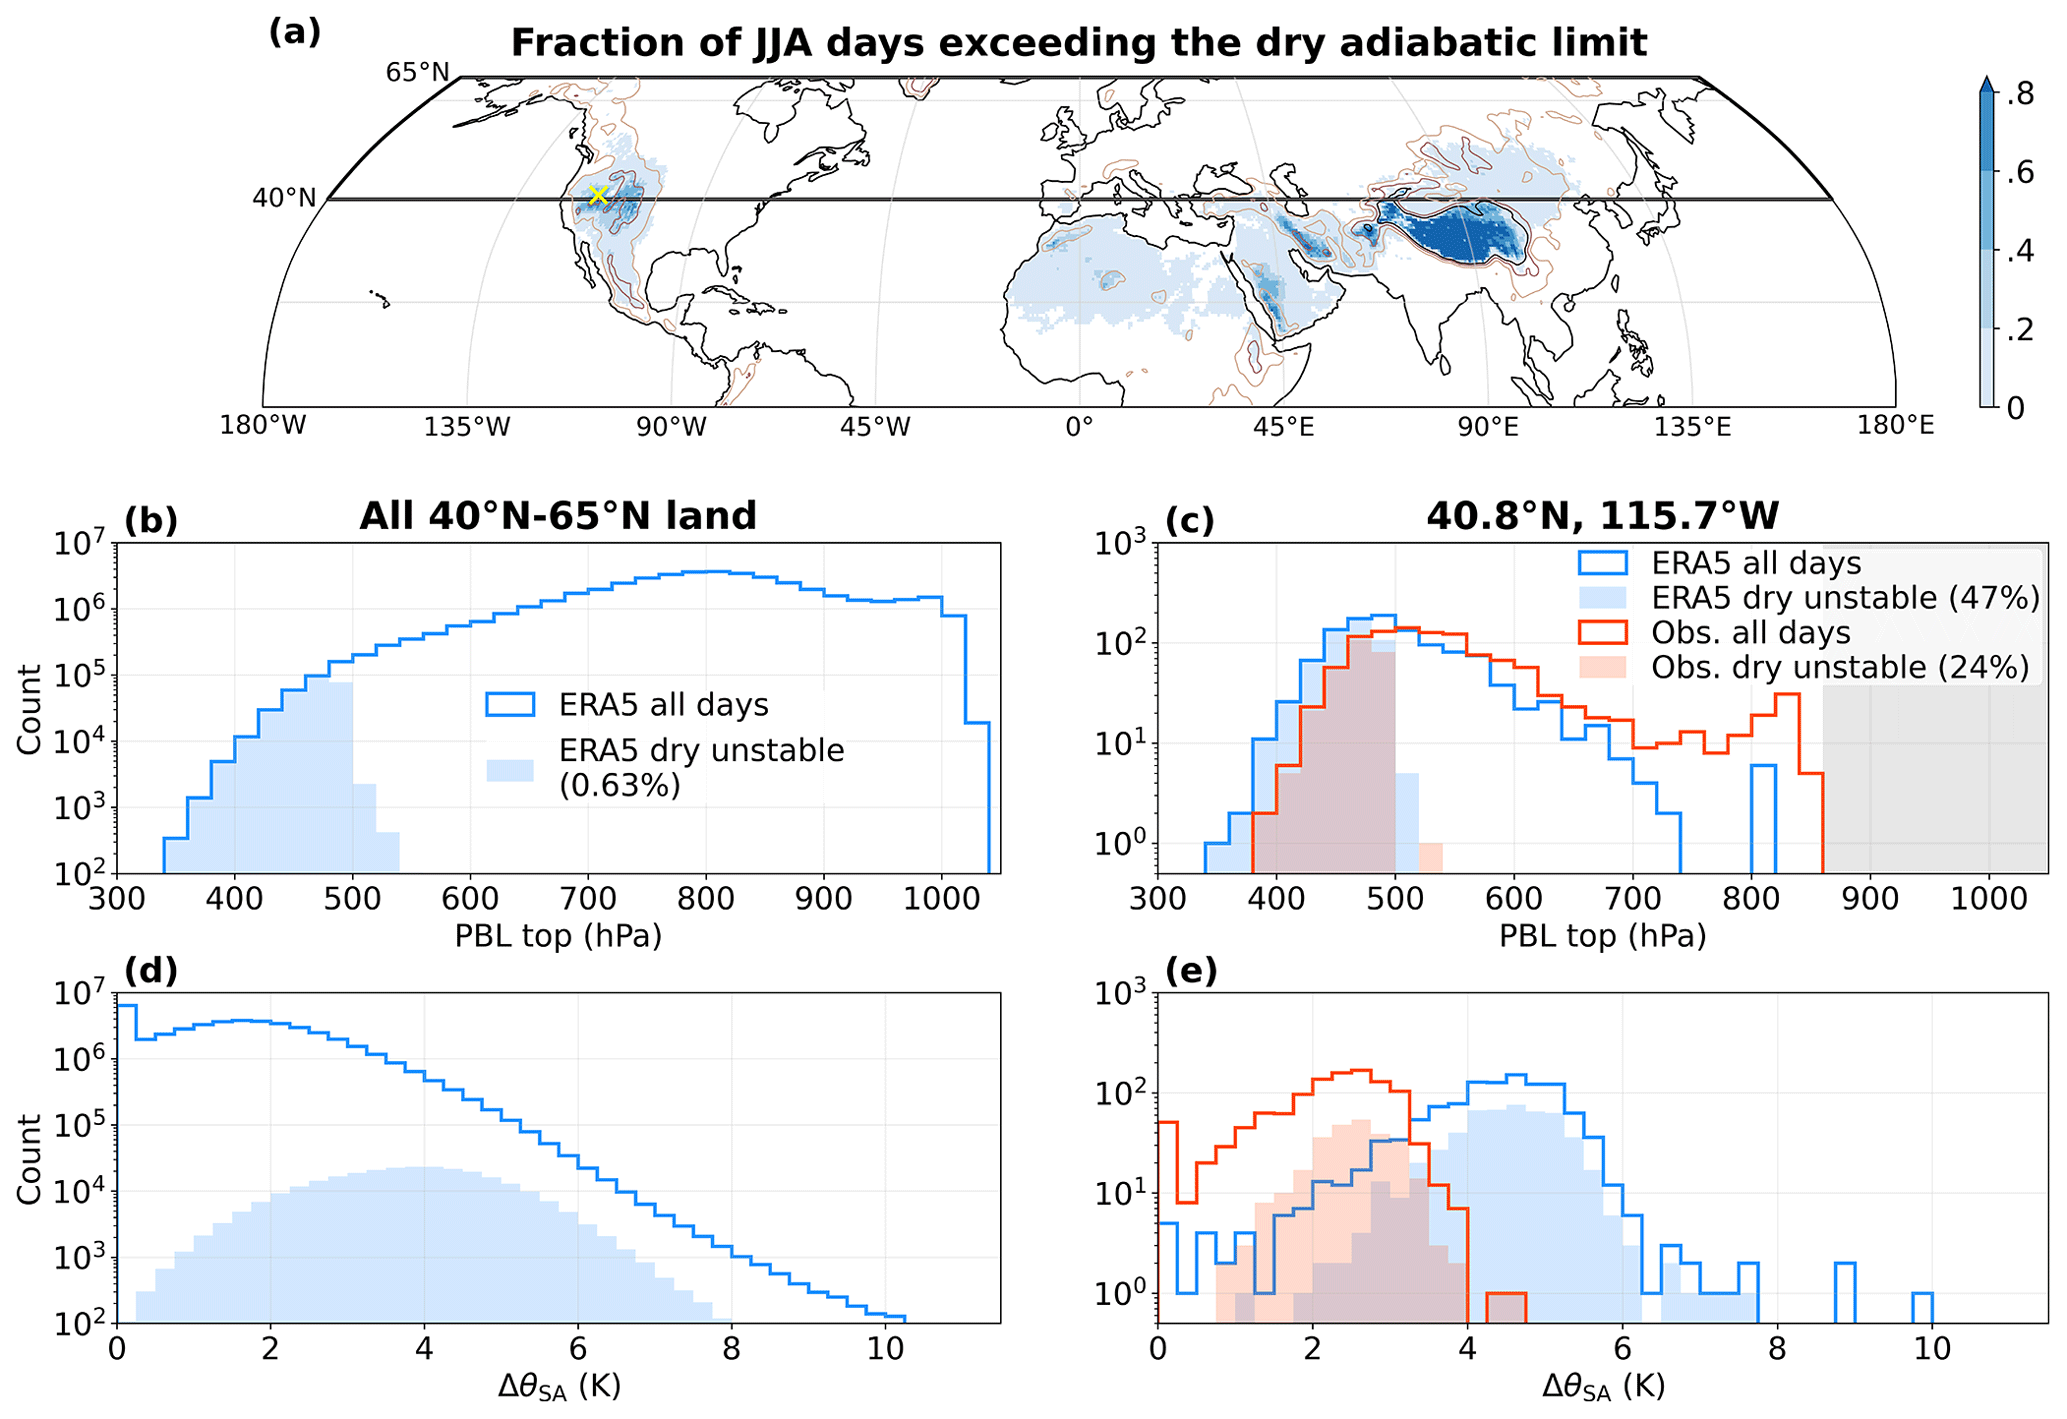
Figure 3Characteristics of dry adiabatic bound exceedances over midlatitude land in the Northern Hemisphere (using the θ-based bound, Eq. 10). (a) Frequency of JJA days exceeding the dry bound in ERA5 (shading; regions shaded in white never exceed the bound). Smoothed contours of 1000, 2000, and 3000 m surface elevation are shown in light, medium, and dark brown. The thick outline emphasizes our main study region: the 0–40° N region is only included here for comparison. (b) Distribution of PBL top pressure for all JJA profiles (non-filled histogram), and instances that exceed the dry bound (filled histogram). (c) As in (b), for a unique location: Elko, NV, USA (40.86° N, 115.74° W – yellow cross in a). Blue histograms show ERA5 data and red histograms use IGRA soundings. The gray shaded area indicates pressure levels below the surface. (d,e) as in (b, c), for the superadiabatic layer strength ΔθSA.
Under the assumption that Ts is limited by the onset of convective instability, the maximum reachable Ts for a given T500 is thus the dry adiabatic upper bound. Yet, ZB23 (their Fig. S7) show that many temperature profiles in reanalysis data and observations exceed this bound. All such instances are, by definition, unstable to dry convection. In this section, we investigate the characteristics of these peculiar temperature profiles.
Figure 2a reproduces the analysis of ZB23, namely showing a joint histogram of (i.e. near-surface DSE divided by cp) and T500 over summer days for all Northern Hemisphere midlatitude land grid points. The upper bound of ZB23 (obtained by taking qs=0 in Eq. 6) and the dry bound (Eq. 7) are calculated by assuming a fixed proportionality coefficient between z500 and T500, taken as the ratio between their climatological-mean values (22.0 m K−1), which is a good approximation on the basis of the hypsometric equation (ZB23). About 0.9 % of this phase space exceeds the DSE-based dry upper bound (Eq. 7). This number drops to 0.6 % for the θ-based bound (Eq. 10).
Figure 2b illustrates one case that exceeds the DSE-based dry upper bound by about 4 K (shown as a white star in Fig. 2a). We choose the grid point closest to Elko, NV, USA, which regularly exceeds the dry bound (see Fig. 3) and for which daily sounding data are available. A very deep, dry adiabatic boundary layer extends to about 470 hPa. This is possible thanks to the extreme dryness of the near-surface air, with a relative humidity around 9 %. Close to the surface, the profile is characterized by a strong superadiabatic layer. This feature is particularly visible in the potential temperature profile (Fig. 2c), which decreases by over 2.5 K in the first 10 hPa above the surface. If the presence of a superadiabatic surface layer at the bottom of a convective boundary layer is no surprise (e.g. Stull, 1988), the intensity of this example is notable. Importantly, it is not an artifact of the reanalysis: the sounding profile shows a similar feature, albeit slightly weaker. The total superadiabatic layer strength, defined as
where the subscript s denotes the 2-m level for ERA5 data and the lowest sounding level for observational data, is 3.2 K in ERA5 and 2.4 K in observations.
Midlatitude locations that frequently exceed the dry bound include the mountains and high plateaus of western North America and the deserts of central Asia, with rarer instances in the Anatolian and Iberian peninsulas (Fig. 3a, focusing between 40–65° N). Figure 3a also includes northern tropical and subtropical regions for comparison. Apart from the Tibetan Plateau, whose surface is close enough to the 500 hPa level for the boundary layer to reach it on most days, the Middle Eastern and Saharan deserts appear as subtropical hotspots for the exceedance of the dry adiabatic bound.
The profile of Fig. 2b suggests that two conditions are required to exceed the dry adiabatic limit: a deep boundary layer and a strong superadiabatic surface layer. Boundary layer theory indicates that the two conditions should tend to coincide, as they are both contingent on strong surface sensible heat fluxes (Stull, 1988, see also our Sect. 5.1.2). At the hottest time of the day over midlatitude land in summer, the boundary layer top pressure pt,BL lies anywhere between 300 hPa and the surface, with most values concentrated between 700–900 hPa (Fig. 3b). Instances exceeding the dry bound occupy the lower tail of these values, with 98.8 % of them having pt,BL≤500 hPa. Conversely, few profiles have pt,BL≤500 hPa without exceeding the bound. This suggests that there is a quasi-equivalence between a PBL reaching higher than 500 hPa and dry bound exceedance. This is no coincidence, given our definition of the PBL top. Indeed, for deep, dry convective PBLs, Rib>0.25 is almost equivalent to DSE>DSEs. pt,BL≤500 hPa means that the 500 hPa level does not meet the criterion Rib>0.25; thus, it is almost equivalent to DSE500≤DSEs. This also implies that the interpretation discussed in Sect. 3.3 for ZB23's bound, based on individual parcels reaching condensation in an atmosphere that is moist-adiabatic above the 500 hPa level, does not hold for cases that exceed the dry bound.
ΔθSA, which is a positive quantity by definition, has a bimodal distribution in ERA5, with one peak at 0 K corresponding to stable boundary layers and a second around 1.5 K (Fig. 3d). When superadiabatic layers are present, they feature the largest magnitude just above the surface: when ΔθSA≥1, on average 73 % of ΔθSA is contained between the 2-m level and lowest model level (around 10 m above the surface), and 90 % is contained within 100 m of the surface (not shown). Profiles that exceed the dry upper bound sample large values of ΔθSA, with a mean of 3.8 K and some values exceeding 8 K. However, a large ΔθSA is not a guarantee of exceeding the bound, for example if the boundary layer is shallow.
Our analysis does not answer the question of what process ultimately limits surface temperature rise in such cases. ZB23's Fig. S1 indicates that little to no precipitation falls following heat extremes in regions exceeding the dry bound (compare the blue areas in our Fig. 3 to their Fig. S1), suggesting moist convection may not be the relevant process. Further study is required to settle this question; we come back to this point in Sect. 5.1.1.
The reliability of ERA5 data in these particular superadiabatic environments is not guaranteed (Yin et al., 2021). Hence, we strive to provide an observational comparison. Few radiosonde data are available in midlatitude regions that regularly exceed the dry upper bound, but three stations in the western US fit our purposes (see Sect. 2). We use 00:00 UTC soundings, which are 3–4 h after local solar noon, hence close to the hottest time of the day. These are compared to 00:00 UTC ERA5 data at the closest grid point (days where sounding data are unavailable are also excluded in ERA5). ERA5 captures the distribution of PBL tops in Elko (Fig. 3c) relatively well, but overestimates the highest PBLs at that location and time of day (and underestimates the occasional presence of shallow PBLs). The strength of superadiabatic layers is around twice as high in ERA5 as in observations. These two biases lead ERA5 to exceed the dry adiabatic bound twice too frequently at that location. ERA5 better captures the frequency of days exceeding the dry bound in Salt Lake City and Riverton (Fig. S2 in the Supplement). This happens as it better estimates PBL heights there. ΔθSA is strongly overestimated in Salt Lake City, but is very well captured in Riverton. Overall, this suggests that exceedance of the dry adiabatic bound is not an artifact of the reanalysis, which captures its frequency relatively well. However, the reanalysis seems to suffer from biases in near-surface temperature profiles.
Our findings have implications for the derivation and application of Ts upper bounds in both dry and moist regimes. The goal of this section is to summarize these implications. Section 5.1 discusses avenues for obtaining a universal upper bound for extreme surface temperature by constraining both the maximum depth of the PBL and the strength of superadiabatic layers. Section 5.2 discusses the range of validity of the “moist convectively limited” upper bound (Eq. 6), its relevance to understanding trends in extreme surface temperatures, and how the effects of cloud entrainment and convective inhibition can lead this bound to be breached.
5.1 Surface temperature upper bound over dry surfaces
We have shown in Sect. 3 that under the assumption of convective neutrality, the absolute upper limit for Ts is the dry adiabatic bound (Eq. 10). There are two issues with this bound. First, for temperature profiles at or above the bound, the 500 hPa level lies within the boundary layer (Fig. 3b): in such cases, T500 becomes strongly coupled to surface processes, and is thus less relevant as a control parameter. Second, the assumption of convective neutrality does not always hold, leading it to be exceeded by up to 8 K in ERA5 and 5 K in the observations we considered (Fig. 3e). We discuss how to remedy these two issues in the following subsections.
5.1.1 Considerations on the free-tropospheric reference level
The view embraced by ZB23 is that of a “top-down” control on heatwaves: large-scale atmospheric dynamics set T500, which in turn sets an absolute limit on the temperatures of lower levels. This contrasts with a more classical “bottom-up” view, in which the intensity of heatwaves is largely driven by surface processes, particularly sensible heat fluxes (e.g. Teuling et al., 2010; Miralles et al., 2014). The strength of the “top-down” approach is that it trades complex land surface processes for a perhaps simpler quantity driven by large-scale dynamics. However, as discussed above, this “top-down” view breaks down for some of the strongest heat extremes, where T500 becomes coupled to the land surface.
Given this, one may decide to choose a higher reference level. For example, the 300 hPa level always remains above the boundary layer over midlatitude land in ERA5 (Fig. 3b), so a 300 hPa-based dry bound is never exceeded (Fig. S3a in the Supplement). However, the boundary layer only approaches the 300 hPa level over high surfaces, hence a 300 hPa – based bound is unrealistically large in most regions. Conversely, there is no obvious reason to discard the possibility of a future event reaching a deeper PBL than 300 hPa.
Rather than fixing an a priori reference level, a more fruitful approach may be to predict the maximum PBL depth reachable in a given region, and to use that level to define a region-specific dry adiabatic upper bound. Process-based studies of PBL growth over land have traditionally embraced the “bottom-up” approach, in which PBL growth is modeled over the course of one day from prescribed early morning initial conditions. The approach usually consists in coupling a land surface model to a bulk model of the convective boundary layer, which grows by entrainment of free-tropospheric air (e.g. McNaughton and Spriggs, 1986; Culf, 1994; van Heerwaarden et al., 2010; Gentine et al., 2013a; Miralles et al., 2014; van Heerwaarden and Teuling, 2014), or to a more complex single column model (e.g. Stap et al., 2014). In these frameworks, PBL growth is largely determined by free-tropospheric stability and the surface sensible heat flux. The latter is in turn governed by the partitioning of net surface radiation into sensible and evaporative components, the latter decreasing over soils with high evaporative resistance, particularly dry soils (see the soil-moisture-limited regime described in, e.g. Seneviratne et al., 2010). Another takeaway is that the growth of very deep PBLs usually occurs over several days, with the energy accumulated from strong surface sensible heat fluxes being stored at night in a deep residual layer (Gamo, 1996; Santanello et al., 2005; Blay-Carreras et al., 2014; Miralles et al., 2014; Chen et al., 2016).
Such initial-value integrations, however, may offer little clue to the potential existence and value of a highest reachable PBL depth. Indeed, they only focus on the processes that grow the PBL, not those that may arrest its growth. As put forward by ZB23, one such process could be cloud formation, and it was explored by many land-atmosphere coupling studies, both on the timescale of a single day (Zhu and Albrecht, 2002; Ek and Holtslag, 2004; Vilà-Guerau de Arellano, 2007; Juang et al., 2007a, b; van Heerwaarden et al., 2009; Vilà-Guerau de Arellano et al., 2012; Gentine et al., 2013b; Manoli et al., 2016) and on longer timescales (Siqueira et al., 2009; Konings et al., 2010). However, it remains uncertain whether cloud formation is relevant to limiting PBL growth in the extremely dry cases considered here. We propose two alternative processes. Radiative cooling acts to limit free-tropospheric temperature increase on 𝒪(10 d), and one may envision the approach of an equilibrium where radiative cooling, dry convective heating and subsidence warming are in balance throughout the atmospheric column, determining a particular equilibrium PBL height. Alternatively, such an equilibrium might never be reached on the synoptic timescale; the limiting factor for PBL growth would then simply be the lifetime of the weather system supporting it. The relevance of these processes to very deep PBLs in dry environments deserves further study.
It is worth noting that Garratt (1992) attempted to estimate upper limits for surface skin temperatures by considering solely the surface energy budget. However, the relevance of that work to constrain near-surface temperature Ts is compromised by the fact that Ts was an input of the model. Resolving this issue would require coupling Garratt's model to an atmospheric column, which brings us back to the above-mentioned studies of land-PBL coupling.
5.1.2 Controls on the superadiabatic layer strength
Our study highlights that deviations from convective neutrality due to surface-layer gradients (measured by the superadiabatic layer strength, ΔθSA) may modulate Ts by several K for a given mixed-layer temperature (Fig. 3d and e). Hence, one who wishes to obtain a universal upper bound for extreme temperatures likely needs to build an understanding of ΔθSA. We emphasize that superadiabatic layers are no new discovery, and are in particular a classical component of any land-atmosphere coupling model (studies using bulk PBL models usually represent it as a discontinuity between surface and mixed-layer θ). Nevertheless, we provide a short review of its physical controls below for the interested reader.
Simple models of convective boundary layers predict ΔθSA to increase with the surface sensible heat flux (e.g. Emanuel et al., 1994). The argument goes like the following: In the surface layer (roughly the lowest 10 % of the boundary layer), the upward sensible heat flux is approximately constant with height. Flux-gradient theory expresses this flux as
where Kh is a turbulent diffusion coefficient. At heights larger than the surface roughness length (𝒪(1–10 mm) for the arid surfaces over which most dry convective cases take place), Kh is captured by Monin–Obukhov similarity theory:
where κ is the Von Karman constant, u* the turbulent velocity and ℒ the Obukhov length. The specific functional form of the last term is valid for convective boundary layers and known as the Businger–Dyer profile (Businger et al., 1971; Dyer, 1974). ℒ is itself proportional to . Equations (12)–(13) may be integrated from the 2-m level to the mixed layer, yielding a monotonic relationship between and ΔθSA.
To first order, ΔθSA is thus controlled by the surface sensible heat flux, a relationship that holds relatively well for midlatitude land summer conditions (Fig. S4 in the Supplement; part of the scatter is likely attributable to variations in mechanical turbulence, i.e. u*). Controls on surface sensible heat fluxes during heatwaves are relatively well understood thanks to land-atmosphere coupling studies (see Sect. 5.1.1), suggesting a promising way forward to constrain ΔθSA.
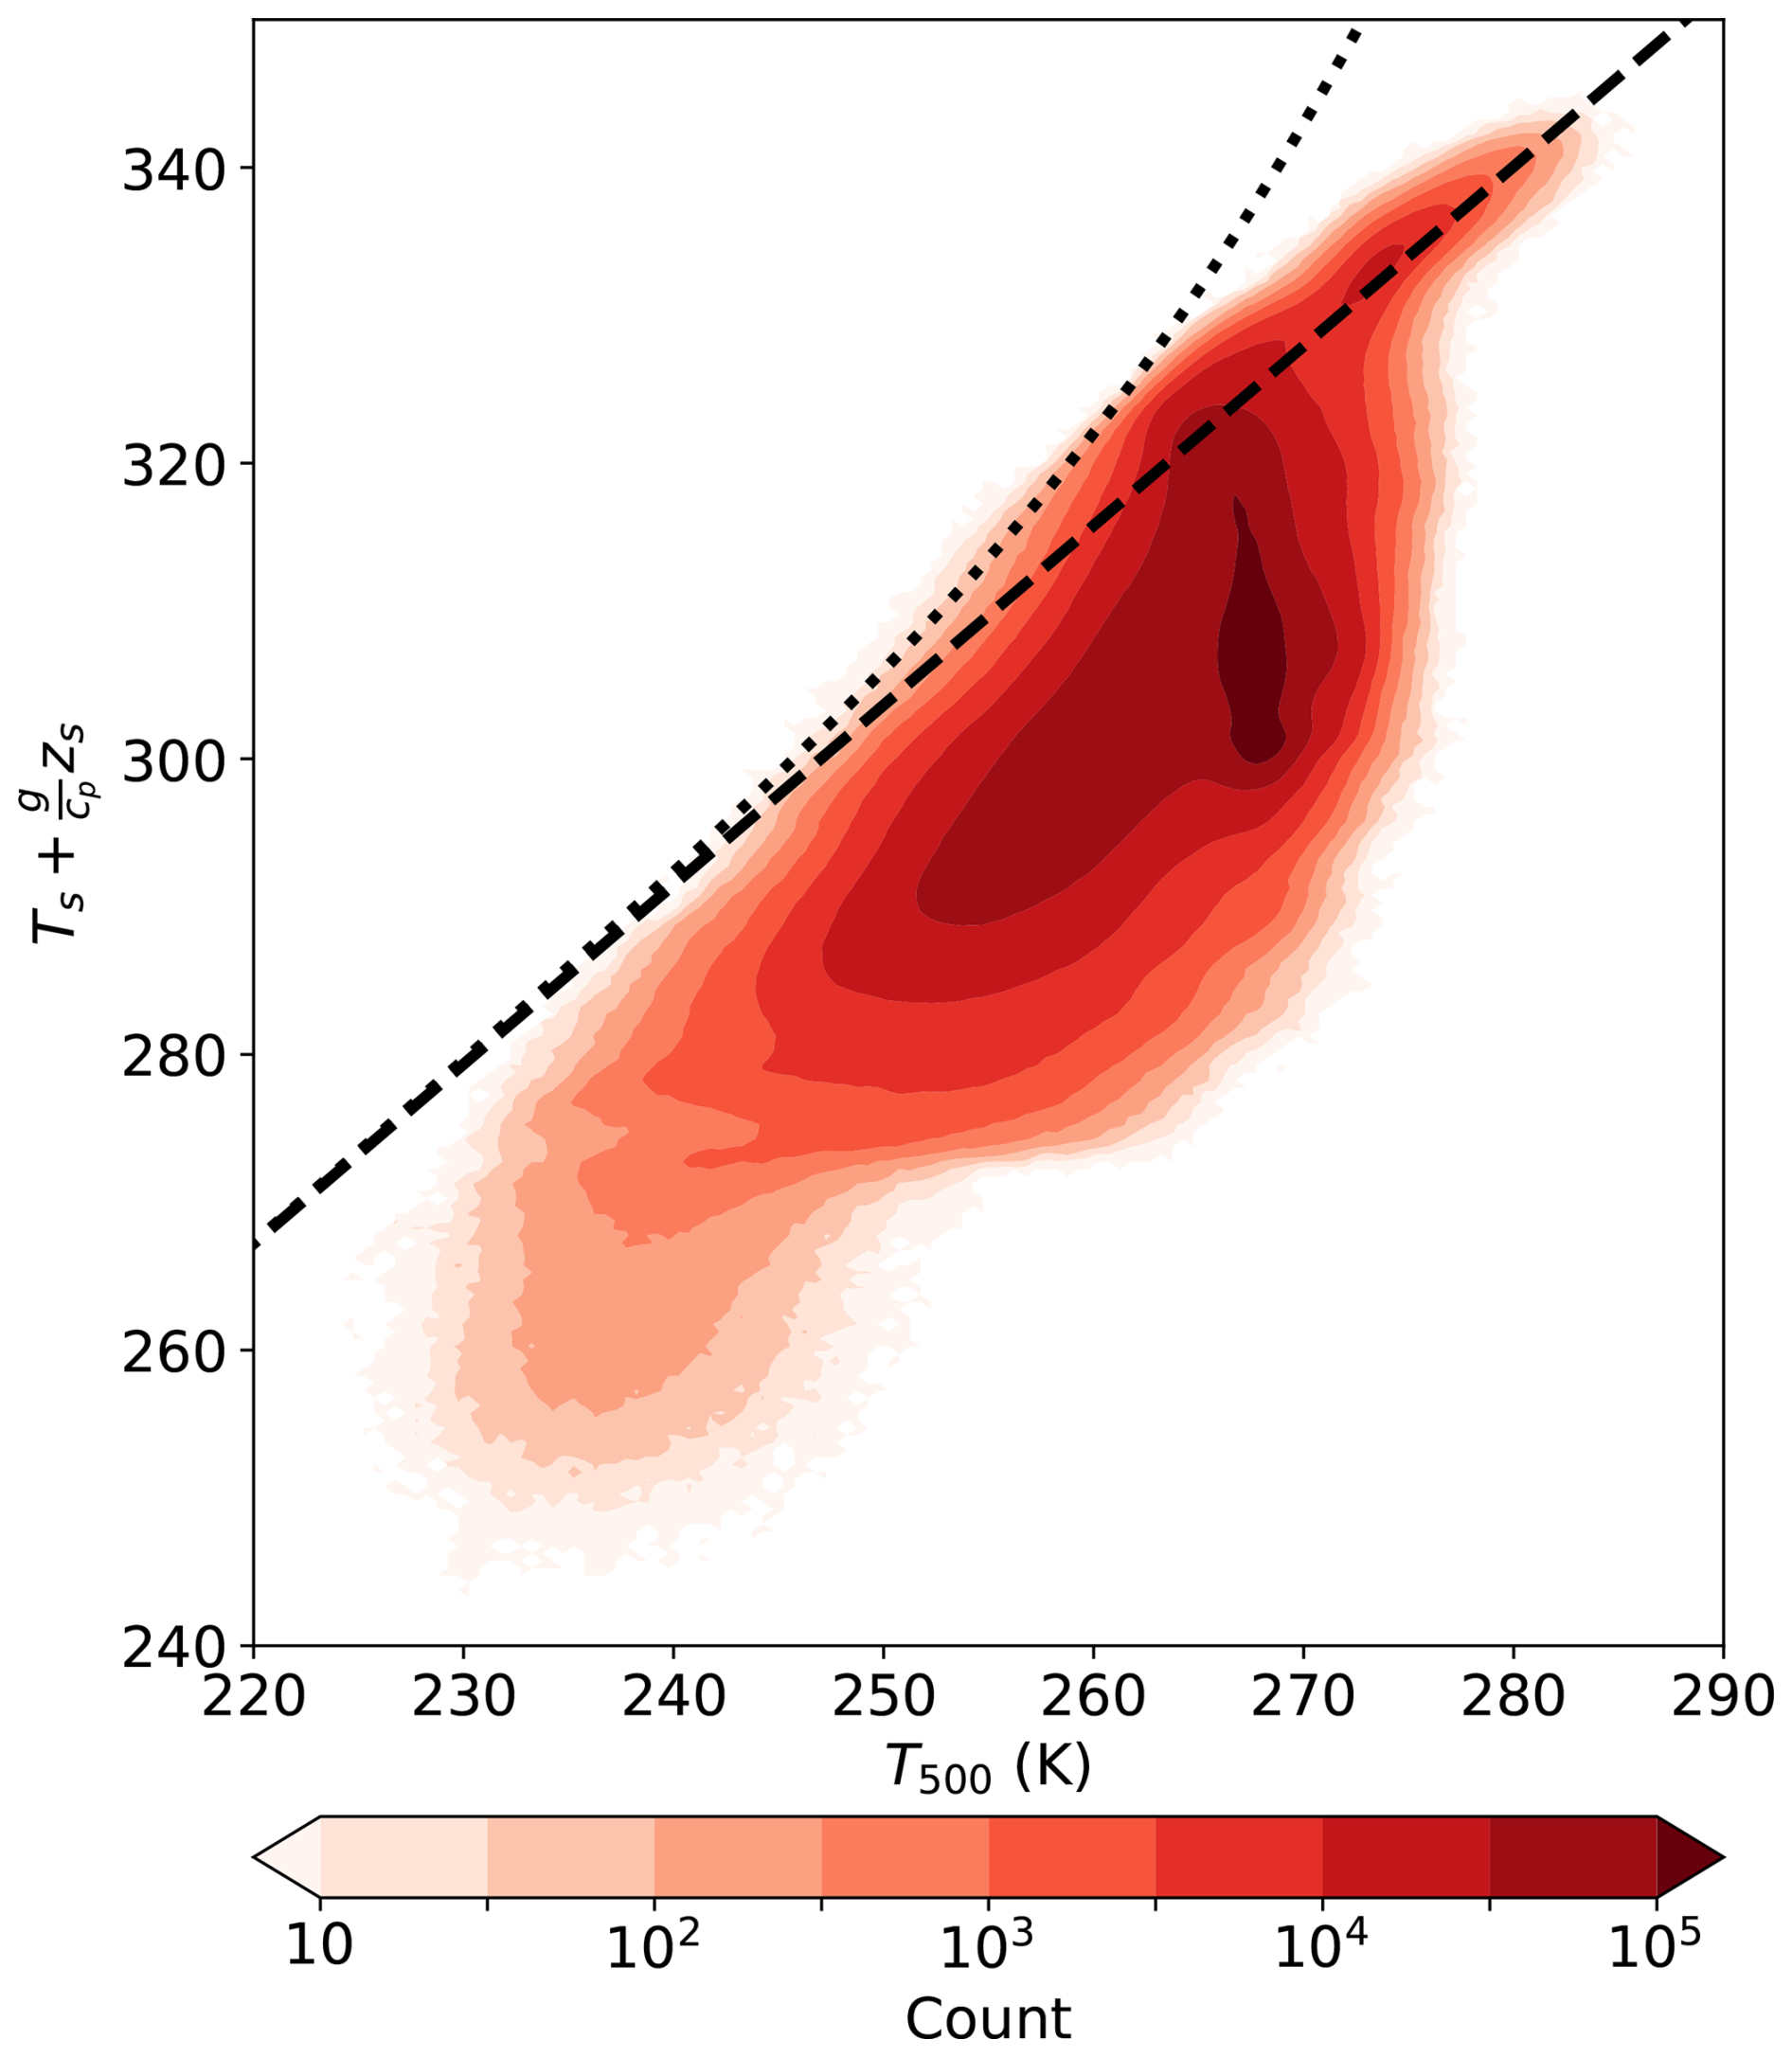
In light of these considerations, it may appear surprising that the ZB23 upper bound fits the upper edge of the Ts–T500 relationship so well in Fig. 2a. Because the difference between their upper bound and the dry adiabatic upper bound is given by , this may suggest that the maximum superadiabatic layer strength is given by . We do not see any obvious physical explanation for such a relationship; it may simply stem from the fact that higher T500 correlates with more equatorward locations and stronger anticyclonic conditions, both allowing for higher sensible heat fluxes and ultimately higher ΔθSA. It is important to note that hot extremes never reach the ZB23 bound at higher T500; it is by no means evident that one can use the bound to extrapolate the behavior of Ts extremes over dry surfaces to climate change. Figure 4 explores a higher range of T500 variations by considering the Ts–T500 relationship over all non-polar land regions, and shows a clear departure from the ZB23 upper bound at high values of T500: ΔθSA (measured by the upward deviation from the dashed line) clearly seems to plateau rather than follow the dotted line. However, Fig. 4 must be interpreted with caution as the top-right range of the histogram is occupied by high-elevation regions (Fig. S5 in the Supplement), mostly over the Tibetan Plateau.
5.2 Upper bound over moist surfaces
5.2.1 Range of validity of the bound
Over moist surfaces, the surface temperature threshold for convective instability is lowered by an amount compared to dry surfaces (Eqs. 6 and 8). This “moist convective” upper bound is only valid when the LCL of near-surface air is below the 500 hPa level, i.e. when . This raises an important caveat: even over climatologically “moist” regions, such as western Europe, extreme surface dryness may push the moist bound outside of its zone of validity. For example, the “realistic” upper bounds that Noyelle et al. (2023) derived for European cities (obtained in the limit of record-low surface specific humidity) all have error bars exceeding 54 °C, whereas the θ-based dry upper bound is 50.5 °C for T500=264 K (their highest T500 value, as implied by the absolute upper bounds they report) assuming ps=1020 hPa (which is on the upper end of values relevant for summer heatwave conditions). This does not discard the possibility of 50 °C being reached in these cities in the current climate, but conditions it on the existence of much deeper boundary layers than ever observed (the highest PBL top of the 2001–2021 period in ERA5 stands at 580 hPa in the cities considered in that study) and possibly strong superadiabaticity.
5.2.2 Explanation of the observed trends in extreme surface temperature
ZB23 showed that when taking an average over all midlatitude land TXx events (the warmest time of the year at any given location), the moist upper bound (Eq. 6) is exactly attained. They subsequently used this result to explain the observed rate of increase of the globally averaged temperature anomaly during TXx events (which is twice the rate of global mean warming). Our results do not call this argument into question, as the moist upper bound remains valid over most midlatitude land, provided conditions are not anomalously dry. Our results do, however, question the applicability of this argument at a local scale. For example, it is far from clear that TXx events over arid regions (which are limited by dry convection) should increase as strongly as the midlatitude-land-averaged TXx (which is limited by moist convection).
5.2.3 Deviations from convective neutrality in moist cases: effects of entrainment and convective inhibition
Although the average midlatitude land TXx event respects the moist upper bound (ZB23), past heatwaves have locally exceeded it by more than 5 K (Hotz et al., 2024). We list here three possible reasons for such behavior, in cases where the surface is moist enough for Eq. (6) to be relevant.
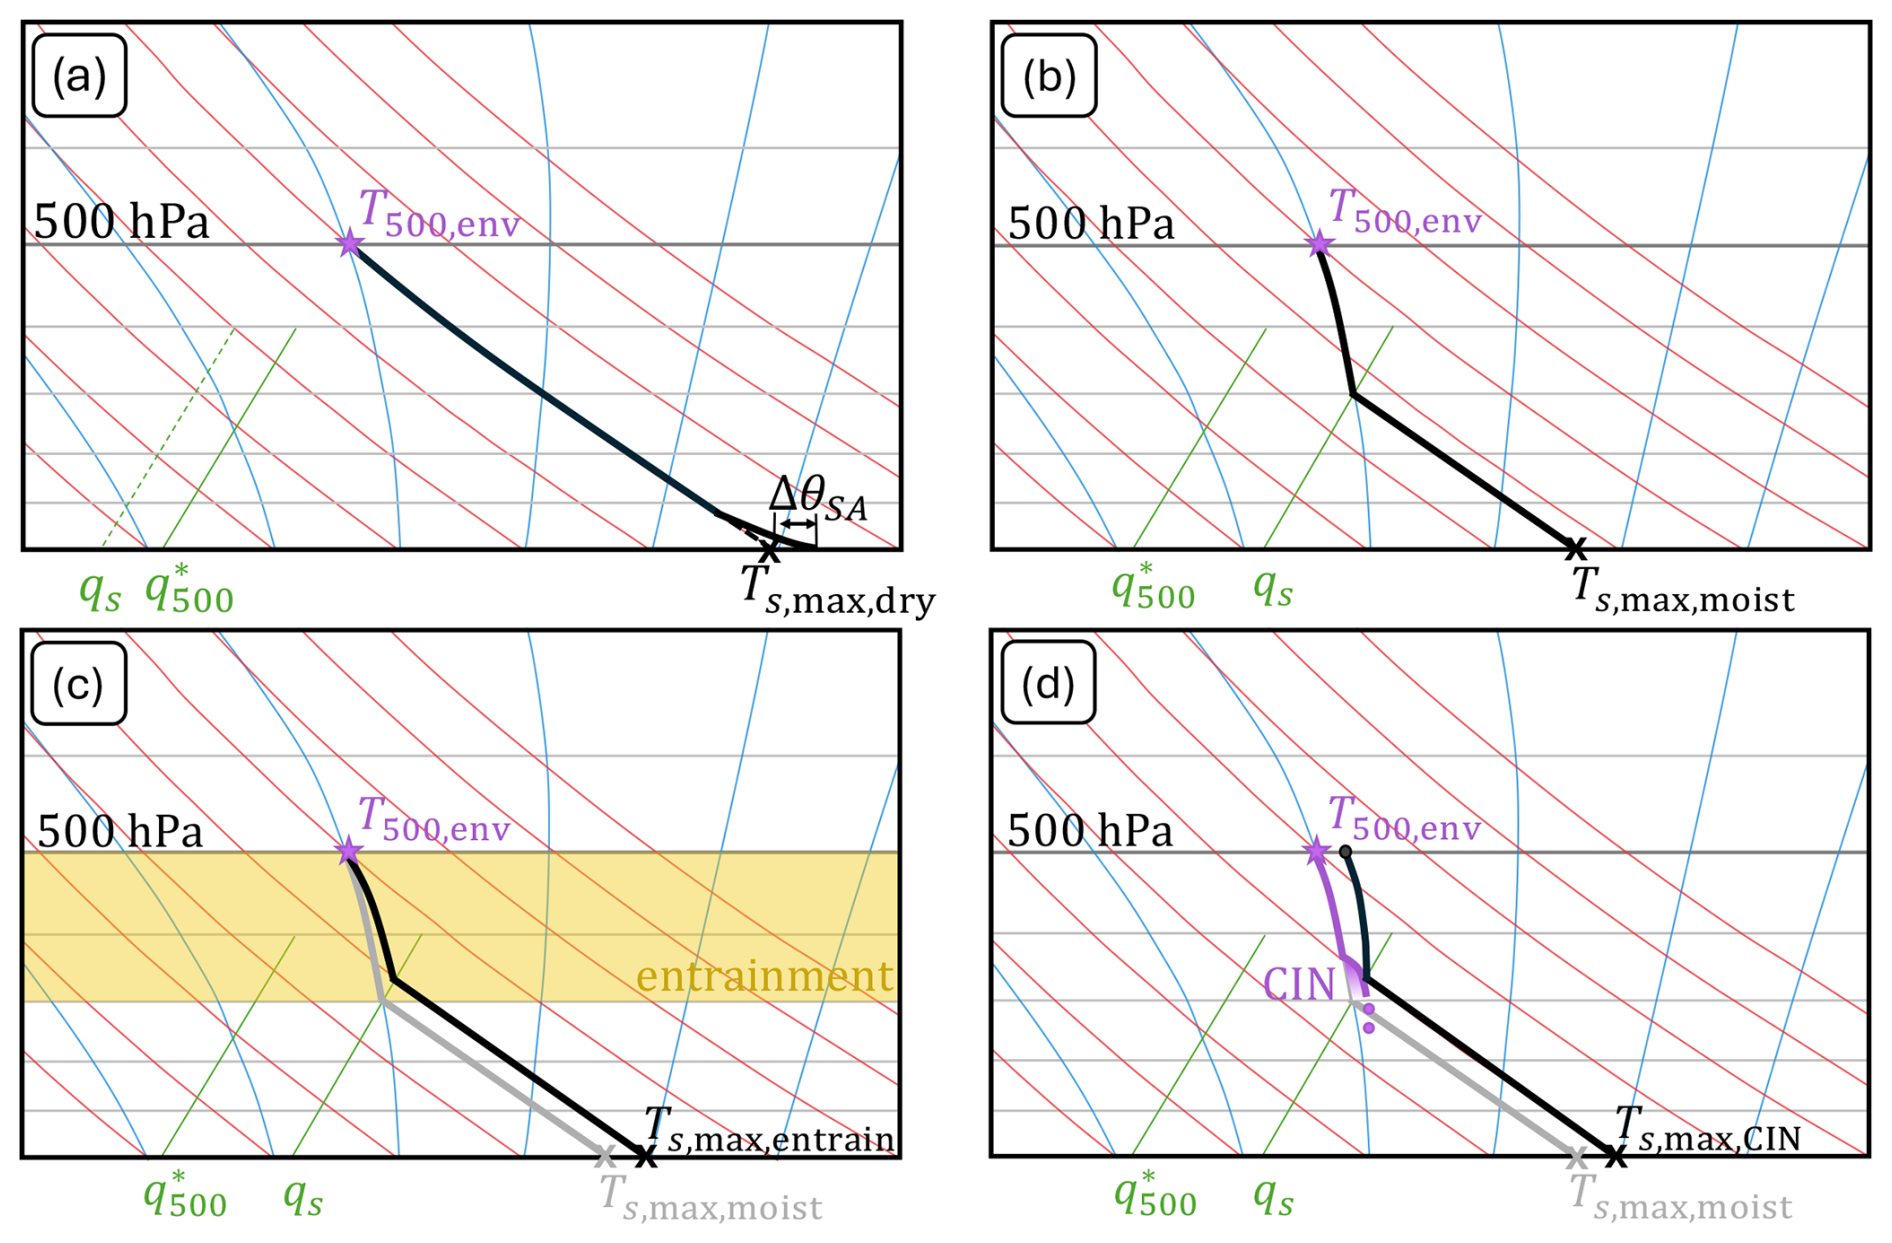
Figure 5Idealized Skew-T log-p diagrams that illustrate lower-tropospheric temperature profiles associated with different surface temperature upper bounds (shown by black crosses). In all panels, purple features denote environmental conditions, while black lines are parcel profiles achieving (or exceeding) an upper bound. Reference dry adiabats, moist adiabats, and mixing lines are respectively shown in red, blue, and green. Cases shown are (a) the dry adiabatic upper bound (Eq. 10), (b) the moist upper bound (Eq. 6), (c) an entrainment-adjusted moist upper bound, and (d) a CIN-adjusted moist upper bound. See text for descriptions.
The first reason concerns the difference between boundary-layer averaged properties and near-surface properties. To derive Eq. (6), we use the properties of a parcel that is lifted from the 2-m level to the mid-troposphere. Thermals rising from the boundary layer, however, will sample average properties of the boundary layer. The average boundary layer MSE is lower than the 2-m MSE owing to vertical moisture gradients and near-surface superadiabaticity (which, although weaker over moist surfaces, remains common in ERA5 during the hottest part of the day – see Fig. 3d). Thus, MSEs can exceed , which is equivalent to the moist bound being exceeded, without moist convection developing – simply because convective elements rising from the boundary layer are unlikely to be as warm (in the θ or DSE sense) and moist as the near-surface air.
The second reason is the entrainment of dry free-tropospheric air into convective clouds. The moist upper bound (Eq. 6) is derived based on the properties of a parcel that does not mix with its environment as it rises. In practice, the entrainment of environmental air into a convective cloud reduces its buoyancy. Figure 5c illustrates this effect: an entraining parcel cools more rapidly in its saturated ascent phase, thus requires a higher surface temperature than an undiluted parcel to reach the same 500 hPa temperature. The effect is more pronounced when the environmental air is dry. Based on an idealized entraining plume model, Duan et al. (2024) proposed to scale the reduction in buoyancy due to entrainment as a function of the subsaturation of the environment at the 850 hPa level. While their study targeted tropical regions, this process is likely also relevant in midlatitudes. However, one must keep in mind that the entrainment of dry air into rising clouds is only possible above the LCL: thus, Eq. (6) may be corrected by a term depending on the subsaturation between the LCL and 500 hPa, as well as the depth of the entraining layer. In particular, the entrainment of dry air into convective clouds at the 850 hPa level is unlikely to be relevant for heat extremes in the dry western US (Risser et al., 2025), as the LCL often lies far above this level; including its effect may lead to unrealistically high upper bounds. Evidently, this process is irrelevant in cases where pLCL≤500 hPa.
The third reason that may explain instances exceeding Eq. (6) is the presence of convective inhibition (CIN): a warm layer between the surface and the 500 hPa level may prevent the release of instability, allowing the surface to warm past Eq. (6) and accumulate substantial convective available potential energy (CAPE). Figure 5d provides a graphical illustration. However, this effect should remain small except in instances of large CAPE (ZB23), which we expect to be marginally relevant for heatwaves, but are likely relevant for moist heatwaves (Li and Tamarin-Brodsky, 2026). Furthermore, the parcel-based view of convective inhibition should be interpreted with caution, as wide updrafts can overcome CIN layers due to non-local buoyancy effects (Kuo and Neelin, 2025). Note that convective inhibition is also irrelevant to dry convective cases, as CIN layers have no equivalent for dry convection: they would require superadiabaticity away from the surface, which can only persist for short time spans.
This study discusses physics-based upper bounds for extreme surface temperature. We talk about “bounds”, rather than a single bound, because different starting hypotheses and different surface humidity conditions lead to different upper bounds. We use the approach of ZB23, which attempts to constrain surface temperature Ts as a function of mid-tropospheric temperature and surface height (and potentially specific humidity) by assuming that convective instability limits Ts.
Our central point is that the highest temperature reachable by a near-surface parcel that remains convectively stable at 500 hPa is the dry adiabatic bound (Eq. 10). This bound is simply obtained by following a dry adiabat from T500 down to the surface, as illustrated in Fig. 5a in dashed black. A less accurate version of that bound (but which dispenses from the knowledge of ps), based on the conservation of DSE, is Eq. (7). The upper bound derived by ZB23 (their Eq. 3) exceeds the dry adiabatic bound because it allows for parcels with significant buoyancy at 500 hPa. However, this bound relies on the hypothesis that the 500 hPa level is within the free troposphere (equivalently, that the PBL top is below the 500 hPa level), which does not hold in ERA5 data for profiles that exceed the dry bound.
Observations and reanalysis data show that the dry bound can be breached by more than 5 K. Temperature profiles that exceed this bound are, by definition, unstable to dry convection. They all feature a superadiabatic layer (a layer in which potential temperature decreases with height), which is always located close to the surface, and is an expected feature of dry convective boundary layers. Figure 5a illustrates a typical such profile in solid black; the difference between the near-surface θ and the mixed-layer θ is termed superadiabatic layer strength (ΔθSA). Instances that exceed the dry adiabatic bound occur exclusively in arid regions, and primarily over high altitude surfaces: Indeed, a quasi-necessary condition for exceeding the dry adiabatic bound is that the PBL top reaches above the 500 hPa level, which happens more readily over elevated surfaces. In such conditions, T500 may not reliably be considered an external control on surface temperature – understanding the processes that can limit PBL growth over dry surfaces may be a more fruitful approach to bounding heatwave intensities in these cases.
If near-surface specific humidity (perhaps more precisely, boundary layer averaged specific humidity) is large enough for clouds to form below the 500 hPa level – i.e. larger than – the hypothesis that convective instability limits Ts leads to a tighter upper bound (Eq. 6). Figure 5b illustrates graphically how this moist convective upper bound is obtained: one follows a moist adiabat from T500 down to the LCL, then a dry adiabat down to the surface. Several effects may lead Ts to exceed this bound without convection occurring, among which the entrainment of dry air into rising clouds (which increases the lapse rate in the saturated phase of the parcel's ascent, see Fig. 5c), and the presence of a CIN layer (which may prevent parcels from convecting up to the 500 hPa level, see Fig. 5d).
The current conceptual understanding of heatwaves can be grossly divided into two schools of thought. One of these adopts a “bottom-up” approach in which land surface properties play a key role in setting heatwave intensity. The other emphasizes a “top-down” control, whereby free tropospheric temperature caps heatwave intensity by controlling the threshold for convective instability. We suggest that a purely “top-down” approach may not be justified over dry land surfaces, where the influence of the surface may reach deep into the mid-troposphere, and where the surface superadiabatic layer may modulate the strength of the hottest extremes by several degrees. This reaffirms the importance of land surface processes in setting the strongest heatwaves. We argue that further understanding of the physical limits on PBL depth and surface superadiabaticity is required, not only to constrain the intensity of heat extremes but also their regional trends. Reliable projections of future record-breaking heatwaves would greatly benefit from further research on these topics.
The ERA5 datasets are available from the Copernicus Climate Change Service (C3S) Climate Data Store (Copernicus Climate Change Service, 2023, https://doi.org/10.24381/cds.143582cf). The code used in producing the figures and some processed ERA5 and IGRA data are available at Zenodo (Nicolas, 2026).
The supplement related to this article is available online at https://doi.org/10.5194/wcd-7-843-2026-supplement.
QN conceptualized the study and wrote the original draft. Both authors contributed to the analysis and to the plots, and both authors reviewed and edited the paper.
The contact author has declared that none of the authors has any competing interests.
Publisher's note: Copernicus Publications remains neutral with regard to jurisdictional claims made in the text, published maps, institutional affiliations, or any other geographical representation in this paper. The authors bear the ultimate responsibility for providing appropriate place names. Views expressed in the text are those of the authors and do not necessarily reflect the views of the publisher.
The authors would like to thank William Boos, Robin Noyelle, Lukas Papritz, and Yi Zhang for helpful discussions and feedback, as well as Heini Wernli for his great insights and support. They are also grateful to Michael Byrne and one anonymous reviewer for their constructive comments which helped improve the discussion.
This research has been supported by the ETH Zürich Foundation (grant no. 24-1 FEL-032) and the Schweizerischer Nationalfonds zur Förderung der Wissenschaftlichen Forschung (grant no. 219244).
This paper was edited by David Battisti and reviewed by Michael Byrne and one anonymous referee.
Arakawa, A. and Schubert, W. H.: Interaction of a cumulus cloud ensemble with the large-scale environment, Part I, J. Atmos. Sci., 31, 674–701, https://doi.org/10.1175/1520-0469(1974)031<0674:IOACCE>2.0.CO;2, 1974. a
Bastos, A., Orth, R., Reichstein, M., Ciais, P., Viovy, N., Zaehle, S., Anthoni, P., Arneth, A., Gentine, P., Joetzjer, E., Lienert, S., Loughran, T., McGuire, P. C., O, S., Pongratz, J., and Sitch, S.: Vulnerability of European ecosystems to two compound dry and hot summers in 2018 and 2019, Earth Syst. Dynam., 12, 1015–1035, https://doi.org/10.5194/esd-12-1015-2021, 2021. a
Blay-Carreras, E., Pino, D., Vilà-Guerau de Arellano, J., van de Boer, A., De Coster, O., Darbieu, C., Hartogensis, O., Lohou, F., Lothon, M., and Pietersen, H.: Role of the residual layer and large-scale subsidence on the development and evolution of the convective boundary layer, Atmos. Chem. Phys., 14, 4515–4530, https://doi.org/10.5194/acp-14-4515-2014, 2014. a
Businger, J. A., Wyngaard, J. C., Izumi, Y., and Bradley, E. F.: Flux-profile relationships in the atmospheric surface layer, J. Atmos. Sci., 28, 181–189, https://doi.org/10.1175/1520-0469(1971)028<0181:FPRITA>2.0.CO;2, 1971. a
Byrne, M. P. and O'Gorman, P. A.: Land–ocean warming contrast over a wide range of climates: convective quasi-equilibrium theory and idealized simulations, J. Climate, 26, 4000–4016, https://doi.org/10.1175/JCLI-D-12-00262.1, 2013. a
Callahan, C. W. and Mankin, J. S.: Globally unequal effect of extreme heat on economic growth, Sci. Adv., 8, eadd3726, https://doi.org/10.1126/sciadv.add3726, 2022. a
Chen, X., Škerlak, B., Rotach, M. W., Añel, J. A., Su, Z., Ma, Y., and Li, M.: Reasons for the extremely high-ranging planetary boundary layer over the western Tibetan Plateau in winter, J. Atmos. Sci., 73, 2021–2038, https://doi.org/10.1175/JAS-D-15-0148.1, 2016. a
Coles, S.: An Introduction to Statistical Modeling of Extreme Values, Springer, https://doi.org/10.1007/978-1-4471-3675-0, 2001. a
Copernicus Climate Change Service: Complete ERA5 global atmospheric reanalysis, Copernicus Climate Change Service (C3S) Climate Data Store (CDS) [data set], https://doi.org/10.24381/cds.143582cf, 2023. a
Culf, A. D.: Equilibrium evaporation beneath a growing convective boundary layer, Bound.-Lay. Meteorol., 70, 37–49, https://doi.org/10.1007/BF00712522, 1994. a
Duan, S. Q., Ahmed, F., and Neelin, J. D.: Moist heatwaves intensified by entrainment of dry air that limits deep convection, Nat. Geosci., 17, 837–844, https://doi.org/10.1038/s41561-024-01498-y, 2024. a
Durre, I., Yin, X., Vose, R. S., Applequist, S., Arnfield, J., Korzeniewski, B., and Hundermark, B.: Integrated Global Radiosonde Archive (IGRA), version 2.2, NOAA National Centers for Environmental Information [data set], https://doi.org/10.7289/V5X63K0Q, 2016. a
Dyer, A.: A review of flux-profile relationships, Bound.-Lay. Meteorol., 7, 363–372, https://doi.org/10.1007/BF00240838, 1974. a
ECMWF: IFS Documentation CY41R2 – Part IV: Physical Processes, 4, ECMWF, https://doi.org/10.21957/tr5rv27xu, 2016. a, b
Ek, M. B. and Holtslag, A. A. M.: Influence of soil moisture on boundary layer cloud development, J. Hydrometeorol., 5, 86–99, https://doi.org/10.1175/1525-7541(2004)005<0086:IOSMOB>2.0.CO;2, 2004. a
Emanuel, K. A., David Neelin, J., and Bretherton, C. S.: On large-scale circulations in convecting atmospheres, Q. J. Roy. Meteor. Soc., 120, 1111–1143, https://doi.org/10.1002/qj.49712051902, 1994. a, b
Fischer, E. M., Bador, M., Huser, R., Kendon, E. J., Robinson, A., and Sippel, S.: Record-breaking extremes in a warming climate, Nat. Rev. Earth Environ., 6, 456–470, https://doi.org/10.1038/s43017-025-00681-y, 2025. a
Gamo, M.: Thickness of the dry convection and large-scale subsidence above deserts, Bound.-Lay. Meteorol., 79, 265–278, https://doi.org/10.1007/BF00119441, 1996. a
Garratt, J. R.: Extreme maximum land surface temperatures, J. Appl. Meteorol., 31, 1096–1105, https://doi.org/10.1175/1520-0450(1992)031<1096:EMLST>2.0.CO;2, 1992. a
Gentine, P., Betts, A. K., Lintner, B. R., Findell, K. L., van Heerwaarden, C. C., Tzella, A., and D'Andrea, F.: A probabilistic bulk model of coupled mixed layer and convection. Part I: Clear-sky case, J. Atmos. Sci., 70, 1543–1556, https://doi.org/10.1175/JAS-D-12-0145.1, 2013a. a
Gentine, P., Holtslag, A. A. M., D'Andrea, F., and Ek, M.: Surface and atmospheric controls on the onset of moist convection over land, J. Hydrometeorol., 14, 1443–1462, https://doi.org/10.1175/JHM-D-12-0137.1, 2013b. a
Ghil, M., Yiou, P., Hallegatte, S., Malamud, B. D., Naveau, P., Soloviev, A., Friederichs, P., Keilis-Borok, V., Kondrashov, D., Kossobokov, V., Mestre, O., Nicolis, C., Rust, H. W., Shebalin, P., Vrac, M., Witt, A., and Zaliapin, I.: Extreme events: dynamics, statistics and prediction, Nonlin. Processes Geophys., 18, 295–350, https://doi.org/10.5194/npg-18-295-2011, 2011. a
Hermann, M., Röthlisberger, M., Gessler, A., Rigling, A., Senf, C., Wohlgemuth, T., and Wernli, H.: Meteorological history of low-forest-greenness events in Europe in 2002–2022, Biogeosciences, 20, 1155–1180, https://doi.org/10.5194/bg-20-1155-2023, 2023. a
Hersbach, H., Bell, B., Berrisford, P., Hirahara, S., Horányi, A., Muñoz-Sabater, J., Nicolas, J., Peubey, C., Radu, R., Schepers, D., Simmons, A., Soci, C., Abdalla, S., Abellan, X., Balsamo, G., Bechtold, P., Biavati, G., Bidlot, J., Bonavita, M., De Chiara, G., Dahlgren, P., Dee, D., Diamantakis, M., Dragani, R., Flemming, J., Forbes, R., Fuentes, M., Geer, A., Haimberger, L., Healy, S., Hogan, R. J., Hólm, E., Janisková, M., Keeley, S., Laloyaux, P., Lopez, P., Lupu, C., Radnoti, G., de Rosnay, P., Rozum, I., Vamborg, F., Villaume, S., and Thépaut, J.-N.: The ERA5 global reanalysis, Q. J. Roy. Meteor. Soc., 146, 1999–2049, https://doi.org/10.1002/qj.3803, 2020. a
Hotz, B., Papritz, L., and Röthlisberger, M.: Understanding the vertical temperature structure of recent record-shattering heatwaves, Weather Clim. Dynam., 5, 323–343, https://doi.org/10.5194/wcd-5-323-2024, 2024. a
Juang, J.-Y., Katul, G. G., Porporato, A., Stoy, P. C., Siqueira, M. S., Detto, M., Kim, H.-S., and Oren, R.: Eco-hydrological controls on summertime convective rainfall triggers, Glob. Change Biol., 13, 887–896, https://doi.org/10.1111/j.1365-2486.2007.01315.x, 2007a. a
Juang, J.-Y., Porporato, A., Stoy, P. C., Siqueira, M. S., Oishi, A. C., Detto, M., Kim, H.-S., and Katul, G. G.: Hydrologic and atmospheric controls on initiation of convective precipitation events, Water Resour. Res., 43, https://doi.org/10.1029/2006WR004954, 2007b. a
Kharin, V. V. and Zwiers, F. W.: Estimating extremes in transient climate change simulations, J. Climate, 18, 1156–1173, https://doi.org/10.1175/JCLI3320.1, 2005. a
Konings, A. G., Katul, G. G., and Porporato, A.: The rainfall-no rainfall transition in a coupled land-convective atmosphere system, Geophys. Res. Lett., 37, https://doi.org/10.1029/2010GL043967, 2010. a
Kuo, Y.-H. and Neelin, J. D.: Anelastic convective entities. Part I: Formulation and implication for nighttime convection, J. Atmos. Sci., 82, 599–623, https://doi.org/10.1175/JAS-D-23-0214.1, 2025. a
Lesk, C., Anderson, W., Rigden, A., Coast, O., Jägermeyr, J., McDermid, S., Davis, K. F., and Konar, M.: Compound heat and moisture extreme impacts on global crop yields under climate change, Nat. Rev. Earth Environ., 3, 872–889, https://doi.org/10.1038/s43017-022-00368-8, 2022. a
Li, F. and Tamarin-Brodsky, T.: Atmospheric stability sets maximum moist heat and convection in the midlatitudes, Sci. Adv., 12, eaea8453, https://doi.org/10.1126/sciadv.aea8453, 2026. a
Manoli, G., Domec, J.-C., Novick, K., Oishi, A. C., Noormets, A., Marani, M., and Katul, G.: Soil–plant–atmosphere conditions regulating convective cloud formation above southeastern US pine plantations, Glob. Change Biol., 22, 2238–2254, https://doi.org/10.1111/gcb.13221, 2016. a
Matthews, T., Raymond, C., Foster, J., Baldwin, J. W., Ivanovich, C., Kong, Q., Kinney, P., and Horton, R. M.: Mortality impacts of the most extreme heat events, Nat. Rev. Earth Environ., 6, 193–210, https://doi.org/10.1038/s43017-024-00635-w, 2025. a
McNaughton, K. and Spriggs, T.: A mixed-layer model for regional evaporation, Bound.-Lay. Meteorol., 34, 243–262, https://doi.org/10.1007/BF00122381, 1986. a
Miralles, D. G., Teuling, A. J., van Heerwaarden, C. C., and Vilà-Guerau de Arellano, J.: Mega-heatwave temperatures due to combined soil desiccation and atmospheric heat accumulation, Nat. Geosci., 7, 345–349, https://doi.org/10.1038/ngeo2141, 2014. a, b, c
Nicolas, Q.: Code for Nicolas & Hotz, Dry and moist convective upper bounds for near-surface temperatures, Zenodo [code], https://doi.org/10.5281/zenodo.20125545, 2026. a
Noyelle, R., Zhang, Y., Yiou, P., and Faranda, D.: Maximal reachable temperatures for Western Europe in current climate, Environ. Res. Lett., 18, 094061, https://doi.org/10.1088/1748-9326/acf679, 2023. a, b
Risser, M. D., Feldman, D. R., Boos, W. R., and Rahimi, S.: Upper bounds for 21st-century surface air temperatures in the western United States, Environ. Res. Lett., 20, 064043, https://doi.org/10.1088/1748-9326/adda62, 2025. a, b
Romps, D. M.: MSE minus CAPE is the true conserved variable for an adiabatically lifted parcel, J. Atmos. Sci., 72, 3639–3646, https://doi.org/10.1175/JAS-D-15-0054.1, 2015. a, b
Santanello, Jr., J. A., Friedl, M. A., and Kustas, W. P.: An empirical investigation of convective planetary boundary layer evolution and its relationship with the land surface, J. Appl. Meteorol., 44, 917–932, https://doi.org/10.1175/JAM2240.1, 2005. a
Seneviratne, S. I., Corti, T., Davin, E. L., Hirschi, M., Jaeger, E. B., Lehner, I., Orlowsky, B., and Teuling, A. J.: Investigating soil moisture–climate interactions in a changing climate: a review, Earth-Sci. Rev., 99, 125–161, https://doi.org/10.1016/j.earscirev.2010.02.004, 2010. a
Singh, M. S. and O'Gorman, P. A.: Influence of entrainment on the thermal stratification in simulations of radiative-convective equilibrium, Geophys. Res. Lett., 40, 4398–4403, https://doi.org/10.1002/grl.50796, 2013. a
Siqueira, M., Katul, G., and Porporato, A.: Soil moisture feedbacks on convection triggers: the role of soil–plant hydrodynamics, J. Hydrometeorol., 10, 96–112, https://doi.org/10.1175/2008JHM1027.1, 2009. a
Stap, L. B., van den Hurk, B. J. J. M., van Heerwaarden, C. C., and Neggers, R. A. J.: Modeled contrast in the response of the surface energy balance to heat waves for forest and grassland, J. Hydrometeorol., 15, 973–989, https://doi.org/10.1175/JHM-D-13-029.1, 2014. a
Stull, R. B.: Convective mixed layer, in: An Introduction to Boundary Layer Meteorology, Springer, 441–497, https://doi.org/10.1007/978-94-009-3027-8_11, 1988. a, b
Teuling, A. J., Seneviratne, S. I., Stöckli, R., Reichstein, M., Moors, E., Ciais, P., Luyssaert, S., van den Hurk, B., Ammann, C., Bernhofer, C., Dellwik, E., Gianelle, D., Gielen, B., Grünwald, T., Klumpp, K., Montagnani, L., Moureaux, C., Sottocornola, M., and Wohlfahrt, G.: Contrasting response of European forest and grassland energy exchange to heatwaves, Nat. Geosci., 3, 722–727, https://doi.org/10.1038/ngeo950, 2010. a
van Heerwaarden, C. C. and Teuling, A. J.: Disentangling the response of forest and grassland energy exchange to heatwaves under idealized land–atmosphere coupling, Biogeosciences, 11, 6159–6171, https://doi.org/10.5194/bg-11-6159-2014, 2014. a
van Heerwaarden, C. C., Vilà-Guerau de Arellano, J., Moene, A. F., and Holtslag, A. A. M.: Interactions between dry-air entrainment, surface evaporation and convective boundary-layer development, Q. J. Roy. Meteor. Soc., 135, 1277–1291, https://doi.org/10.1002/qj.431, 2009. a
van Heerwaarden, C. C., de Arellano, J. V.-G., Gounou, A., Guichard, F., and Couvreux, F.: Understanding the daily cycle of evapotranspiration: a method to quantify the influence of forcings and feedbacks, J. Hydrometeorol., 11, 1405–1422, https://doi.org/10.1175/2010JHM1272.1, 2010. a
Vilà-Guerau de Arellano, J.: Role of nocturnal turbulence and advection in the formation of shallow cumulus over land, Q. J. Roy. Meteor. Soc., 133, 1615–1627, https://doi.org/10.1002/qj.138, 2007. a
Vilà-Guerau de Arellano, J., Van Heerwaarden, C. C., and Lelieveld, J.: Modelled suppression of boundary-layer clouds by plants in a CO2-rich atmosphere, Nat. Geosci., 5, 701–704, https://doi.org/10.1038/ngeo1554, 2012. a
Yin, J., Gu, H., Huang, J., and Wang, M.: An investigation into the vertical structures of low-altitude atmosphere over the Central Taklimakan Desert in summer, Atmos. Sci. Lett., 22, e1042, https://doi.org/10.1002/asl.1042, 2021. a
Zeder, J. and Fischer, E. M.: Quantifying the statistical dependence of mid-latitude heatwave intensity and likelihood on prevalent physical drivers and climate change, Adv. Stat. Clim. Meteorol. Oceanogr., 9, 83–102, https://doi.org/10.5194/ascmo-9-83-2023, 2023. a
Zhang, L., Risser, M. D., Wehner, M. F., and O'Brien, T. A.: Leveraging extremal dependence to better characterize the 2021 Pacific Northwest heatwave, J. Agric. Biol. Environ. Stat., https://doi.org/10.1007/s13253-024-00636-8, 2024. a
Zhang, Y. and Boos, W. R.: An upper bound for extreme temperatures over midlatitude land, P. Natl. Acad. Sci. USA, 120, e2215278120, https://doi.org/10.1073/pnas.2215278120, 2023. a, b
Zhang, Y., Held, I., and Fueglistaler, S.: Projections of tropical heat stress constrained by atmospheric dynamics, Nat. Geosci., 14, 133–137, https://doi.org/10.1038/s41561-021-00695-3, 2021. a
Zhu, P. and Albrecht, B.: A theoretical and observational analysis on the formation of fair-weather cumuli, J. Atmos. Sci., 59, 1983–2005, https://doi.org/10.1175/1520-0469(2002)059<1983:ATAOAO>2.0.CO;2, 2002. a
Note that the condensation of water vapor contained in the parcel is considered an adiabatic process, as no external heat source is applied.