the Creative Commons Attribution 4.0 License.
the Creative Commons Attribution 4.0 License.
 | 31 Mar 2022
Future changes in the extratropical storm tracks and cyclone intensity, wind speed, and structure
Matthew D. K. Priestley
Jennifer L. Catto
Future changes in extratropical cyclones and the associated storm tracks are uncertain. Using the new CMIP6 models, we investigate changes to seasonal mean storm tracks and composite wind speeds at different levels of the troposphere for the winter and summer seasons in both the Northern Hemisphere (NH) and Southern Hemisphere (SH). Changes are assessed across four different climate scenarios. The seasonal mean storm tracks are predicted to shift polewards in the SH and also in the North Pacific, with an extension into Europe for the North Atlantic storm track. Overall, the number of cyclones will decrease by ∼5 % by the end of the 21st century, although the number of extreme cyclones will increase by 4 % in NH winter. Cyclone wind speeds are projected to strengthen throughout the troposphere in the winter seasons and also summer in the SH, with a weakening projected in NH summer, although there are minimal changes in the maximum wind speed in the lower troposphere. Changes in wind speeds are concentrated in the warm sector of cyclones, and the area of extreme winds may be up to 40 % larger by the end of the century. The largest changes are seen for the SSP5-85 scenario, although a large amount of change can be mitigated by restricting warming to that seen in the SSP1-26 and 2-45 scenarios. Extreme cyclones show larger increases in wind speed and peak vorticity than the average-strength cyclones, with the extreme cyclones showing a larger increase in wind speed in the warm sector.
- Article
(15249 KB) - Full-text XML
-
Supplement
(10281 KB) - BibTeX
- EndNote


Extratropical cyclones are the key driver of day-to-day weather variability in the mid-latitudes and can be associated with significant impacts from extreme winds (Browning, 2004) and precipitation (Hawcroft et al., 2012). In the most recent assessment report from the IPCC (AR5; Christensen et al., 2013), it was stated that it is likely there will be a poleward shift of storm tracks in the Southern Hemisphere (SH) and North Pacific; however, there is low confidence in the magnitude of regional storm track changes. With the recent availability of models from the 6th phase of the Coupled Model Intercomparison Project (CMIP6; Eyring et al., 2016), a renewed assessment of these changes can be made.
Changes in the seasonal mean storm tracks are relatively robust and have been consistent across a number of generations of GCMs (Yin, 2005; Chang et al., 2012, 2013; Colle et al., 2013; Zappa et al., 2013; Harvey et al., 2020). In the SH a robust poleward shift of the storm track is projected (Bengtsson et al., 2006; Chang et al., 2012; Chang, 2017), with the pattern of change being less clear in the Northern Hemisphere (NH). In the NH there is a projected shift of the storm track poleward in the western North Pacific and an extension of the North Atlantic storm track into Europe (Bengtsson et al., 2006; Zappa et al., 2013; Harvey et al., 2020). Furthermore, a reduction in the number of cyclones over the Mediterranean is projected (Zappa et al., 2015). The differing responses in the NH and SH are largely a result of opposing forcings in the upper and lower troposphere in the NH (Shaw et al., 2016; Shaw, 2019) and the role of low-level, high-latitude heating in shifting the storm tracks equatorwards (Butler et al., 2010). Using the Eulerian definition of the storm tracks, CMIP6 models have shown to have larger projected changes than CMIP5 (Harvey et al., 2020). These larger changes are thought to be a result of the higher climate sensitivity of CMIP6 models, relative to CMIP5 (Zelinka et al., 2020). Currently, no Lagrangian perspective on storm track changes in CMIP6 models has been performed.
It is widely agreed that the total number of extratropical cyclones will decrease in the future (Geng and Sugi, 2003; Bengtsson et al., 2006; Catto et al., 2011; Mizuta et al., 2011; Chang et al., 2012; Zappa et al., 2013; Michaelis et al., 2017; Sinclair et al., 2020) and that the amount of associated precipitation will increase (Christensen et al., 2013; Zappa et al., 2013; Michaelis et al., 2017; Kodama et al., 2019; Sinclair et al., 2020). However, there is disagreement in how the number of extreme cyclones will change, with some studies projecting an increase (Geng and Sugi, 2003; Mizuta et al., 2011; Colle et al., 2013; Grieger et al., 2014; Pfahl et al., 2015) and some a decrease (Zappa et al., 2013; Michaelis et al., 2017). Despite this, there is a general consensus that the intensity of the most extreme cyclones will increase in the future (Mizuta et al., 2011; Pfahl et al., 2015; Sinclair et al., 2020; Dolores-Tesillos et al., 2021). Differences in the sign or magnitude of the above changes are thought to be dependent on the choice of model used, the variable examined, the geographic area of interest, and the selection of cyclones studied (see Ulbrich et al., 2009, and Catto et al., 2019, for a full review). Consequently, a coherent multi-model analysis of extratropical cyclones on a global scale using consistent methodologies is required to fully understand the changes to cyclone intensity and frequency.
With regards to regional dependence, previous studies have demonstrated that cyclones are projected to increase in intensity in the SH (Chang et al., 2013; Chang, 2017), with a likely decrease in the NH (Zappa et al., 2013; Chang et al., 2013; Colle et al., 2013), with this also being seasonally dependent (Lehmann et al., 2014). Any changes are also dependent on the variable examined (Ulbrich et al., 2009; Catto et al., 2019), with studies that examine mean sea level pressure (MSLP) demonstrating an increase in cyclone intensity (Bengtsson et al., 2006; Mizuta et al., 2011) and those using vorticity showing little change or even a reduction (e.g. Champion et al., 2011; Zappa et al., 2013; Sinclair et al., 2020). Cyclone wind speed is commonly used to define intensity as it is more directly related to socio-economic impacts; however projections of changes to cyclone wind speeds by the end of the century also tend to be uncertain and vary regionally (Christensen et al., 2013). In a study of NH winter cyclones Bengtsson et al. (2009) and Zappa et al. (2013) found a reduction in the number of cyclones with strong wind speeds. However, both found increased wind speed intensity over Europe. In composite analyses of North Atlantic cyclones Michaelis et al. (2017) and Dolores-Tesillos et al. (2021) found an increase in wind speeds in extreme cyclones in the region of the warm front. Recently, Sinclair et al. (2020) used an idealized aquaplanet model and also found evidence for an increase in the strength of low-level cyclone wind speeds in the vicinity of the warm front by up to 3.5 m s−1, with this also being associated with stronger ascent. Therefore, an assessment considering a variety of intensity measures is therefore required to clarify these differences.
Commonly only the most extreme cyclones in the top 10 % of the intensity distribution are examined as these often provide the clearest climate change signal (Catto et al., 2010; Sinclair et al., 2020; Chang, 2018, 2017; Zappa et al., 2013) and are associated with the highest impacts (e.g. Ulbrich et al., 2001). However, it has been demonstrated in numerous studies that cyclones in the middle of the distribution can respond differently to the most extreme cyclones (Champion et al., 2011; Michaelis et al., 2017; Sinclair et al., 2020), with this commonly linked to the role of moist processes in cyclone intensification (Pfahl et al., 2015; Büeler and Pfahl, 2019).
In this study we will utilize a cyclone compositing method (as in Bengtsson et al., 2009; Catto et al., 2010; Dacre et al., 2012) and a number of models from the new CMIP6 ensemble (Eyring et al., 2016), across a range of future climate scenarios (O'Neill et al., 2016), to attempt to reduce some of the uncertainty surrounding projected change of cyclone intensity and cyclone-associated wind speeds in the future. Cyclone intensity will be assessed using relative vorticity, MSLP, and cyclone wind speeds. The questions we address in this study are as follows:
-
How will the frequency of extratropical cyclones change in the future and what are the regional variations in changes to the seasonal storm tracks?
-
How is cyclone intensity projected to change and do different intensity metrics give differing projections?
-
Do extreme and moderate-strength cyclones respond differently to changes in the future climate?
2.1 CMIP6 data
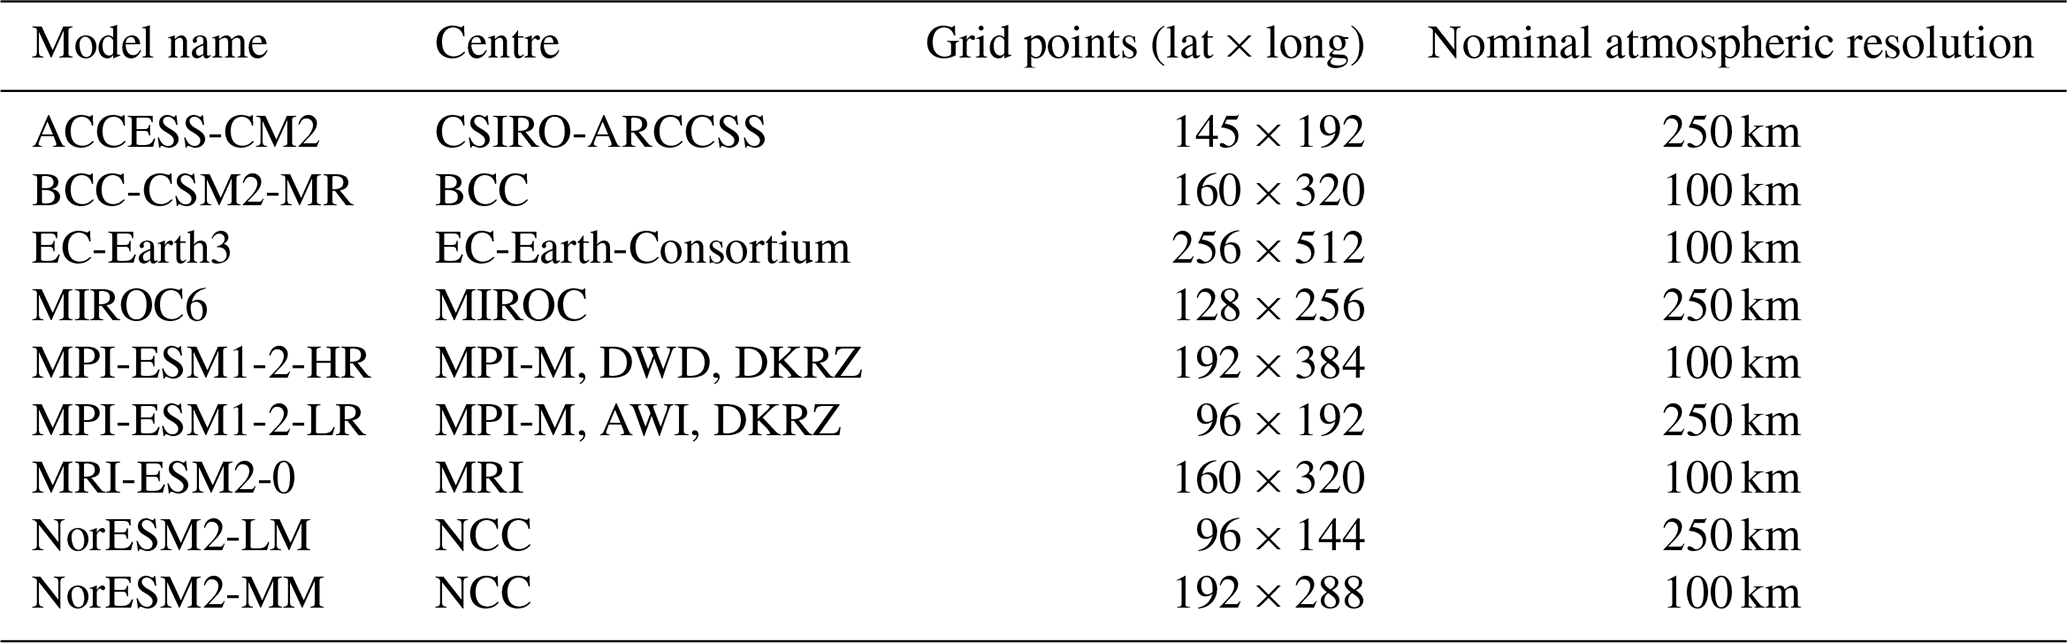
In this study the analysis is performed on models that are part of the CMIP6 (Eyring et al., 2016) and ScenarioMIP (O'Neill et al., 2016) coupled atmosphere–ocean experiments. In total nine models are used, and these are detailed in Table 1. These models have been chosen as they provide data for the required experiments at the necessary temporal resolutions for tracking, covering the historical period and the different future scenarios. For investigating sensitivity to future climate forcing, four different experiments, or shared socioeconomic pathways (SSPs; O’Neill et al., 2014), are analysed. These are SSP1-26, SSP2-45, SSP3-70, and SSP5-85, and all feature differently evolving climate forcings throughout the 21st century (see O'Neill et al., 2016, for full details).
Table 1Table of models used that contribute data to the historical, SSP1-26, SSP2-45, SSP3-70, and SSP5-85 experiments. Grid point resolutions stated are that of the Gaussian grid the u and v data are provided on. The quoted nominal resolution in kilometres is the stated nominal resolution of the atmospheric component of the model from Taylor et al. (2017).
The December, January, February (DJF) and June, July, August (JJA) periods are analysed for both the Northern Hemisphere (NH) and Southern Hemisphere (SH), representing each hemisphere's winter and summer seasons. For the historical period the years 1979–2014 are used, and in each of the future scenarios the years 2040–2100 have been analysed. However, in all composite analysis only an end-of-century response is studied, and this is the period 2080–2100.
2.2 Cyclone identification and tracking
For cyclone identification and tracking, the method of Hodges (1994, 1995, 1999) is used. In order to identify cyclones the method uses 6-hourly relative vorticity at 850 hPa as an input. As CMIP6 models feature varying atmospheric resolutions, the method first spectrally truncates the vorticity field to T42 and removes the influence of planetary scale waves by masking wavenumbers less than 5. To ensure only mobile, well-developed, and long-lived cyclones are analysed, each track must persist for at least 48 h and travel at least 1000 km from its point of origin. Furthermore, each cyclone must have a maximum vorticity of at least s−1 (scaled by −1 in the SH). To assign MSLP values to tracks, we follow Bengtsson et al. (2009) and use a B-spline interpolation and minimization technique within a 5∘ radius from the cyclone centre to identify the minimum MSLP value.
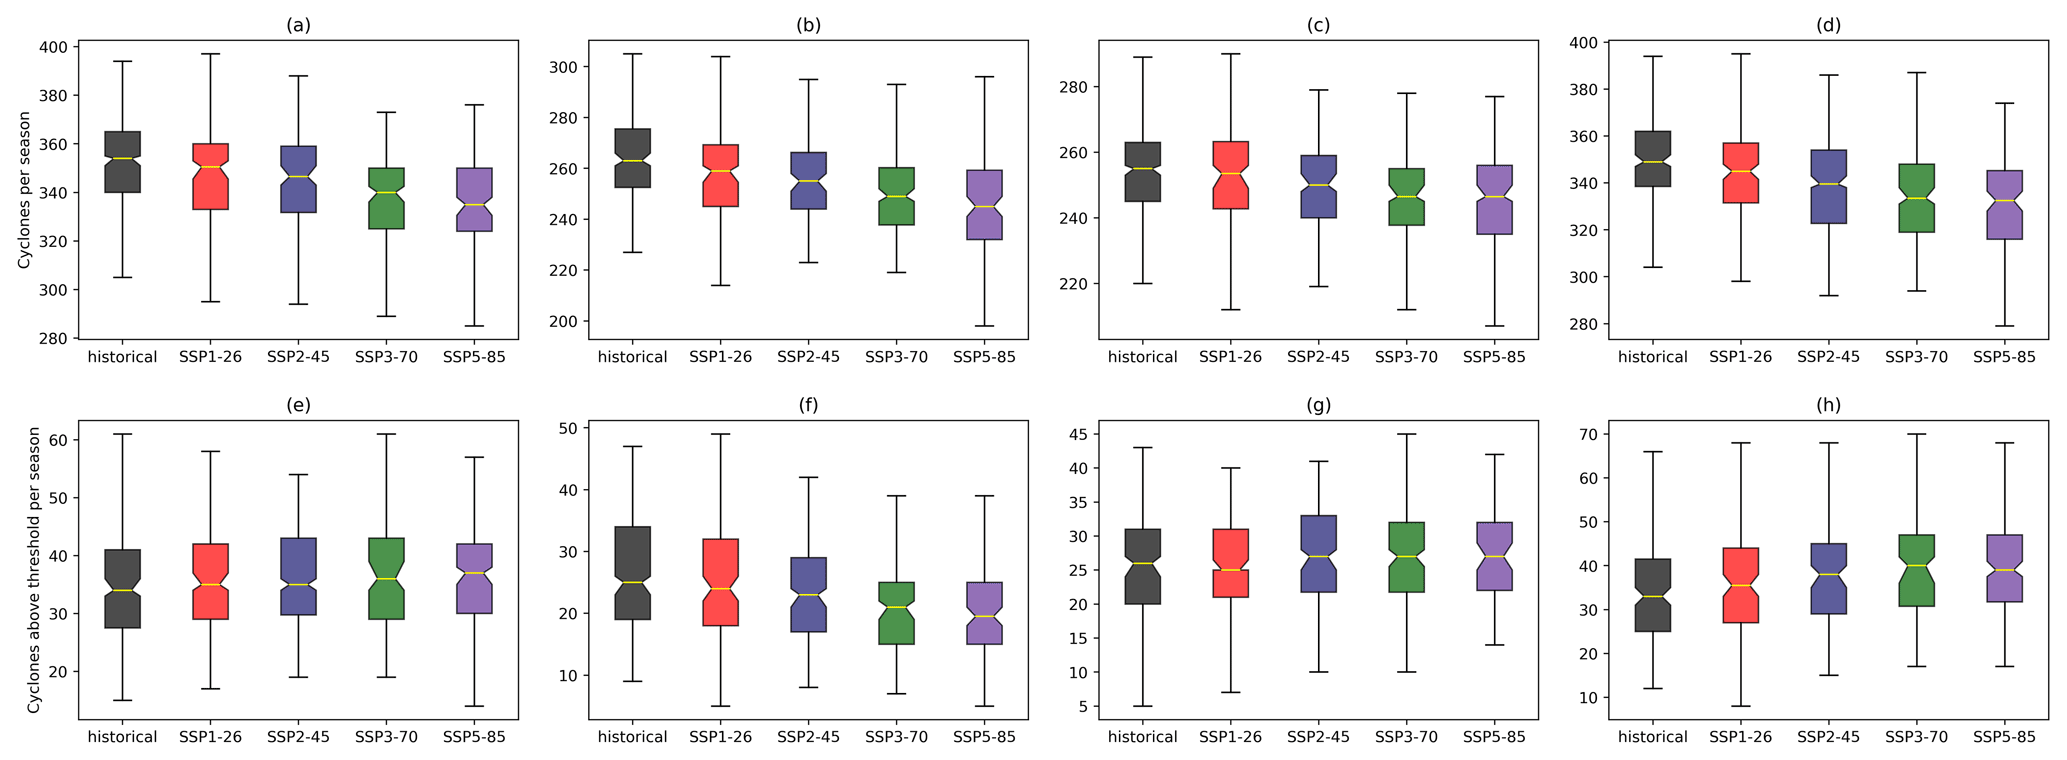
Figure 1Boxplots of (a–d) the total number of identified extratropical cyclones in the CMIP6 models and (e–h) those that exceed the historical 90th percentile of peak cyclone T42 vorticity for the historical (black), SSP1-26 (red), SSP2-45(blue), SSP3-70 (green), and SSP5-85 (purple) experiments. Boxplots are shown for NH DJF (a, e), NH JJA (b, f), SH DJF (c, g), and SH JJA (d, h). The evaluated periods are 1979–2014 for the historical simulation and 2080–2100 for the different SSPs. The yellow lines in the boxes are the median, and the boxes extend to the 25th and 75th percentiles. Whiskers extend to 1.5 times the inter-quartile range (IQR). Notches on the boxes represent the 5 %–95 % confidence range on the median from 10 000 bootstrap re-samples. Units for all boxes and all panels are cyclones per season.
2.3 Cyclone compositing
In order to investigate the structural features of cyclones and how they respond to future warming, cyclone composites are created. The method used here is the same as Bengtsson et al. (2009), Catto et al. (2010), Dacre et al. (2012), Sinclair et al. (2020), Priestley and Catto (2022), and numerous other studies. For the compositing process two intensity thresholds are applied to investigate the changes to different subsets of cyclones. The first subset is on extreme cyclones (EXT), and these must exceed the 90th percentile of peak cyclone vorticity for that hemisphere, season, and model. Secondly, average-strength (AVG) cyclones are investigated, and these are situated between the 45th and 55th percentile of the peak cyclone vorticity distribution. For the historical period the intensity thresholds are calculated across the entire 1979–2014 period, whereas for the future SSPs the thresholds are re-calculated for each decade (i.e. 2040–2049, 2050–2059, etc.) to account for the evolving forcing.
For the majority of analysis presented, the extreme cyclones around the entire hemisphere are analysed. However, when comparing EXT and AVG cyclones only cyclones over the North Atlantic are studied. These cyclones must have at least one time step within a region from 30–70∘ N, 280–360∘ E, which ensures that cyclones are as similar as possible for this comparison.
Composites of the subset cyclone tracks are created at the time of maximum intensity (defined as the T42 vorticity) and cover an area of 20∘ from the track point at the time of maximum intensity on a grid. In order to reduce any discrepancies associated with the different propagation direction of cyclones, all composited variables are rotated so that the cyclone is propagating due east. The compositing has been performed on cyclone wind speeds at 850, 500, and 250 hPa, to investigate changes in the lower, middle, and upper troposphere respectively. As cyclones are only tracked at 850 hPa, composites at 500 and 250 hPa are created using the co-ordinates of the cyclone at 850 hPa. Cyclone wind speed composites are provided in two different perspectives. The first is the Earth relative perspective, which is the winds as output by the models. The second is the system relative perspective, whereby the speed of the cyclone (as calculated from the tracks) is removed and therefore allows the airflows within the cyclone to be investigated.
3.1 Storm number
A reduction in the number of cyclones per season is projected in both the winter and summer seasons in the NH and SH (Fig. 1a–d). Across the four seasons the decrease is larger in the simulations that have larger increases in the end-of-century climate forcing. In the NH the median decrease in identified cyclones for SSP5-8.5 in DJF (Fig. 1a) and JJA (Fig. 1b) is by 5.4 % and 6.8 % respectively. In the SH the relative decrease in the SSP5-8.5 experiment is slightly less than in the NH, with reductions in DJF (Fig. 1c) and JJA (Fig. 1d) of 3.3 % and 4.7 % respectively. This result is consistent with the literature that has assessed changes in cyclone activity in previous-generation GCMs (e.g. König et al., 1993; Bengtsson et al., 2009; Chang et al., 2012; Michaelis et al., 2017; Zappa et al., 2013) and can be understood through the reduced lower tropospheric baroclinicity that is a result of continued polar amplification with global warming (Geng and Sugi, 2003; Bengtsson et al., 2006; Catto et al., 2019).
To investigate changes in intense cyclones, we define intense cyclones as those that exceed the 90th percentile of the distribution of peak cyclone T42 vorticity. A fixed threshold of the historical 90th percentile is used to assess future changes in the SSP5-85 experiment. In NH DJF there is an average increase of 4.0 % in the number of cyclones exceeding the historical 90th percentile (Fig. 1e). Increases are also seen in the SH with 7.0 % and 15.6 % more intense cyclones in DJF and JJA respectively (Fig. 1g, h). In NH JJA a decrease is identified, with 21.4 % fewer cyclones exceeding the historical 90th percentile (Fig. 1f). It therefore appears that our results for winter cyclones are consistent with previous studies in that a reduction in the total number of cyclones is seen, yet there is an increase in the frequency of intense cyclones (Geng and Sugi, 2003; Mizuta et al., 2011; Colle et al., 2013). However, in the summer seasons different behaviour is seen in the NH and SH, with a large reduction in the number of intense cyclones in NH JJA.
3.2 Storm track density
Despite the decrease in total cyclone numbers projected in Fig. 1a–d, the change in tracks and storm track density can vary significantly on the regional scale. In the NH the maximum cyclone track density is in the two main oceanic storm tracks in DJF and JJA (Fig. 2a, f), with a further peak in storm track density in the Mediterranean in DJF. The ability of the CMIP6 models in reproducing these features, relative to the most current reanalyses, was discussed in Priestley et al. (2020) and will not be discussed herein.
In DJF the changes in storm track density by the end of the century (2080–2100) are shown for the SSP1-26, SSP2-45, SSP3-70, and SSP5-85 scenarios in Fig. 2b–e. Changes in track density are smallest for SSP1-26 (Fig. 2b) and largest for SSP5-85 (Fig. 2e), which reflects the sensitivity to increasing levels of anthropogenic climate change noted in Fig. 1. All scenarios present a similar pattern of storm track changes.
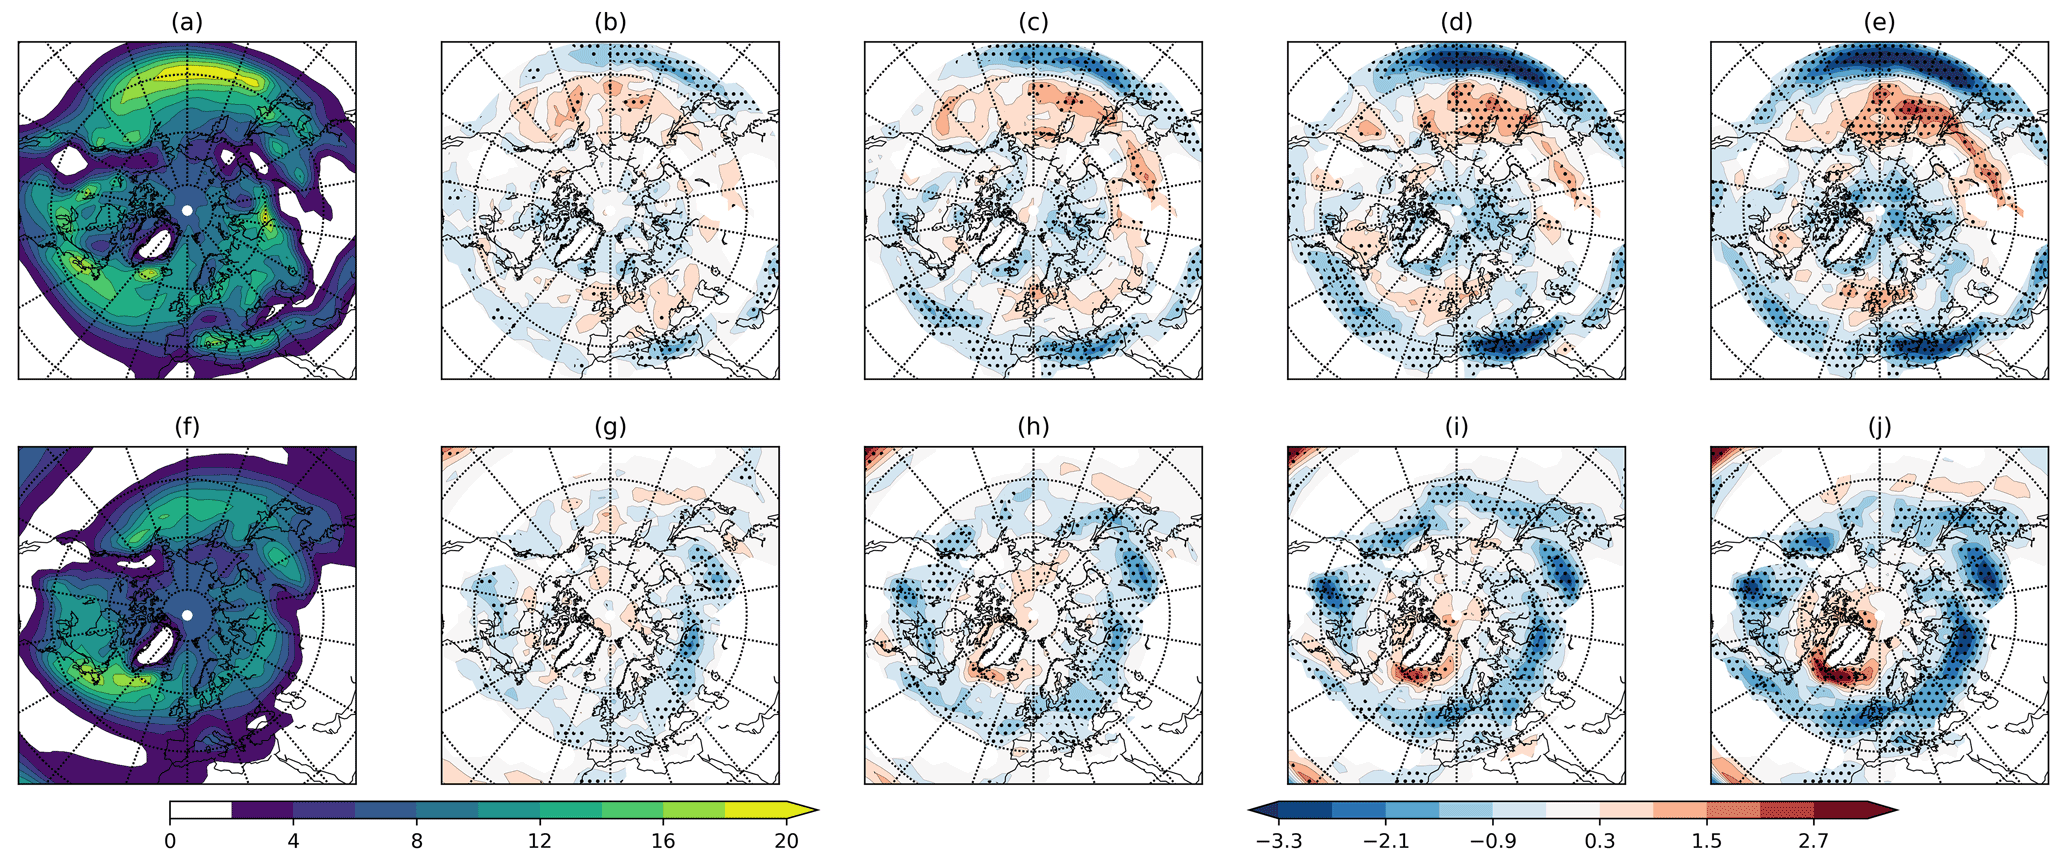
Figure 2Storm track densities for the Northern Hemisphere for DJF (a–e) and JJA (f–j). Seasonal storm track densities are shown for the CMIP6 historical multi-model mean from 1979–2014 (a, f). End-of-century (2080–2100) changes relative to the historical mean are shown for the SSP1-26 (b, g), SSP2-45 (c, h), SSP3-70 (d, i), and SSP5-85 (e, j) scenarios. Stippling in figures indicates where 80 % of the models agree on the sign of the change relative to the historical multi-model mean. Units are number of cyclones per 5∘ spherical cap per month.
Looking at the two oceanic storm tracks individually, an apparent poleward shift of the storm track is seen in the North Pacific, with a decrease (increase) in the number of tracks on the equatorward (poleward) flank. This is most evident in the west and central longitudes of the ocean basin, where most of the cyclogenesis and strongest temperature gradients are present (Priestley et al., 2022a). This pattern gets larger in magnitude (and more robust across the models) with the stronger climate change scenarios (Fig. 2e).
In the North Atlantic, there is a decrease in track density in the subtropical central North Atlantic and an increase in the track density over NW Europe and particularly the British Isles. Furthermore, there is a reduction over SW Europe and the Norwegian Seas, therefore presenting a tripolar pattern of change along the Greenwich Meridian. These signals are again largest in the highest-emission climate change scenario of SSP5-85, with models also tending to have the highest level of agreement in this scenario. The extension over NW Europe is likely associated with an extension of tracks into this region associated with increased baroclinicity and higher rates of cyclogenesis (not shown) from modifications to ocean currents in the North Atlantic from the melting of sea ice and ice sheets (Bengtsson et al., 2009; Gervais et al., 2018, 2019; Oudar et al., 2020). The patterns of change in the NH are broadly consistent with the recent studies of Oudar et al. (2020) and Harvey et al. (2020). As in Harvey et al. (2020), our results also demonstrate an increased climate change signal compared to CMIP5, shown by Zappa et al. (2013) and Lee (2015), which used the same cyclone tracking method.
Other regions of note are the Mediterranean and the Arctic, where robust decreases in the number of tracks are observed that are larger with increased future warming. However, due to the often smaller scale of cyclones in these regions, adaptations to identification methods may be required to comprehensively quantify changes in these regions (Zappa et al., 2014, 2015).
In JJA an overall reduction in track density is seen around a majority of the NH, which, as in DJF, is larger for the higher-emission climate change scenarios (Fig. 2g–j). For SSP5-85 (Fig. 2j) there is a robust decrease across North America, a majority of northern Europe, eastern Asia, and the NW North Pacific. The decrease over eastern Asia is co-located with the over-active northern genesis region identified in Priestley et al. (2022a) and is likely driven by changes in the meridional temperature distribution. One region where an increase in track density is identified is to the south, and downstream, of Greenland, which has been identified in numerous other studies (Bengtsson et al., 2006; Zappa et al., 2013). This is a region where the poleward expansion of the tropical circulation is projected to play a significant role, driving an increase in jet speeds for this region (Harvey et al., 2020). The interaction of the jet with the complex orography of this region is a likely driver of this increase.
The storm tracks in the SH are much more symmetrical in nature (Fig. 3a, f), particularly in the summer season (DJF; Fig. 3a). In the summer season (Fig. 3b–e) a poleward shift of the storm track is evident, but only for SSP2-45, SSP3-70, and SSP5-85 (Fig. 3c–e). This indicates some temperature dependency on the poleward shift of the circulation that is not achieved for the lowest warming rates. For the three scenarios that do show a poleward shift, the shift is largest for the scenario with the largest warming and is symmetric around the hemisphere. For SSP5-85 the average poleward shift of the storm track relative to the historical simulations (defined as latitude of maximum zonal mean track density) is 2.9∘ from 55.4 to 58.3∘ S. Furthermore, this shift is a very robust signal across all the models, with the most widespread agreement in SSP5-85. Another feature of note is the robust decrease in storm track density from the sub-tropical western South Pacific to the southern tip of South America, which may be associated with changes in the South Pacific convergence Zone (SPCZ; Brown et al., 2020).
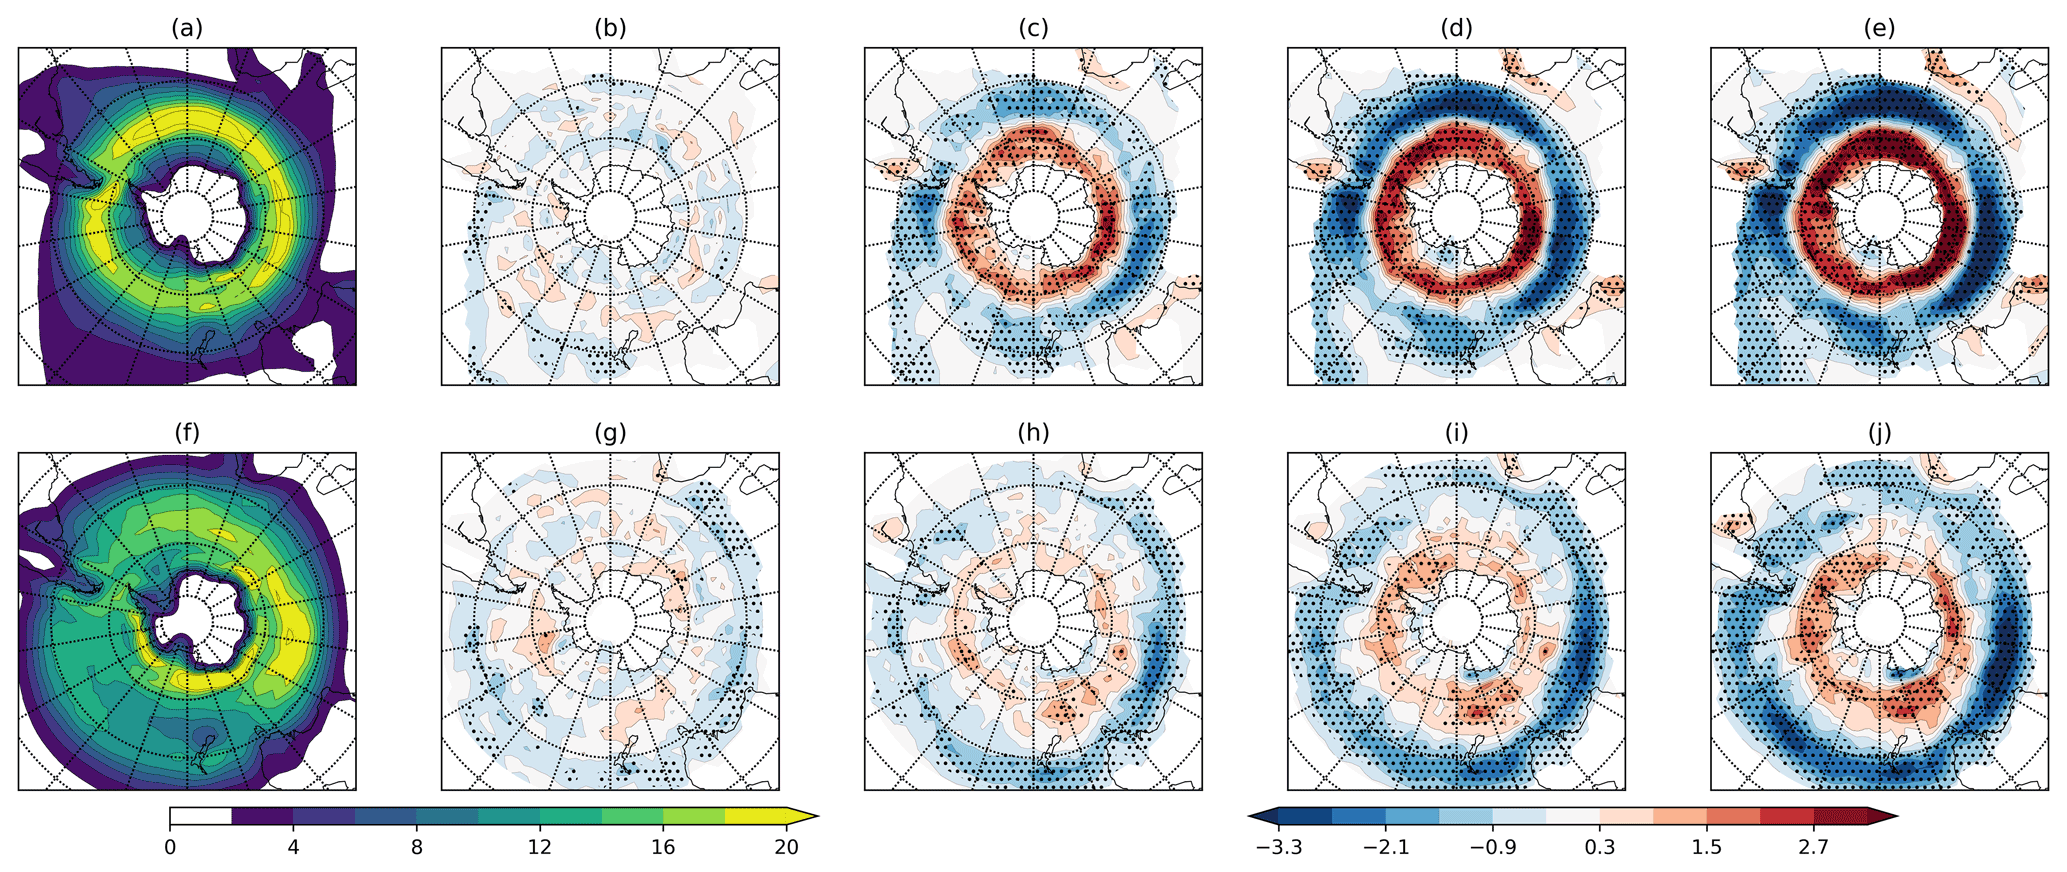
Figure 3As Fig. 2 but for the Southern Hemisphere.
In JJA (Fig. 3g–j), the patterns of track density change are very similar to those of DJF. There is a poleward shift of the storm tracks that is only seen for SSP2-45 and above, with a signal that is larger for the largest climate change scenario. This shift is also robust across the models. The poleward shift is smaller than in DJF, and for the SSP5-8.5 scenario the average poleward shift from the historical simulations is by 1.3∘ from 60.8 to 62.1∘ S. The clear pattern in the SH is likely due to the reduced influence of land in this hemisphere, therefore allowing for the strong thermodynamical changes to have a clearer impact. The poleward shift of the circulation is expected through increased tropical warming and an expansion of the Hadley cell (Shaw, 2019), which results in an increase in stability in subtropical regions and a poleward shift of the main baroclinicity (Yin, 2005; Lim and Simmonds, 2009). Furthermore, the amplification of polar temperature in the SH is not projected to be as large in the NH (Fan et al., 2020), further maintaining the mid-latitude baroclinicity.
3.3 Cyclone intensity
We have already shown that, as measured through relative vorticity, there is a projected increase in the number of extreme cyclones in the future (Fig. 1e–h). However, to quantify differences in measures of cyclone intensity, both the T42 relative vorticity and associated cyclone MSLP minimum will be examined. For both measures the peak intensity is defined as the maximum (minimum for MSLP) value throughout the cyclone life cycle.
3.3.1 Relative vorticity
Figure 4 shows the peak cyclone relative vorticity distributions for DJF and JJA in the NH and SH. For all seasons, and all future experiments, the model mean distributions lie within the uncertainty estimation of the historical models, indicating a relatively small change in cyclone vorticity. Estimations of the median vorticity are very similar for all of the future SSPs relative to the historical models in the winter seasons. However, in the summer seasons a decrease is evident, with this being notably larger in the NH.
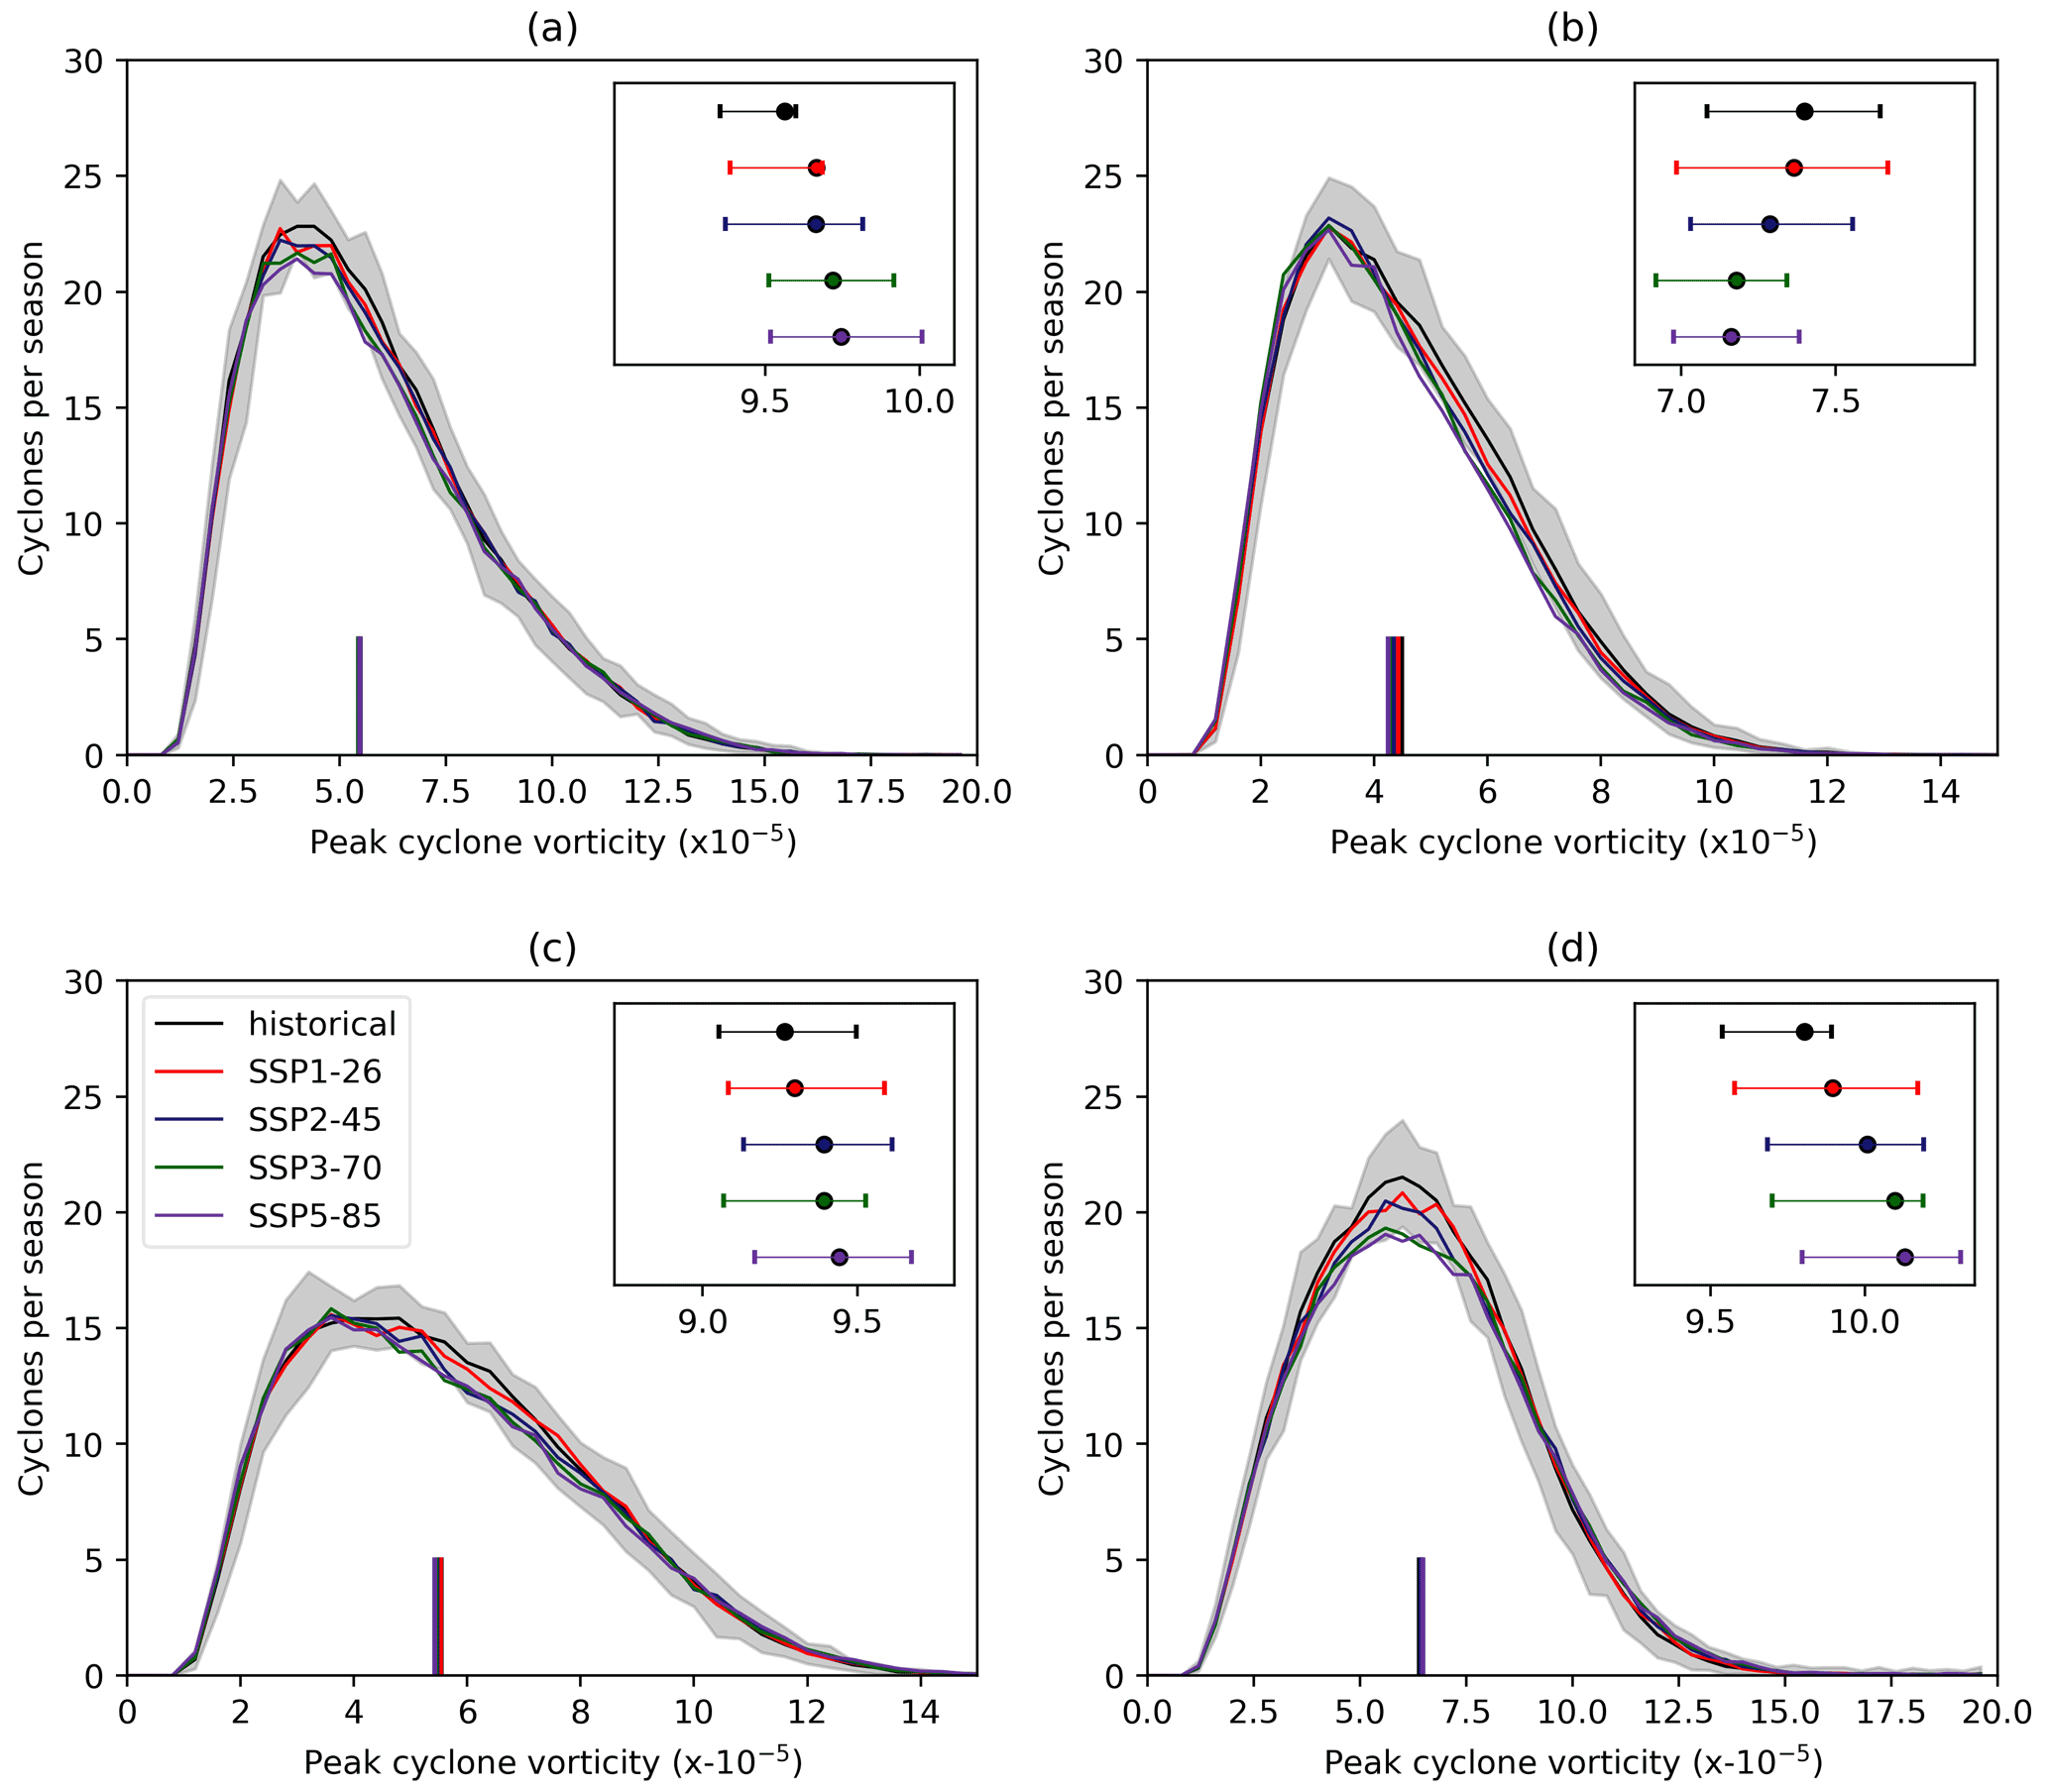
Figure 4Distributions of peak cyclone T42 relative vorticity for (a) NH DJF, (b) NH JJA, (c) SH DJF, and (d) SH JJA. The grey shaded region represents the 5th–95th percentile of the CMIP6 historical models, with the black line being the multimodel mean. Coloured lines illustrate the 2080–2100 distribution for SSP1-26 (red), SSP2-45 (blue), SSP3-70 (green), and SSP5-85 (purple). The coloured columns from the x axis indicate the median of the distribution of each of the model experiments. The inset for each figure illustrates the 90th percentile of each experiment distribution and associated 25th–75th percentile uncertainty on this value. Units are s−1.
All distributions exhibit a similar shape for the SSPs as in the historical simulations. Despite this, all seasons except NH JJA show a reduction in the number of cyclones near the peak of the distribution. This confirms that the reduction in cyclones noted in Fig. 1 is most likely to be seen for moderate-strength cyclones and not extreme cyclones (as in Fig. 1). Since a key question is how the intensity of the highest-impact storms will change, the changes in the 90th percentile of the vorticity distributions are shown in the inset of each panel in Fig. 4. The model mean 90th percentile increases slightly with increased warming for NH DJF and both SH seasons yet decreases for NH JJA. However, the uncertainty estimation on the 90th percentile for each SSP has significant overlap with the historical model estimation. Therefore, there are different responses in the median and 90th percentile for the winter seasons and SH summer, with extreme cyclones increasing in intensity with no change (or a slight decrease) in the median intensity.
3.3.2 Mean sea level pressure
In Fig. 5 distributions of cyclone minimum MSLP are shown and calculated the same way as for relative vorticity in Fig. 4. The MSLP distributions have quite different shapes, with the NH DJF distribution having a negative skew (Fig. 5a) and NH JJA being normally distributed (Fig. 5b). In NH DJF (Fig. 5a) the distributions of the four SSPs are similar to the historical models, but with a reduction in the number of cyclones with MSLP at the peak of the distribution. There is a shift toward lower pressures in NH DJF, with lower medians and also a lower 90th percentile (inset). The medians show more of a shift than for vorticity, although the 90th percentiles show less of a shift (Fig. 4a). In NH JJA there is a slight shift toward lower intensities (higher MSLP), although the distributions are again very similar with less of a shift in the median than for relative vorticity.
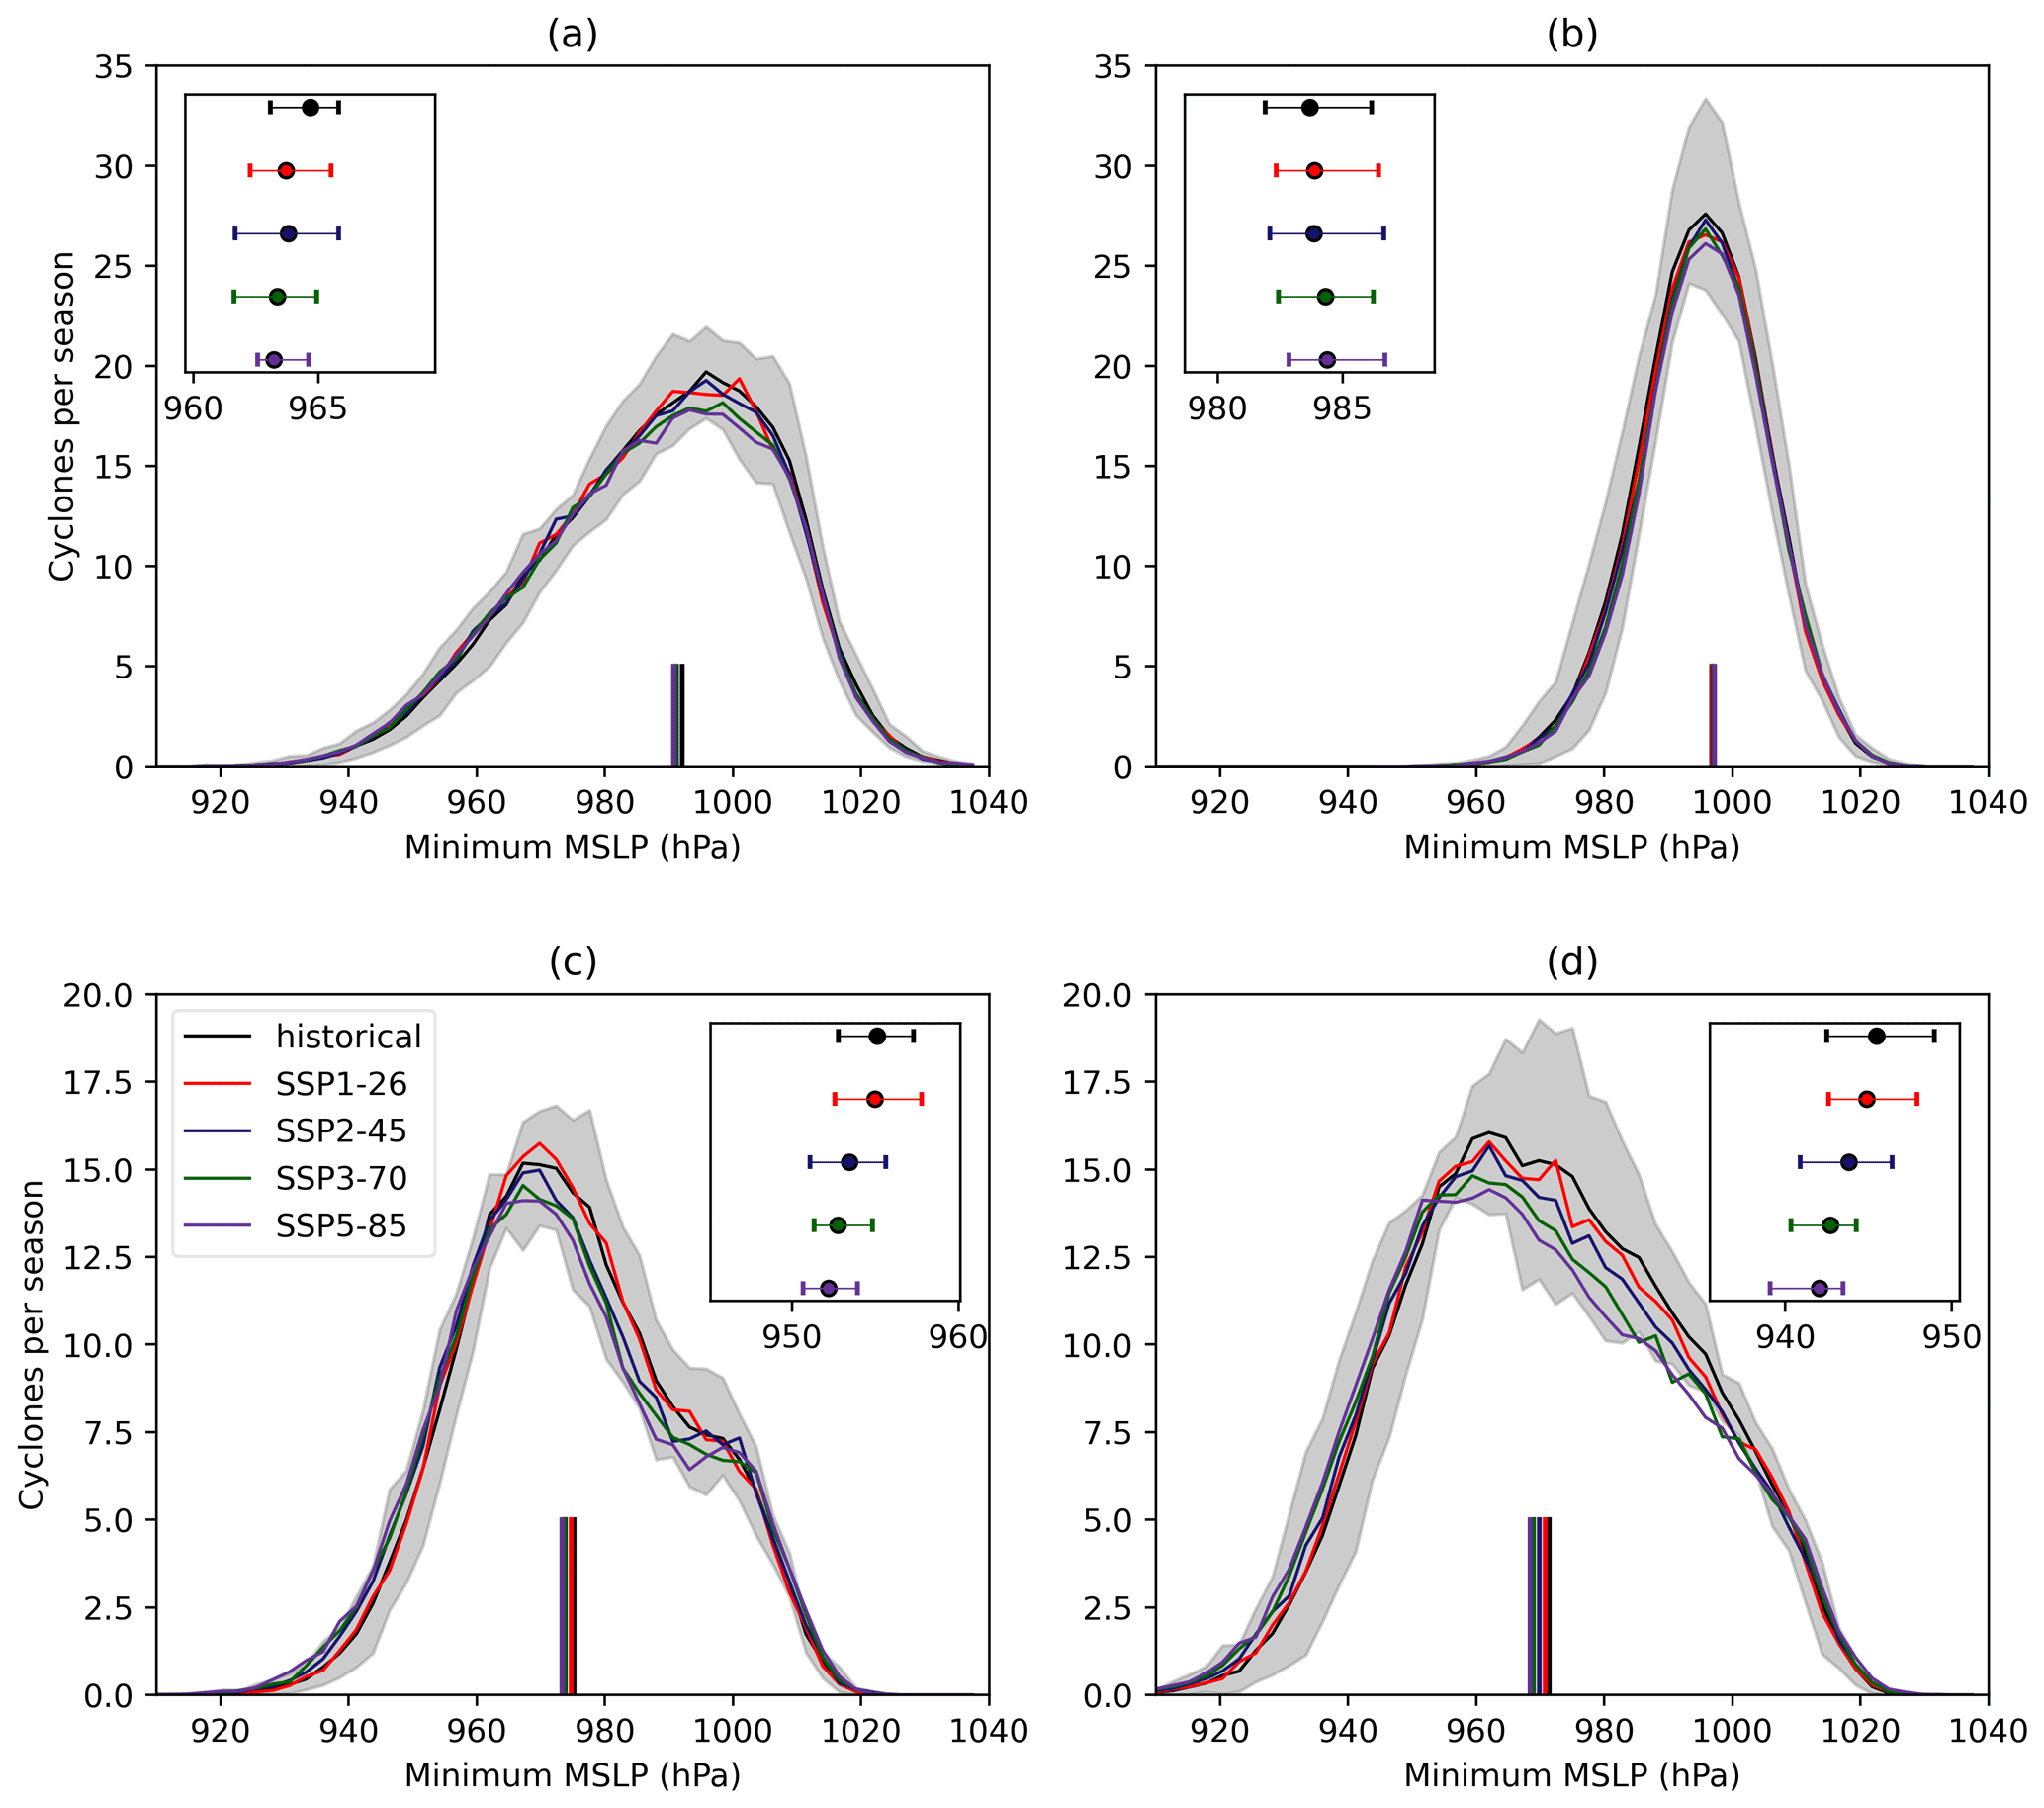
In the SH the distributions of MSLP in the SSPs is largely different compared to the historical experiment. In DJF (Fig. 5c) there is a large reduction in frequency of cyclones with average or above-average MSLP, leading to a reduction in the median. Furthermore, there is an increase in cyclones with the lowest pressures, resulting in a lower 90th percentile and the average distribution nearly lying outside the uncertainty from the historical simulations. These shifts in the overall distribution, the median, and the 90th percentile are also apparent in JJA (Fig. 5d), with a shift toward lower pressures (higher intensity) in the SSPs that is exacerbated in the highest-emission scenarios. This is unlike the distributions of relative vorticity (Figs. 4c, d), which show only an increase in the 90th percentile of the distribution and minimal changes (or a slight weakening) in the median.

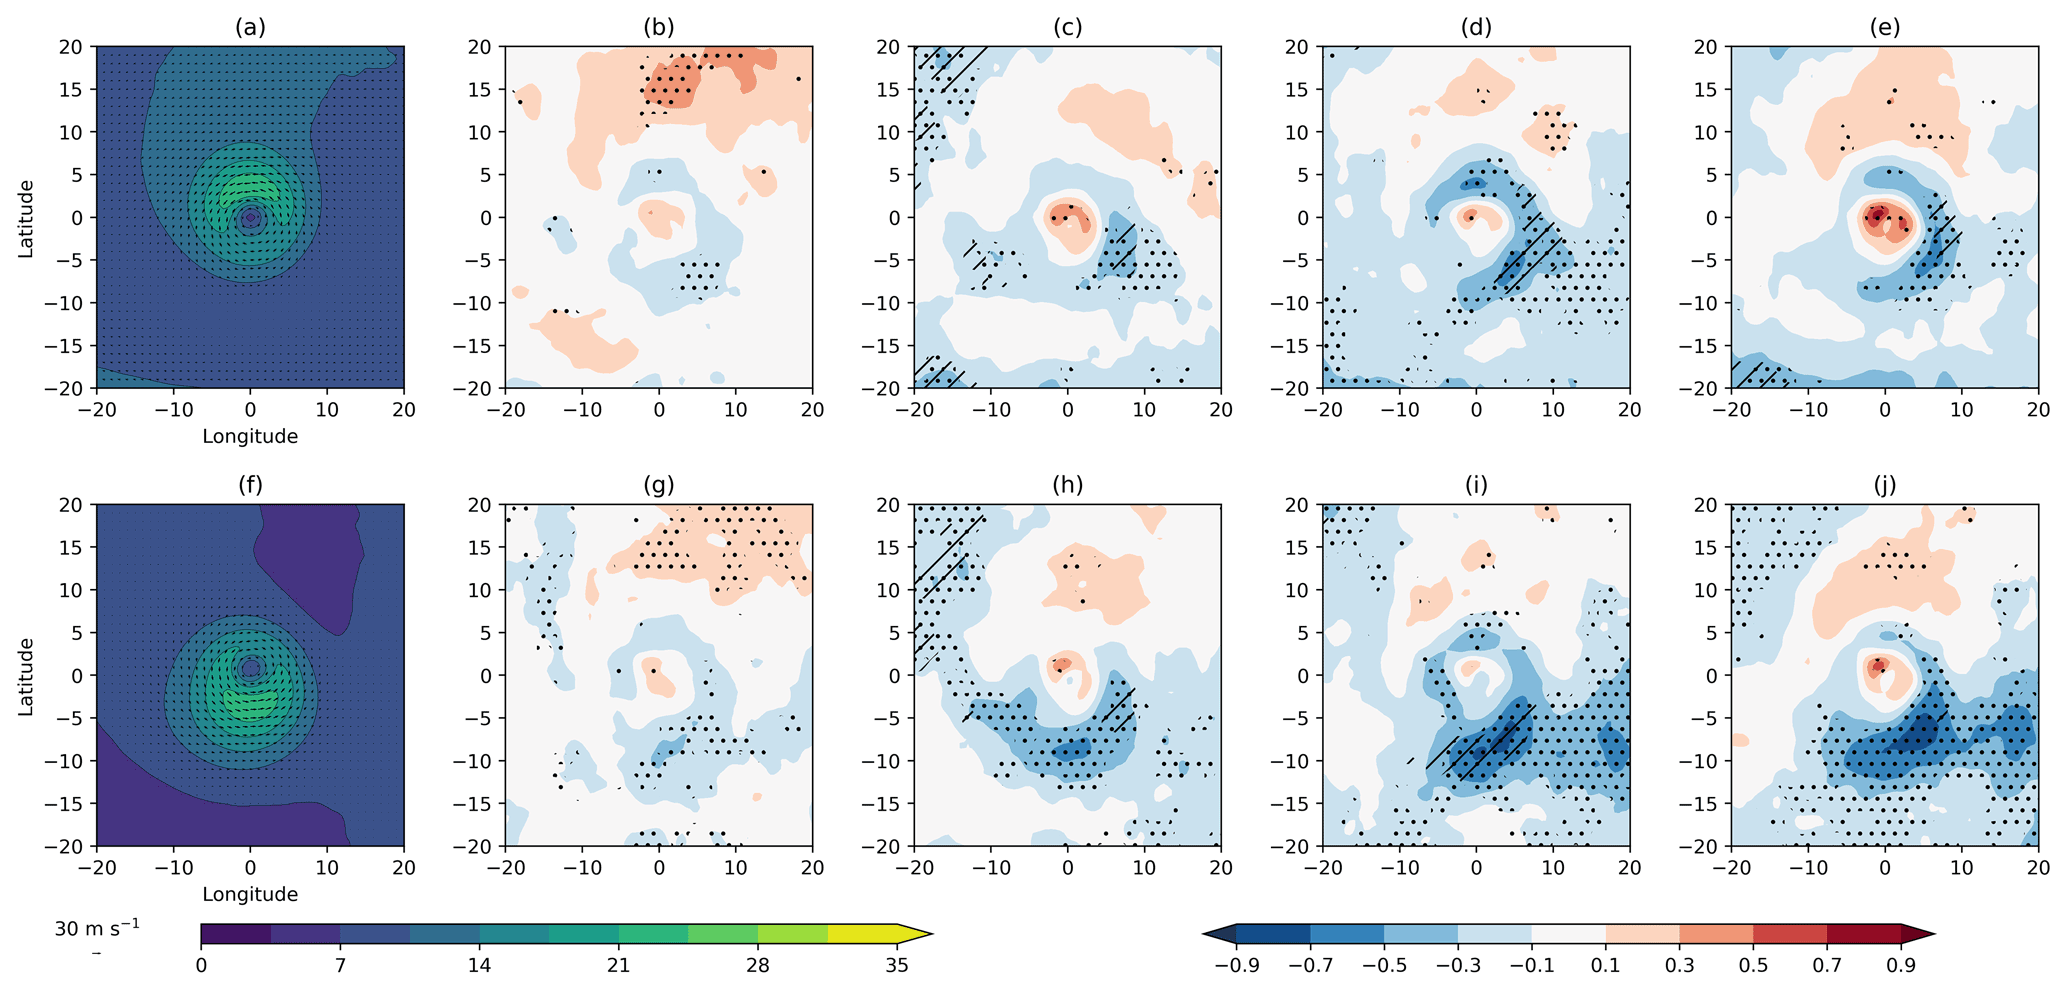
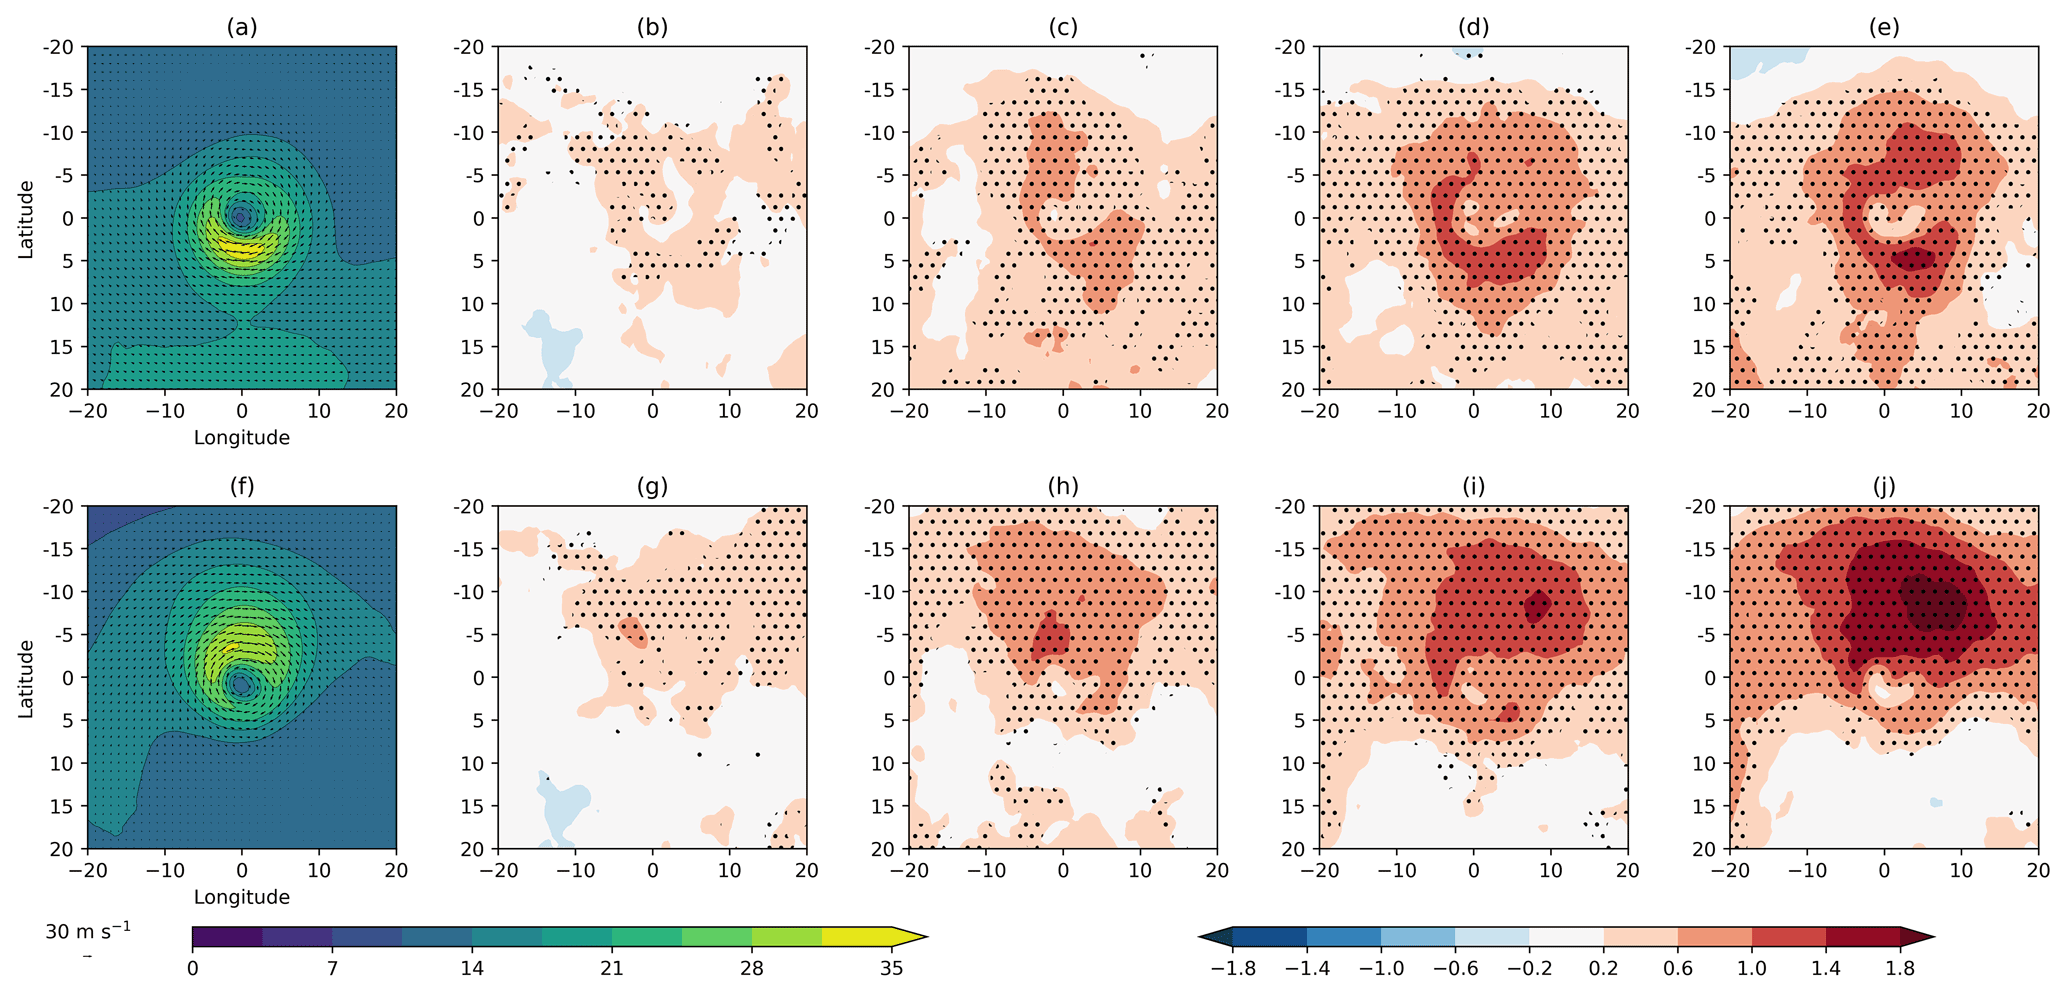
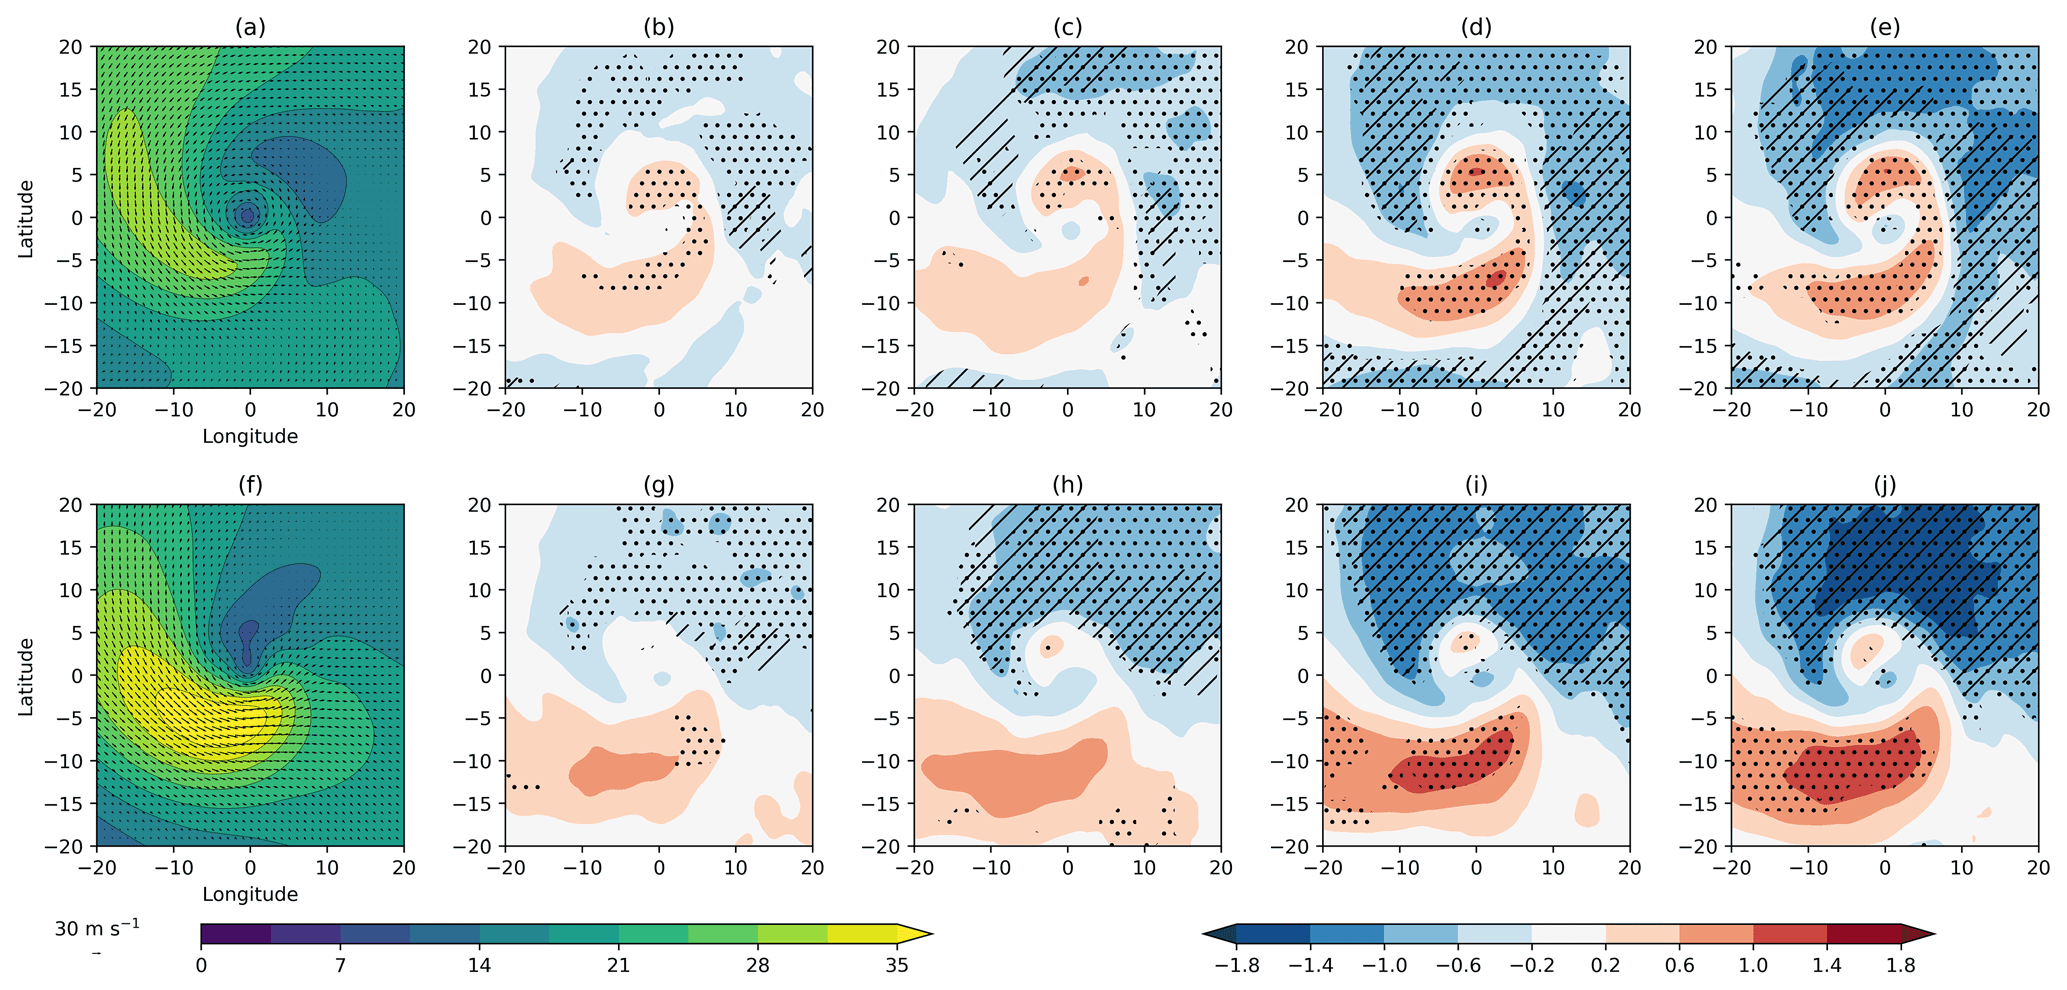
Figure 6Composites of wind speeds at 850 hPa associated with extreme cyclones in a system relative (a–e) and Earth relative (f–j) perspective for NH DJF. Composites are shown for the 1979–2014 CMIP6 historical average (a, f) and changes for the SSP1-26 (b, g), SSP2-45 (c, h), SSP3-70 (d, i), and SSP5-85 (e, j) scenarios for the 2080–2100 period. Stippling indicates 80 % model consensus on the sign of the change, and hatching shows where the model mean is larger than the model variance. Units are m s−1. The dashed white line in (f) is the location of the transect taken in Fig. 11.
For MSLP there are larger changes in the median of the distribution than for relative vorticity, with this being particularly notable in the SH. This is likely a result of the poleward shift of cyclones and the significant influence of the large-scale pressure distribution on cyclone MSLP (Bengtsson et al., 2006). As cyclones shift toward higher latitudes (Fig. 3), they will be moving into an environment characterized by deeper MSLP and stronger pressure gradients. This is also likely the reason why less change is seen in the 90th percentile of MSLP in NH DJF when compared to relative vorticity, as the change in latitude of maximum track density is less apparent than in the SH (Fig. 2a–e).
3.4 Cyclone wind speed
Figures 4 and 5 illustrate the difference in intensity measures, with changes in the extremes more notable using filtered vorticity as a metric and a larger shift in the whole distribution when using MSLP. A dynamical approach to assessing changes in extratropical cyclone strength is to analyse changes in wind fields, as these are directly related to cyclone impacts. For the composite analysis only the 10 % strongest cyclones are examined as these are associated with the largest impacts and to ensure only similar cyclones are examined.
3.4.1 Lower troposphere
Recently, Priestley and Catto (2022) demonstrated that CMIP6 models under-estimate the strength of the system relative circulation at 850 hPa by up to 2 m s−1. This under-estimation was identified on the poleward flanks of the cyclone in the region where the cold conveyor belt (CCB) would be expected to be found. The models used in this analysis show similar biases, albeit slightly smaller in magnitude (Fig. S1 in the Supplement), due to the increased number of higher-resolution models used here (Table 1).
The future response of the 850 hPa wind speeds in extreme cyclones is examined for each winter and summer season in both hemispheres individually and for both a system and Earth relative perspective. Figure 6 presents the climate change responses for NH DJF. In a system relative perspective a strengthening of the wind speeds is seen for all SSPs (Fig. 6b–e). This strengthening is broadly contained between 5 and 15∘ of the cyclone centre and is progressively larger for the strongest climate change scenarios, with a peak increase of up to 0.7 m s−1 in SSPs 3-70 and 5-85. The strengthening is robust across most of the models, especially for SSPs 3-70 and 5-85 (Fig. 6d, e) and is concentrated on the forward and rearward flanks of the cyclone. The robust strengthening to the west of the cyclone centre in SSP5-85 is co-located with the maximum wind speeds associated with the CCB and formation of the low-level jet (Priestley and Catto, 2022). It is evident from SSPs 2-45 and 3-70 (Fig. 6c, d) that there is also a strengthening on the SE edge of the cyclone in the warm sector, indicating possible changes associated with the inflow of the warm conveyor belt (WCB).
In an Earth relative perspective (Fig. 6f–j) the progressively stronger increase noted from Fig. 6b–e is also evident, with SSP5-85 having the greatest strengthening of the wind speeds. From this perspective there is a notable increase in strength on the southern and southeastern flanks of the cyclones, which would be situated within the warm sector of the cyclones. These anomalies are 10–15∘ away from the cyclone centre and peak at up to 0.9 m s−1 for SSP5-85 (Fig. 6j). Despite differences between the Earth relative and system relative wind speed changes, we find minimal differences in the propagation speed of the cyclones by the end of the century (Fig. 7a). In NH DJF there is considerable uncertainty on the sign of the individual model response and also non-linear responses across the experiments. The minimal change in propagation speed, coupled with a strengthening of system relative wind speeds, indicates a potential increase in wind risk by the end of the century.
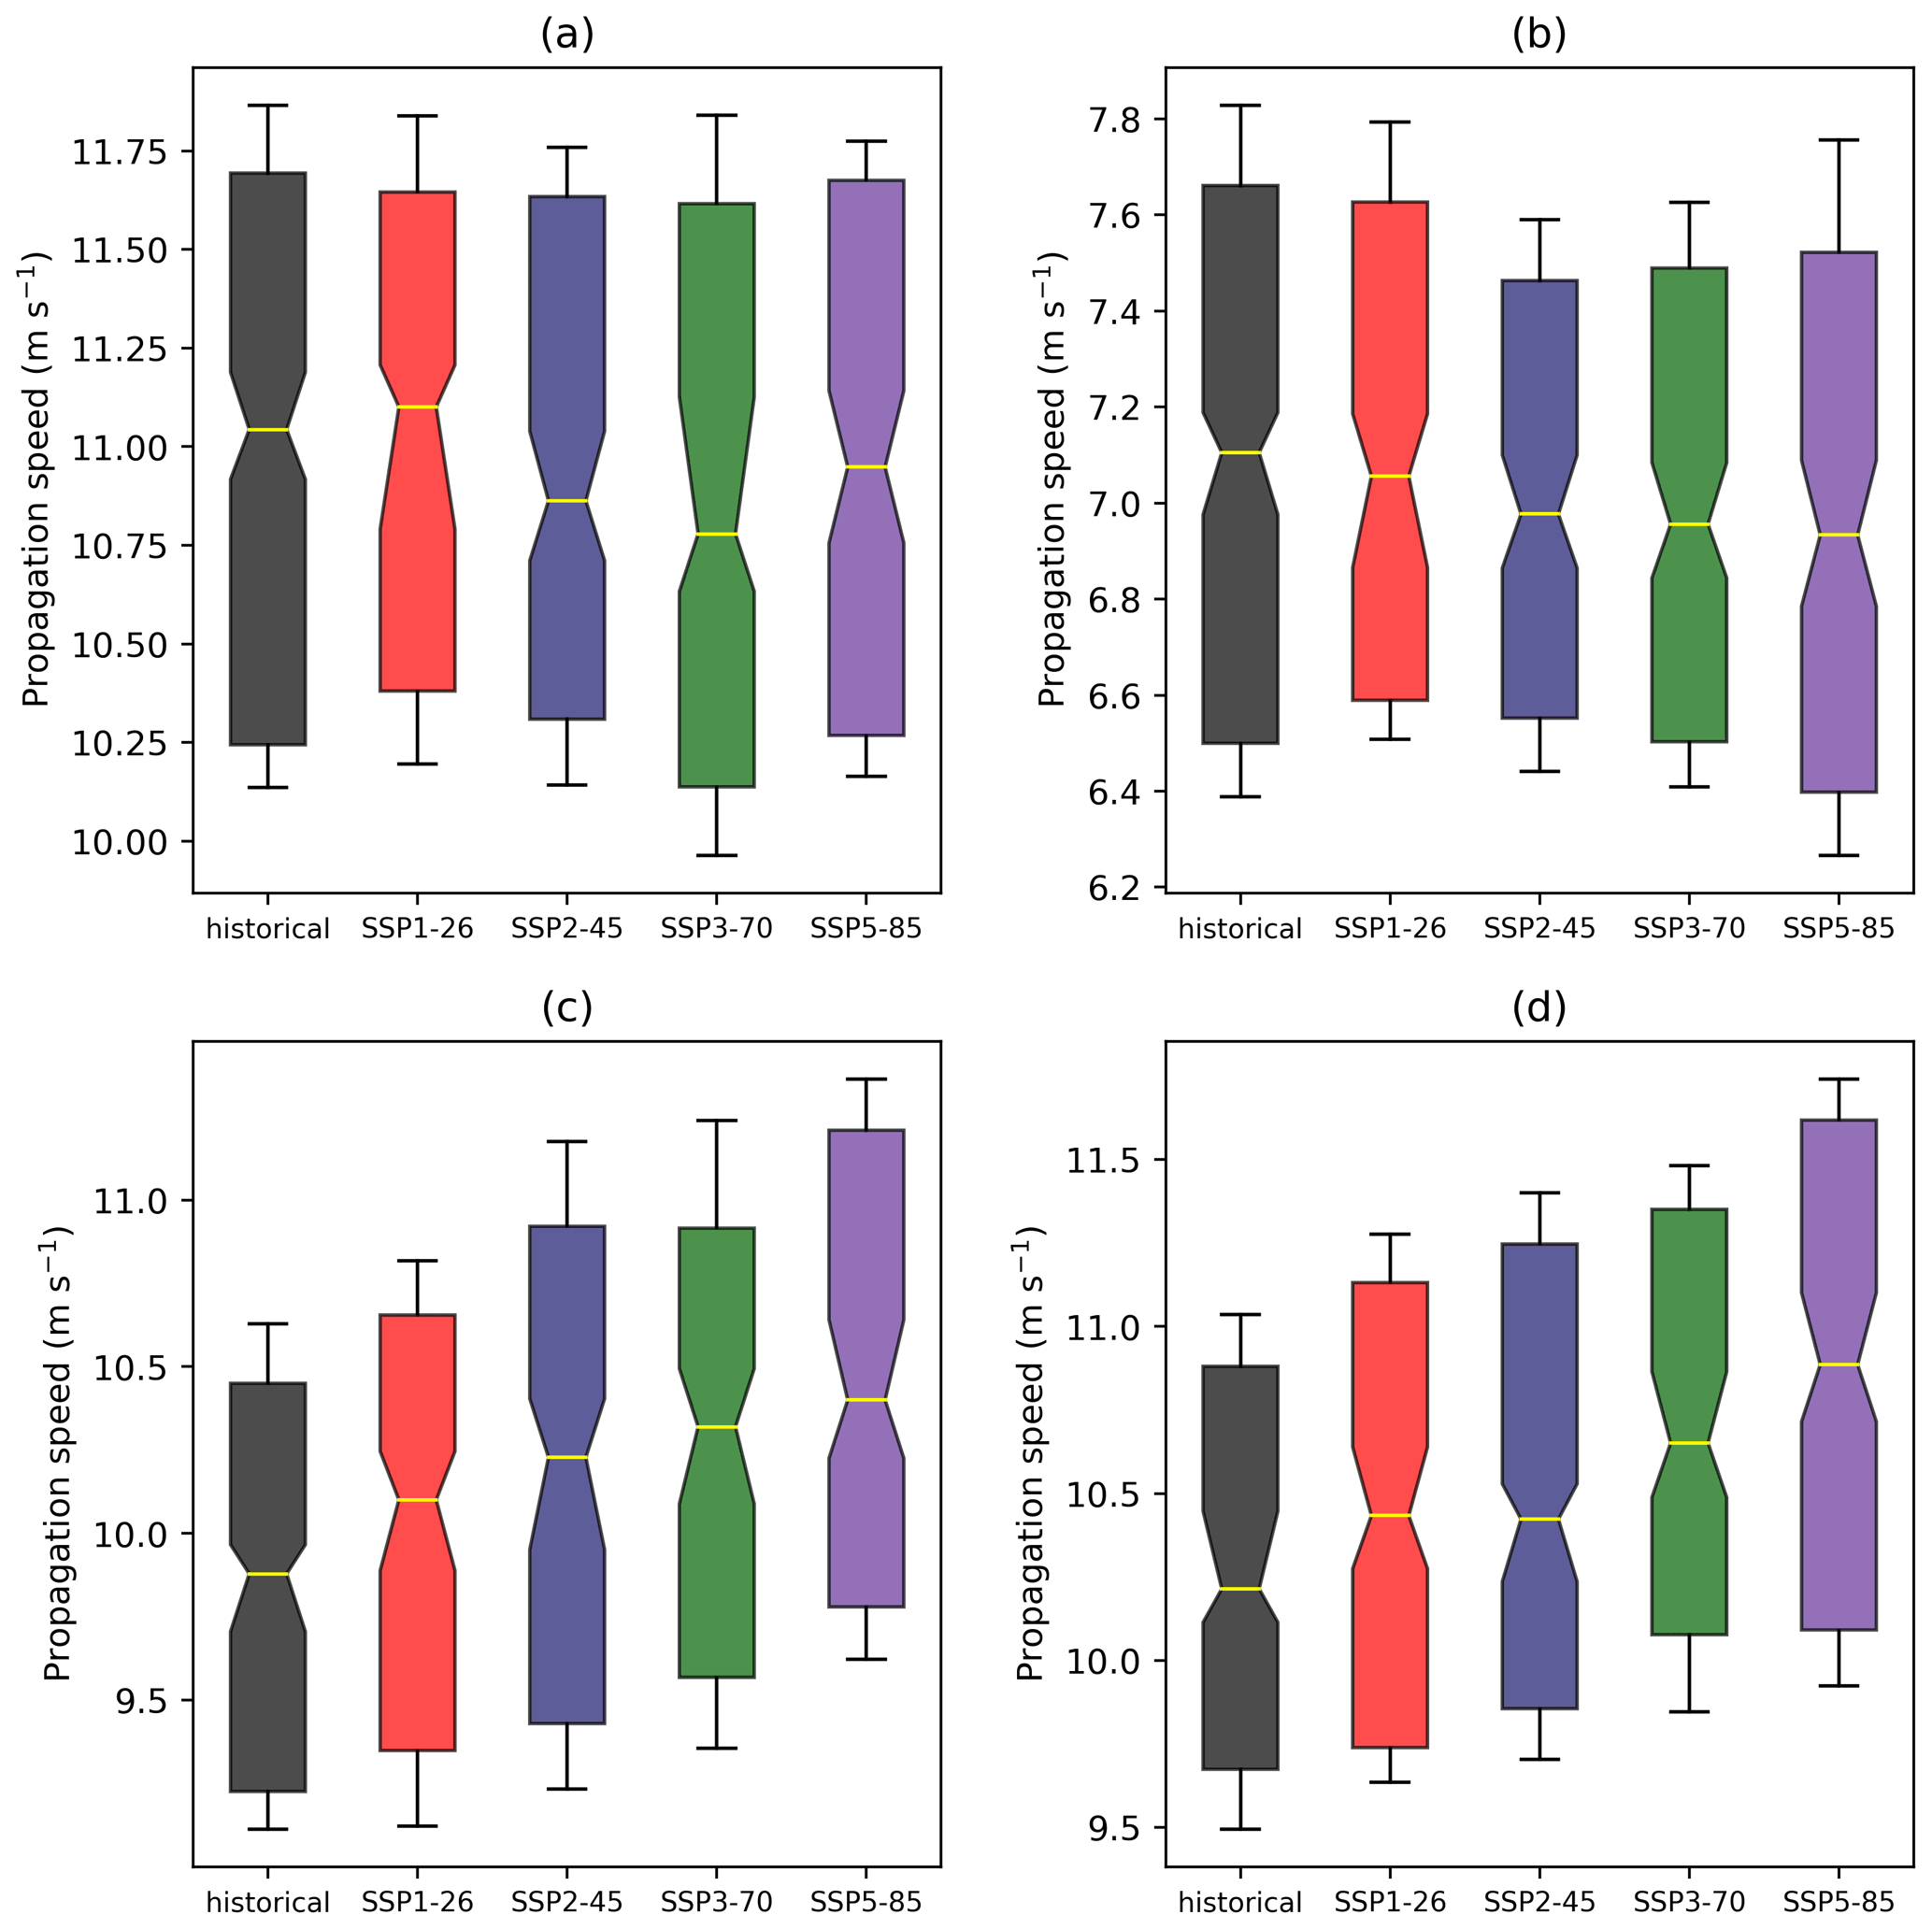
Figure 7Boxplots of cyclone propagation speed in the direction of cyclone motion. Boxplots are shown for (a) NH DJF, (b) NH JJA, (c) SH DJF, and (d) SH JJA for the historical (black), SSP1-26 (red), SSP2-45 (blue), SSP3-70 (green), and SSP5-85 (purple) experiments. The evaluated periods are 1979–2014 for the historical simulation and 2080–2100 for the different SSPs. The yellow lines in the boxes are the median, and the boxes extend to the 25th and 75th percentiles. Whiskers extend to 1.5 times the inter-quartile range (IQR). Notches on the boxes represent the 5 %–95 % confidence range on the median from 10 000 bootstrap re-samples. Speeds are calculated at the time of maximum cyclone intensity. Units are m s−1.
In NH JJA (Fig. 8) in the very core of the cyclone a strengthening of system relative winds of up to 0.9 m s−1 is seen for SSP5-85 (Fig. 8e), with a weakening identifiable outside this between 5 and 10∘ of the cyclone centre of up to 0.7 m s−1 and may be associated with the CCB (Priestley and Catto, 2022). The weakening is concentrated on the forward flank of the cyclone, and for the more aggressive climate change scenarios (Fig. 8d, e) in the warm sector. All anomalies are most notable for SSP2-45 and above, and they also become more robust across the models with larger climate change. The reduction in wind speeds surrounding the core of the cyclone are likely a result of the reduced cyclone pressure gradient (not shown).
In an Earth relative perspective (Fig. 8g–j), a similar pattern of the biases is seen as in the system relative perspective. However a further weakening is evident on the southeastern flank of the cyclone that is between 5 and 10∘ of the cyclone centre and is up to 0.9 m s−1 in SSP5-85 (Fig. 8j). This further weakening of the wind speeds suggests a decrease in cyclone speed. This decrease is identifiable and is larger with increased rates of warming (Fig. 7b), although changes in the median are only by ∼0.1 m s−1. It is interesting that the response of cyclones in the NH is opposite in DJF and JJA, which is consistent with the changes in eddy kinetic energy and baroclinicity (O'Gorman, 2010; Lehmann et al., 2014).
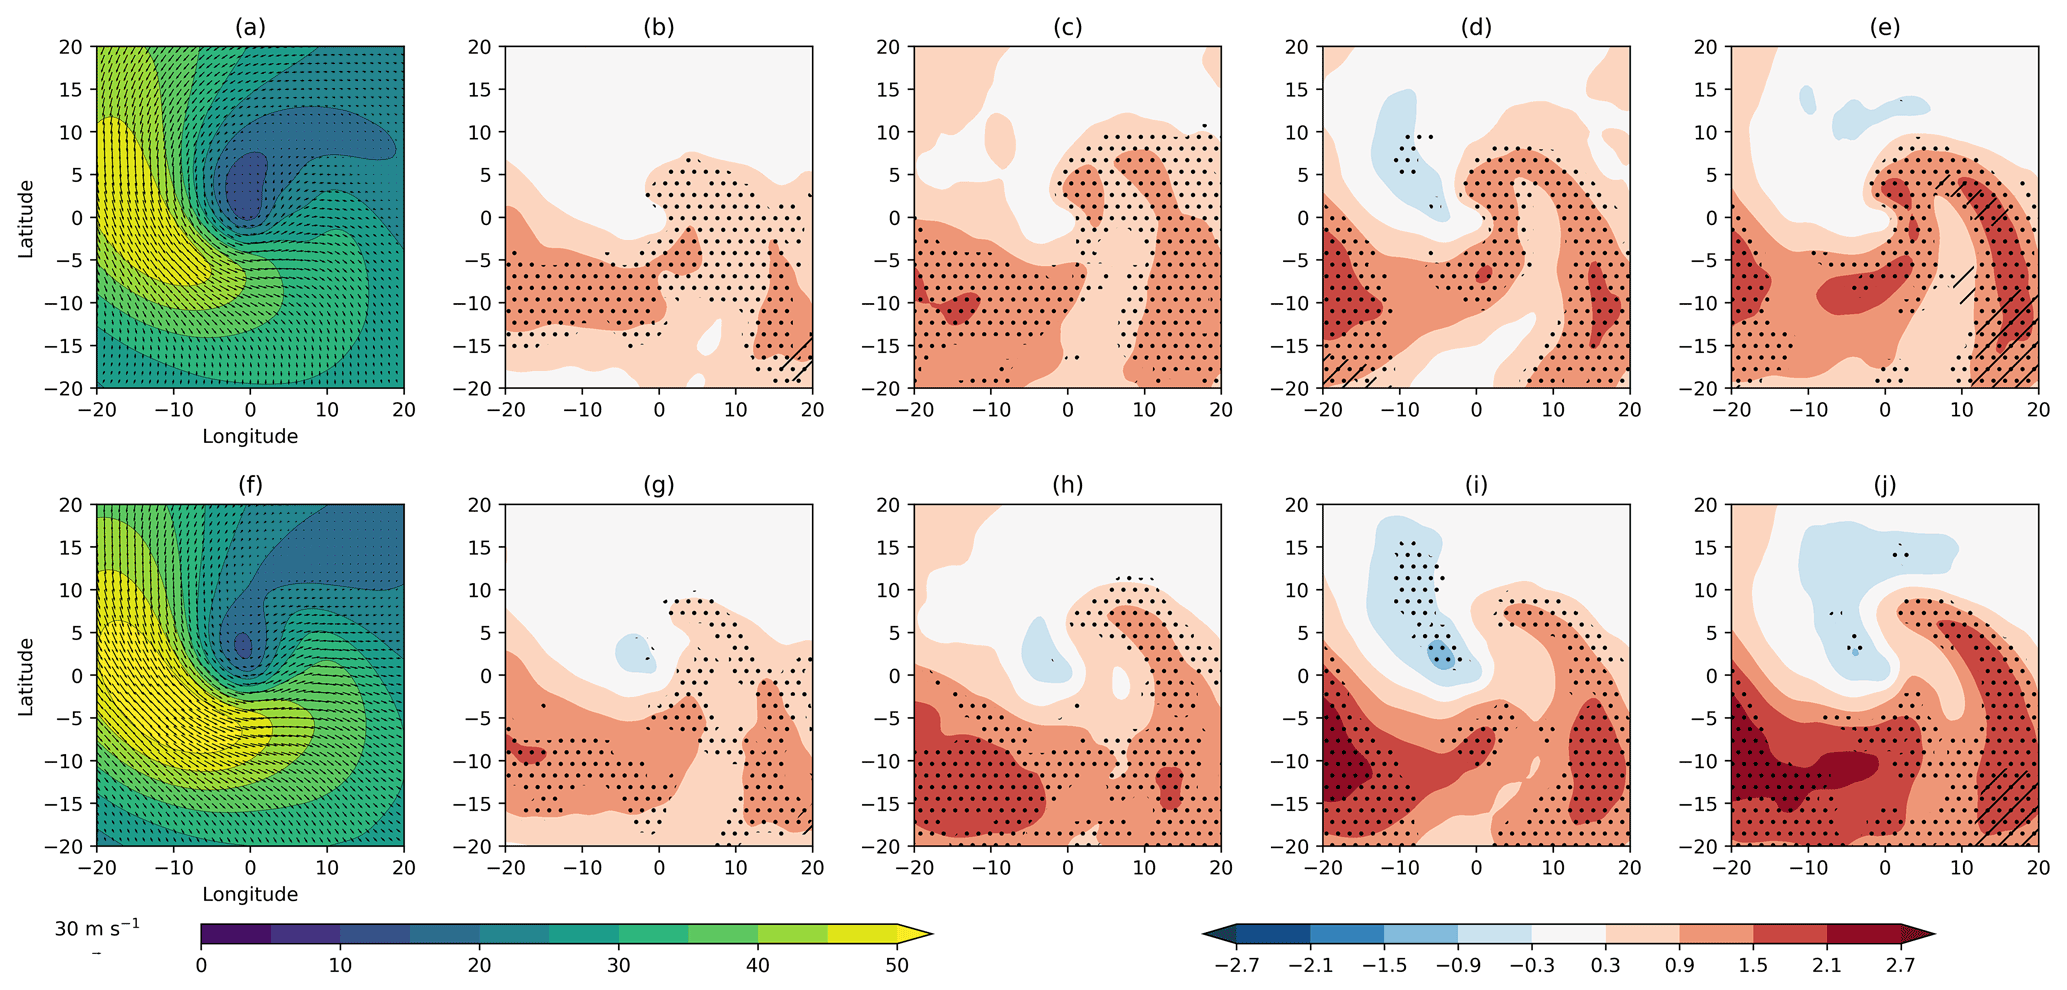
The SH winter (JJA; Fig. 9) is consistent with NH winter (Fig. 6) in that a strengthening of the cyclone wind speeds is seen. In a system relative perspective (Fig. 9a–e) a minimal increase is seen for SSP1-26 (Fig. 9b). However, for the remaining SSPs an increase is seen with the largest increases on the poleward flank of the cyclone centre (Fig. 9c–e). This strengthening is located in a similar location to the underestimation noted in the historical simulations relative to ERA5 (Fig. S1 in the Supplement and Priestley and Catto, 2022), which is likely associated with the CCB. In SSPs 3-70 and 5-85 there is also a strengthening on the equatorward side of the cyclone, associated with the stronger pressure gradients (not shown). Furthermore, the largest strengthening is generally confined to within 4 and 8∘ of the cyclone centre, which is further away from the centre than the largest biases in the historical simulations, and also further away from the centre than the strongest wind speeds in Fig. 9a), indicating a possible expansion of the wind field. The strength of the increase is up to 1.8 m s−1 and is larger than in NH DJF in SSP5-85 (Fig. 9e).
In an Earth relative perspective, the cyclones in SH JJA (Fig. 9f–j) exhibit a large and robust strengthening on the equatorward flank of the cyclone. Unlike in the system relative perspective, the Earth relative anomalies get progressively stronger with each SSP, resulting in widespread anomalies of over 1.8 m s−1 in SSP5-85 (Fig. 9j). Associated with this, we identify a robust increase in the cyclone propagation speed (Fig. 7d), with a median change of ∼0.6 m s−1. There is strong model agreement on this change (unlike in NH DJF), and increases are largest for SSP5-85.
As with the vorticity and MSLP distributions (Figs. 4 and 5), the lower tropospheric wind speed response in the SH summer (Fig. 10) is consistent with the response from the winter for extreme cyclones (Fig. 9). In both a system relative and an Earth relative perspective the circulation strengthens for the larger climate change scenarios, with minimal changes identifiable in the SSP1-26 simulations (Fig. 10b, g). In the system relative perspective the wind speeds increase on the poleward flank of the cyclone, with the largest change being between 5 and 10∘ from the cyclone centre, which is outside the maximum from the historical simulations (Fig. 10a) and as in JJA is suggestive of an expansion of the circulation. The largest increase in system relative winds is by up to 1.4 m s−1 for SSP5-85 conditions (Fig. 10e). As with all other seasons in both hemispheres, the change in wind speeds in the Earth relative perspective is concentrated on the equatorward flank of the cyclone for SH JJA (Fig. 10f–j). The wind speed changes are larger for the stronger climate change scenarios and peak at up to 1.4 m s−1 under SSP5-85 conditions (Fig. 10j). As with SH JJA, these increases demonstrate a change in the cyclone propagation speed, and we are able to identify an increase in propagation speed (Fig. 7c), albeit of smaller magnitude than SH JJA.
It is notable from the lower tropospheric composites and propagation speeds (Figs. 6–10) that the responses of extreme cyclones to climate change in the NH and SH summer seasons are again different, as they were in the vorticity and MSLP distributions (Figs. 4 and 5). This response is likely a result of the enhanced pressure gradients in the SH (not shown) and the persistent poleward shift of the storm tracks in the SH in both seasons (Fig. 3). This is a contrast to the NH summer, whereby the storm tracks do not shift poleward, and instead a reduction in cyclonic activity is seen around the entire hemisphere (Fig. 2f–j). This is likely due to the larger polar amplification in the NH and reduction in lower tropospheric baroclinicity across the hemisphere, which has a strong impact on the NH storm tracks and general circulation (Coumou et al., 2015; Harvey et al., 2015).
3.4.2 Cyclone extreme wind footprint
For all seasons the largest 850 hPa Earth relative winds are commonly found within 5∘ of the cyclone centre (Figs. 6–10). The largest future changes, however, are often found further from the cyclone centre and can be 10–15∘ from the cyclone centre. For all seasons it is likely that there are changes in how broad the circulation is. To quantify the change in the broadness, a transect of the circulation is taken on the equatorward side of the cyclone, from the cyclone centre to the edge of the composite area, thereby intersecting the region of maximum wind speeds (dashed white line Fig. 6f). The fraction of this transect above a fixed wind speed threshold is calculated and plotted against the maximum wind speed of the cyclone along the same transect. Wind speed thresholds have been chosen to best represent the footprint of the historical composites.
For NH DJF (Fig. 11a) there are only small changes in maximum wind speed; however there are increases in the broadness of the area of above-threshold wind speeds, with the peak of the distribution being broader in the SSP5-85 experiment than in the historical period. Conversely, in NH JJA (Fig. 11d) there is a considerable contraction of the area of above-threshold wind speeds by nearly 2∘ that is also associated with a lower maximum wind speed. In the SH we find an expansion in the area of above-threshold wind speeds in both DJF and JJA (Fig. S2). However, unlike in the NH, this is also associated with a slight increase in the maximum wind speeds at 850 hPa.
As the broadness of the circulation is increasing (in NH DJF), we can quantify the area of the cyclone above a fixed threshold for the entire composite area and how this evolves for the different SSPs over time. Figure 12 shows time series of the winter and summer seasons in the NH and SH for the area of the cyclone composite above a fixed threshold of 17 m s−1, encapsulating the area of strongest winds of the composite cyclones. The differing responses in the DJF and JJA in the NH are notable in Fig. 12a and b, with the SSPs showing an increase in cyclone area above 17 m s−1, and a decrease in JJA, by the end of the century. The differences between the SSPs are not overly large in the NH, with SSP5-85 showing a median increase of 7 % in above-threshold winds by 2100 in DJF, which is similar to SSP3-70 (Fig. 12a). However, increases may be as large as 15 % in SSP5-85 based on the large spread of model projections, with almost half of the SSP3-70 and SSP5-85 estimations exceeding the historical 75th percentile in the final decade of the 21st century. The SSP1-26 and SSP2-45 scenarios generally show lower increases in the area of above-threshold wind speeds with median increases of 2 %–3 % by the end of the century. All the SSPs show a very similar average evolution until 2080 of a 2.5 %–5 % size increase, with the two most aggressive SSPs only separating from the two weakest SSPs after ∼2085. Interestingly, the SSP2-45 scenario indicates a decline after 2075, which is in line with modelled reductions in CO2 emissions toward the end of the 21st century in that SSP (O'Neill et al., 2016). Despite the differences in scenarios, all of the SSPs in Fig. 12a have a median extreme wind speed area lower than the 75th percentile from the historical simulations by 2100. In JJA all SSPs are very similar and generally show up to a 10 % reduction in the area of above-threshold winds throughout the century. Generally, SSP5-85 and SSP3-70 show the largest reduction, which may be as large as 25 %–30 %. Despite this, the inter-annual variability is especially large for all SSPs, and each has considerable overlap with a large amount of the historical distribution of cyclone area.
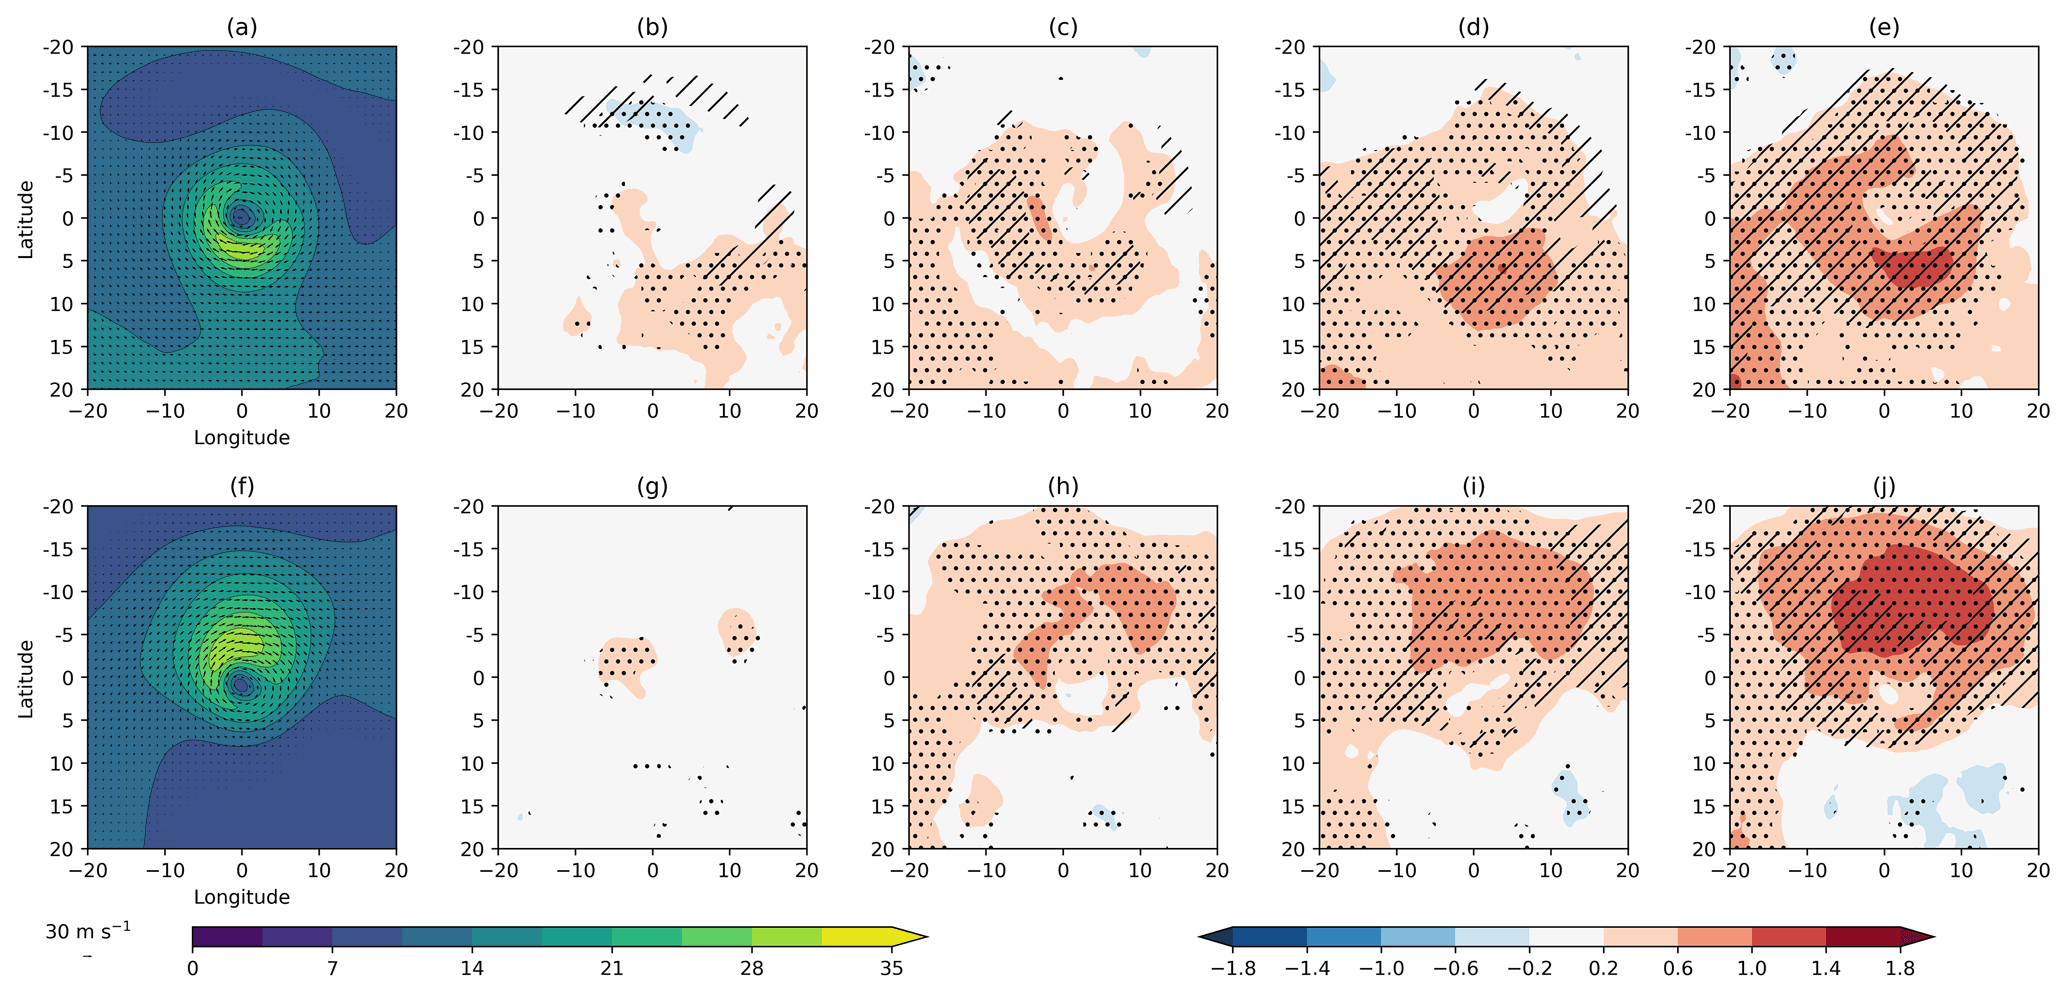
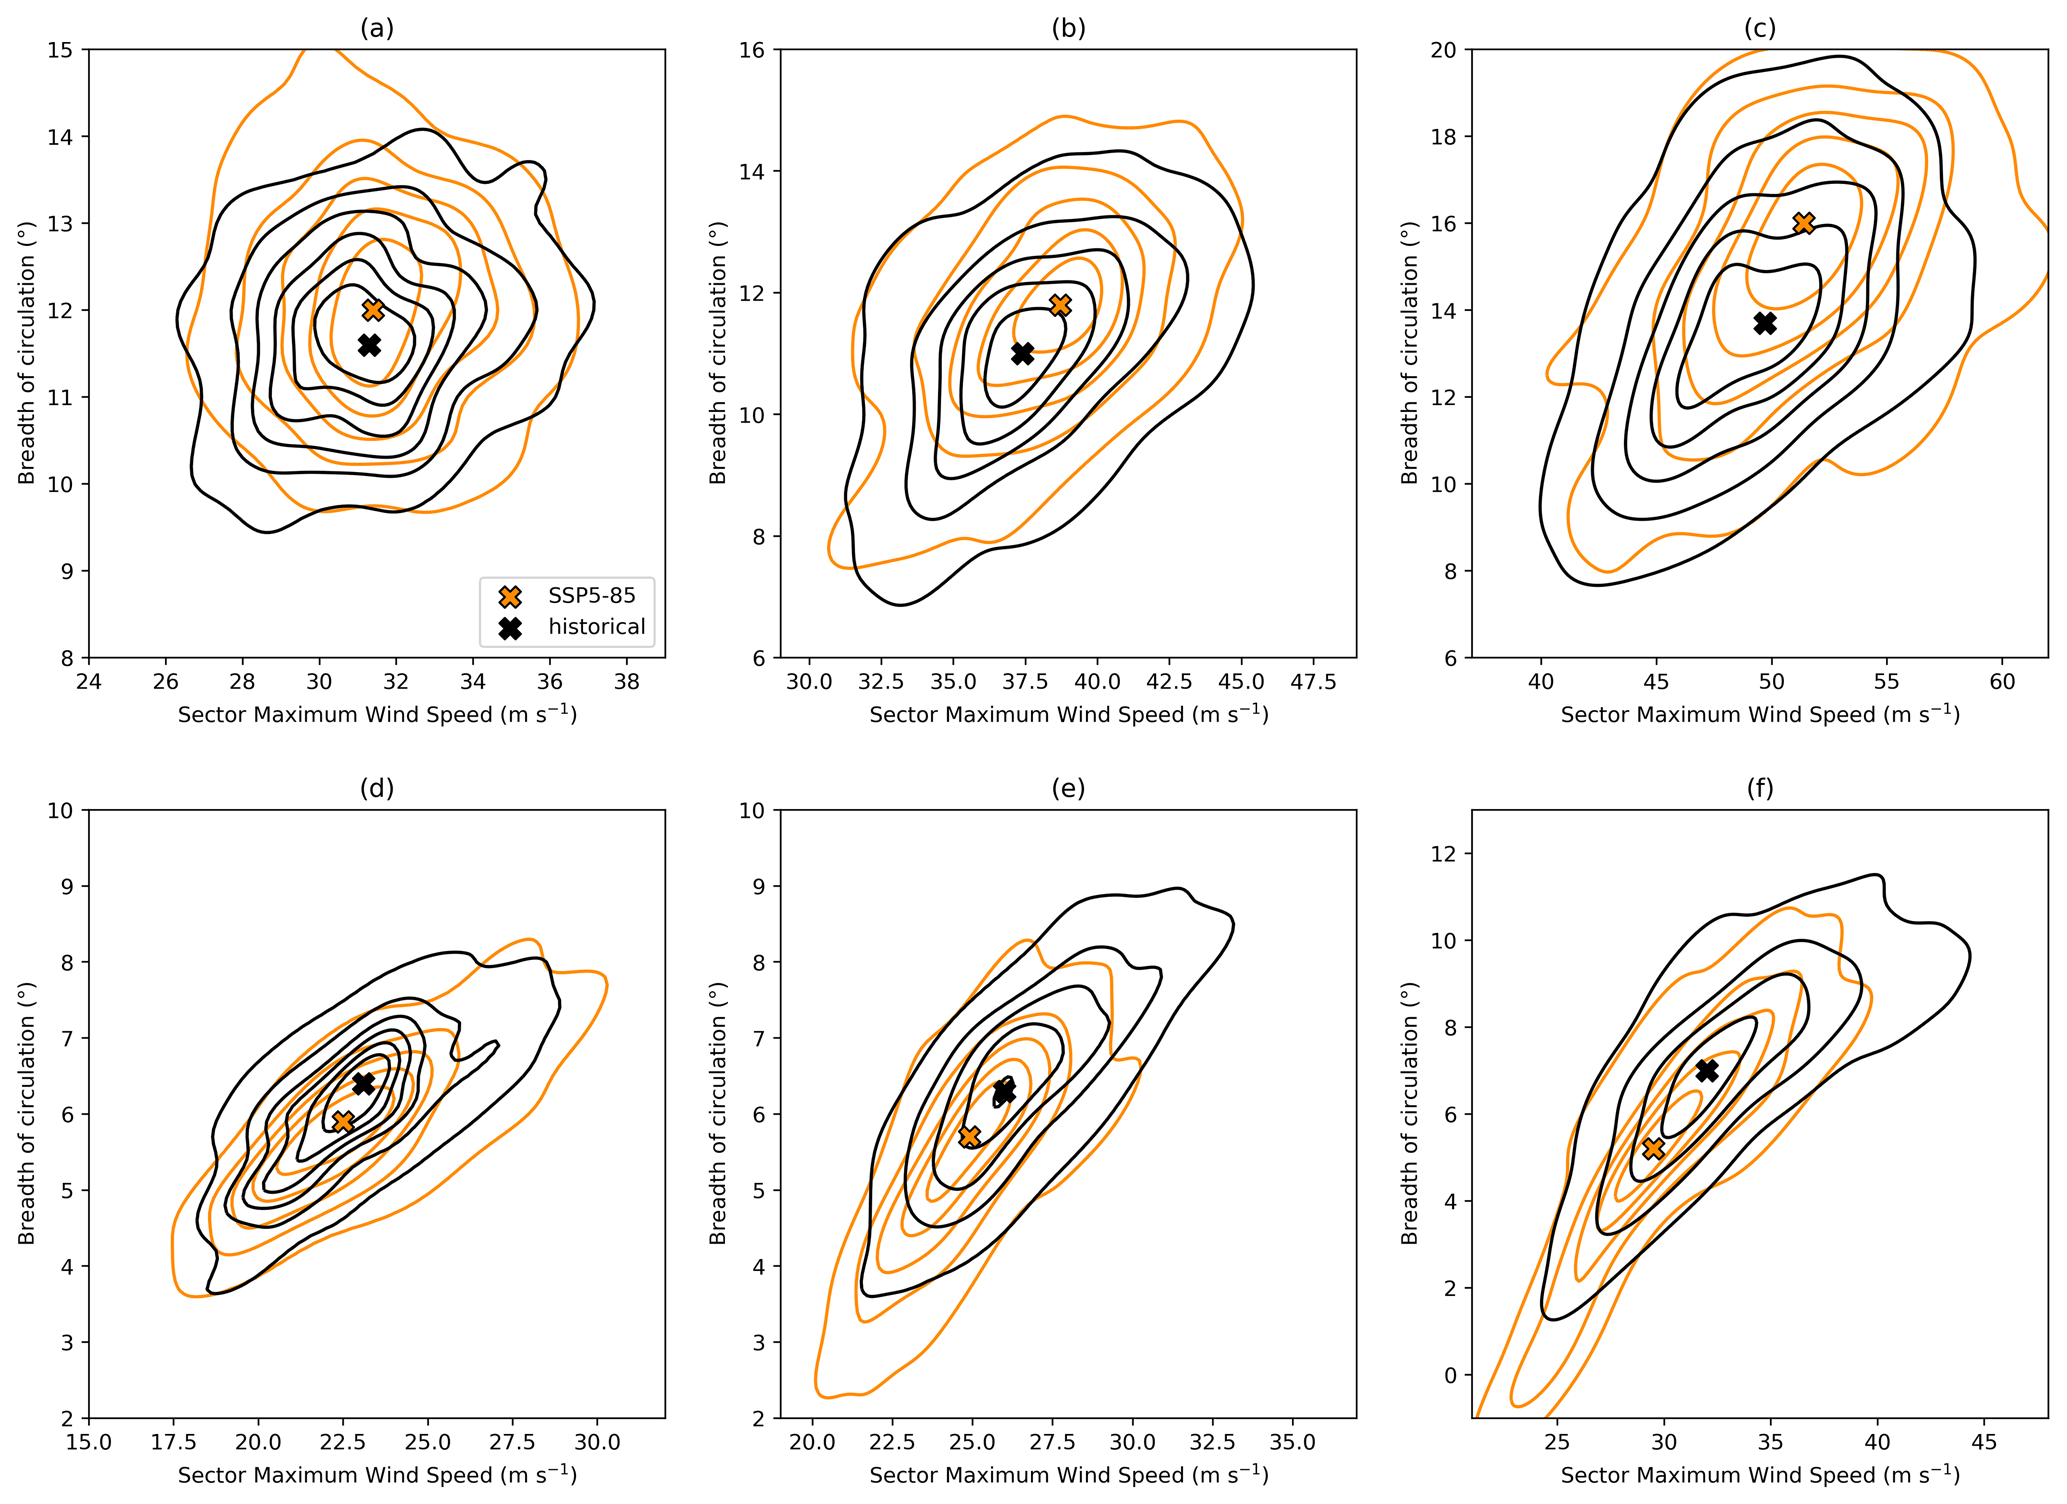
Figure 11Scatter plot of maximum wind speed along the cyclone transect (dashed white line Fig. 6f) against the broadness of wind speeds above a fixed threshold along the same transect plotted via a Gaussian kernel density estimator (KDE). KDEs are plotted for the historical (black, 1979–2014) and SSP5-85 experiments (orange, 2080–2100) for the NH in (a–c) DJF and (d–f) JJA for (a, d) 850 hPa, (b, e) 500 hPa, and (c, f) 250 hPa. Crosses indicate the highest frequency of the KDE. Thresholds for the broadness of the circulation are (a, d) 17 m s−1, (b) 25 m s−1, (c) 35 m s−1, (e) 20 m s−1, and (f) 25 m s−1.
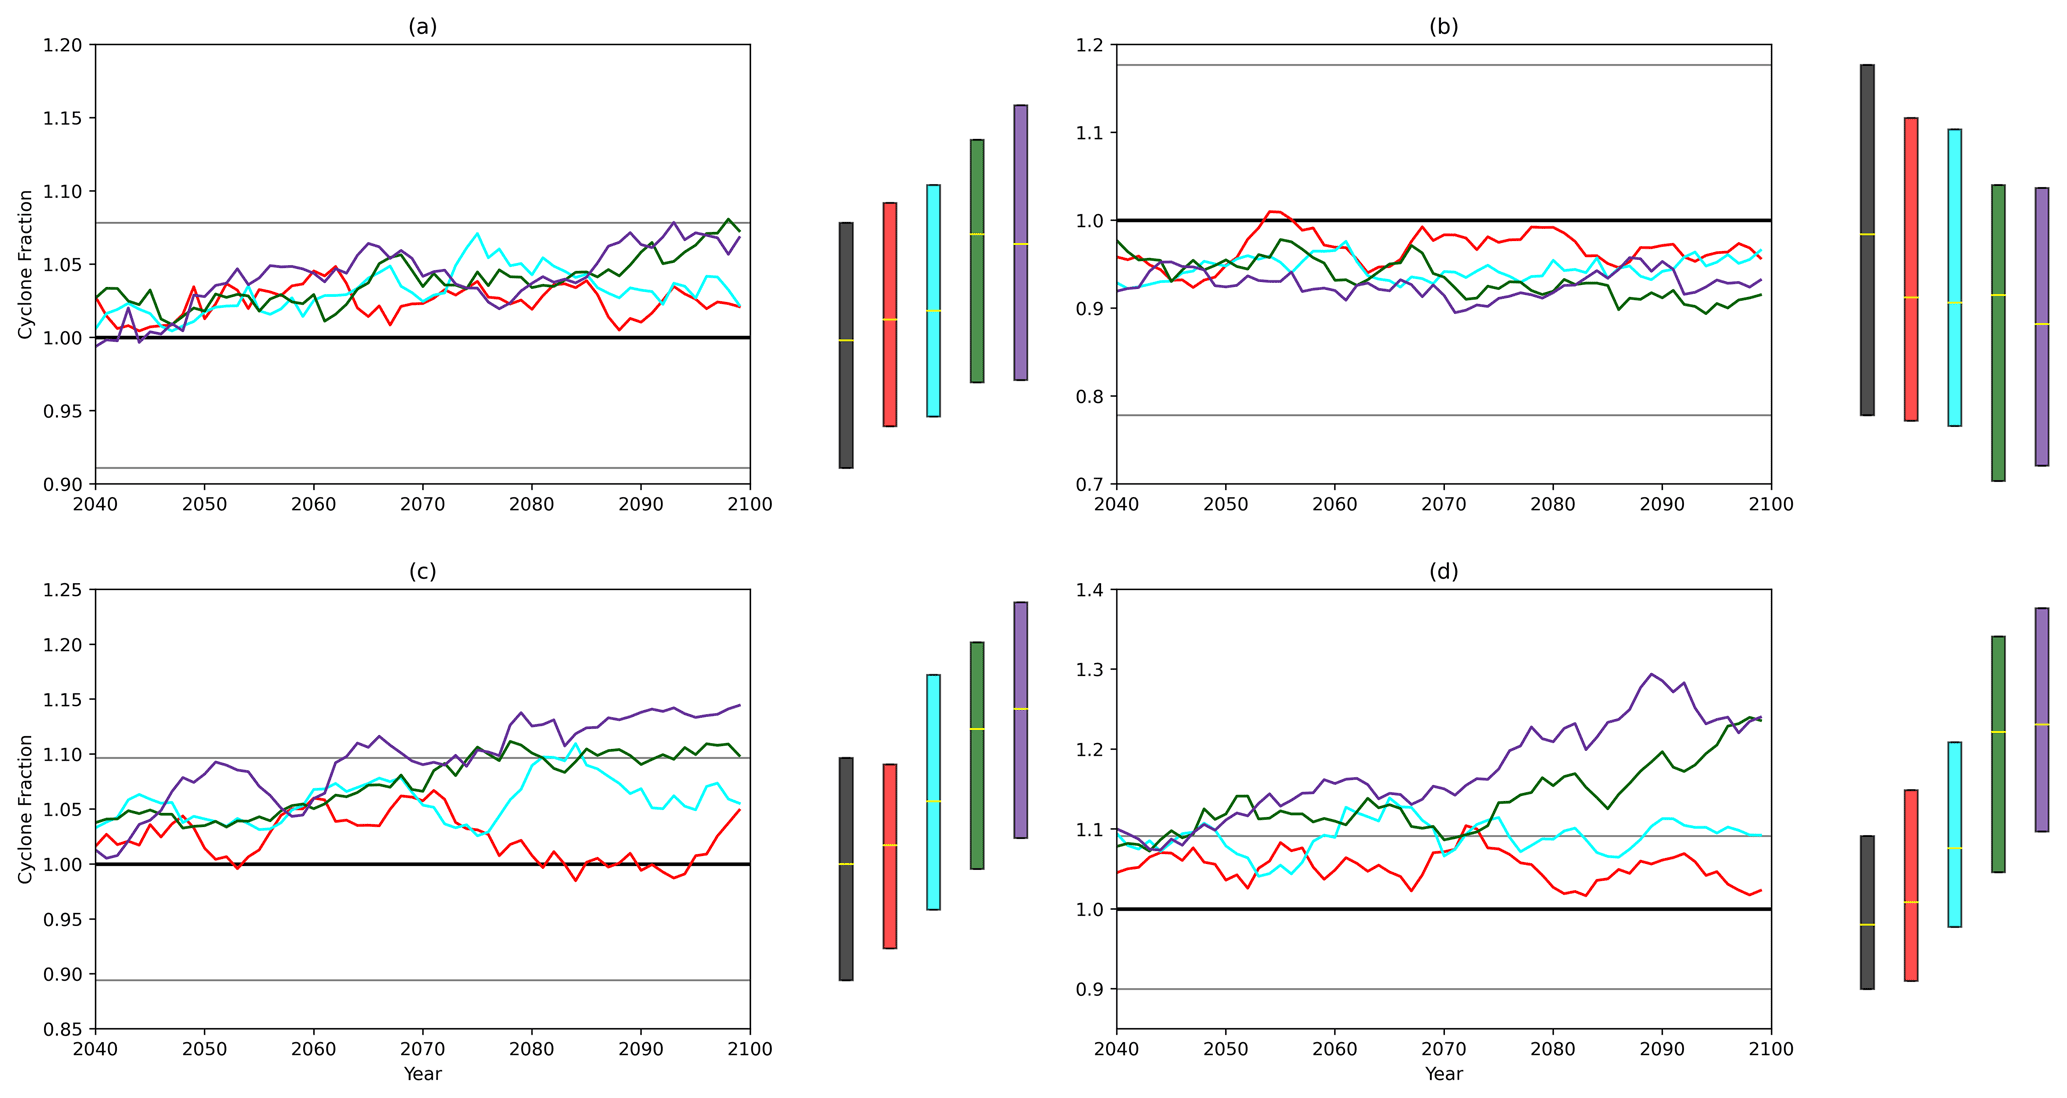
Figure 12Evolution of cyclone area with Earth relative wind speeds at 850 hPa exceeding 17 m s−1 from 2040–2100 for SSP1-26 (red), SSP2-45 (cyan), SSP3-70 (green), and SSP5-85 (purple). Time series are the multi-model means and are shown for NH DJF (a), NH JJA (b), SH DJF (c), and SH JJA (d). The thick black line refers to the 1979–2014 seasonal average from the historical simulation, with the grey lines being the 25th and 75th percentiles respectively. A cyclone area of 1 is the average area for the 1979–2014 period. Scenario time series have been smoothed using a 5-year moving average. Boxplots show the distribution of yearly averaged cyclones areas for each experiment from 2090–2100 (scenarios) and 1979–2014 (historical). The yellow lines indicating the median and boxes extend to the inter-quartile range.
In the SH a larger signal, with greater differences between the SSPs, is identifiable for the area of above-threshold cyclone winds (Fig. 12c, d). For both DJF and JJA the higher-emission SSPs demonstrate a marked increase in cyclone area of above-threshold winds relative to the historical simulations. In DJF (Fig. 12c) the SSP5-85 simulations have an extreme wind speed area nearly 15 % larger by the end of the century, which is also considerably above the 75th percentile from the historical simulations. The SSP3-70 simulation demonstrates around a 10 % increase by the end of the century, which is comparable to the 75th percentile of the historical simulations. Both the SSP5-85 and SSP3-70 simulations are similar until around 2075, when the rate of increase in cyclone area levels off in SSP3-70. Accounting for the spread in the model simulations by the end of the century indicates increases may be as large as 20 %–25 % relative to the historical average, with a majority of the SSP3-70 and SSP5-85 distributions being above the historical 75th percentile. The SSP2-45 experiment is very similar to SSP3-70 until 2070; however the average area increase is lower at only 5 % above the historical average by the end of the century. The SSP1-26 experiment demonstrates the smallest by the end of the century, which is within the range of the 75th percentile and less than a 5 % increase in area compared to the historical simulations. The SSP1-26 simulation actually increases until approximately 2070, when it closely matches the SSP2-45 and SSP3-70 scenarios, with a decline then following, before levelling off by approximately 2085. By the end of the century the spread in the SSP1-26 simulations is very similar to that of the historical cyclone area.
In SH JJA (Fig. 12d) a similar evolution to DJF (Fig. 12c) is notable, albeit with a larger signal in the SSP5-85 and SSP3-70 scenarios. Both SSPs demonstrate large increases in cyclone area above the threshold wind speed compared to SSP2-45 and SSP1-26 and show an increase in an average area increase of at least 20 % by the end of the century. From 2090–2100 a majority of the distribution in both SSPs exceeds the 75th percentile of the historical simulations, and the 75th percentile of the SSP5-85 scenario estimations is 35 %–40 % larger than the historical average. For both these SSPs the cyclone area demonstrates a steady increase from 2040, by which all experiments already show an increase in size of 5 %–10 % above the historical average. Neither SSP2-45 nor SSP1-26 shows a marked increase from 2040–2100. SSP2-45 maintains an average of approximately 10 % increase in cyclone area by 2100, whereas SSP1-26 shows a very slight decrease to an average of a 5 % increase in size by 2100. The clearer signal in the SH and greater separation in the SSPs is (as mentioned previously) likely due to the reduced land influence in the SH allowing for a more robust response to the evolving climate forcings. In fact, the evolution of the cyclone size above the 17 m s−1 wind speed threshold bears considerable similarity to the evolution in CO2 concentration noted in the ScenarioMIP experimental design (O'Neill et al., 2016; Fig. 3b).
3.4.3 Middle troposphere
The middle troposphere is defined as 500 hPa in this analysis. In the interest of brevity, only the NH DJF changes will be discussed in detail, with changes from other seasons available in the Supplement (Figs. S3–S5) and discussed briefly at the end of this section.
In NH DJF (Fig. 12) the spatial patterns of change across the models presents a similar pattern across all SSPs in both a system relative (Fig. 13b–e) and an Earth relative (Fig. 13g–j) perspective. In the system relative perspective there is first of all a strengthening of the wind speeds on the poleward flank of the cyclone centre that is away from the centre. This is a region where winds are travelling from east to west (Fig. 13a). This element of the circulation in the mid-troposphere is likely associated with the upper reaches of the CCB (Priestley and Catto, 2022), and this may indicate a strengthening of this airstream, which is robust across a majority of the models.
The other notable difference in the system relative winds is situated within the warm sector of the cyclones. For all SSPs there is evidence of a strengthening of the winds, which is progressively stronger with the more aggressive climate change scenarios and by up to 1 m s −1 in SSP5-85 (Fig. 13e). This increase is located between 5 and 10∘ of the cyclone centre on the equatorward and eastern flanks. These regions are associated with the strongest ascent (Catto et al., 2010; Priestley and Catto, 2022), which therefore indicates a possible strengthening of the WCB. A large amount of the strengthening in the warm sector is due to an increase in the meridional component of the wind by over 1.8 m s−1 to the east and southeast of the cyclone centre (Fig. S6). This stronger warm sector motion may, in part, be driven by increased atmospheric moisture content under future climate conditions, which will result in larger condensational heating in ascending branches of cyclones and potentially increased rates of ascent.
One final feature to note across all the SSPs in the system relative framework is the weakening of the circulation on the rearward (western) flank of the cyclone between 5 and 15∘ of the cyclone centre. This region is behind the cold front and generally is associated with the descent of drier air (Catto et al., 2010; Priestley and Catto, 2022). This weakening suggests that the descent rate may be weaker under future climates, which will again be exacerbated with larger levels of climate change.
In the Earth relative perspective (Fig. 13g–j) a very similar picture is presented as in the system relative perspective (Fig. 13b–e). The main difference is the increased strength of the changes in the warm sector in the Earth relative perspective, which is also slightly broader than in the system relative perspective. In Fig. 11b it can be seen that, as at 850 hPa, the area of extreme wind speeds becomes considerably broader. However, unlike at 850 hPa the maximum wind speed also increases at this level. This may be due to a larger role of moist processes in the mid-troposphere; however projected increases in the strength of the upper-level jet (Harvey et al., 2020) may also have an influence at this level.
In the NH JJA (Fig. S3) and both SH seasons (Figs. S4–S5) the pattern of change is broadly consistent with NH DJF (Fig. 13), but with magnitudes and sign that are consistent with the biases noted at 850 hPa (Figs. 8–10). For NH JJA (Fig. S5) there is weakening of the wind speeds in the warm sector of the cyclones, which is progressively larger for the more aggressive SSPs. Furthermore, the broadness of the extreme wind speeds also decreases (Fig. 11e). In the SH the responses in both seasons are very similar (Figs. S4–S5), unlike in the NH. Both SH seasons feature a pronounced strengthening of the wind speeds in the warm sector, with the largest anomalies being between 5 and 15∘ of the cyclone centre on the equatorward and forward flanks of the cyclone.
Both SH seasons also show a strengthening of the wind speeds on the poleward flank of the cyclone in the system relative framework, at a distance of approximately 5–7∘, which is likely associated with the strengthening of the CCB noted earlier.
3.4.4 Upper troposphere
As in the previous section, only the changes for NH DJF (Fig. 14) will be discussed in detail due to the similar responses of the other seasons and magnitude that is consistent with anomalies at the other tropospheric levels. Changes for the other seasons are present in Figs. S7–S9.
The changes in the wind speeds at 250 hPa in NH DJF can be broadly split into three distinct features in the system relative perspective (Fig. 14a–e). Firstly, 10–20∘ to the southwest of the cyclone there is an increase in the wind speeds, which is larger for the strongest SSPs. This is likely associated with a strengthening/broadening of the upper-level jet (Fig. 11c). Secondly, there is an increase in the wind speeds by up to 2.1 m s−1 to the south, east, and northeast of the cyclone centre that is ∼5∘ from the cyclone centre and rotating cyclonically around it. This is the region of largest ascent and divergence (Fig. 15a) and the region where models struggle to capture the strength of the wind speeds in historical simulations (Priestley and Catto, 2022). This increase is situated above and slightly downstream of a similar increase at 500 hPa (Fig. 13b–e) and therefore likely associated with the slantwise ascending motion in the warm sector. This strengthening is associated with large increases in meridional motion (Fig. S6) and together with the results at 500 hPa suggests that the WCB in cyclones is likely to be stronger and progressively so with increased warming rates by the end of the century.
The third change at 250 hPa is an increase in wind speeds on the forward flank of the cyclone between 10 and 20∘ of the cyclone centre and extending in a southerly and southwesterly direction. The strengthening is mostly driven by a more negative meridional component of the wind (Fig. S6e), which is associated with the anticyclonic turning of air and likely part of the WCB outflow. It is likely that the changes in this sector of the cyclone are associated with those closer to the cyclone centre.
All these anomalies are largest for SSP5-85 (Fig. 14e) with strong model agreement across the SSPs, indicating that the warmer climate, which is characterized by a higher moisture content in the future, results in a stronger wind speeds in the warm sector and anticyclonic turning near/at the tropopause. The forcing of these changes is likely to be somewhat driven by changing rates of vertical motion in the cyclone, which can be inferred from the rate of horizontal divergence at 250 hPa (Fig. 15). There are increases in divergence in the warm sector, with the largest increases downstream and poleward of the maximum in the historical simulations (Fig. 15e), indicating stronger ascent in the warm sector of the cyclones and larger outflow near the tropopause. Furthermore, there is a smaller increase in convergence behind the cold front, suggesting that the descending motion within the cyclones, which often originates near this level, does not undergo changes as large as in the ascending branch. Therefore, the asymmetry in the vertical velocity within extratropical cyclones may increase.
In an Earth relative perspective (Fig. 14f–j) a majority of the features noted in the system relative perspective (Fig. 14a–e) are also notable and consistent in their magnitude and positioning. As at other levels an increase in the strength of change, particularly on the equatorward flank of the cyclones, is notable, which is a result of the increasing speed of cyclones in the future. As in the lower and middle troposphere, a considerable broadening of the circulation is also identifiable at 250 hPa (Fig. 11c) alongside an increase in the maximum speed to the south of the cyclones.
Composites for the changes in the 250 hPa wind speeds for the NH JJA (Fig. S7) and also for DJF and JJA in the SH (Figs. S8 and S9) are now discussed briefly. For these other seasons a majority of the same features identified for NH DJF (Fig. 14) are seen, with magnitudes of changes that are consistent with the same season in the middle and lower troposphere. In NH JJA a weakening of the wind speeds is again identifiable throughout the warm sector of the cyclone. Due to the considerably weaker nature of the wind in NH JJA, the separate changes associated with the anticyclonic motion are harder to identify. However, the meridional component of wind shows a marked increase to less negative values (weakening, Fig. S6j) to the southeast of the cyclone, indicating a consistent (yet opposite) behaviour to the change in NH DJF. Furthermore, there is a considerable weakening of the divergence (Fig. 15j), suggesting that the rate of vertical motion in the cyclones will be weaker.
In the SH both seasons (Figs. S8 and S9) are very consistent with NH DJF in that strengthening wind speeds associated with both the cyclonic and anticyclonic motions within the composite area are identifiable, with both only becoming evident for SSP2-45 and above. For both seasons in the SH and for NH JJA, the changes are largest in magnitude for SSP5-85 and progressively lower for each SSP below. All of the major changes are robust across the model ensemble and represent a clear picture as to how cyclones will change as a result of future climatic change.
For all levels in the troposphere the cyclones in the SH only start to show a consistent signal and pattern of change for SSP2-45 and above, whereas the pattern of the anomalies in the NH is usually evident (although often small in magnitude) even for SSP1-26.
3.5 Sensitivity of change to cyclone intensity
We have already shown that extreme cyclones increase in intensity for relative vorticity and MSLP (decrease in NH JJA; Figs. 4 and 5). However, it is only for MSLP that an increase in intensity of moderate strength cyclones is also seen (Fig. 5). To assess how cyclones from different parts of the intensity distribution are changing dynamically, 850 hPa wind speeds from cyclones that pass over the North Atlantic (30–70∘ N, 280–360∘ E) are examined.
The wind speeds at 850 hPa for the AVG cyclones (Fig. 16a, d) have a much smaller footprint than the EXT cyclones (Figs. 6–10). Furthermore, wind speeds are lower, with the maximum being less than 20 m s−1. For the EXT cyclones the largest changes in Earth relative wind speed in the SSP5-85 experiment are on the southeastern flank of the cyclone and approximately 5–10∘ from the cyclone centre (Fig. 16c, f). The AVG cyclones in the North Atlantic exhibit a similar sign of change, although the magnitude is smaller (Fig. 16b, e) and, in the case of DJF, focussed in a different part of the cyclone.
In DJF, the AVG cyclones (Fig. 16b) feature a strengthening of up to 1 m s−1 to the south and southwest of the cyclone centre at a distance of approximately 10∘. The increases to the southeast of the cyclone centre, which are concentrated in the warm sector of the cyclone, are absent or smaller in magnitude than the EXT cyclones (Fig. 16c). Furthermore, changes in the system relative wind of AVG cyclones are considerably smaller and slightly negative to the southeast of the cyclone centre, whereas this is positive and concentrated in the warm sector for EXT cyclones (Fig. S10). Therefore, changes in EXT cyclones involve changes to strength of winds within the cyclone, which are likely associated with stronger diabatic processes, with this not being the case in AVG cyclones.
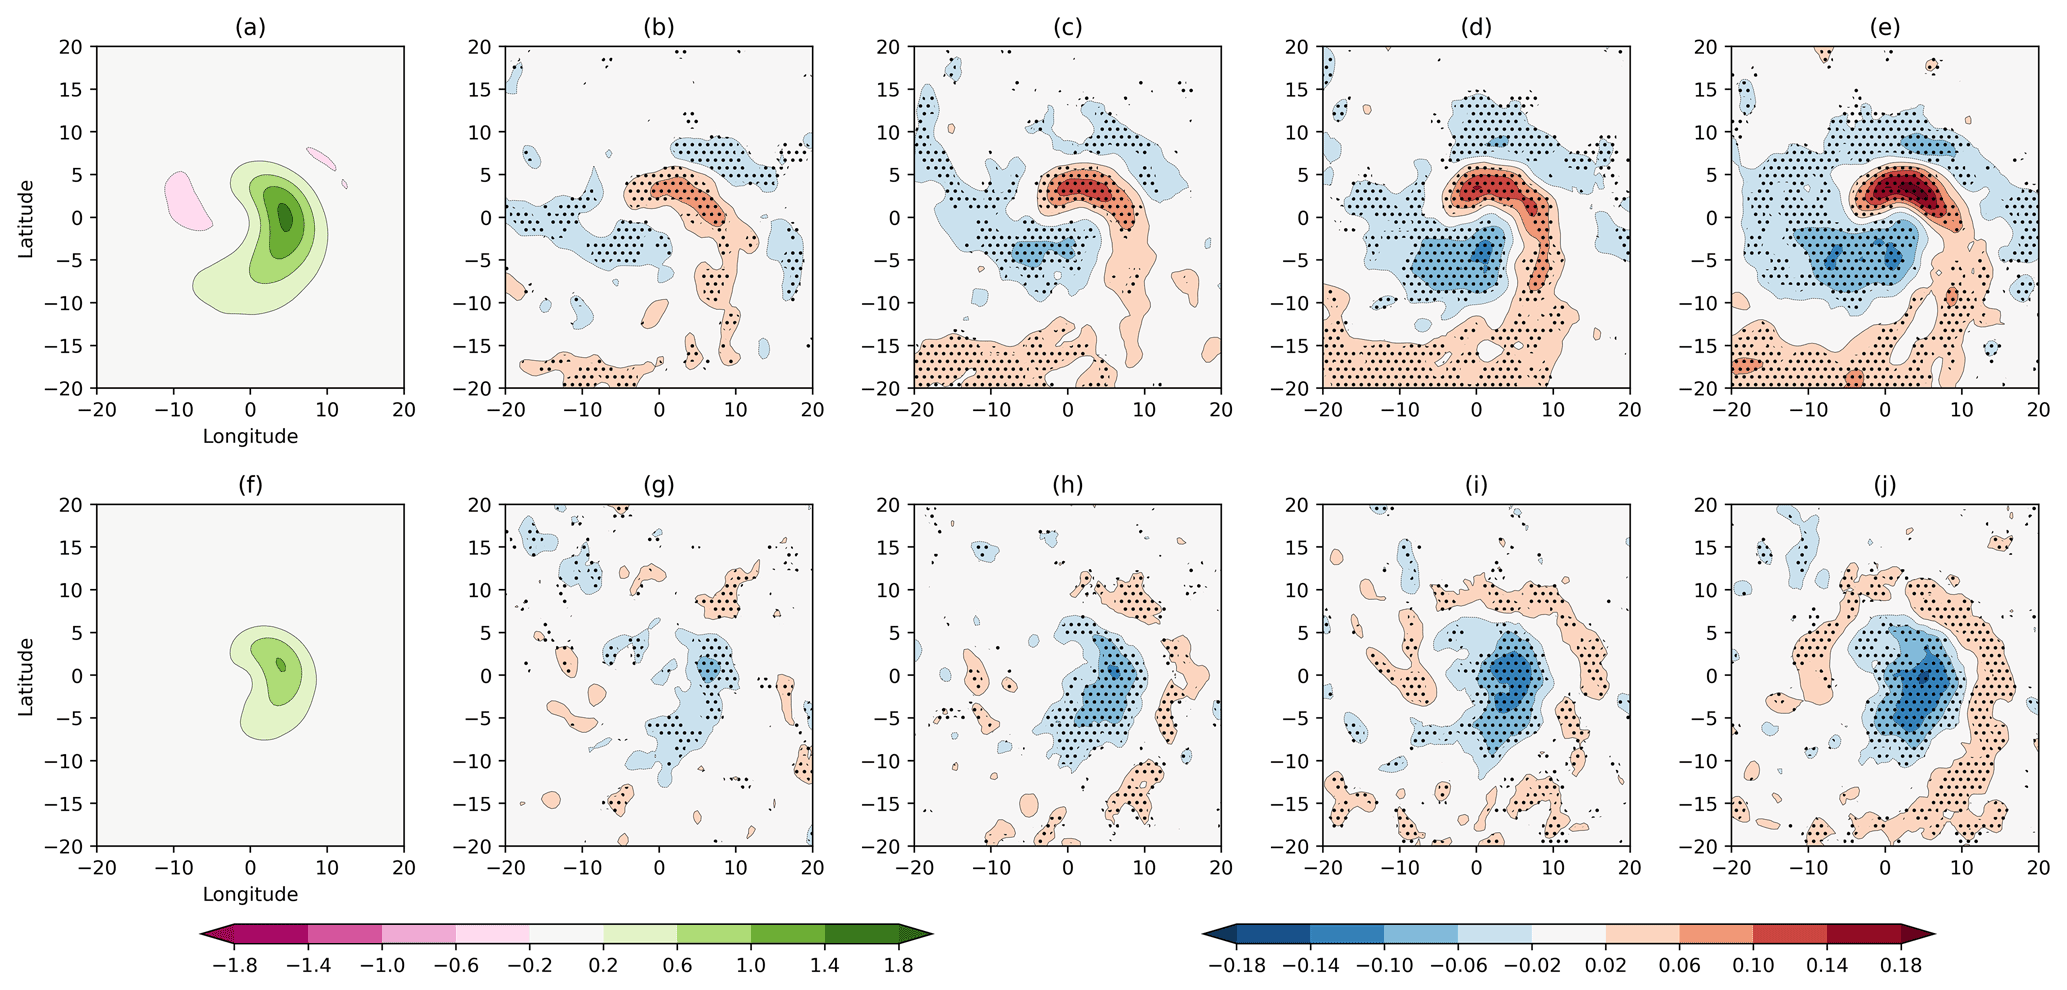
Figure 15Composites of horizontal divergence at 250 hPa associated with extreme cyclones in the NH for (a–e) DJF and (f–j) JJA. Composites are shown for the 1979–2014 CMIP6 historical average (a, f) and changes for the SSP1-26 (b, g), SSP2-45 (c, h), SSP3-70 (d, i), and SSP5-85 (e, j) scenarios for the 2080–2100 period. Stippling indicates 80 % model consensus on the sign of the bias. Units are s−1.
In JJA, a weakening of the 850 hPa wind speeds is present in both AVG and EXT cyclones (Fig. 16e, f). For both cyclone groups the largest changes are on the southern flank of the cyclone; however they are larger for the EXT cyclones (as in DJF). It therefore appears that the wind speeds of EXT cyclones tend to respond more to changes in future climate forcing and have a larger magnitude of change than AVG cyclones. A similar pattern is also seen in the SH and for cyclones present over the North Pacific (not shown).
4.1 Summary
This paper presents the first assessment of changes to objectively identified cyclones, their intensities, and associated wind speeds in the newest-generation CMIP6 models. We have also considered a number of metrics to assess changes in intensity across a range of different shared socio-economic pathways, and the main findings of our work are as follows:
-
Cyclone numbers are projected to decrease globally in both winter and summer seasons. This decrease will be largest with the greatest increase in climate forcing (Fig. 1). Extreme cyclones are likely to be more common in winter seasons, with more cyclones exceeding historical intensity thresholds.
-
In the Northern Hemisphere winter there is a projected poleward shift of the North Pacific storm track, an extension of the North Atlantic storm track into Europe, and a decrease in activity over the Mediterranean. In summer a reduction in storm track activity is projected hemispherically. For both seasons the projected changes increase with the more aggressive climate change scenarios (Fig. 2).
-
In the Southern Hemisphere a robust poleward shift of the storm tracks is projected for both seasons in a symmetric manner around the hemisphere (Fig. 3).
-
The most extreme cyclones will have higher intensities (higher vorticity and lower MSLP) for both seasons in the SH and for NH winter, whereas the strongest summer cyclones in the NH will weaken slightly (Figs. 4 and 5).
-
The strongest cyclones will have stronger wind speeds throughout the troposphere for NH winter and both seasons in the SH. The largest increases are noted in the warm sector of the cyclones (Figs. 6, 9, 10, 13, and 14).
-
Cyclone propagation speed is unlikely to change in NH DJF yet will decrease in NH JJA. Propagation speeds will robustly increase in both SH seasons (Fig. 7).
-
The area of extreme wind speeds will increase in future winters (Fig. 11), and the area of intense wind speeds in extreme cyclones will increase by up to 40 % by the end of the century under SSP5-85 conditions (Fig. 12).
-
Extreme cyclones are projected to intensify at a larger rate than average-strength cyclones in the winter (Fig. 16).
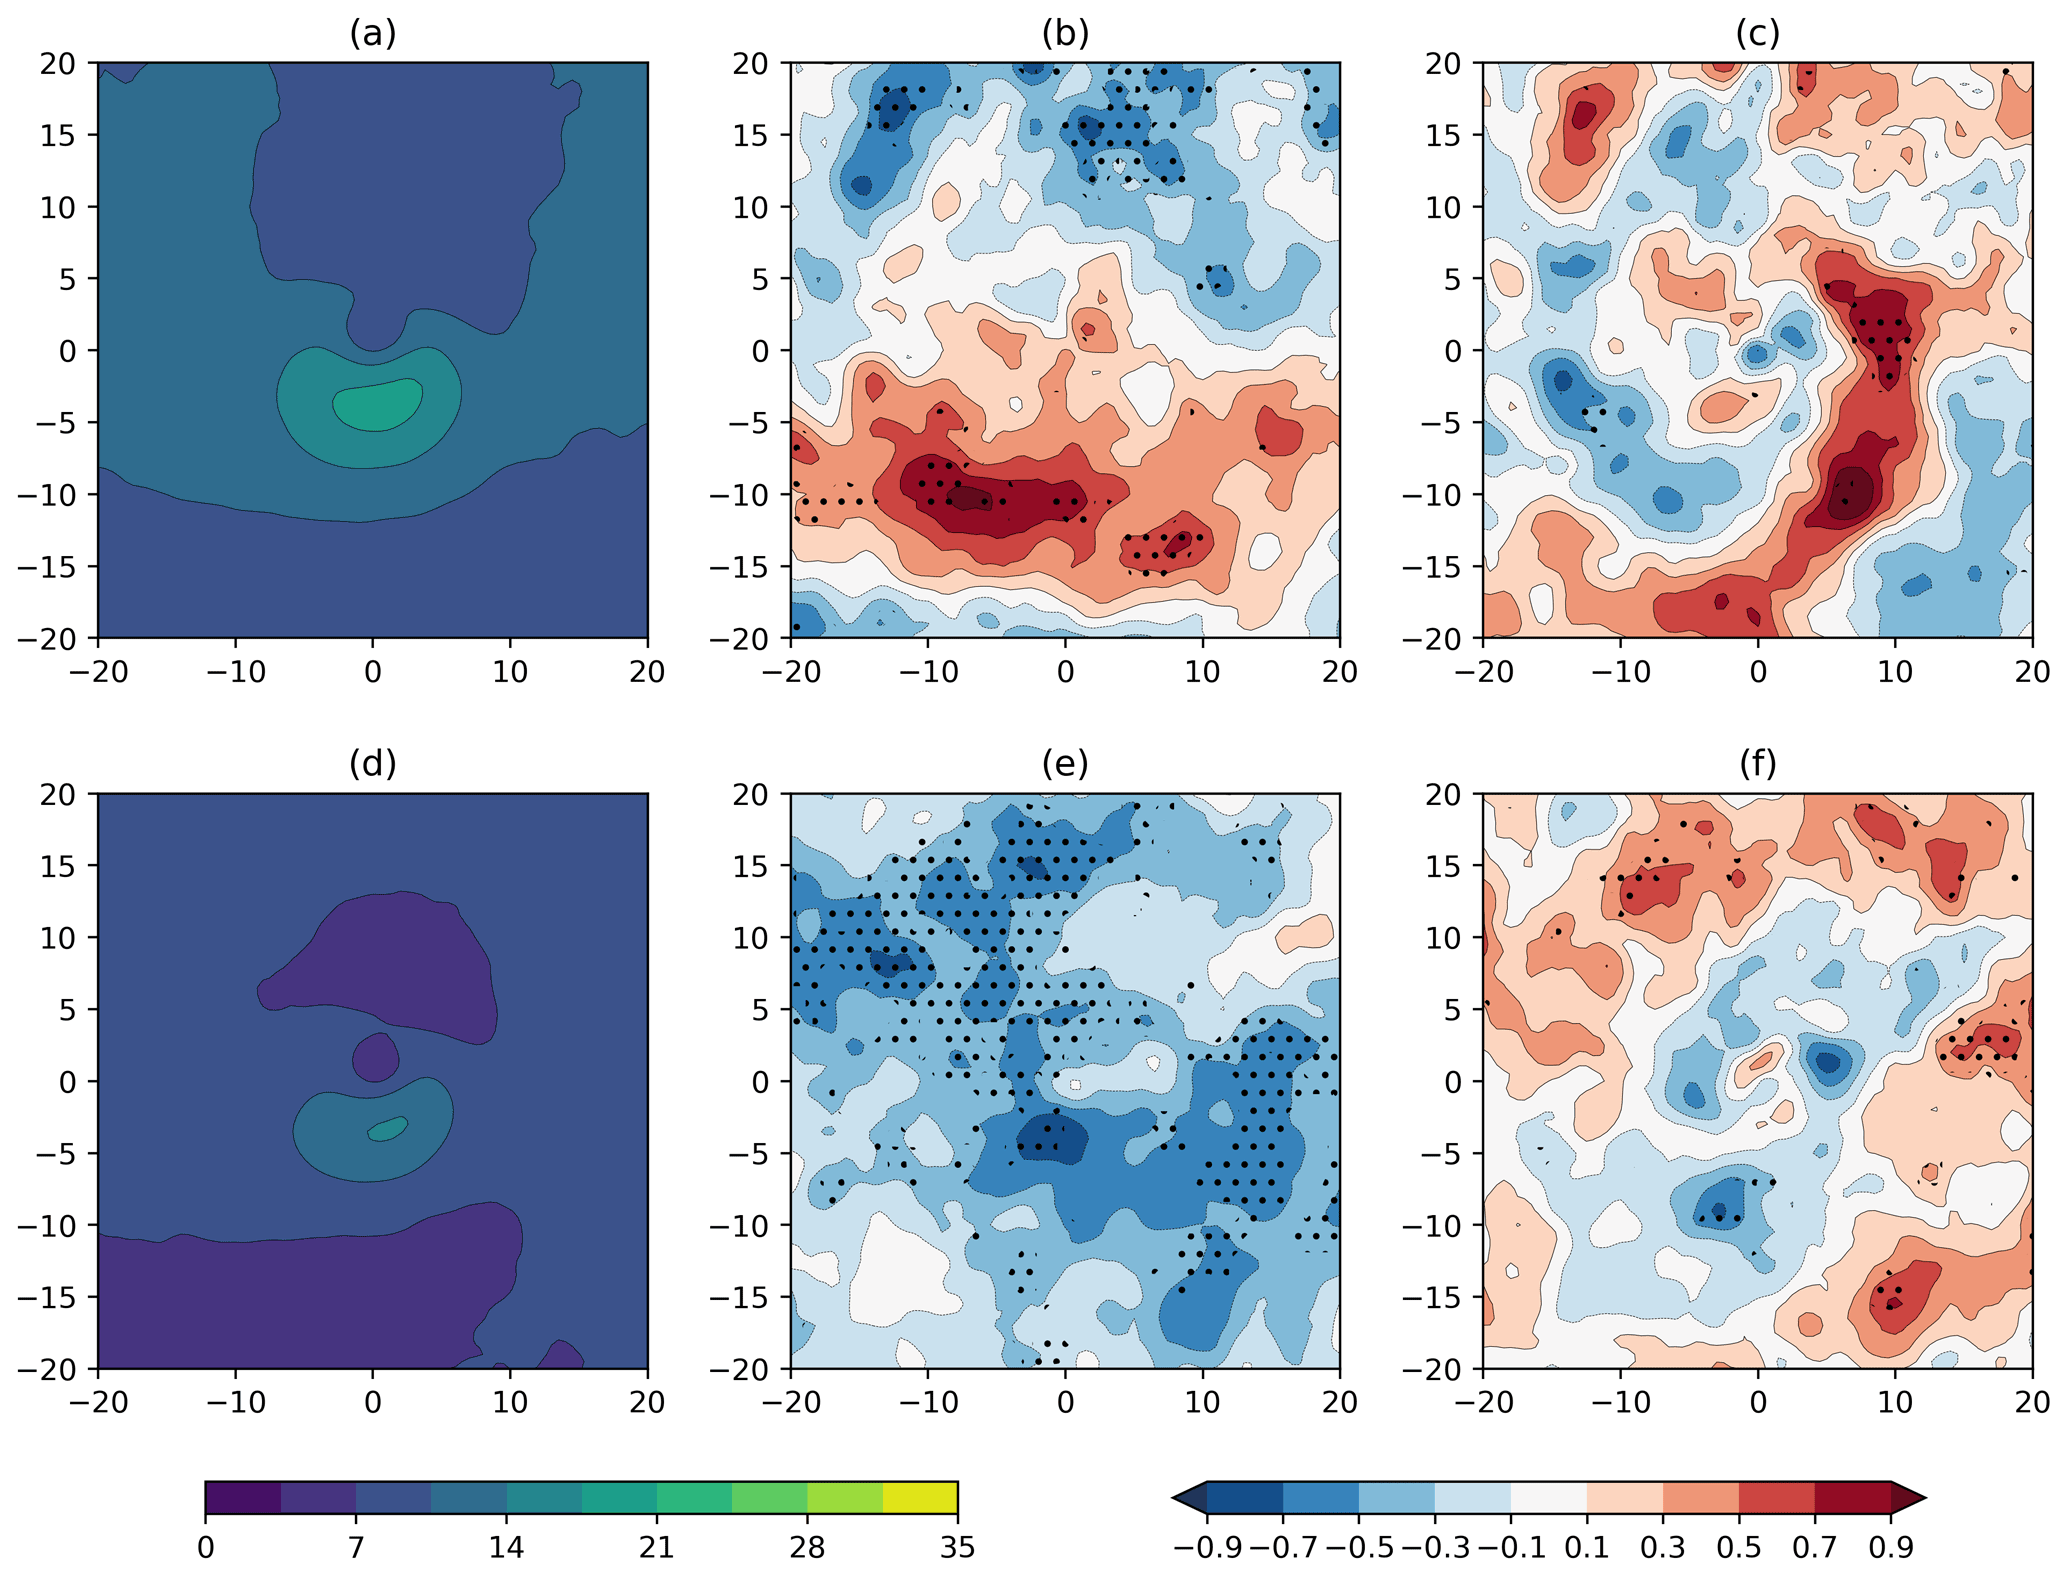
Figure 16Comparison of composite Earth relative wind speed for cyclones over the North Atlantic (30–70∘ N, 280–360∘ E) for (a–c) DJF and (d–f) JJA. (a, d) Composites of the AVG cyclones in the 1979–2014 historical period from CMIP6. (b, e) Change in the AVG cyclones in the SSP5-85 scenario for the 2080–2100 period. (c, f) Difference between the changes in the EXT and AVG cyclones for the 2080–2099 period. Stippling indicates where 80 % of the models agree on the sign of the change. Units are m s−1.
Our results have shown that winter extratropical cyclones are projected to increase in intensity and severity with increased global warming in both the NH and SH. The largest changes are seen in experiments that feature the largest rate of global warming (SSP5-85). However, the most extreme changes, and resultant impacts, can be avoided through limiting the amount of warming experienced. Under SSP2-45 conditions the area of extreme wind speeds in winter cyclones increases by less than half the amount in SSP5-85 or SSP3-70, with only minimal differences relative to the historical distribution.
The pattern of change in objectively identified cyclones in the CMIP6 models is consistent with studies from previous-generation CMIP5 models (Mizuta, 2012; Zappa et al., 2013; Lee, 2015). Changes in the structure of the storm tracks in the NH are also consistent with changes in the eddy-driven jet (Oudar et al., 2020) and the Eulerian measure of storm track (Harvey et al., 2020). In the SH the identified robust poleward shift of the storm track is consistent with previous studies (Yin, 2005; Chang et al., 2012) and analysis of the SH jet and Southern Annular Mode (Goyal et al., 2021; Grose et al., 2020). The poleward shift of tracks in the SH and North Pacific is likely associated with changes in latitude of maximum baroclinicity (Yin, 2005) and also increasing levels of atmospheric water vapour (Tamarin and Kaspi, 2017; Tamarin-Brodsky and Kaspi, 2017). The increased magnitudes of change in both hemispheres relative to CMIP5 (Lee, 2015) are likely a result of the larger temperature changes in CMIP6 models relative to CMIP5 (Tebaldi et al., 2021) as a result of stronger equilibrium climate sensitivity (Zelinka et al., 2020).
We have identified increases in wind speeds in the warm sector of the cyclones in the winter seasons, where the warm conveyor belt is dominant. This is consistent with Sinclair et al. (2020) and Dolores-Tesillos et al. (2021) where changes in cyclone lower tropospheric wind speed were identified in the vicinity of the warm front, although the changes found by Sinclair et al. (2020) are on the forward flank of the cyclone, and the response was nearly twice as large as identified here. Associated with this, we infer increases in the rate of ascent in the warm sector of cyclones, downstream and poleward of the historical maximum (as in Sinclair et al., 2020). Furthermore, there appears to be an increase in the asymmetry of cyclone vertical velocity, which is consistent with O'Gorman et al. (2018) and Tamarin-Brodsky and Hadas (2019). The processes driving the increases (or decreases) in wind speed throughout the troposphere would require further investigation; however, the intensification and ascent rate of extratropical cyclones are intrinsically connected to the WCBs (Binder et al., 2016), which are likely to undergo modification under future climate change with additional atmospheric water vapour (Tamarin-Brodsky and Kaspi, 2017) and diabatic processes (Dolores-Tesillos et al., 2021) and should be an area of future scientific interest.
A large amount of the change in wind speed in the Earth relative framework appears to be due to changes in the propagation speed of cyclones. We find evidence for both increasing and decreasing speeds, which is dependent on the hemisphere and season, with no identifiable change in NH DJF. This lack of change in NH DJF is due to differing signs of change by the different models. This may be due to the difficulty of models in balancing the competing effects of changing upper- and lower-level baroclinicity (O'Gorman, 2010) and the varying rates of shear (Lehmann et al., 2014). The decrease in NH JJA is consistent with Kornhuber and Tamarin-Brodsky (2021) and is likely related to reduced large-scale baroclinicity (Lehmann et al., 2014; Chang, 2017). In the SH the change is likely linked to the increased speed of the mid-latitude jets (Barnes and Polvani, 2013; Bracegirdle et al., 2020b; Goyal et al., 2021), which has been shown to be connected to the increased width of the Hadley cell (Ceppi and Hartmann, 2013) and local increases in baroclinicity (Deng et al., 2022). Further investigation would be required to determine the exact processes driving the changes in cyclone speed and whether this was present throughout the cyclone life cycle.
We have shown how the area of a cyclone above a fixed wind speed threshold is projected to increase in the future, with a median increase in area of up to 25 % noted during SH JJA by the end of the century. This has significant implications for loss modellers as extratropical cyclones are already the main driver of losses in the mid-latitudes (Schwierz et al., 2010). This increase in strong wind area could contribute to the projected increase in European windstorm losses in the future (Pinto et al., 2007; Leckebusch et al., 2007).
4.2 Discussion of metrics
It has been suggested (e.g. Ulbrich et al., 2009; Catto et al., 2019) that the projected changes in cyclone intensity depend on the variable examined, the definition of intensity, and the subset of cyclones examined. Here we have used a number of measures to define intensity: central maximum MSLP and 850 hPa vorticity, numbers of cyclones above a fixed MSLP or 850 hPa threshold, extent of low-level strong winds around the cyclones, and strength and extent of high winds at different levels of the atmosphere. We have shown that each of these measures gives the same conclusions. Extreme cyclones have higher intensities (lower in NH JJA) regardless of the intensity metric examined (consistent with Lambert and Fyfe, 2006; Mizuta, 2012; Colle et al., 2013; Zappa et al., 2013; Chang, 2017; Michaelis et al., 2017; Sinclair et al., 2020). Therefore, for examining cyclone extremes, most metrics will provide similar conclusions, giving robust projections of more impactful storms in the future.
We have also investigated two different subsets of the cyclones: the top 10 % of cyclones in terms of their vorticity (EXT) and the 10 % of cyclones from the middle of the distribution (AVG). For cyclone wind speeds, the AVG cyclones do not see as large of a change in their wind speeds as the EXT cyclones, which is consistent with Michaelis et al. (2017) and Sinclair et al. (2020). There are differences in the magnitudes of change between those studies and our results, which may be a result of chosen geographical region, with Michaelis et al. (2017) focussing just on the North Atlantic, or the model setup, with Sinclair et al. (2020) based on aquaplanet experiments. Differences between EXT and AVG cyclones are commonly associated with the increased strength of diabatic processes in intense cyclones in a moister future climate, which can counteract the reduction in large-scale baroclinicity (Pfahl et al., 2015; Büeler and Pfahl, 2019).
We find changes in MSLP for both AVG and EXT cyclones (particularly in the SH; Fig. 5). This is due to the large influence of the latitude change on AVG cyclones and the climatologically lower pressures at higher latitudes (Bengtsson et al., 2006). MSLP is more influenced by the large-scale background state (Hoskins and Hodges, 2002) and is a feature that models struggle to represent (Priestley and Catto, 2022). It is therefore recommended that overall changes in cyclone intensity are not assessed using MSLP, and instead variables that are independent of the large-scale atmospheric state and directly related to impacts, such as winds or vorticity, are used.
4.3 Limitations and future directions
In addition to the results presented in this study there are several caveats to the work we have presented and consequently areas that could be investigated further. Due to the limited number of models that have made available experiments across the four SSPs we have investigated, we were limited to just nine models. A larger ensemble size would be beneficial in order to understand the drivers of model variability, and also to partition models by resolution, which may be achievable in the future with the continuous release of new CMIP6 model data. In addition, utilizing the HighResMIP ensemble may provide benefits through the improved representation of moist and diabatic processes with higher resolution (Willison et al., 2013). As the CMIP6 models used in this study only have resolution of ∼100 km, it may be that some of the changes driven by diabatic processes are underestimated, and higher-resolution models have been shown to have a larger climate change response (Grist et al., 2021). Furthermore, we have focussed on all identified cyclones that exceed a hemispheric threshold and not investigated any regional changes. Narrowing down our research area regionally would be especially beneficial in the NH where the North Atlantic and North Pacific storm tracks show different responses to increased levels of climate change and may explain the differences seen between our results and those of other studies (e.g. Michaelis et al., 2017; Sinclair et al., 2020).
Moving forward a wider array of physical properties would be very useful to investigate to explore the more detailed aspects of extratropical cyclones. Precipitation and vertical velocity would be interesting variables to explore which have been shown to increase for cyclones in future climates (Kodama et al., 2019; Sinclair et al., 2020) and would allow for a more thorough diagnosis of the changes we have identified. However investigation such as this in CMIP6 models is significantly limited by the insufficient temporal resolution of the available data and limited output of required variables. Finally, despite significant improvements in CMIP6 model capabilities (Priestley et al., 2020; Bracegirdle et al., 2020a; Tian and Dong, 2020; Davini and D'Andrea, 2020), model biases still remain. In CMIP6 models a large number of the storm track biases are linked to the ocean state and its influence on large-scale baroclinicity (Priestley et al., 2022a, b), and a question still remains as to how these historical, mean state errors are propagating through the future simulations. Even though low-bias models have been shown to have similar projections to high-bias models (Zappa et al., 2013), the pre-existing errors still remain. Understanding the coupling between large-scale historical biases and future projections should therefore be investigated in order to be more clearly understood.
ERA5 reanalysis is available from the Copernicus Climate Change Service Climate Data Store (https://doi.org/10.24381/cds.bd0915c6, Hersbach et al., 2018). CMIP6 data are publicly available through the Earth System Grid Federation (Eyring et al., 2016).
The supplement related to this article is available online at: https://doi.org/10.5194/wcd-3-337-2022-supplement.
MDKP and JLC devised, wrote, and edited the study. Analysis and creation of figures was completed by MDKP.
The contact author has declared that neither they nor their co-author has any competing interests.
Publisher’s note: Copernicus Publications remains neutral with regard to jurisdictional claims in published maps and institutional affiliations.
We are grateful to the two anonymous reviewers whose comments helped improve the quality of this paper.
Matthew D. K. Priestley and Jennifer L. Catto are supported by the Natural Environment Research Council (NERC) (grant no. NE/S004645/1).
This paper was edited by Christian M. Grams and reviewed by two anonymous referees.
Barnes, E. A. and Polvani, L.: Response of the Midlatitude Jets, and of Their Variability, to Increased Greenhouse Gases in the CMIP5 Models, J. Climate, 26, 7117–7135, https://doi.org/10.1175/JCLI-D-12-00536.1, 2013. a
Bengtsson, L., Hodges, K. I., and Roeckner, E.: Storm Tracks and Climate Change, J. Climate, 19, 3518–3543, https://doi.org/10.1175/JCLI3815.1, 2006. a, b, c, d, e, f, g, h
Bengtsson, L., Hodges, K. I., and Keenlyside, N.: Will Extratropical Storms Intensify in a Warmer Climate?, J. Climate, 22, 2276–2301, https://doi.org/10.1175/2008JCLI2678.1, 2009. a, b, c, d, e, f
Binder, H., Boettcher, M., Joos, H., and Wernli, H.: The Role of Warm Conveyor Belts for the Intensification of Extratropical Cyclones in Northern Hemisphere Winter, J. Atmos. Sci., 73, 3997–4020, https://doi.org/10.1175/JAS-D-15-0302.1, 2016. a
Bracegirdle, T. J., Holmes, C. R., Hosking, J. S., Marshall, G. J., Osman, M., Patterson, M., and Rackow, T.: Improvements in Circumpolar Southern Hemisphere Extratropical Atmospheric Circulation in CMIP6 Compared to CMIP5, Earth Space Sci., 7, e2019EA001065, https://doi.org/10.1029/2019EA001065, 2020a. a
Bracegirdle, T. J., Krinner, G., Tonelli, M., Haumann, F. A., Naughten, K. A., Rackow, T., Roach, L. A., and Wainer, I.: Twenty first century changes in Antarctic and Southern Ocean surface climate in CMIP6, Atmos. Sci. Lett., 21, e984, https://doi.org/10.1002/asl.984, 2020b. a
Brown, J. R., Lengaigne, M., Lintner, B. R., Widlansky, M. J., van der Wiel, K., Dutheil, C., Linsley, B. K., Matthews, A. J., and Renwick, J.: South Pacific Convergence Zone dynamics, variability and impacts in a changing climate, Nat. Rev. Earth Environ., 1, 530–543, https://doi.org/10.1038/s43017-020-0078-2, 2020. a
Browning, K. A.: The sting at the end of the tail: Damaging winds associated with extratropical cyclones, Q. J. Roy. Meteorol. Soc., 130, 375–399, https://doi.org/10.1256/qj.02.143, 2004. a
Büeler, D. and Pfahl, S.: Potential Vorticity Diagnostics to Quantify Effects of Latent Heating in Extratropical Cyclones. Part II: Application to Idealized Climate Change Simulations, J. Atmos. Sci., 76, 1885–1902, https://doi.org/10.1175/JAS-D-18-0342.1, 2019. a, b
Butler, A. H., Thompson, D. W. J., and Heikes, R.: The Steady-State Atmospheric Circulation Response to Climate Change–like Thermal Forcings in a Simple General Circulation Model, J. Climate, 23, 3474–3496, https://doi.org/10.1175/2010JCLI3228.1, 2010. a
Catto, J. L., Shaffrey, L. C., and Hodges, K. I.: Can Climate Models Capture the Structure of Extratropical Cyclones?, J. Climate, 23, 1621–1635, https://doi.org/10.1175/2009JCLI3318.1, 2010. a, b, c, d, e
Catto, J. L., Shaffrey, L. C., and Hodges, K. I.: Northern Hemisphere Extratropical Cyclones in a Warming Climate in the HiGEM High-Resolution Climate Model, J. Climate, 24, 5336–5352, https://doi.org/10.1175/2011JCLI4181.1, 2011. a
Catto, J. L., Ackerley, D., Booth, J. F., Champion, A. J., Colle, B. A., Pfahl, S., Pinto, J. G., Quinting, J. F., and Seiler, C.: The Future of Midlatitude Cyclones, Curr. Clim. Change Rep., 5, 407–420, https://doi.org/10.1007/s40641-019-00149-4, 2019. a, b, c, d
Ceppi, P. and Hartmann, D. L.: On the Speed of the Eddy-Driven Jet and the Width of the Hadley Cell in the Southern Hemisphere, J. Climate, 26, 3450–3465, https://doi.org/10.1175/JCLI-D-12-00414.1, 2013. a
Champion, A. J., Hodges, K. I., Bengtsson, L. O., Keenlyside, N. S., and Esch, M.: Impact of increasing resolution and a warmer climate on extreme weather from Northern Hemisphere extratropical cyclones, Tellus A, 63, 893–906, https://doi.org/10.1111/j.1600-0870.2011.00538.x, 2011. a, b
Chang, E. K. M.: Projected Significant Increase in the Number of Extreme Extratropical Cyclones in the Southern Hemisphere, J. Climate, 30, 4915–4935, https://doi.org/10.1175/JCLI-D-16-0553.1, 2017. a, b, c, d, e
Chang, E. K.-M.: CMIP5 Projected Change in Northern Hemisphere Winter Cyclones with Associated Extreme Winds, J. Climate, 31, 6527–6542, https://doi.org/10.1175/JCLI-D-17-0899.1, 2018. a
Chang, E. K. M., Guo, Y., and Xia, X.: CMIP5 multimodel ensemble projection of storm track change under global warming, J. Geophys. Res.-Atmos., 117, D23118, https://doi.org/10.1029/2012JD018578, 2012. a, b, c, d, e
Chang, E. K. M., Guo, Y., Xia, X., and Zheng, M.: Storm-Track Activity in IPCC AR4/CMIP3 Model Simulations, J. Climate, 26, 246–260, https://doi.org/10.1175/JCLI-D-11-00707.1, 2013. a, b, c
Christensen, J., Krishna Kumar, K., Aldrian, E., An, S.-I., Cavalcanti, I., de Castro, M., Dong, W., Goswami, P., Hall, A., Kanyanga, J., Kitoh, A., Kossin, J., Lau, N.-C., Renwick, J., Stephenson, D., Xie, S.-P., and Zhou, T.: Climate Phenomena and their Relevance for Future Regional Climate Change, edited by: Stocker, T. F., Qin, D., Plattner, G.-K., Tignor, M., Allen, S. K., Boschung, J., Nauels, A., Xia, Y., Bex, V., and Midgley, P. M., Cambridge University Press, Cambridge, United Kingdom and New York, NY, USA, 1217–1308, https://doi.org/10.1017/CBO9781107415324.028, 2013. a, b, c
Colle, B. A., Zhang, Z., Lombardo, K. A., Chang, E., Liu, P., and Zhang, M.: Historical Evaluation and Future Prediction of Eastern North American and Western Atlantic Extratropical Cyclones in the CMIP5 Models during the Cool Season, J. Climate, 26, 6882–6903, https://doi.org/10.1175/JCLI-D-12-00498.1, 2013. a, b, c, d, e
Coumou, D., Lehmann, J., and Beckmann, J.: The weakening summer circulation in the Northern Hemisphere mid-latitudes, Science, 348, 324–327, https://doi.org/10.1126/science.1261768, 2015. a
Dacre, H. F., Hawcroft, M. K., Stringer, M. A., and Hodges, K. I.: An Extratropical Cyclone Atlas: A Tool for Illustrating Cyclone Structure and Evolution Characteristics, B. Am. Meteorol. Soc., 93, 1497–1502, https://doi.org/10.1175/BAMS-D-11-00164.1, 2012. a, b
Davini, P. and D'Andrea, F.: From CMIP3 to CMIP6: Northern Hemisphere Atmospheric Blocking Simulation in Present and Future Climate, J. Climate, 33, 10021–10038, https://doi.org/10.1175/JCLI-D-19-0862.1, 2020. a
Deng, K., Azorin-Molina, C., Yang, S., Hu, C., Zhang, G., Minola, L., and Chen, D.: Changes of Southern Hemisphere westerlies in the future warming climate, Atmos. Res., 270, 106040, https://doi.org/10.1016/j.atmosres.2022.106040, 2022. a
Dolores-Tesillos, E., Teubler, F., and Pfahl, S.: Future changes in North Atlantic winter cyclones in CESM-LENS. Part I: cyclone intensity, PV anomalies and horizontal wind speed, Weather Clim. Dynam. Discuss. [preprint], https://doi.org/10.5194/wcd-2021-73, in review, 2021. a, b, c, d
Eyring, V., Bony, S., Meehl, G. A., Senior, C. A., Stevens, B., Stouffer, R. J., and Taylor, K. E.: Overview of the Coupled Model Intercomparison Project Phase 6 (CMIP6) experimental design and organization, Geosci. Model Dev., 9, 1937–1958, https://doi.org/10.5194/gmd-9-1937-2016, 2016 (data available at: https://esgf-node.llnl.gov/projects/cmip6/, last access: 25 March 2022). a, b, c, d
Fan, X., Duan, Q., Shen, C., Wu, Y., and Xing, C.: Global surface air temperatures in CMIP6: historical performance and future changes, Environ. Res. Lett., 15, 104056, https://doi.org/10.1088/1748-9326/abb051, 2020. a
Geng, Q. and Sugi, M.: Possible Change of Extratropical Cyclone Activity due to Enhanced Greenhouse Gases and Sulfate Aerosols – Study with a High-Resolution AGCM, J. Climate, 16, 2262–2274, https://doi.org/10.1175/1520-0442(2003)16<2262:PCOECA>2.0.CO;2, 2003. a, b, c, d
Gervais, M., Shaman, J., and Kushnir, Y.: Mechanisms Governing the Development of the North Atlantic Warming Hole in the CESM-LE Future Climate Simulations, J. Climate, 31, 5927–5946, https://doi.org/10.1175/JCLI-D-17-0635.1, 2018. a
Gervais, M., Shaman, J., and Kushnir, Y.: Impacts of the North Atlantic Warming Hole in Future Climate Projections: Mean Atmospheric Circulation and the North Atlantic Jet, J. Climate, 32, 2673–2689, https://doi.org/10.1175/JCLI-D-18-0647.1, 2019. a
Goyal, R., Sen Gupta, A., Jucker, M., and England, M. H.: Historical and Projected Changes in the Southern Hemisphere Surface Westerlies, Geophys. Res. Lett., 48, e2020GL090849, https://doi.org/10.1029/2020GL090849, 2021. a, b
Grieger, J., Leckebusch, G., Donat, M., Schuster, M., and Ulbrich, U.: Southern Hemisphere winter cyclone activity under recent and future climate conditions in multi-model AOGCM simulations, Int. J. Climatol., 34, 3400–3416, https://doi.org/10.1002/joc.3917, 2014. a
Grist, J. P., Josey, S. A., Sinha, B., Catto, J. L., Roberts, M. J., and Coward, A. C.: Future Evolution of an Eddy Rich Ocean Associated with Enhanced East Atlantic Storminess in a Coupled Model Projection, Geophys. Res. Lett., 48, e2021GL092719, https://doi.org/10.1029/2021GL092719, 2021. a
Grose, M. R., Narsey, S., Delage, F. P., Dowdy, A. J., Bador, M., Boschat, G., Chung, C., Kajtar, J. B., Rauniyar, S., Freund, M. B., Lyu, K., Rashid, H., Zhang, X., Wales, S., Trenham, C., Holbrook, N. J., Cowan, T., Alexander, L., Arblaster, J. M., and Power, S.: Insights From CMIP6 for Australia's Future Climate, Earth's Future, 8, e2019EF001469, https://doi.org/10.1029/2019EF001469, 2020. a
Harvey, B. J., Shaffrey, L. C., and Woollings, T. J.: Deconstructing the climate change response of the Northern Hemisphere wintertime storm tracks, Clim. Dynam., 45, 2847–2860, https://doi.org/10.1007/s00382-015-2510-8, 2015. a
Harvey, B. J., Cook, P., Shaffrey, L. C., and Schiemann, R.: The Response of the Northern Hemisphere Storm Tracks and Jet Streams to Climate Change in the CMIP3, CMIP5, and CMIP6 Climate Models, J. Geophys. Res.-Atmos., 125, e2020JD032701, https://doi.org/10.1029/2020JD032701, 2020. a, b, c, d, e, f, g, h
Hawcroft, M. K., Shaffrey, L. C., Hodges, K. I., and Dacre, H. F.: How much Northern Hemisphere precipitation is associated with extratropical cyclones?, Geophys. Res. Lett., 39, L24809, https://doi.org/10.1029/2012GL053866, 2012. a
Hersbach, H., Bell, B., Berrisford, P., Biavati, G., Horányi, A., Muñoz Sabater, J., Nicolas, J., Peubey, C., Radu, R., Rozum, I., Schepers, D., Simmons, A., Soci, C., Dee, D., and Thépaut, J-N.: ERA5 hourly data on pressure levels from 1979 to present, Copernicus Climate Change Service (C3S) Climate Data Store (CDS) [data set], https://doi.org/10.24381/cds.bd0915c6, 2018. a
Hodges, K. I.: A General Method for Tracking Analysis and Its Application to Meteorological Data, Mon. Weather Rev., 122, 2573–2586, https://doi.org/10.1175/1520-0493(1994)122<2573:AGMFTA>2.0.CO;2, 1994. a, b
Hodges, K. I.: Feature Tracking on the Unit Sphere, Mon. Weather Rev., 123, 3458–3465, https://doi.org/10.1175/1520-0493(1995)123<3458:FTOTUS>2.0.CO;2, 1995. a, b
Hodges, K. I.: Adaptive Constraints for Feature Tracking, Mon. Weather Rev., 127, 1362–1373, https://doi.org/10.1175/1520-0493(1999)127<1362:ACFFT>2.0.CO;2, 1999. a, b
Hodges, K. I.: TRACK, GitLab [code], https://gitlab.act.reading.ac.uk/track/track, last access: 25 March 2022. a
Hoskins, B. J. and Hodges, K. I.: New Perspectives on the Northern Hemisphere Winter Storm Tracks, J. Atmos. Sci., 59, 1041–1061, https://doi.org/10.1175/1520-0469(2002)059<1041:NPOTNH>2.0.CO;2, 2002. a
Kodama, C., Stevens, B., Mauritsen, T., Seiki, T., and Satoh, M.: A New Perspective for Future Precipitation Change from Intense Extratropical Cyclones, Geophys. Res. Lett., 46, 12435–12444, https://doi.org/10.1029/2019GL084001, 2019. a, b
König, W., Sausen, R., and Sielmann, F.: Objective Identification of Cyclones in GCM Simulations, J. Climate, 6, 2217–2231, https://doi.org/10.1175/1520-0442(1993)006<2217:OIOCIG>2.0.CO;2, 1993. a
Kornhuber, K. and Tamarin-Brodsky, T.: Future Changes in Northern Hemisphere Summer Weather Persistence Linked to Projected Arctic Warming, Geophys. Res. Lett., 48, e2020GL091603, https://doi.org/10.1029/2020GL091603, 2021. a
Lambert, S. J. and Fyfe, J. C.: Changes in winter cyclone frequencies and strengths simulated in enhanced greenhouse warming experiments: results from the models participating in the IPCC diagnostic exercise, Clim. Dynam., 26, 713–728, https://doi.org/10.1007/s00382-006-0110-3, 2006. a
Leckebusch, G. C., Ulbrich, U., Fröhlich, L., and Pinto, J. G.: Property loss potentials for European midlatitude storms in a changing climate, Geophys. Res. Lett., 34, L24809, https://doi.org/10.1029/2006GL027663, 2007. a
Lee, R. W.: Storm track biases and changes in a warming climate from an extratropical cyclone perspective using CMIP5, PhD thesis, University of Reading, https://centaur.reading.ac.uk/79416/ (last access: 25 March 2022), 2015. a, b, c
Lehmann, J., Coumou, D., Frieler, K., Eliseev, A. V., and Levermann, A.: Future changes in extratropical storm tracks and baroclinicity under climate change, Environ. Res. Lett., 9, 084002, https://doi.org/10.1088/1748-9326/9/8/084002, 2014. a, b, c, d
Lim, E.-P. and Simmonds, I.: Effect of tropospheric temperature change on the zonal mean circulation and SH winter extratropical cyclones, Clim. Dynam., 33, 19–32, https://doi.org/10.1007/s00382-008-0444-0, 2009. a
Michaelis, A. C., Willison, J., Lackmann, G. M., and Robinson, W. A.: Changes in Winter North Atlantic Extratropical Cyclones in High-Resolution Regional Pseudo-Global Warming Simulations, J. Climate, 30, 6905–6925, https://doi.org/10.1175/JCLI-D-16-0697.1, 2017. a, b, c, d, e, f, g, h, i, j
Mizuta, R.: Intensification of extratropical cyclones associated with the polar jet change in the CMIP5 global warming projections, Geophys. Res. Lett., 39, L19707, https://doi.org/10.1029/2012GL053032, 2012. a, b
Mizuta, R., Matsueda, M., Endo, H., and Yukimoto, S.: Future Change in Extratropical Cyclones Associated with Change in the Upper Troposphere, J. Climate, 24, 6456–6470, https://doi.org/10.1175/2011JCLI3969.1, 2011. a, b, c, d, e
O'Gorman, P. A.: Understanding the varied response of the extratropical storm tracks to climate change, P. Natl. Acad. Sci. USA, 107, 19176–19180, https://doi.org/10.1073/pnas.1011547107, 2010. a, b
O'Gorman, P. A., Merlis, T. M., and Singh, M. S.: Increase in the skewness of extratropical vertical velocities with climate warming: fully nonlinear simulations versus moist baroclinic instability, Q. J. Roy. Meteorol. Soc., 144, 208–217, https://doi.org/10.1002/qj.3195, 2018. a
O’Neill, B. C., Kriegler, E., Riahi, K., Ebi, K. L., Hallegatte, S., Carter, T. R., Mathur, R., and van Vuuren, D. P.: A new scenario framework for climate change research: the concept of shared socioeconomic pathways, Clim. Change, 122, 387–400, https://doi.org/10.1007/s10584-013-0905-2, 2014. a
O'Neill, B. C., Tebaldi, C., van Vuuren, D. P., Eyring, V., Friedlingstein, P., Hurtt, G., Knutti, R., Kriegler, E., Lamarque, J.-F., Lowe, J., Meehl, G. A., Moss, R., Riahi, K., and Sanderson, B. M.: The Scenario Model Intercomparison Project (ScenarioMIP) for CMIP6, Geosci. Model Dev., 9, 3461–3482, https://doi.org/10.5194/gmd-9-3461-2016, 2016. a, b, c, d, e
Oudar, T., Cattiaux, J., and Douville, H.: Drivers of the Northern Extratropical Eddy-Driven Jet Change in CMIP5 and CMIP6 Models, Geophys. Res. Lett., 47, e2019GL086695, https://doi.org/10.1029/2019GL086695, 2020. a, b, c
Pfahl, S., O'Gorman, P. A., and Singh, M. S.: Extratropical Cyclones in Idealized Simulations of Changed Climates, J. Climate, 28, 9373–9392, https://doi.org/10.1175/JCLI-D-14-00816.1, 2015. a, b, c, d
Pinto, J. G., Fröhlich, E. L., Leckebusch, G. C., and Ulbrich, U.: Changing European storm loss potentials under modified climate conditions according to ensemble simulations of the ECHAM5/MPI-OM1 GCM, Nat. Hazards Earth Syst. Sci., 7, 165–175, https://doi.org/10.5194/nhess-7-165-2007, 2007. a
Priestley, M. D. K. and Catto, J. L.: Improved Representation of Extratropical Cyclone Structure in HighResMIP Models, Geophys. Res. Lett., 49, e2021GL096708, https://doi.org/10.1029/2021GL096708, 2022. a, b, c, d, e, f, g, h, i, j
Priestley, M. D. K., Ackerley, D., Catto, J. L., Hodges, K. I., McDonald, R. E., and Lee, R. W.: An Overview of the Extratropical Storm Tracks in CMIP6 Historical Simulations, J. Climate, 33, 6315–6343, https://doi.org/10.1175/JCLI-D-19-0928.1, 2020. a, b
Priestley, M. D. K., Ackerley, D., Catto, J. L., and Hodges, K. I.: Drivers of biases in the CMIP6 extratropical storm tracks. Part 1: Northern Hemisphere, J. Climate, in review, 2022a. a, b, c
Priestley, M. D. K., Ackerley, D., Catto, J. L., and Hodges, K. I.: Drivers of biases in the CMIP6 extratropical storm tracks. Part 2: Southern Hemisphere, J. Climate, in review, 2022b. a
Schwierz, C., Köllner-Heck, P., Zenklusen Mutter, E., Bresch, D. N., Vidale, P.-L., Wild, M., and Schär, C.: Modelling European winter wind storm losses in current and future climate, Clim. Change, 101, 485–514, https://doi.org/10.1007/s10584-009-9712-1, 2010. a
Shaw, T. A.: Mechanisms of Future Predicted Changes in the Zonal Mean Mid-Latitude Circulation, Curr. Clim. Change Rep., 5, 345–357, https://doi.org/10.1007/s40641-019-00145-8, 2019. a, b
Shaw, T. A., Baldwin, M., Barnes, E. A., Caballero, R., Garfinkel, C. I., Hwang, Y.-T., Li, C., O'Gorman, P. A., Rivière, G., Simpson, I. R., and Voigt, A.: Storm track processes and the opposing influences of climate change, Nat. Geosci., 9, 656–664, https://doi.org/10.1038/ngeo2783, 2016. a
Sinclair, V. A., Rantanen, M., Haapanala, P., Räisänen, J., and Järvinen, H.: The characteristics and structure of extra-tropical cyclones in a warmer climate, Weather Clim. Dynam., 1, 1–25, https://doi.org/10.5194/wcd-1-1-2020, 2020. a, b, c, d, e, f, g, h, i, j, k, l, m, n, o, p
Tamarin, T. and Kaspi, Y.: Mechanisms Controlling the Downstream Poleward Deflection of Midlatitude Storm Tracks, J. Atmos. Sci., 74, 553–572, https://doi.org/10.1175/JAS-D-16-0122.1, 2017. a
Tamarin-Brodsky, T. and Hadas, O.: The Asymmetry of Vertical Velocity in Current and Future Climate, Geophys. Res. Lett., 46, 374–382, https://doi.org/10.1029/2018GL080363, 2019. a
Tamarin-Brodsky, T. and Kaspi, Y.: Enhanced poleward propagation of storms under climate change, Nat. Geosci., 10, 908–913, https://doi.org/10.1038/s41561-017-0001-8, 2017. a, b
Taylor, K. E., Juckes, M., Balaji, V., Cinquini, L., Denvil, S., Durack, P. J., Elkington, M., Guilyardi, E., Kharin, S., Lautenschlager, M., Lawrence, B., Nadeau, D., and Stockhause, M.: CMIP6 Global Attributes, DRS, Filenames, Directory Structure and, CV's, Program for Climate Model Diagnosis and Intercomparison, Tech. Rep. v6.2.6, http://goo.gl/v1drZl (last access: 25 March 2022), 2017. a
Tebaldi, C., Debeire, K., Eyring, V., Fischer, E., Fyfe, J., Friedlingstein, P., Knutti, R., Lowe, J., O'Neill, B., Sanderson, B., van Vuuren, D., Riahi, K., Meinshausen, M., Nicholls, Z., Tokarska, K. B., Hurtt, G., Kriegler, E., Lamarque, J.-F., Meehl, G., Moss, R., Bauer, S. E., Boucher, O., Brovkin, V., Byun, Y.-H., Dix, M., Gualdi, S., Guo, H., John, J. G., Kharin, S., Kim, Y., Koshiro, T., Ma, L., Olivié, D., Panickal, S., Qiao, F., Rong, X., Rosenbloom, N., Schupfner, M., Séférian, R., Sellar, A., Semmler, T., Shi, X., Song, Z., Steger, C., Stouffer, R., Swart, N., Tachiiri, K., Tang, Q., Tatebe, H., Voldoire, A., Volodin, E., Wyser, K., Xin, X., Yang, S., Yu, Y., and Ziehn, T.: Climate model projections from the Scenario Model Intercomparison Project (ScenarioMIP) of CMIP6, Earth Syst. Dynam., 12, 253–293, https://doi.org/10.5194/esd-12-253-2021, 2021. a
Tian, B. and Dong, X.: The Double-ITCZ Bias in CMIP3, CMIP5, and CMIP6 Models Based on Annual Mean Precipitation, Geophys. Res. Lett., 47, e2020GL087232, https://doi.org/10.1029/2020GL087232, 2020. a
Ulbrich, U., Fink, A. H., Klawa, M., and Pinto, J. G.: Three extreme storms over Europe in December 1999, Weather, 56, 70–80, https://doi.org/10.1002/j.1477-8696.2001.tb06540.x, 2001. a
Ulbrich, U., Leckebusch, G. C., and Pinto, J. G.: Extra-tropical cyclones in the present and future climate: a review, Theor. Appl. Climatol., 96, 117–131, https://doi.org/10.1007/s00704-008-0083-8, 2009. a, b, c
Willison, J., Robinson, W. A., and Lackmann, G. M.: The Importance of Resolving Mesoscale Latent Heating in the North Atlantic Storm Track, J. Atmos. Sci., 70, 2234–2250, https://doi.org/10.1175/JAS-D-12-0226.1, 2013. a
Yin, J. H.: A consistent poleward shift of the storm tracks in simulations of 21st century climate, Geophys. Res. Lett., 32, L18701, https://doi.org/10.1029/2005GL023684, 2005. a, b, c, d
Zappa, G., Shaffrey, L. C., Hodges, K. I., Sansom, P. G., and Stephenson, D. B.: A Multimodel Assessment of Future Projections of North Atlantic and European Extratropical Cyclones in the CMIP5 Climate Models, J. Climate, 26, 5846–5862, https://doi.org/10.1175/JCLI-D-12-00573.1, 2013. a, b, c, d, e, f, g, h, i, j, k, l, m, n, o
Zappa, G., Shaffrey, L., and Hodges, K.: Can Polar Lows be Objectively Identified and Tracked in the ECMWF Operational Analysis and the ERA-Interim Reanalysis?, Mon. Weather Rev., 142, 2596–2608, https://doi.org/10.1175/MWR-D-14-00064.1, 2014. a
Zappa, G., Hawcroft, M. K., Shaffrey, L., Black, E., and Brayshaw, D. J.: Extratropical cyclones and the projected decline of winter Mediterranean precipitation in the CMIP5 models, Clim. Dynam., 45, 1727–1738, https://doi.org/10.1007/s00382-014-2426-8, 2015. a, b
Zelinka, M. D., Myers, T. A., McCoy, D. T., Po-Chedley, S., Caldwell, P. M., Ceppi, P., Klein, S. A., and Taylor, K. E.: Causes of Higher Climate Sensitivity in CMIP6 Models, Geophys. Res. Lett., 47, e2019GL085 782, https://doi.org/10.1029/2019GL085782, 2020. a, b