the Creative Commons Attribution 4.0 License.
the Creative Commons Attribution 4.0 License.
 | 31 Mar 2022
Differentiating lightning in winter and summer with characteristics of the wind field and mass field
Deborah Morgenstern
Isabell Stucke
Thorsten Simon
Georg J. Mayr
Achim Zeileis
Lightning in winter (December–January–February, DJF) is rare compared to lightning in summer (June–July–August, JJA) in central Europe north of the Alps. The conventional explanation attributes the scarcity of lightning in winter to seasonally low values of variables that create favorable conditions in summer. Here we systematically examine whether different meteorological processes are at play in winter. We use cluster analysis and principal component analysis and find physically meaningful groups in ERA5 atmospheric reanalysis data and lightning data for northern Germany. Two thunderstorm types emerged: wind-field thunderstorms and CAPE (convective available potential energy) thunderstorms. Wind-field thunderstorms are characterized by increased wind speeds, high cloud shear, large dissipation of kinetic energy in the boundary layer, and moderate temperatures. Clouds are close to the ground, and a relatively large fraction of the clouds are warmer than −10 ∘C. CAPE thunderstorms are characterized by increased convective available potential energy (CAPE), the presence of convective inhibition (CIN), high temperatures, and accompanying large amounts of water vapor. Large amounts of cloud-physics variables related to charge separation such as ice particles or cloud base height further differentiate both wind-field thunderstorms and CAPE thunderstorms. Lightning in winter originates in wind-field thunderstorms, whereas lightning in summer originates mostly in CAPE thunderstorms and only a small fraction in wind-field thunderstorms. Consequently, typical weather situations of wind-field thunderstorms in the study area in northern Germany are strong westerlies with embedded cyclones. For CAPE thunderstorms, the area is typically on the anticyclonic side of a southwesterly jet.
- Article
(3992 KB) - Full-text XML
- BibTeX
- EndNote


Mid-latitude thunderstorms are much rarer in winter than in summer and produce less than 3 % of the total lightning activity in Europe (Wapler, 2013; Poelman et al., 2016). Yet the transported electrical charges are often higher in winter, and thus the damage potential is also higher. The conventional explanation for the paucity of winter lightning is the paucity of favorable conditions for strong convection, which lead to thunderstorms in summer. The required large values of convective available potential energy (CAPE), copious amounts of near-surface water vapor, and the presence of a vertical instability (Doswell, 1987) are normally absent in winter.
The electrical characteristics of lightning in winter differ from summer, e.g., in flash duration, direction, and sign of charge transfer; strength of the electric current; and the lightning electric field waveform (e.g., Brook et al., 1982; Goto and Narita, 1995; Rakov and Uman, 2003; Rakov, 2003; Diendorfer et al., 2009; Ishii and Saito, 2009; Wang and Takagi, 2012; Yoshida et al., 2018; Wu et al., 2021). Larger transported charges and more frequent initiation of lightning from tall (human-made) structures in winter elevate the damage potential. This has become a major concern as a consequence of the proliferation of the installation of tall wind turbines in the push towards renewable energy sources. For example, Matsui et al. (2020) show that wind turbine lightning accidents in Japan in winter are 47 times more frequent and also more severe than in summer.
The difference between the seasons in electrical characteristics warrants a challenge to conventional wisdom for the paucity of winter thunderstorms and motivates an investigation into whether it is not meteorological settings different from summertime ones that lead to these differences. One therefore will need to look first at the processes that create lightning. While no unified theory exists that explains the buildup of the charge separation that lightning eventually neutralizes, the non-inductive mechanism is the most widely accepted one (Saunders, 2008; Williams, 2018). It states that charge is transferred during the collision of different cloud particles often present in the vicinity of the −10 ∘C isotherm. The differently charged particles get separated based on their size through differential terminal velocities (Cotton et al., 2011) and form various charge regions within the cloud. Lightning is initiated in the strong electric field between two charge regions (e.g., Salvador et al., 2021). In summertime, the release of CAPE leads to strong updrafts that are needed to produce graupel – relatively large and heavy hydrometeors – and to move ice crystals far aloft which have acquired opposite polarity through their collision with graupel (Williams, 2018). In wintertime, it is rather the collision between snowflakes and ice crystals and their subsequent separation along a slanted path that is thought to be responsible for the charge separation (Williams, 2018). Differential terminal velocities with strong vertical shear of the horizontal wind cause the particle paths to become slanted and separation distances to be large despite relatively weak vertical motions and charging rates. Lightning in winter occurs with clouds that are shallow but wide; a charge region that is close to the ground; and lightning discharges that propagate long distances within the cloud, resulting in large charge transfers (Yoshida et al., 2018).
The goal of this paper is to take a step back from the obvious seasonality of lightning frequency (Vogel et al., 2016; Matsui et al., 2020) and apply a data-driven approach to elucidate whether the occurrence of lightning can be tied to different dominant meteorological processes. It is important to remember that lightning is not necessarily synonymous to “strong convection”, since processes other than strong vertical motions might lead to charge separation and the electrification of clouds. If thunderstorm types are differentiated by processes instead of seasons, more insights can be gained, and a contradiction arising from a seasonal classification can be resolved, for example, that of the annual lightning maximum in fall in the northern Mediterranean compared to central Europe, where lightning peaks in summer (Taszarek et al., 2019). To clearly make the distinction between processes and a mere seasonality of favorable thunderstorm conditions, we focus on winter and summer seasons only at a fairly small and flat study region to avoid having topography as an additional forcing mechanism and to have homogeneous lightning conditions with a uniform annual lightning cycle over the entire domain. Results for the transition seasons are given at https://doi.org/10.5281/zenodo.5851700 (Morgenstern et al., 2022).
Our data-driven approach uses many atmospheric variables of possible relevance for thunderstorms associated with the wind field, mass (temperature) field, moisture field, surface exchange, and cloud (micro-)physics from a meteorological reanalysis (ERA5) and lightning observations (both described in Sect. 2). The statistical methods establishing links between meteorological data and lightning are described in Sect. 3. Section 4 presents the results; Sect. 5 discusses, and Sect. 6 summarizes the findings.
The study area was chosen to be in the mid-latitudes, to be covered by a lightning location system with high detection efficiency, and to be topographically fairly uniform. A region in northern Germany shown in Fig. 1 fulfills these criteria. It includes some small hills, but the elevation is mostly a few decameters above mean sea level.
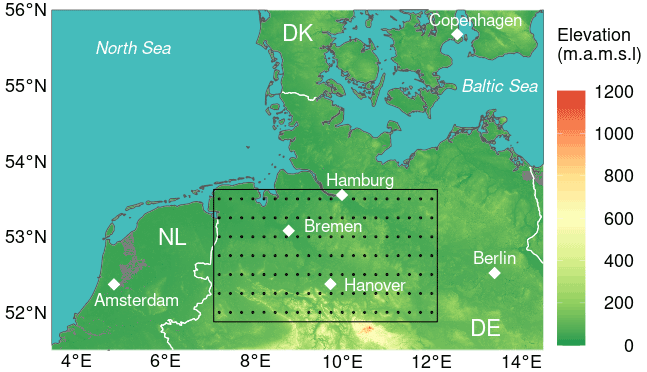
Figure 1Study region in northern Germany (black rectangle). Coordinates: 52.00∘ N, 7.25∘ E (southwestern corner) and 53.50∘ N, 12.00∘ E (northeastern corner). Area: 53 295 km2. Dots show the centers of the ERA5 0.25∘ latitude–longitude grid. Elevation is mostly below 100 m a.m.s.l. Data: TanDEM-X (Rizzoli et al., 2017; Wessel et al., 2018). DE: Germany, DK: Denmark, NL: the Netherlands.
The study period is 2010–2019, a period for which lightning detection efficiency in the study region is mostly unaffected by changes to the hardware and software of several lightning locations systems (LLS) collaborating as EUCLID (European Cooperation for Lightning Detection). We use only cloud-to-ground lightning flashes, since these are responsible for most damages. An additional amplitude filter is applied to exclude flashes with weak peak currents between −5 and 15 kA, resulting in a detection efficiency of more than 96 % (Schulz et al., 2016; Poelman et al., 2016). From 2010–2019 EUCLID recorded 203 124 such flashes in the study region in summer (June–July–August, JJA) but only 2830 in winter (December–January–February, DJF; 1.4 % of the flashes in summer).
Consistent atmospheric data come from ERA5, the fifth-generation global reanalysis of the European Centre for Medium-Range Weather Forecasts (ECMWF; Hersbach et al., 2020). We use assimilated data at the surface level and data on the lowest 74 (of 137) vertical levels (covering the troposphere) and many additional variables derived from these data (see Sect. 3). Horizontally, the data are available on a 0.25∘ latitude–longitude grid and temporally every hour, yielding a “cell-hour” as the smallest space–time unit. Only 0.883 % of those cell-hours in JJA have at least one flash (27 305), and this fraction is reduced to 0.052 % in DJF (17 times less, 1576 cell-hours).
To clearly isolate the effects of seasonality, only the two extreme seasons of winter and summer are chosen, and a methodological approach is selected that can properly handle the vastly different lightning frequencies in these two seasons. The same methods have been applied to the transitional seasons, for which results are given in Morgenstern et al. (2022).
To understand the atmospheric conditions under which lightning occurs (or does not), we process the available EUCLID lightning observations and ERA5 atmospheric variables in the following way. First, equally sized samples from four scenarios of lightning observations are formed: lightning in winter, no lightning in winter, lightning in summer, and no lightning in summer, each following the diurnal cycle of lightning in the respective season (Sect. 3.1). To capture the atmospheric conditions at the time and place of these EUCLID observations, we select and derive 35 ERA5 variables at the respective grid cells (Sect. 3.2). Using only these 35 ERA5 variables, a k-means cluster analysis with k=5 clusters is carried out to determine groups of “typical” atmospheric conditions. To facilitate the interpretation of the 35 variables in the five clusters, the variables are visualized by the first two components of a principal component analysis (Sect. 3.3). Matching the membership for the five atmospheric condition clusters with the corresponding four lightning scenarios reveals how the atmospheric conditions vary between winter and summer with and without lightning. Finally, clusterwise weather maps are produced to get an overview of the governing weather patterns in each cluster and hence a good description of the differences between lightning in winter and in summer.
3.1 Composition and stratification of data
The EUCLID observations are aggregated to the spatiotemporal grid of ERA5. A cell-hour is considered a lightning cell if at least one flash occurred within the cell in the hour after the ERA5 valid time. Otherwise the cell-hour is considered non-lightning.
For the best results of the clustering and principal component analysis, each of the four lightning scenarios considered should be represented equally in the data. Therefore, we use all cell-hours from the least frequent scenario (lightning in winter) along with samples of the same size from the other three scenarios. This sampling is done conditional on the diurnal cycle for lightning in the respective season, known as “stratified sampling” in statistical literature. All sampling is performed without replacement and on the basis of cell-hours.
Since the least frequent scenario (lightning in winter) consists of 1576 cell-hours, the whole data set with four scenarios contains 6304 cell-hours. Finally, to ensure that the results obtained are not driven by spurious artifacts from the sampling, we have considered 50 replications of the sampling procedure. As all of these lead to qualitatively identical results, we only report the results from one representative set of samples. Each sample is drawn from the whole 10 years of data so that single anomalous seasons do not have a large influence. The similarity of the 50 samples gives further confidence in the robustness of our results. The representative data set is provided in Morgenstern et al. (2022).
3.2 Preprocessing and selection of ERA5 variables
To enhance the set of ERA5 single-level variables, we add information from the vertical profiles available in the model level data by deriving additional single-level variables from them. These derived variables aim at portraying physical lightning processes and covering isotherm heights, cloud size, wind shear within and below the cloud, and maximum vertical velocity. Further, we compute sums of cloud particles between specific isotherms, for instance, cloud ice water content between the −20 and −40 ∘C isotherms. Table 1 presents all variables used in this study; the derived variables are marked by an asterisk. An extended version of this table is provided in Morgenstern et al. (2022).
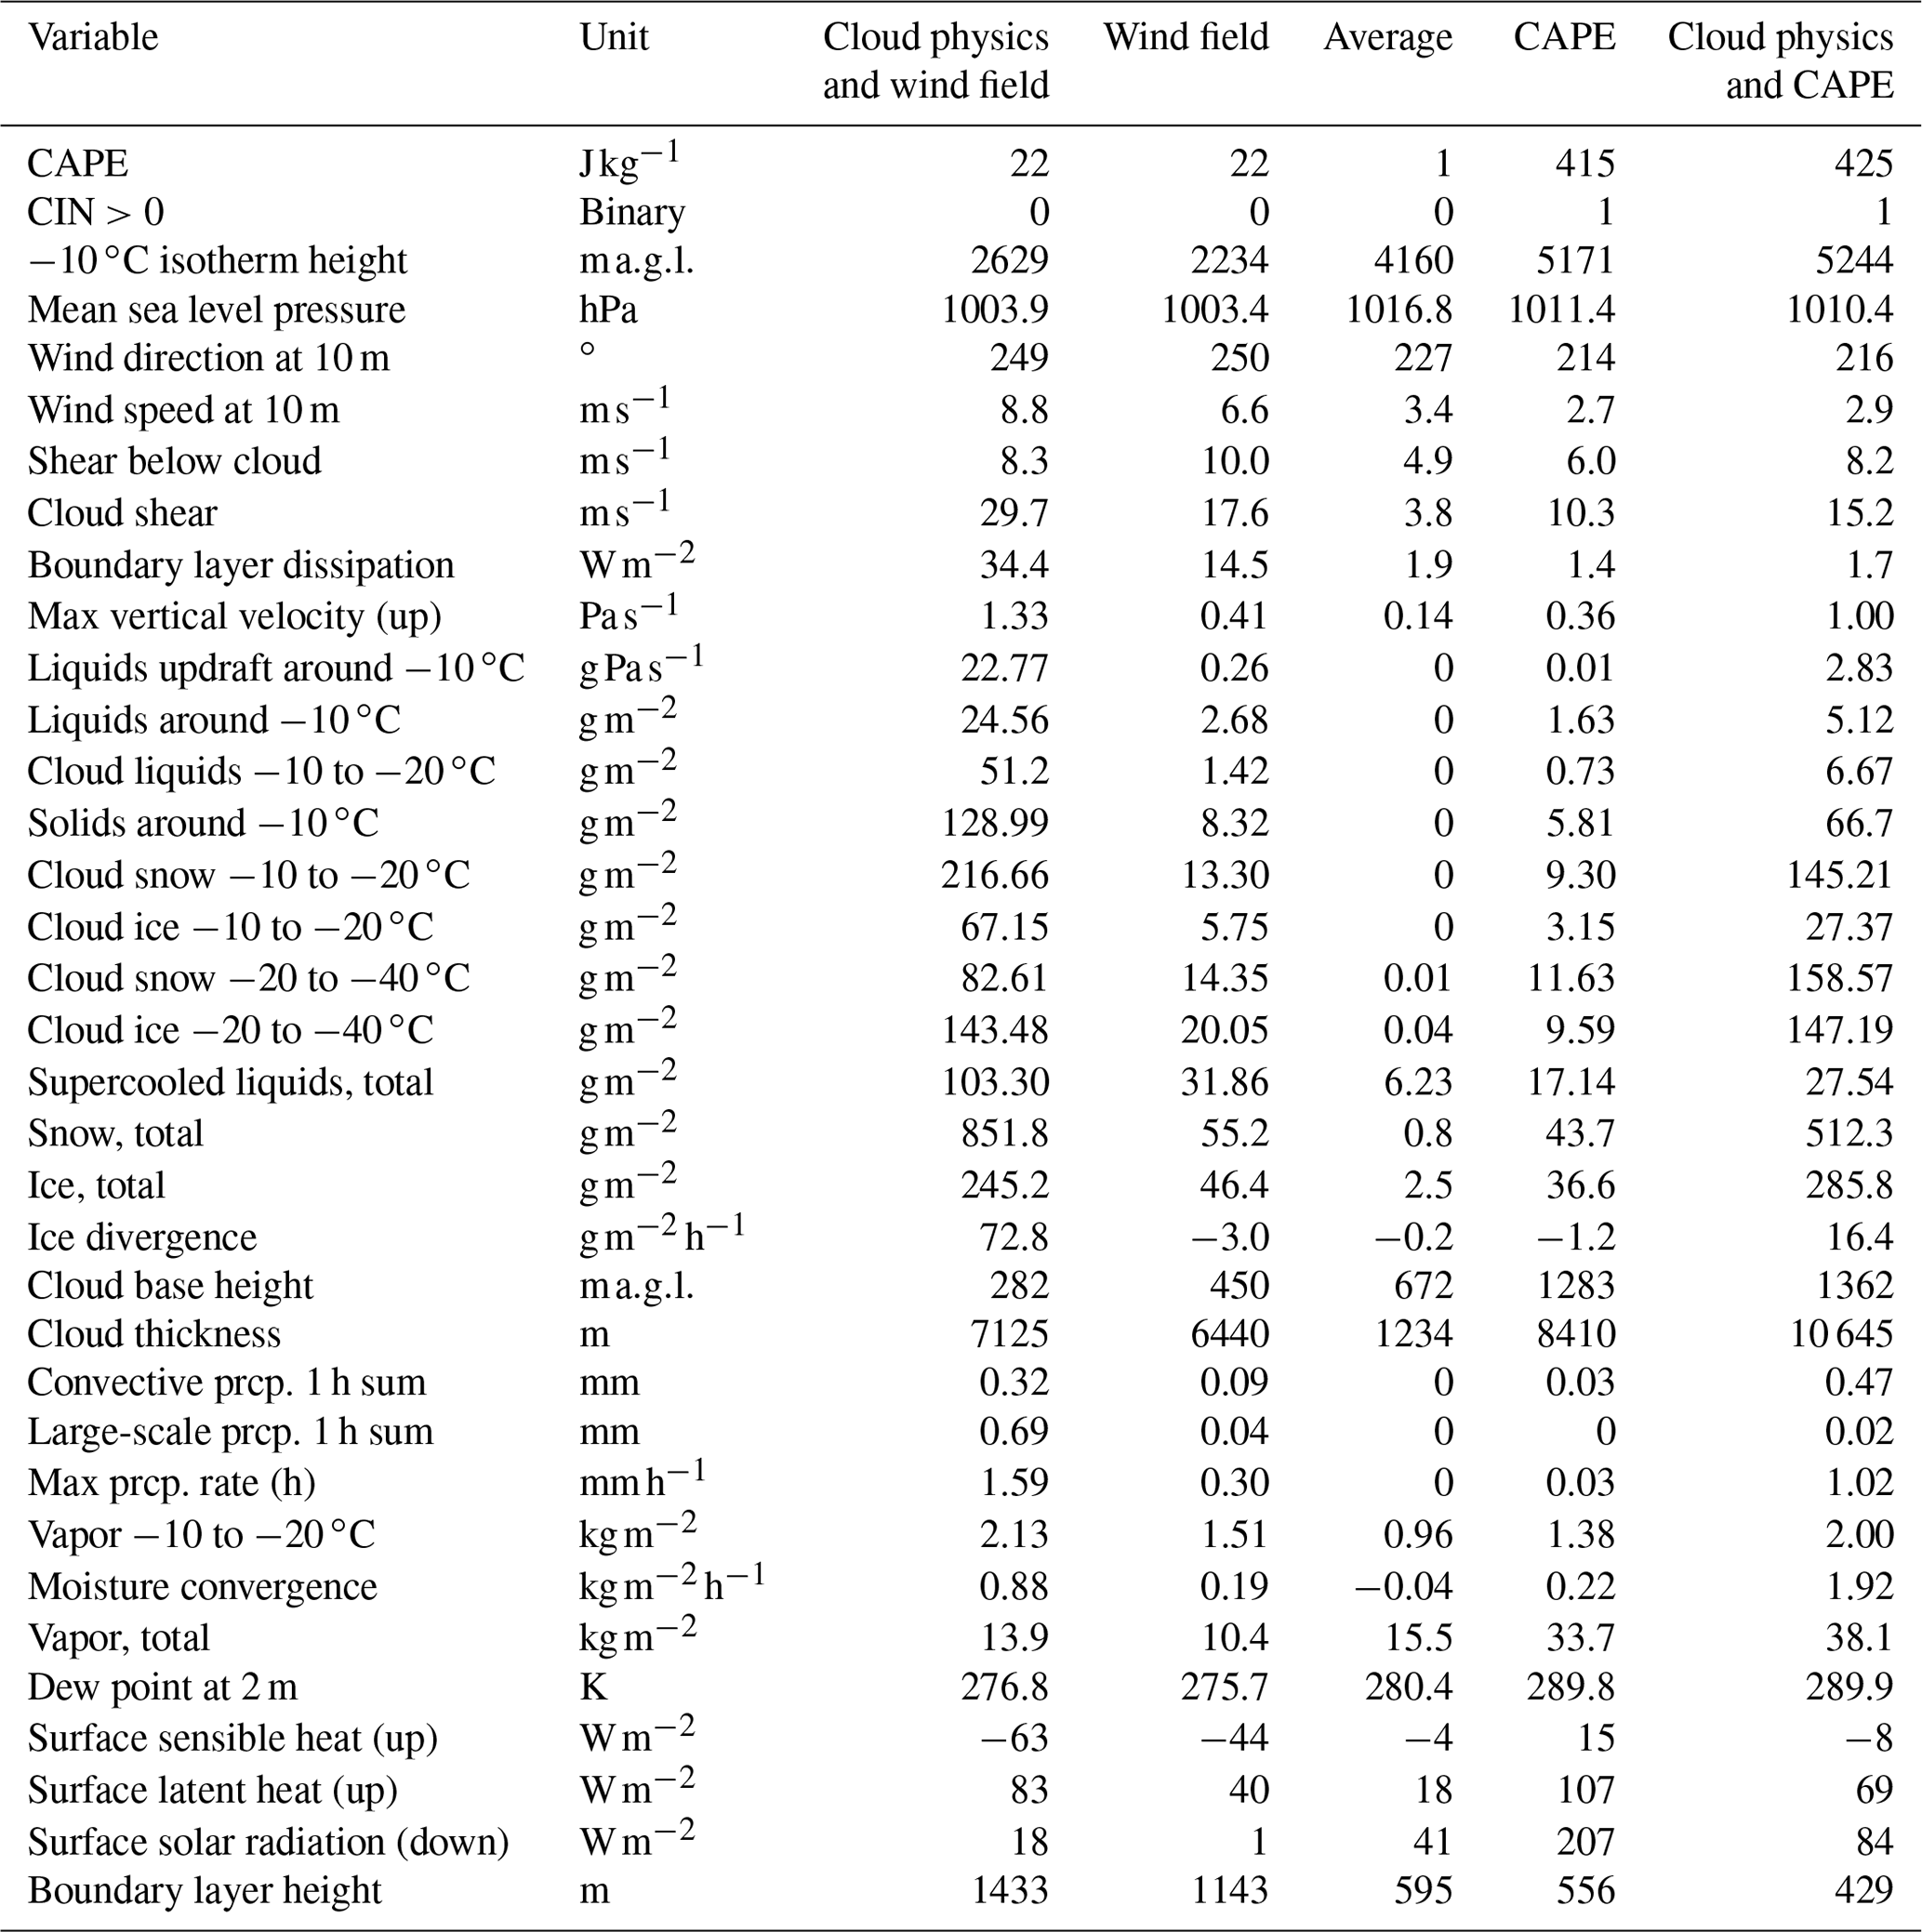
Table 1ERA5 variables used in this study. Variables derived from other ERA5 variables are marked by an asterisk (∗).
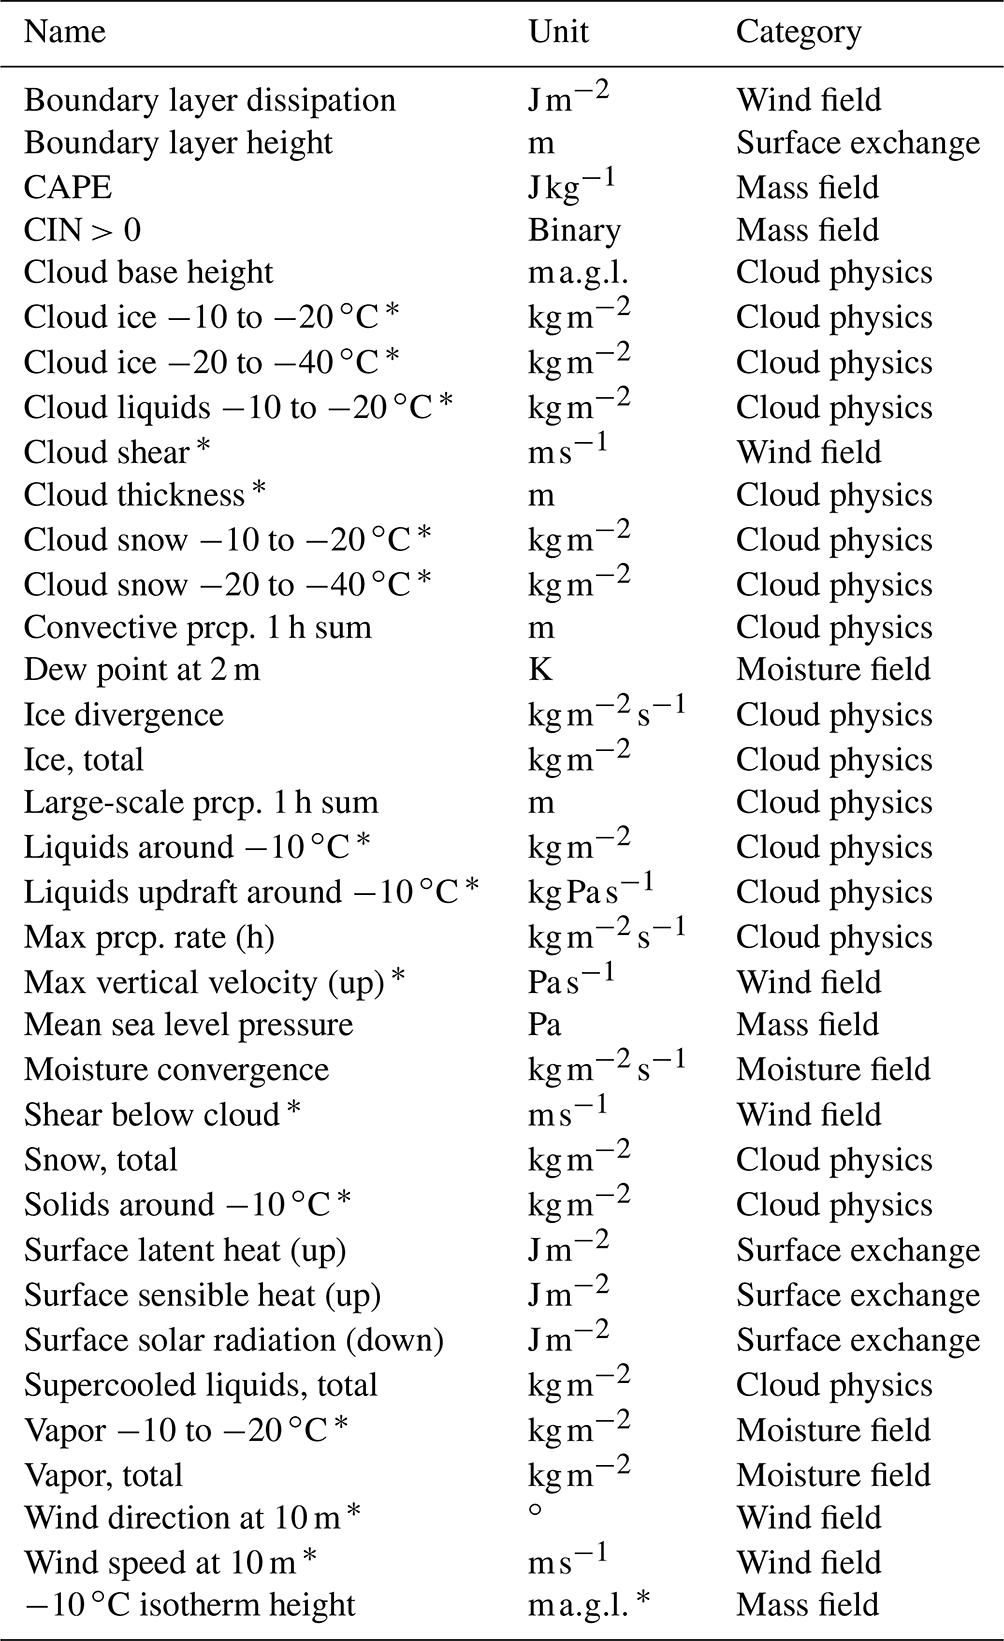
CAPE: convective available potential energy, CIN: convective inhibition, a.g.l.: above ground level, prcp.: precipitation.
The 35 variables presented in Table 1 are selected subjectively from the extended ERA5 data set based on our own meteorological expertise, results in the literature, and an explorative analysis of the data. This explorative analysis worked out variables that show a distinct distribution for the four scenarios, and we kept only variables that are not strongly correlated to other selected variables. The chosen atmospheric variables contribute to the formation and ultimately to the separation of electric charges needed for lightning to occur. Each variable is associated with a physical-based category (Table 1).
-
Mass field. This includes variables related to temperature and pressure such as CAPE and the altitude of specific isotherms.
-
Wind field. This includes wind- and shear-related variables such as wind speed and wind direction or the dissipation of kinetic energy in the boundary layer.
-
Cloud physics. This includes everything directly related to clouds such as the mass of various cloud particles, precipitation measures, or the cloud size.
-
Moisture field. This includes humidity-related variables, such as dew point temperature, moisture divergence, or total humidity.
-
Surface exchange. This includes boundary layer height and fluxes between the surface and the atmosphere such as latent and sensible heat.
For multivariate data analyses such as k-means cluster analysis and principal component analysis (PCA), it is important that the underlying variables (here: ERA5) are on the same scale and follow distributions as similarly as possible. To mitigate the pronounced skewness of most of the ERA5 variables, all of them are transformed by taking square roots:
where x denotes the original value of the ERA5 variable and xt is its transformation.
Moreover, to make deviations from “normal” levels comparable across variables, all variables in the full data set are scaled using the mean and standard deviation obtained only from the scenarios without lightning.
where xs denotes the scaled value. μ and σ are the empirical mean and standard deviation based on all cell-hours in winter and in summer without lightning. The applied algorithm is supplied in Morgenstern et al. (2022).
3.3 Statistical methods
To group the 6304 cell-hours consisting each of 35 ERA5 variables into similar groups, k-means clustering (MacQueen, 1967; Hartigan and Wong, 1979) is employed. Given the desired number of clusters k, the k clusters are chosen so that the sum of squared Euclidean distances of each cell-hour to the nearest cluster mean is minimized. This minimization problem is solved iteratively using the algorithm of MacQueen (1967) with 150 different sets of starting values in order to avoid getting stuck in local minima. k is set to five clusters because the sum of squared distances clearly decreases for every additional cluster until k=5 but levels out for more than five clusters. Analyzing dendrograms from hierarchical clustering further supports this decision.
Principal component analysis (Mardia et al., 1995) is a statistical method for dimension reduction that tries to find maximal variability within projections of the data. Each principal component (PC) is a linear combination of projected input data and is oriented perpendicular to the previous principal components. The principal components are ranked by the variance they explain so that the most variance within the data is captured by the first few principal components. Independent of the cluster analysis, the PCA is applied to the 6304 cell-hours of 35 ERA5 variables. The resulting first two principal components are used for visualizing the 35-dimensional data in a 2-dimensional so-called biplot to facilitate interpretation. PC 1 and PC 2 are sufficient for a reasonable interpretation because they together explain about 50 % of the variance within the data, whereas the explained variance of PC 3 is already down to 7.6 %. The R code replicating the clustering and principal component analysis of the presented sample is provided in Morgenstern et al. (2022).
In this section, we first present the results of the cluster analysis and the PCA, which reveals that most lightning in winter is explained by wind-field variables, while most lightning in summer is explained by mass-field variables (Sect. 4.1). Then we interpret the clusters meteorologically in more detail. Wind-field thunderstorms are associated with shallow, rather warm clouds and high horizontal wind speed and shear. CAPE thunderstorms are associated with increased values in the mass field with large CAPE values; high −10 ∘C isotherm heights; and deep, cold clouds (Sect. 4.2). Finally, we look at synoptic-scale processes related to the clusters and find that wind-field thunderstorms occur in the region of cyclogenesis and are characterized by strong westerly flow, while CAPE thunderstorms occur on the anticyclonic side of the jet with southwesterly flow (Sect. 4.3).
4.1 Cluster and principal component analysis
The statistical procedure of clustering ERA5 variables and applying a principal component analysis gives a physically interpretable result. Figure 2 shows the 6304 cell-hours of the dimension-reduced ERA5 variables, projected onto the 2-dimensional space of the first two principal components (PC 1 and PC 2; axes). Each cell-hour is represented by a color-coded symbol that indicates to which of the five clusters it belongs. The five clusters are located in different parts of the span of the first two principal components. The cell-hours in the clusters symbolized by dark-red triangles and dark-blue circles occupy the outer reaches of the upper- and lower-right quadrants, respectively, each covering approximately 7 % of all cell-hours. Closer to the origin in the upper two quadrants, the cluster symbolized by light-red triangles covers approximately 17 % of the cell-hours, and the cluster in the lower two quadrants with the light-blue circles covers approximately 27 %. The largest cluster (41 %) depicted by yellow diamonds is closest to the origin; i.e., the values of the ERA5 variables in these cell-hours are close to average. Accordingly, we label this cluster “average”. To find a possible physical meaning of the other four clusters, the so-called “loadings” from the PCA are examined.
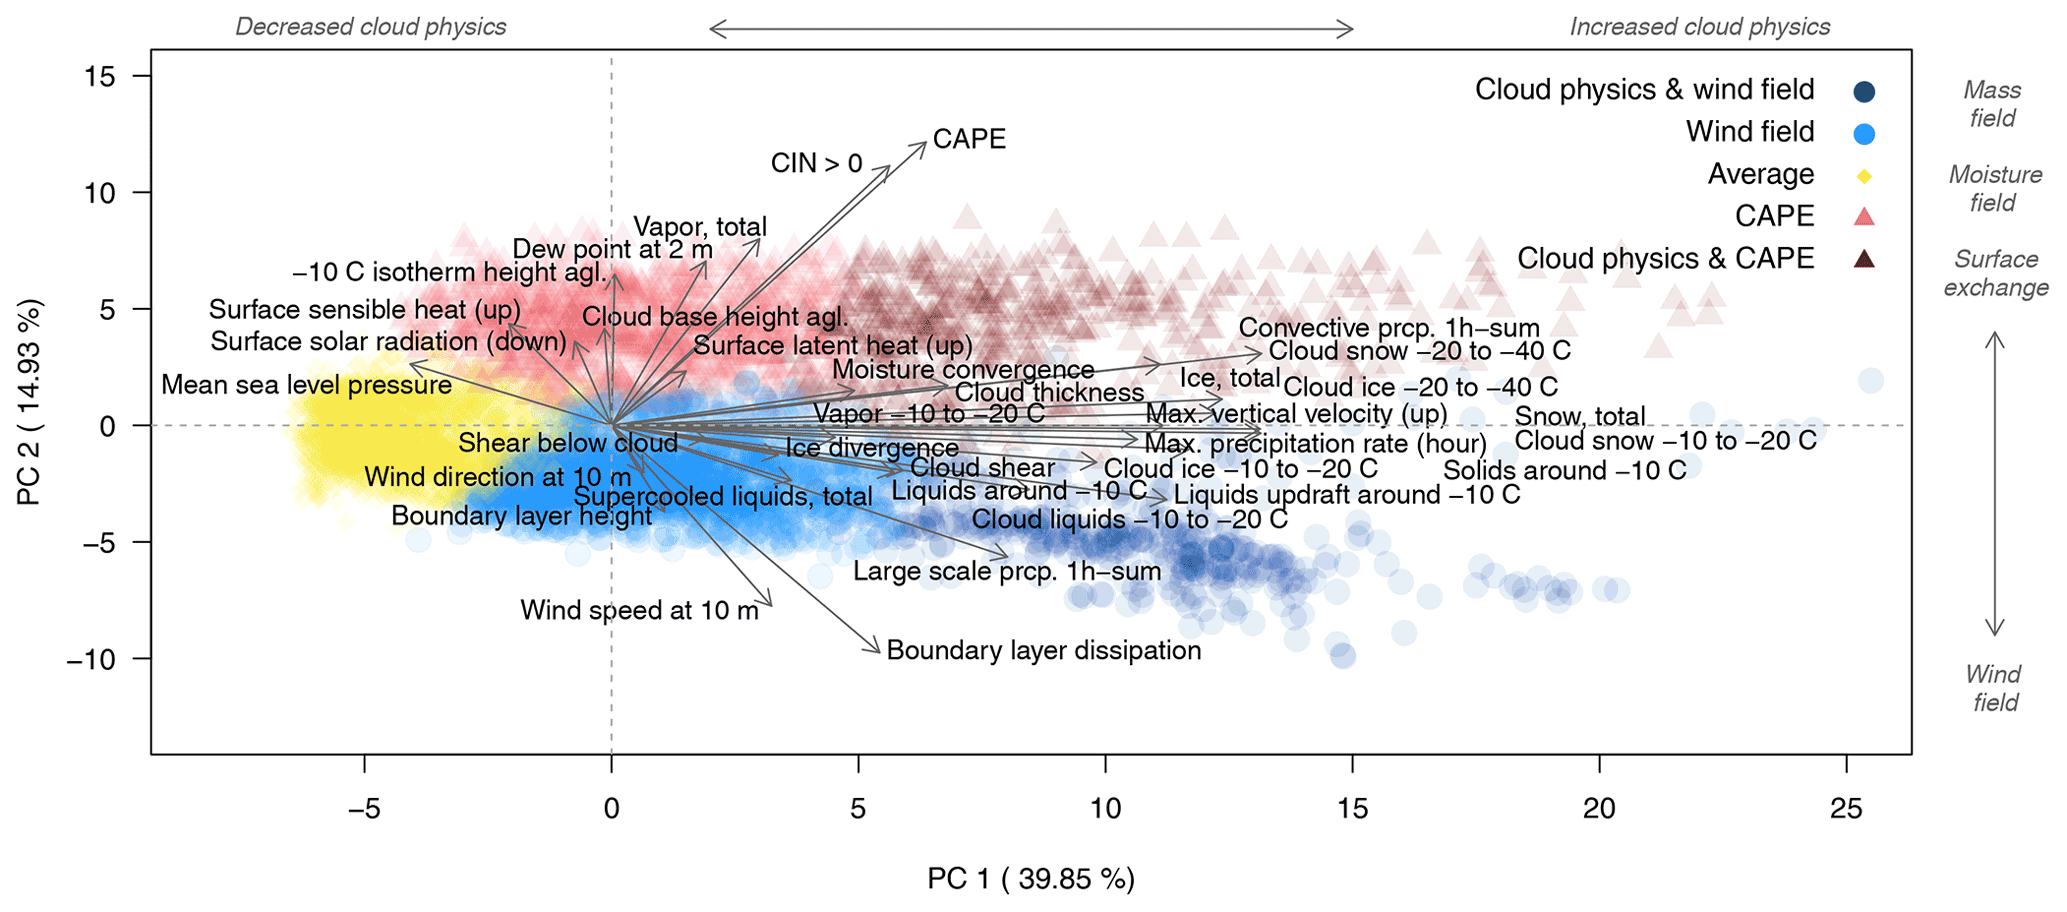
Figure 2Plot of the 6304 cell-hours separated into five clusters by k-means clustering (colored symbols) and then projected onto their first two principal components (PC 1 and PC 2). Labeled arrows (biplot) show the loading of each variable (35 in total), i.e., how it contributes to creating the first two principal components. The top and right axes are labeled (in italics) to indicate the dominant physical categories defined in Sect. 3.2. Note that the orientation of the arrows in the surface-exchange category depends largely on how the flux direction is defined.
The loadings are shown as labeled arrows in Fig. 2. Their length and direction depict how each variable contributes to creating the first two principal components. The loadings of most variables from the cloud-physics category have a large component parallel to the axis of the first principal component (PC 1). Accordingly, the upper axis in the figure is labeled as “cloud physics” (increased vs. decreased). The loadings of the variables from the other four physical categories, on the other hand, have a larger component parallel to the second principal component (PC 2). The right axis in the figure is labeled accordingly, yielding the physical meaning of the remaining four clusters.
The light-red cluster extends largely along the positive part of the second principal component that is dominated by variables of the mass-field and moisture-field categories, especially CAPE. It is accordingly named the “CAPE thunderstorm” cluster. The dark-red cluster in the upper-right quadrant with a large component along both PCs can thus be termed the “cloud-physics and CAPE thunderstorm” cluster. Analogously, the light-blue cluster is dominated by the wind-field category and termed “wind-field thunderstorm” cluster, and the dark-blue one is the “cloud-physics and wind-field thunderstorm” cluster.
Reducing the number of clusters in the cluster analysis leads to a combined “cloud-physics” cluster (k=4) and a large cluster uniting wind-field thunderstorms with CAPE thunderstorms (k=3). This stresses how well the cluster analysis differentiates between lightning and no lightning in general and points to the importance of the cloud-physics variables to distinguish between thunderstorm types.
After having discovered that the five clusters correspond to different atmospheric processes and variables, Fig. 3 shows that they also neatly fit into the four seasonal scenarios (winter vs. summer with and without lightning). The scenario of lightning in winter is dominated by the clusters termed wind-field thunderstorms (light blue) and cloud physics and wind-field thunderstorms (dark blue); only a tiny fraction of the cloud-physics and CAPE thunderstorm cluster contributes to it. The situation is reversed in the summer lightning scenario where the CAPE thunderstorm cluster and the cloud-physics and CAPE thunderstorm cluster dominate (reds). However, some events from the wind-field thunderstorm cluster also occur. The two no-lightning scenarios are dominated by the average cluster (yellow) with some contributions of the wind-field cluster in winter and of CAPE thunderstorms in summer. Unsurprisingly, the separation between lightning and no-lightning scenarios with reanalysis variables is not completely sharp. But what is surprisingly clearly is that the situations where wind-field variables dominate with large deviations from their average values correspond to the lightning cases in winter. In summer, on the other hand, large deviations from average in the mass field dominate the lightning cases, and only a few wind-field-dominated cases occur.
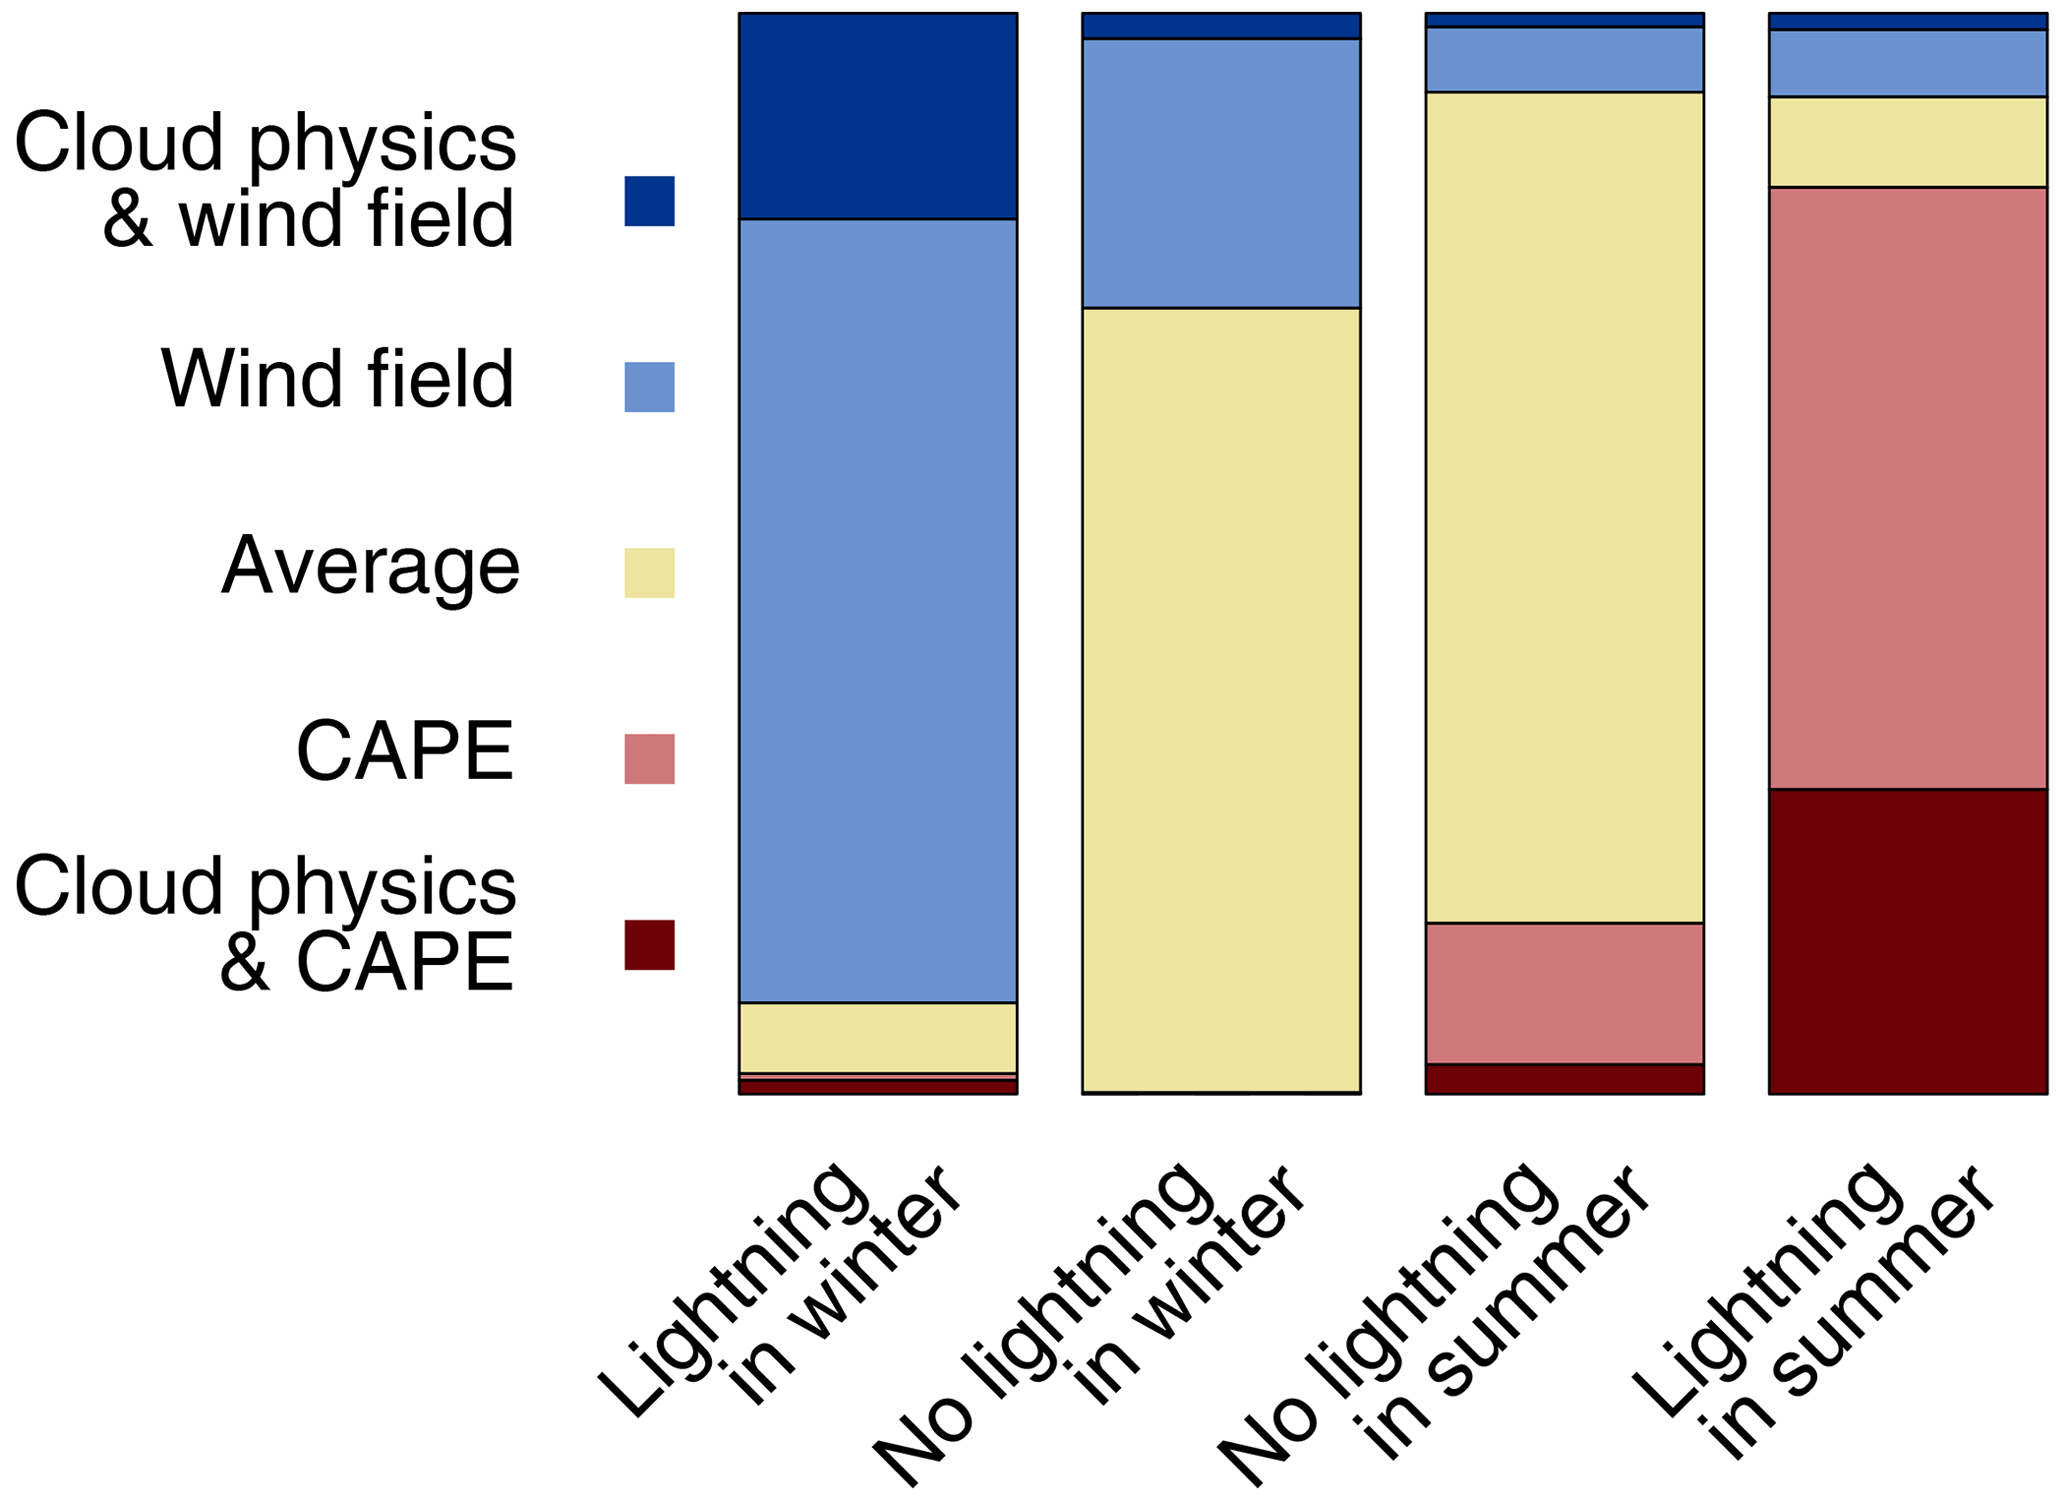
Figure 3Stacked bar plot of the clusters (colors, y axis) found in the different scenarios (bars, x axis).
Extending our analysis to the full year (Morgenstern et al., 2022) reveals that spring and fall both consist of around 36 % CAPE thunderstorms, 25 % wind-field thunderstorms, 20 % cloud physics and CAPE thunderstorms, and 10 % cloud physics and wind-field thunderstorms.
4.2 Meteorological characterization of the clusters
Next, we zoom into the clusters and interpret the variables aggregated to them from a meteorological perspective.
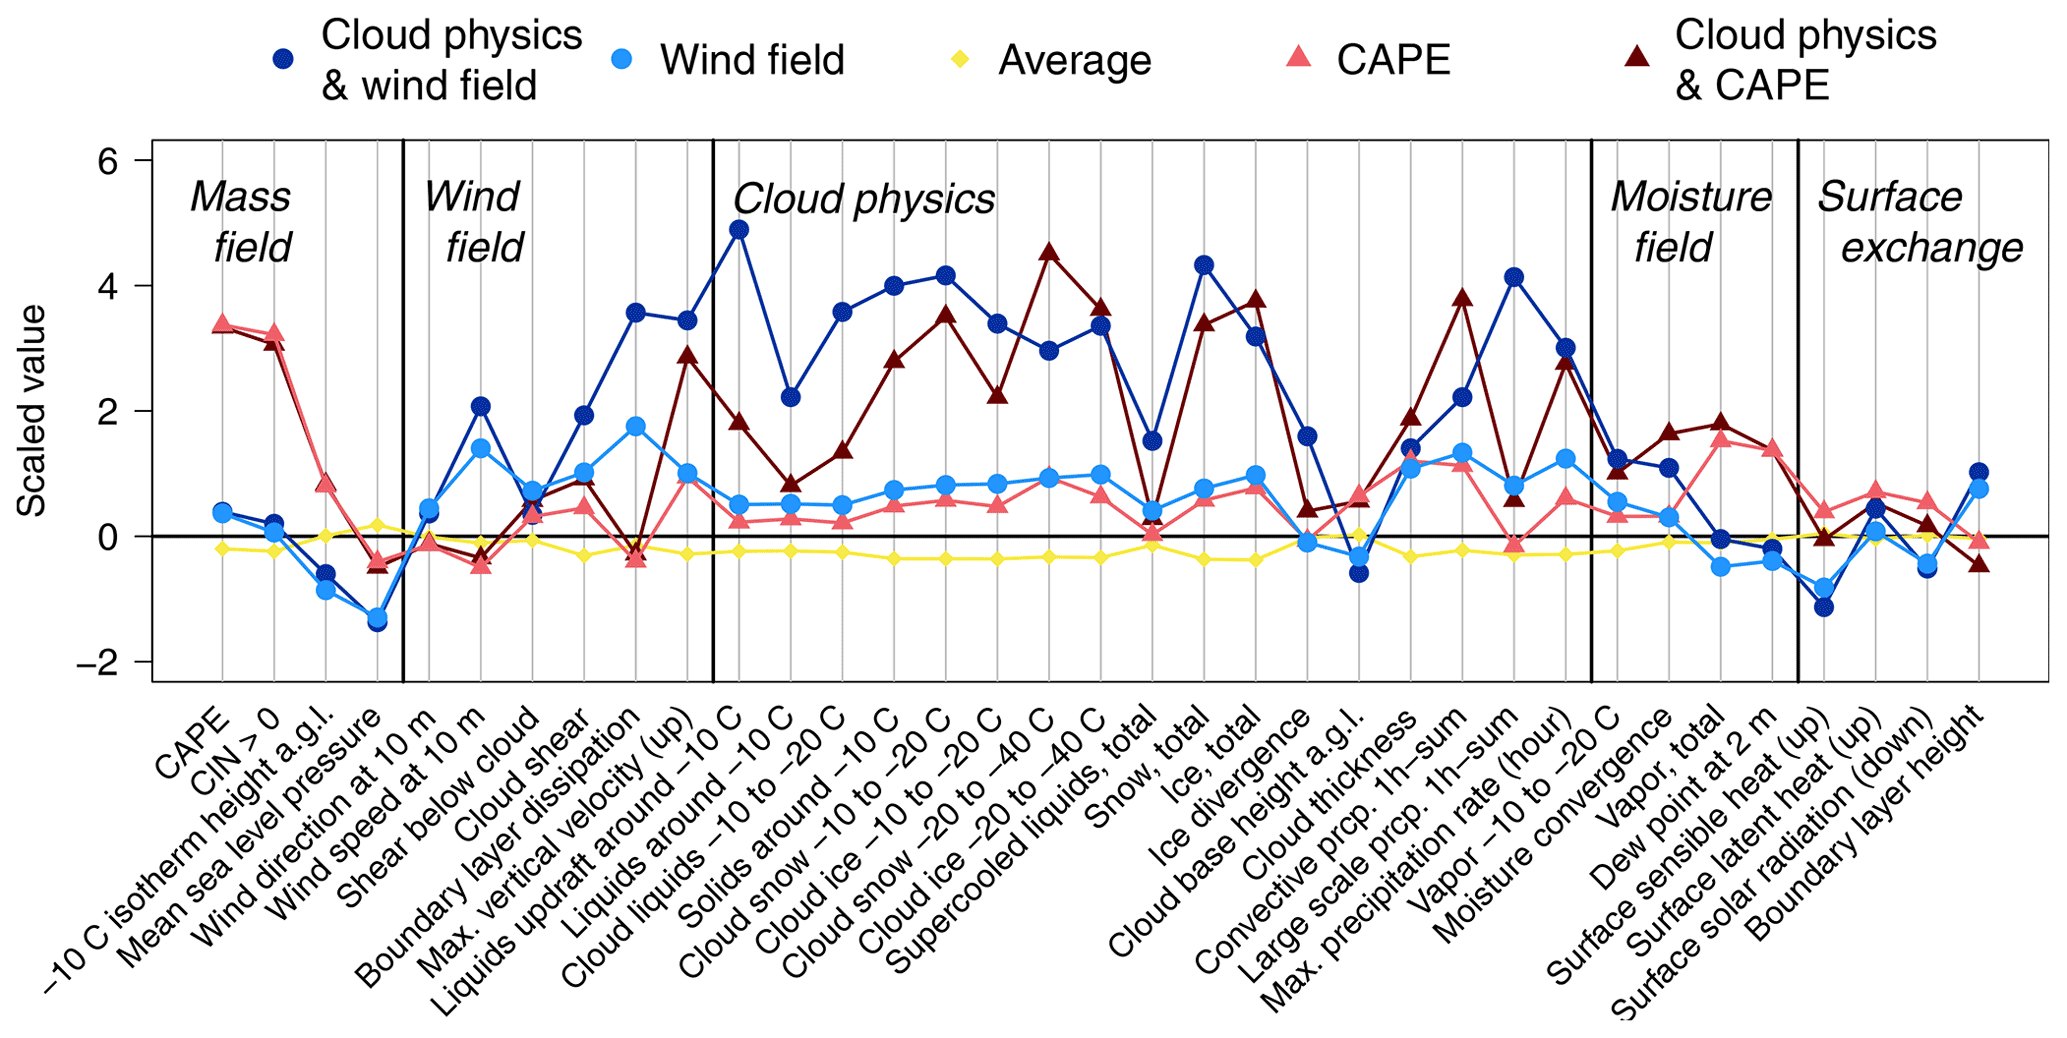
Figure 4Cluster means (color-coded) of scaled ERA5 variables arranged by physical categories (italics). Variables are transformed by the square root and standardized to a mean of 0 and a standard deviation of 1 based on the scenarios without lightning.
Table 2Cluster medians.
CAPE: convective available potential energy, CIN: convective inhibition, a.g.l.: above ground level, prcp.: precipitation.
Figure 4 shows the cluster means of all 35 ERA5 variables; the corresponding unscaled cluster medians are presented in Table 2. The variables are grouped by their respective physical category (mass field, wind field, cloud physics, moisture field, and surface exchange). Values in the average cluster (Fig. 4, yellow) are close to zero, i.e., their mean. Since the average cluster contains the no-lightning situations (cf. Fig. 3), which make up the predominant state of the atmosphere, variables are expected to be in their typical range. This corroborates again that clustering reflects physical meaning. Figure 4 (cluster analysis) confirms what the loadings in Fig. 2 (PCA) already indicated: variables with larger arrows towards a given cluster in Fig. 2 correspond to higher values for that cluster in Fig. 4.
4.2.1 CAPE thunderstorm clusters
Figure 4 shows that indeed most mass-field variables have large deviations from their average for the events separated into the CAPE thunderstorm clusters (reds). The layer crucial for the occurrence of charge separation – represented by the −10 ∘C isotherm – is high above the ground (median above 5 km, see Table 2), which is typical for summer, for which the CAPE thunderstorm clusters prevail. Also total column water vapor (humidity) and the 2 m dew point temperature from the moisture-field category is increased. CAPE represents both mass-field and moisture-field variables and is high only in the CAPE thunderstorm clusters with median values of 420 J kg−1. When large values of CAPE are released, tall (cumulonimbus) clouds can form, and convective precipitation ensues. Accordingly, events in the CAPE thunderstorm clusters also have high values in some variables of the other physical categories. From the cloud-physics category, the cloud size, convective precipitation, and maximum precipitation rate are increased. From the wind-field category, shear and vertical velocity are increased. Tall clouds are more likely to have higher shear across their depth, and the release of CAPE leads to larger vertical velocities. Overall, CAPE thunderstorms are responsible for most flashes in our study region because 84 % of the lightning cell-hours in summer (JJA) are clustered as CAPE thunderstorms. As summer is the main lightning season in our study region, we expect CAPE thunderstorm processes to be the predominant lightning mechanism there.
4.2.2 Wind-field thunderstorm clusters
Figure 4 and Table 2 confirm that the values of the wind-field variables of the cell-hours grouped into the wind-field thunderstorm clusters (blue lines) are indeed unusually large. The wind speeds, shear, and dissipation of kinetic energy in the boundary layer are all large. High shear also contributes to a larger and downward-oriented sensible heat flux (from the physical category of surface fluxes). Increased mechanical mixing, in turn, leads to deep (mixed) boundary layer heights of median more than 1 km, even with low solar-energy input. As Fig. 3 shows, events in the wind-field clusters occur mostly during winter. Accordingly, the −10 ∘C isotherm is closer to the ground (median around 2,5 km), and the surface dew point and total column water vapor (from the moisture-field category) are lower. Surface temperatures in the study region are mostly low but above freezing and in a rather narrow range (not shown) for events in the wind-field clusters. Likely, strong shear and mechanical mixing, possibly aided by the presence of clouds will prevent the buildup of nocturnal cold pools. CAPE is around 22 J kg−1 and therefore close to its normal value of zero. Unusually low mean sea level pressure (from the mass-field category) hints at the reason for high wind speeds and shear: mid-latitude low-pressure systems and their associated strong baroclinicity, which leads to larger values of vertical shear via the thermal wind relationship.
Figure 5 presents clusterwise vertical profiles for wind speed. Events in the wind-field thunderstorm cluster (light blue) have wind speeds about twice as high as events in the CAPE thunderstorm (light and dark red) and average (yellow) clusters, respectively. Median wind speeds for those events, where cloud-physics variables are particularly large (dark blue; discussed in more detail in the next section), are even 3 times as large. Within the lowest kilometer, wind speeds in the wind-field cluster (light blue) increase by more than 20 m s−1. Since median speeds further up to almost 4 km above sea level remain constant, horizontal temperature gradients in this layer must be small. Overall, this shape of the wind profile is typical of strong wintertime cyclones and their associated cold fronts. For events in the CAPE thunderstorm clusters (reds), which occur in the warm season (cf. Fig. 3), wind shear is much lower. There, the wind speeds increase only by about 10 m s−1 in the lower half of the troposphere up to 5 km. Strong summertime convection is driven by the release of CAPE with wind shear playing a secondary role in organizing this convection. Our observed values of 10 m s−1 difference in horizontal wind speeds between the lower and upper troposphere for CAPE thunderstorms (reds, Fig. 5) point to the well-known fact that most summertime thunderstorms are single cells or multicells (Markowski and Richardson, 2010). The large values of CAPE allow for vertical velocities of 10–20 m s−1 and more within thunderstorms, exceeding the horizontal wind speeds resulting in a mainly vertical separation path of the particles. For the wind-field thunderstorms, the horizontal wind speeds in the lower troposphere are comparable or higher to the updrafts and might thus separate differently charged and differently sized cloud particles also in the horizontal direction. This supports the hypothesis of shallow but tilted charge regions for lightning in winter (Takeuti et al., 1978; Brook et al., 1982; Williams, 2018).

Figure 5Clusterwise medians along with upper and lower quartiles of wind speed at each model level in ERA5 plotted at the mean model level height of the respective clusters.
4.2.3 The role of cloud physics within the lightning involving clusters
Cloud physical details are crucial for lightning to occur in general. Figure 3 shows that the average cluster contains most of the non-lightning events, and accordingly the cloud-physics variables are close to their scaled mean of zero (Fig. 4). In contrast, events in the wind-field thunderstorm (blues) and CAPE thunderstorm (reds) clusters come with lightning (Fig. 3), and the scaled values of most of their cloud-physics variables are elevated above zero. Yet the clustering algorithm detected two groups of events with vastly elevated values of the cloud-physics variables (dark blue and dark red). Together these two groups cover 24 % of the data in the lightning involving clusters and would merge when reducing the number of clusters to k=4. They have much higher cloud particle concentrations compared to the other lightning involving clusters. Consequently, these are events when thick clouds with large amounts of particles needed for charge separation are present in the ERA5 reanalysis. Of secondary importance are then either wind-field variables, putting these events into the cloud-physics and wind-field thunderstorm cluster, which occurs in winter (cf. Fig. 3), or mass-field variables, putting them into the cloud-physics and CAPE thunderstorm cluster, which occurs in summer. The wintertime cloud-physics and wind-field cluster is accompanied by some vastly elevated values of wind-field variables, whereas the summertime cloud-physics and CAPE thunderstorm cluster differs from the CAPE thunderstorm cluster only by elevated values of cloud physics, not in mass-field values. The type of precipitation that occurs for events in these cloud-physics clusters indicates again the accompanying weather types. Wintertime events in the cloud-physics and wind-field cluster come with unusually large values of large-scale precipitation indicative of large-scale slanted ascent in mid-latitude cyclones, whereas precipitation from convection plays a minor role. The opposite is the case for events in the summertime cloud-physics and CAPE thunderstorm cluster. There, precipitation is mostly from convection (i.e., vertical ascent).
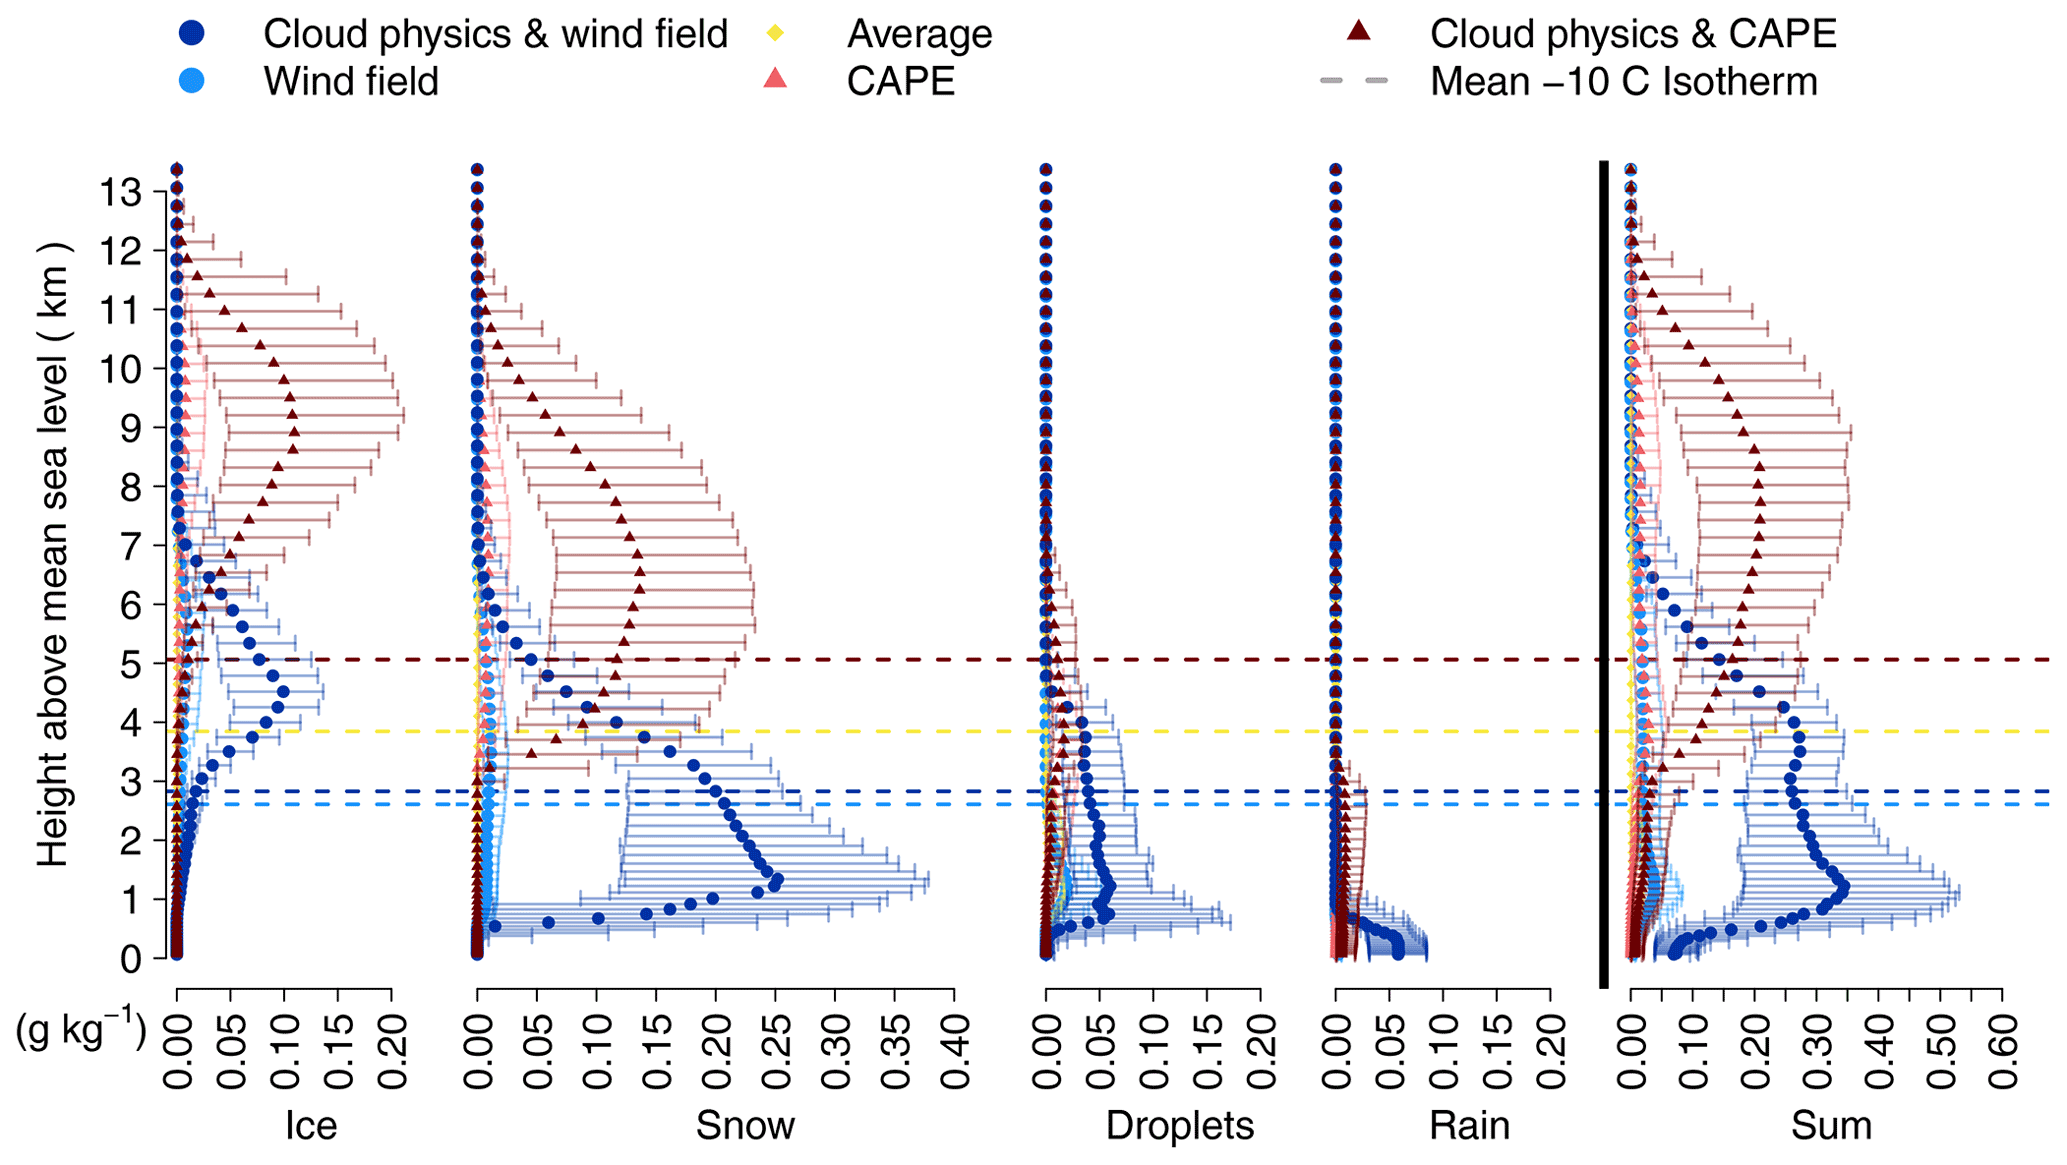
Figure 6Clusterwise medians along with upper and lower quartiles of suspended particles (ice crystals and droplets) and hydrometeors (snow and rain) at each model level in ERA5 plotted at the mean model level height of the respective clusters. For each cluster the mean height of the −10 ∘C isotherm is included as a dotted line. The last panel displays the sum of the other four and uses a different scale.
Some cloud-physics variables, such as the cloud size, the distribution of cloud particles relevant for charge separation, and the temperature, are better understood when looking at their vertical profiles. Figure 6 shows such profiles for suspended particles (ice crystals and droplets), hydrometeors (snow and rain), and their sums along with the mean −10 ∘C isotherm height for each cluster. The large difference between the clusters with enhanced cloud physics (dark blue and dark red) and their moderate counterparts (light blue and light red) is directly visible because their quartiles do not intersect over large areas.
Regarding the cloud size, Fig. 6 shows that the cloud base during events in the wind-field clusters (blues) is approximately 1 km lower than for events in the CAPE thunderstorm clusters (reds; lowest level in the sum or droplets panel or Table 2). Cloud tops in the wind-field clusters are approximately 5 km shallower, having cloud top heights at around 7 vs. 12 km in CAPE thunderstorm clusters (highest levels in the sum or ice panel). Put differently, considering that wind-field thunderstorm events occur in winter and that CAPE thunderstorm events occur in summer, thunderstorm clouds in winter are lower-based and considerably shallower than in summer. This has a somewhat surprising consequence on the temperatures of these clouds. Looking at the cloud mass (sum of all cloud particles) below and above the −10 ∘C isotherm (dashed lines) of wind-field thunderstorm clouds (blues), the larger part (factor of 1.7 without and factor of 2.3 with cloud physics) is warmer than −10 ∘C. CAPE thunderstorm clouds (reds) have similar or larger cloud particle concentrations (factor of 1 without and factor of 2.9 with cloud physics) in regions that are colder than −10 ∘C, resulting in rather cold clouds. Hence, during lightning in winter, clouds are – integrated over their depth – overall warmer than summer clouds.
The shape of the vertical cloud particle distribution is consistent with the possibility of charge separation to have occurred (panels for ice, snow, droplets, and rain). Both the formation of a graupel dipole and a snow dipole, respectively, require a spatial separation of light ice crystals and heavier solid hydrometeors after their charge transferring collisions1 in the presence of supercooled liquid water. And indeed, for events in the wind-field thunderstorm and CAPE thunderstorm clusters, ice crystal maxima (ice panel) are several kilometers above the solid hydrometeor maxima (snow panel), and the zone of cloud liquids (droplets panel) include the −10 ∘C isotherm. Events in the no-lightning average cluster (yellow) have either no or only shallow clouds, which consist mostly of suspended droplets so that no charge separation is possible.
4.3 Weather patterns
The clusters found by the cluster analysis are associated not only with typical variables and seasons but also with typical weather patterns. Figure 7 shows median weather patterns for the three largest clusters. The clusters with enhanced cloud physics are not shown, since weather patterns are similar to those of their moderate counterparts. Wind speed (color) and anomalies of geopotential height (black lines) at 300 hPa are plotted along with anomalies of temperature (red dotted lines) at 700 hPa.
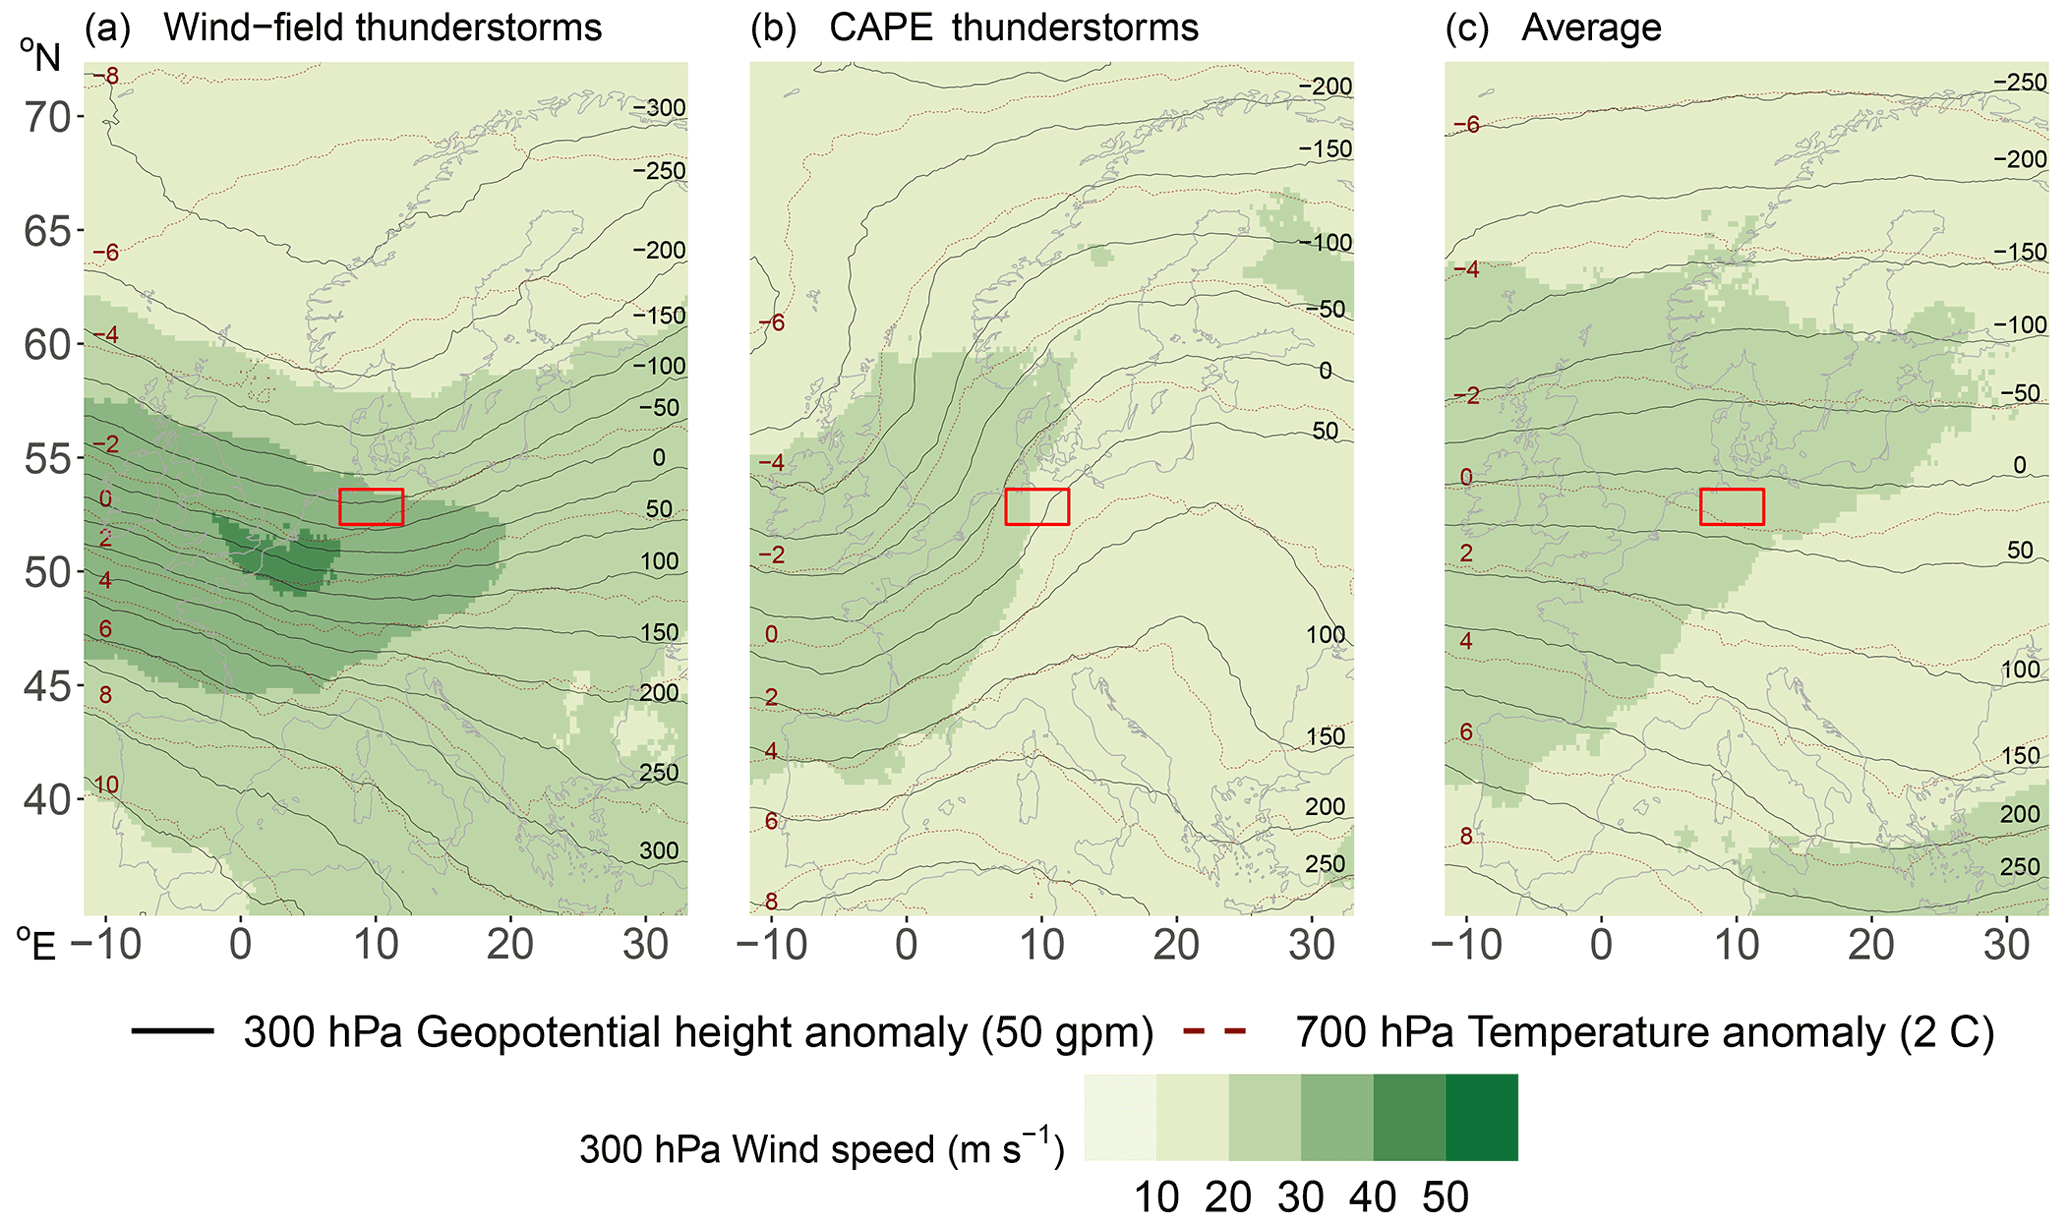
Figure 7Median weather charts for the clusters in the observational region (red rectangle) showing wind speed (colors) and anomalies of geopotential height relative to the mean (solid black lines) at 300 hPa and temperature anomalies at 700 hPa (dotted red lines). Number of charts composed for each cluster: 1729 for the wind-field thunderstorms (a), 1096 for the CAPE thunderstorms (b), and 2591 for the average cluster (c).
Events grouped into the wind-field thunderstorm cluster (Fig. 7a) have a strong inflow from west-northwest towards the study region in northern Germany, as the tightly packed isohypses (black lines) show. The study region is located in the left exit region and at the cold and cyclonic side of the jet, where cyclogenesis and ascent take place as can be shown using ageostrophic-circulation reasoning (e.g., Martin, 2006). At 700 hPa, a substantial horizontal northeast–southwest temperature gradient becomes apparent (approximately 8 ∘C per 1000 km). Lightning events in the CAPE thunderstorm clusters (Fig. 7b) predominantly originate in southwestern weather patterns. The study region is situated at the warm and anticyclonic side of the jet, prevalently in the warm sector of the frontal systems. Ageostrophic circulations favor large-scale descent. However, advection of warm and moist air from the Mediterranean Sea potentially increases CAPE with convection ensuing when it is triggered and released. Events in the average cluster (Fig. 7c) mostly lack lightning. While they are a composite of various weather patterns, the zonal pattern of the isohypses reflects the predominance of westerly flow as a result of the north–south-oriented temperature gradient typical of a mid-latitude region.
Rather than taking the common approach of looking at differences between thunderstorms in winter and summer, we have taken a data-driven approach. Starting with a large set of variables that are potentially important for the formation of lightning (e.g., Vogel et al., 2016; Kolendowicz et al., 2017) and putting them through a clustering and principal component analysis yielded four physically meaningful clusters that distinguish different types of thunderstorms. In the first type (cf. Fig. 4), variables in the mass-field category such as CAPE, CIN (convective inhibition), or the height of the −10 ∘C isotherm deviate strongly from their average values (CAPE thunderstorms). In the second type, variables in the wind-field category such as shear within the cloud, 10 m wind speed, or boundary layer dissipation deviate strongly (wind-field thunderstorms). The other two types are variants of the previous two but have additionally pronounced deviations in variables within the cloud-physics category such as the mass of solid cloud particles or precipitation amounts (cloud physics and wind-field thunderstorms and cloud physics and CAPE thunderstorms).
The clear distinction between thunderstorm types characterized by high values in either the wind field or the mass field highlights that thunderstorms should not be conflated with strong convection. Strong moist convection depends upon high vertical velocity and deep clouds, which requires the presence of CAPE and a trigger to release it. Only CAPE thunderstorms fulfill these requirements, while CAPE in wind-field thunderstorms is basically zero. However, the defining characteristic of a thunderstorm is thunder caused by lightning (WMO, 1992), and lightning occurs when differently charged regions in a cloud equalize. Those charged regions are thought to form when different cloud particles collide and are subsequently spatially separated by differential terminal velocities (e.g., Williams, 2018). In CAPE thunderstorms, vertical velocities are usually large (10–50 m s−1) when CAPE is released, but in wind-field thunderstorms, CAPE is too small (∼22 J kg−1) to explain the necessary vertical motions. Instead, it seems that high horizontal wind speeds and large vertical shear of the horizontal wind cause the charge separation (cf. Fig. 5 and Table 2). Separation of the charge regions is then no longer predominantly in the vertical but strongly tilted – known as the “tilted charge hypothesis” (Takeuti et al., 1978; Brook et al., 1982; Engholm et al., 1990; Williams, 2018; Takahashi et al., 2019; Wang et al., 2021). These tilted charge regions were first observed in Japan during winter with high, strongly sheared horizontal wind speeds (Takeuti et al., 1978; Brook et al., 1982) and have since been observed in (mesoscale convective) storms in winter and summer (Brook et al., 1982; Engholm et al., 1990; Levin et al., 1996; Dotzek et al., 2005; Liu et al., 2011; Takahashi et al., 2019). The discussion is often accompanied by an analysis of increased positive lightning discharges in winter (Takeuti et al., 1978; Brook et al., 1982; Takagi et al., 1986; Takahashi et al., 2019; Wang et al., 2021). Observations of longer lightning channels in high-wind conditions (López et al., 2017; Yoshida et al., 2018) further support the tilted charge hypothesis.
Whether a wind-field thunderstorm or CAPE thunderstorm occurs depends on the larger-scale synoptic environment. In the northern Germany study region, the prevalence of these environments strongly varies seasonally. Weather patterns with unusually large values in wind-field-related variables (cf. Fig. 7a) dominate in winter. Accordingly, the wind-field thunderstorms occur mostly in the cold season. Similar weather patterns as in Fig. 7a with strong, mostly zonal flow and high wind speeds are found in wintertime studies of thunderstorm days in central-eastern Europe (Kolendowicz et al., 2017) and derechos (high-impact convective wind events) in winter in Germany (Gatzen et al., 2020). Due to the stronger horizontal temperature gradients in mid-latitudinal winter, higher wind speeds and thus wind-field thunderstorms also occur elsewhere, e.g., USA and Japan. For the USA, Bentley et al. (2019) have evidence that lightning in winter is often associated with the development and progression of mid-latitude cyclones and that the synoptic weather systems are more important than insolation. Our results in Fig. 7a also locate wind-field thunderstorms into the left exit region of the jet, where cyclogenesis typically occurs (e.g., Martin, 2006). Sometimes lightning in winter is referred to as high-shear low-CAPE (HSLC) storms (Johns et al., 1993; Sherburn and Parker, 2014). However, thresholds of 500 J kg−1 to define “low CAPE” constitute high CAPE in our target region where wind-field thunderstorms have median values of 22 J kg−1 for CAPE and could thus analogously be named “high-shear no-CAPE” events.
Large-scale weather patterns leading to CAPE thunderstorms, characterized by large CAPE values (median of 415 J kg−1) and increased heights of the −10 ∘C isotherm (median of 5170 m) dominate in the warm season in our study region. The preferred weather pattern of southwesterly flow (Fig. 7b) was also found to be important for summertime lightning in the larger area of central Europe (Kaltenböck et al., 2009; Westermayer et al., 2016; Kolendowicz et al., 2017) and accounts for the majority of lightning activity in Europe. CAPE thunderstorms are well described in the literature and often taken to be synonymous with thunderstorms in general (e.g., Williams et al., 2005; Kaltenböck et al., 2009; Mora et al., 2015; Stolz et al., 2017; Kolendowicz et al., 2017; Dewan et al., 2018; Etten-Bohm et al., 2021).
The statistical approach of clustering and principal component analysis found two more clusters that are variants of the wind-field thunderstorm type and CAPE thunderstorm type and vary seasonally in the same way. For them, cloud-physics variables strongly deviate from average conditions. They point to the need for including cloud physics for the indirect diagnosis of thunderstorms from atmospheric proxy variables, since cloud physics is essential for electrification.
The study area was deliberately limited to a topographically uniform region (northern Germany) to reduce the complexity of the problem. The data-driven approach used here should easily transfer to other regions. When larger, non-homogeneous regions are studied, the data-scaling techniques will have to be extended to be able to deal with spatially varying means and anomalies.
Using a lightning location system (LLS) to detect lightning misses a particular type of upward lightning, which consists of a continuous current only. Lightning such as that can currently only be detected at very few specially instrumented towers. While it is rare in absolute numbers and affects only tall structures above 100 m, it might contribute up to half of the lightning activity in winter at such locations (Diendorfer et al., 2015). Preliminary results indicate that these lightning events occur in wind-field thunderstorms, corroborating the findings of this study (Stucke et al., 2022).
Our results show that in order to distinguish physically different thunderstorm types, atmospheric variables describing wind field, mass field, and cloud physics must be included (cf. Figs. 2–4). Identifying thunderstorms and lightning from single or just a few atmospheric proxy variables is inaccurate. Using only CAPE (or related) variables will even completely miss the wind-field thunderstorm class where different physical processes are at work.
In most mid-latitude regions, lightning in winter contributes only a few percent to the annual number of flashes. In our study region in northern Germany, there is approximately 70 times more lightning in summer than in winter. We investigated whether the same atmospheric conditions as for summertime thunderstorms were at play in winter but only occurred much less frequently and less pronounced or whether winter thunderstorms were physically different.
Following a data-driven approach, we used 35 atmospheric variables from the ERA5 reanalysis belonging to five meteorological categories (mass field, wind field, cloud physics, moisture field, and surface exchange) and fed them independent of each other into a clustering and a principal component algorithm. These hourly data are linked to observations with and without lightning in winter (DJF) and summer (JJA), and the variables have shown to be potentially relevant for lightning.
The statistical analysis returned four clusters (thunderstorm types) that have the same physical interpretation with respect to their cluster means. The two main lightning types consist of events for which ERA5 variables in either the wind-field (wind-field thunderstorms) or the mass-field (CAPE thunderstorms) category strongly deviate from their means. The other two types are variants of the wind-field thunderstorm and CAPE thunderstorm, respectively, for which additionally the cloud-physics variables strongly deviate from their mean values. Our study region is struck by lightning from wind-field thunderstorms predominantly (88 %) in the cold season, whereas CAPE thunderstorm lightning occurs only in the warm season (98 %).
Differently charged layers in the atmosphere are thought to come about by the collision of different types of cloud particles and hydrometeors such as ice crystals and graupel during which charge is transferred, followed by a subsequent size-dependent separation. The required terminal velocities in CAPE thunderstorms originate from strong vertical velocities when substantial amounts of CAPE are released. The median value of CAPE in CAPE thunderstorms in our study region is 415 J kg−1. For wind-field thunderstorms, the strong velocities occur mostly horizontally but with a strong vertical shear so that the charge separation happens along a slanted path.
Wind-field thunderstorms are characterized by horizontal wind speeds that approximately triple in the lowest kilometer (Fig. 5) to reach median values of more than 20 m s−1 and even more than 27 m s−1 for the variant with pronounced cloud-physics variables. Consequently, the dissipation of kinetic energy in the boundary layer and boundary layer height is also increased. Synoptically, wind-field thunderstorms occur in the left exit region at the cold and cyclonic side of the jet with inflow from the west-northwest. It is the region of cyclogenesis, strong updrafts, and large-scale precipitation. These larger-scale patterns occur mostly in winter. Clouds are shallow and close to the ground. Especially in the thunderstorm types with enhanced cloud physics, most parts of the clouds are warmer than −10 ∘C, and, integrated over their depth, wind-field thunderstorm clouds are warmer than CAPE thunderstorm clouds. This results in a larger fraction of cloud droplets, warmer snow, and shallow regions consisting only of hydrometeors. The wind-field thunderstorm type with increased cloud-physics variables stands out by even larger deviations in the previously mentioned variables and occurs in similar weather patterns.
CAPE thunderstorms have large CAPE values and convective inhibition (CIN) present and are further characterized by deep, cold clouds with a dominating region consisting of suspended ice particles and solid hydrometeors. They take place in summer. Synoptically, CAPE thunderstorms in northern Germany occur in southwesterly flow at the anticyclonic side of the jet. Usually, warm and moist air is advected from the Mediterranean Sea. The variant of CAPE thunderstorms with much higher values in the cloud-physics variables occurs in similar weather patterns and with mass-field values similar to the CAPE thunderstorm type. However, the clouds are deeper and have larger amounts of cloud particles accompanied by strong updrafts and large precipitation amounts.
In summary, the data-driven approach yielded physically different types of thunderstorms, for which the defining larger-scale flow situations also vary seasonally. Winter lightning is therefore not just a weaker and rarer sibling of summer lightning but driven by wind-field variables instead of mass-field variables.
A precise variable description, the data of the representative sample presented here, an R script that reproduces the core analysis and Figs. 2–4, and the results from an analog analysis also covering the intermediate seasons spring and fall are available at https://doi.org/10.5281/zenodo.5851700 (Morgenstern et al., 2022).
ERA5 data are freely available from the Copernicus Climate Change Service (C3S) Climate Data Store (Hersbach et al., 2020; https://cds.climate.copernicus.eu, last access: 19 April 2021). We use ERA5 hourly data from 1979 to present on single level, pressure level, and model level (https://doi.org/10.24381/cds.adbb2d47, Hersbach et al., 2018a; https://doi.org/10.24381/cds.bd0915c6, Hersbach et al., 2018b; https://confluence.ecmwf.int/display/CKB/How+to+download+ERA5, last access: 19 April 2021). The results contain modified Copernicus Climate Change Service information for 2010–2019. Neither the European Commission nor ECMWF is responsible for any use that may be made of the Copernicus information or data it contains. EUCLID (Poelman et al., 2016; Schulz et al., 2016) data are available on request from ALDIS (Austrian Lightning Detection & Information System, aldis@ove.at) or Siemens BLIDS (Blitzinformationsdienst, fees may apply).
Calculations are performed using R (https://www.R-project.org/, R Core Team, 2021), Python 3 (https://www.python.org/, Van Rossum and Drake, 2009), and CDO (Climate Data Operator; https://doi.org/10.5281/zenodo.3539275, Schulzweida, 2019). Specifically the following packages were used: ncdf4 (https://CRAN.R-project.org/package=ncdf4, Pierce, 2019), sf (simple features; https://r-spatial.github.io/sf/index.html, Pebesma, 2018), stars (https://CRAN.R-project.org/package=stars, Pebesma, 2021), rnaturalearth (https://CRAN.R-project.org/package=rnaturalearth, South, 2017), and xarray (Hoyer and Hamman, 2017). We are using the netCDF4 data format (https://doi.org/10.5065/D6H70CW6, Unidata, 2020).
DM performed the investigation, wrote the software, visualized the results, and wrote the paper. IS, TS, and DM performed the data curation, built the data set, and derived variables based on ERA5 data. TS contributed coding concepts. GJM provided support for the meteorological analysis, data organization, and funding acquisition. AZ supervised the formal analysis and interpretation of the statistical methods. AZ, GJM, and TS are the project administrators and supervisors. All authors contributed to the conceptualization of this paper, discussed the methodology, evaluated the results, and commented on the paper.
The contact author has declared that neither they nor their co-authors have any competing interests.
Publisher's note: Copernicus Publications remains neutral with regard to jurisdictional claims in published maps and institutional affiliations.
We are grateful to Gerhard Diendorfer and Wolfgang Schulz from ALDIS for data support and discussions about lightning physics and to Siemens BLIDS for providing EUCLID data. We thank Johannes Horak for his code for calculating the geopotential. Finally, we thank the editor and two anonymous reviewers for their valuable comments.
This research has been supported by the Österreichische Forschungsförderungsgesellschaft (FFG; grant no. 872656) and the Austrian Science Fund (Fonds zur Förderung der wissenschaftlichen Forschung, FWF; grant no. P 31836).
This paper was edited by Johannes Dahl and reviewed by two anonymous referees.
Bentley, M. L., Riley, C., and Mazur, E.: A Winter-Season Lightning Climatology for the Contiguous United States, Meteorol. Atmos. Phys., 131, 1327–1340, https://doi.org/10.1007/s00703-018-0641-2, 2019. a
Brook, M., Nakano, M., Krehbiel, P., and Takeuti, T.: The Electrical Structure of the Hokuriku Winter Thunderstorms, J. Geophys. Res.-Oceans, 87, 1207–1215, https://doi.org/10.1029/JC087iC02p01207, 1982. a, b, c, d, e, f
Cotton, W., Bryan, G., and van den Heever, S.: Storm and Cloud Dynamics. The Dynamics of Clouds and Precipitating Mesoscale Systems, International Geophysics Series, vol. 99, Academic Press, 2nd edn., ISBN 978-0-12-0885428, 2011. a
Dewan, A., Ongee, E. T., Rafiuddin, M., Rahman, M. M., and Mahmood, R.: Lightning Activity Associated with Precipitation and CAPE Over Bangladesh, Int. J. Climatol., 38, 1649–1660, https://doi.org/10.1002/joc.5286, 2018. a
Diendorfer, G., Pichler, H., and Mair, M.: Some Parameters of Negative Upward-Initiated Lightning to the Gaisberg Tower (2000–2007), IEEE T. Electromagn. C., 51, 443–452, https://doi.org/10.1109/TEMC.2009.2021616, 2009. a
Diendorfer, G., Pichler, H., and Schulz, W.: LLS Detection of Upward Initiated Lightning Flashes, in: Proc. 9th Asia-Pacific International Conference on Lightning (APL), 23—26 June 2015, Nagoya, Japan, TC2.2-7, p. 5, https://www.ove.at/fileadmin/user_upload/aldis/publication/2015/2_APL2015_Diendorfer.pdf (last access: 17 June 2021), 2015. a
Doswell III, C. A.: The Distinction between Large-Scale and Mesoscale Contribution to Severe Convection: A Case Study Example, Weather Forecast., 2, 3–16, https://doi.org/10.1175/1520-0434(1987)002<0003:TDBLSA>2.0.CO;2, 1987. a
Dotzek, N., Rabin, R. M., Carey, L. D., MacGorman, D. R., McCormick, T. L., Demetriades, N. W., Murphy, M. J., and Holle, R. L.: Lightning Activity Related to Satellite and Radar Observations of a Mesoscale Convective System over Texas on 7–8 April 2002, Atmos. Res., 76, 127–166, https://doi.org/10.1016/j.atmosres.2004.11.020, 2005. a
Engholm, C. D., Williams, E. R., and Dole, R. M.: Meteorological and Electrical Conditions Associated with Positive Cloud-to-Ground Lightning, Mon. Weather Rev., 118, 470–487, https://doi.org/10.1175/1520-0493(1990)118<0470:MAECAW>2.0.CO;2, 1990. a, b
Etten-Bohm, M., Yang, J., Schumacher, C., and Jun, M.: Evaluating the Relationship Between Lightning and the Large-Scale Environment and its Use for Lightning Prediction in Global Climate Models, J. Geophys. Res.-Atmos., 126, 1–18, https://doi.org/10.1029/2020JD033990, 2021. a
Gatzen, C. P., Fink, A. H., Schultz, D. M., and Pinto, J. G.: An 18 year climatology of derechos in Germany, Nat. Hazards Earth Syst. Sci., 20, 1335–1351, https://doi.org/10.5194/nhess-20-1335-2020, 2020. a
Goto, Y. and Narita, K.: Electrical Characteristics of Winter Lightning, J. Atmos. Terr. Phys., 57, 449–458, https://doi.org/10.1016/0021-9169(94)00072-V, 1995. a
Hartigan, J. A. and Wong, M.: A K-Means Clustering Algorithm, J. Roy. Stat. Soc. C-Appl., 28, 100–108, https://doi.org/10.2307/2346830, 1979. a
Hersbach, H., Bell, B., Berrisford, P., Biavati, G., Horányi, A., Muñoz Sabater, J., Nicolas, J., Peubey, C., Radu, R., Rozum, I., Schepers, D., Simmons, A., Soci, C., Dee, D., and Thépaut, J.-N.: ERA5 hourly data on single levels from 1979 to present, Copernicus Climate Change Service (C3S) Climate Data Store (CDS) [data set], https://doi.org/10.24381/cds.adbb2d47, 2018a. a
Hersbach, H., Bell, B., Berrisford, P., Biavati, G., Horányi, A., Muñoz Sabater, J., Nicolas, J., Peubey, C., Radu, R., Rozum, I., Schepers, D., Simmons, A., Soci, C., Dee, D., and Thépaut, J.-N.: ERA5 hourly data on pressure levels from 1979 to present, Copernicus Climate Change Service (C3S) Climate Data Store (CDS) [data set], https://doi.org/10.24381/cds.bd0915c6, 2018b. a
Hersbach, H., Bell, B., Berrisford, P., Hirahara, S., Horányi, A., Muñoz-Sabater, J., Nicolas, J., Peubey, C., Radu, R., Schepers, D., Simmons, A., Soci, C., Abdalla, S., Abellan, X., Balsamo, G., Bechtold, P., Biavati, G., Bidlot, J., Bonavita, M., De Chiara, G., Dahlgren, P., Dee, D., Diamantakis, M., Dragani, R., Flemming, J., Forbes, R., Fuentes, M., Geer, A., Haimberger, L., Healy, S., Hogan, R. J., Hólm, E., Janisková, M., Keeley, S., Laloyaux, P., Lopez, P., Lupu, C., Radnoti, G., de Rosnay, P., Rozum, I., Vamborg, F., Villaume, S., and Thépaut, J.-N.: The ERA5 Global Reanalysis, Q. J. Roy. Meteor. Soc., 146, 1999–2049, https://doi.org/10.1002/qj.3803, 2020. a, b
Hoyer, S. and Hamman, J.: xarray: N-D Labeled Arrays and Datasets in Python, Journal of Open Research Software, 5, 10, https://doi.org/10.5334/jors.148, 2017. a
Ishii, M. and Saito, M.: Lightning Electric Field Characteristics Associated With Transmission-Line Faults in Winter, IEEE T. Electromagn. C., 51, 459–465, https://doi.org/10.1109/TEMC.2009.2025496, 2009. a
Johns, R. H., Davies, J. M., and Leftwich, P. W.: Some Wind and Instability Parameters Associated with Strong and Violent Tornadoes: 2. Variations in the Combinations of Wind and Instability Parameters, Geophysical Monograph Series, American Geophysical Union, 583–590, https://doi.org/10.1029/gm079p0583, 1993. a
Kaltenböck, R., Diendorfer, G., and Dotzek, N.: Evaluation of Thunderstorm Indices from ECMWF Analyses, Lightning Data and Severe Storm Reports, Atmos. Res., 93, 381–396, https://doi.org/10.1016/j.atmosres.2008.11.005, 2009. a, b
Kolendowicz, L., Taszarek, M., and Czernecki, B.: Atmospheric Circulation and Sounding-Derived Parameters Associated with Thunderstorm Occurrence in Central Europe, Atmos. Res., 191, 101–114, https://doi.org/10.1016/j.atmosres.2017.03.009, 2017. a, b, c, d
Levin, Z., Yair, Y., and Ziv, B.: Positive Cloud-to-Ground Flashes and Wind Shear in Tel-Aviv Thunderstorms, Geophys. Res. Lett., 23, 2231–2234, https://doi.org/10.1029/96GL00709, 1996. a
Liu, D., Qie, X., Xiong, Y., and Feng, G.: Evolution of the Total Lightning Activity in a Leading-Line and Trailing Stratiform Mesoscale Convective System over Beijing, Adv. Atmos. Sci., 28, 866–878, https://doi.org/10.1007/s00376-010-0001-8, 2011. a
López, J. A., Pineda, N., Montanyà, J., van der Velde, O., Fabró, F., and Romero, D.: Spatio-temporal dimension of lightning flashes based on three-dimensional Lightning Mapping Array, Atmos. Res., 197, 255–264, https://doi.org/10.1016/j.atmosres.2017.06.030, 2017. a
MacQueen, J. B.: Some Methods for Classification and Analysis of Multivariate Observations, in: Proc. of the Fifth Berkeley Symposium on Mathematical Statistics and Probability, 21 June–18 July 1965 and 27 December 1965–7 January 1966, Statistical Laboratory of the University of California, Berkeley, USA, vol. 1, edited by: Cam, L. M. L. and Neyman, J., University of California Press, 281–297, https://projecteuclid.org/proceedings/berkeley-symposium-on-mathematical-statistics-and-probability/proceedings-of-the-fifth-berkeley-symposium-on-mathematical-statistics-and-probability-volume-1-statistics/toc/bsmsp/1200512974 (last access: 30 March 2022), 1967. a, b
Mardia, K. V., Kent, J. T., and Bibby, J. M.: Multivariate Analysis, Probability and Mathematical Statistics, Academic Press, London, 10th edn., ISBN 0-12-471250-9, 1995. a
Markowski, P. and Richardson, Y.: Mesoscale Meteorology in Midlatitudes, vol. 2, John Wiley & Sons, Ltd., https://doi.org/10.1002/9780470682104, 2010. a
Martin, J. E.: Mid-Latitude Atmospheric Dynamics: A First Course, John Wiley & Sons, Chichester, ISBN 9780470864654, 2006. a, b
Matsui, M., Michishita, K., and Yokoyama, S.: Cloud-to-Ground Lightning Flash Density and the Number of Lightning Flashes Hitting Wind Turbines in Japan, Electr. Pow. Syst. Res., 181, 106066, https://doi.org/10.1016/j.epsr.2019.106066, 2020. a, b
Mora, M., Riesco, J., de Pablo Dávila, F., and Rivas Soriano, L.: Atmospheric Background Associated with Severe Lightning Thunderstorms in Central Spain, Int. J. Climatol., 35, 558–569, https://doi.org/10.1002/joc.4002, 2015. a
Morgenstern, D., Stucke, I., Simon, T., Mayr, G. J., and Zeileis, A.: Differentiating lightning in winter and summer with characteristics of wind field and mass field: supplementary material, Zenodo [data set, code], https://doi.org/10.5281/zenodo.5851700, 2022. a, b, c, d, e, f, g, h
Pebesma, E.: Simple Features for R: Standardized Support for Spatial Vector Data, R J., 10, 439–446, https://doi.org/10.32614/RJ-2018-009, 2018 (code available at: https://r-spatial.github.io/sf/index.html, last access: 30 March 2022). a
Pebesma, E.: stars: Spatiotemporal Arrays, Raster and Vector Data Cubes, R package version 0.5-3 [code], https://CRAN.R-project.org/package=stars, last access: 8 June 2021. a
Pierce, D.: ncdf4: Interface to Unidata netCDF (Version 4 or Earlier) Format Data Files, R package version 1.17 [code], https://CRAN.R-project.org/package=ncdf4 (last access: 30 March 2022), 2019. a
Poelman, D. R., Schulz, W., Diendorfer, G., and Bernardi, M.: The European lightning location system EUCLID – Part 2: Observations, Nat. Hazards Earth Syst. Sci., 16, 607–616, https://doi.org/10.5194/nhess-16-607-2016, 2016. a, b, c
R Core Team: R: A Language and Environment for Statistical Computing, R Foundation for Statistical Computing, Vienna, Austria, R version 4.1.3 [code], https://www.R-project.org/ (last access: 10 March 2022), 2021. a
Rakov, V. A.: A Review of Positive and Bipolar Lightning Discharges, B. Am. Meteorol. Soc., 84, 767–776, https://doi.org/10.1175/BAMS-84-6-767, 2003. a
Rakov, V. A. and Uman, M. A.: Lightning: Physics and Effects, Cambridge University Press, ISBN 9780521035415, 2003. a
Rizzoli, P., Martone, M., Gonzalez, C., Wecklich, C., Tridon, D. B., Bräutigam, B., Bachmann, M., Schulze, D., Fritz, T., Huber, M., Wessel, B., Krieger, G., Zink, M., and Moreira, A.: Generation and Performance Assessment of the Global TanDEM-X Digital Elevation Model, ISPRS J. Photogramm., 132, 119–139, https://doi.org/10.1016/j.isprsjprs.2017.08.008, 2017. a
Salvador, A., Pineda, N., Montanyà, J., López, J. A., and Solà, G.: Thunderstorm Charge Structures Favouring Cloud-to-Ground Lightning, Atmos. Res., 257, 105577, https://doi.org/10.1016/j.atmosres.2021.105577, 2021. a
Saunders, C.: Charge Separation Mechanisms in Clouds, in: Planetary Atmospheric Electricity. Space Sciences Series od ISSI, vol. 30, edited by: Leblanc, F., Aplin, K., Yair, Y., Harrison, R., Lebreton, J., and Blanc, M., Springer, 137, 335–353, https://doi.org/10.1007/s11214-008-9345-0, 2008. a
Schulz, W., Diendorfer, G., Pedeboy, S., and Poelman, D. R.: The European lightning location system EUCLID – Part 1: Performance analysis and validation, Nat. Hazards Earth Syst. Sci., 16, 595–605, https://doi.org/10.5194/nhess-16-595-2016, 2016. a, b
Schulzweida, U.: CDO User Guide, Zenodo [code], https://doi.org/10.5281/zenodo.3539275, 2019. a
Sherburn, K. D. and Parker, M. D.: Climatology and Ingredients of Significant Severe Convection in High-Shear, Low-CAPE Environments, Weather Forecast., 29, 854–877, https://doi.org/10.1175/WAF-D-13-00041.1, 2014. a
South, A.: rnaturalearth: World Map Data from Natural Earth, R package version 0.1.0 [code], https://CRAN.R-project.org/package=rnaturalearth (last access: 30 March 2022), 2017. a
Stolz, D. C., Rutledge, S. A., Pierce, J. R., and van den Heever, S. C.: A Global Lightning Parameterization Based on Statistical Relationships Among Environmental Factors, Aerosols, and Convective Clouds in the TRMM Climatology, J. Geophys. Res.-Atmos., 122, 7461–7492, https://doi.org/10.1002/2016JD026220, 2017. a
Stucke, I., Morgenstern, D., Diendorfer, G., Mayr, G. J., Pichler, H., Schulz, W., Simon, T., and Zeileis, A.: Upward Lightning at Tall Structures: Atmospheric Drivers for Trigger Mechanisms and Flash Type, arXiv [preprint], arXiv:2201.05663v2, 2 February 2022. a
Takagi, N., Takeuti, T., and Nakai, T.: On the Occurrence of Positive Ground Flashes, J. Geophys. Res.-Atmos., 91, 9905–9909, https://doi.org/10.1029/JD091iD09p09905, 1986. a
Takahashi, T., Sugimoto, S., Kawano, T., and Suzuki, K.: Microphysical Structure and Lightning Initiation in Hokuriku Winter Clouds, J. Geophys. Res.-Atmos., 124, 13156–13181, https://doi.org/10.1029/2018JD030227, 2019. a, b, c
Takeuti, T., Nakano, M., Brook, M., Raymond, D. J., and Krehbiel, P.: The Anomalous Winter Thunderstorms of the Hokuriku Coast, J. Geophys. Res.-Oceans, 83, 2385–2394, https://doi.org/10.1029/JC083iC05p02385, 1978. a, b, c, d
Taszarek, M., Allen, J., Púčik, T., Groenemeijer, P., Czernecki, B., Kolendowicz, L., Lagouvardos, K., Kotroni, V., and Schulz, W.: A Climatology of Thunderstorms across Europe from a Synthesis of Multiple Data Sources, J. Climate, 32, 1813–1837, https://doi.org/10.1175/JCLI-D-18-0372.1, 2019. a
Unidata: Network Common Data Form (netCDF), UCAR/Unidata, Boulder, CO [code], https://doi.org/10.5065/D6H70CW6, 2020. a
Van Rossum, G. and Drake, F. L.: Python 3 Reference Manual, Python Documentation Manual Part 2, CreateSpace Independent Publishing Platform, Scotts Valley, CA [code], https://www.python.org/ (last access: 30 March 2022), 2009. a
Vogel, S., Holbøll, J., López, J., Garolera, A. C., and Madsen, S. F.: European Cold Season Lightning Map for Wind Turbines Based on Radio Soundings, in: 2016 33rd International Conference on Lightning Protection (ICLP), 25–30 September 2016, Estoril, Portugal, 16556461, https://doi.org/10.1109/ICLP.2016.7791373, 2016. a, b
Wang, D. and Takagi, N.: Characteristics of Winter Lightning that Occurred on a Windmill and its Lightning Protection Tower in Japan, IEEJ Transactions on Power and Energy, 132, 568–572, https://doi.org/10.1541/ieejpes.132.568, 2012. a
Wang, D., Zheng, D., Wu, T., and Takagi, N.: Winter Positive Cloud-to-Ground Lightning Flashes Observed by LMA in Japan, IEEJ T. Electr. Electr., 16, 402–411, https://doi.org/10.1002/tee.23310, 2021. a, b
Wapler, K.: High-Resolution Climatology of Lightning Characteristics within Central Europe, Meteorol. Atmos. Phys., 122, 175–184, https://doi.org/10.1007/s00703-013-0285-1, 2013. a
Wessel, B., Huber, M., Wohlfart, C., Marschalk, U., Kosmann, D., and Roth, A.: Accuracy Assessment of the Global TanDEM-X Digital Elevation Model with GPS Data, ISPRS J. Photogramm., 139, 171–182, https://doi.org/10.1016/j.isprsjprs.2018.02.017, 2018. a
Westermayer, A., Groenemeijer, P., Pistotnik, G., Sausen, R., and Faust, E.: Identification of Favorable Environments for Thunderstorms in Reanalysis Data, Meteorol. Z., 26, 59–70, https://doi.org/10.1127/metz/2016/0754, 2016. a
Williams, E.: Lightning Activity in Winter Storms: A Meteorological and Cloud Microphysical Perspective, IEEJ Transactions on Power and Energy, 138, 364–373, https://doi.org/10.1541/ieejpes.138.364, 2018. a, b, c, d, e, f
Williams, E., Mushtak, V., Rosenfeld, D., Goodman, S., and Boccippio, D.: Thermodynamic Conditions Favorable to Superlative Thunderstorm Updraft, Mixed Phase Microphysics and Lightning Flash Rate, Atmos. Res., 76, 288–306, https://doi.org/10.1016/j.atmosres.2004.11.009, 2005. a
WMO: International Meteorological Vocabulary, WMO, Publication no. 182, 2nd edn., https://library.wmo.int/doc_num.php?explnum_id=4712 (last access: 18 August 2021), 1992. a
Wu, T., Wang, D., and Takagi, N.: Compact Lightning Strokes in Winter Thunderstorms, J. Geophys. Res.-Atmos., 126, e2021JD034932, https://doi.org/10.1029/2021JD034932, 2021. a
Yoshida, S., Yoshikawa, E., Adachi, T., Kusunoki, K., Hayashi, S., and Inoue, H.: Three-Dimensional Radio Images of Winter Lightning in Japan and Characteristics of Associated Charge Structure, IEEJ T. Electr. Electr., 14, 175–184, https://doi.org/10.1002/tee.22795, 2018. a, b, c
Graupel and snow are not distinguished in the ERA5 reanalysis, which has only one summarizing variable of solid hydrometeors.