the Creative Commons Attribution 4.0 License.
the Creative Commons Attribution 4.0 License.
 | 13 Apr 2022
Extreme Atlantic hurricane seasons made twice as likely by ocean warming
Peter Pfleiderer
Shruti Nath
Carl-Friedrich Schleussner
Tropical cyclones are among the most damaging extreme weather events. An increase in Atlantic tropical cyclone activity has been observed, but attribution to global warming remains challenging due to large inter-annual variability and modeling challenges. Here we show that the increase in Atlantic tropical cyclone activity since the 1980s can be robustly ascribed to variations in atmospheric circulation as well as sea surface temperature (SST) increase. Based on a novel weather-pattern-based statistical model, we find that the forced warming trend in Atlantic SSTs over the 1982–2020 period has doubled the probability of extremely active tropical cyclone seasons. For the year 2020, our results suggest that such an exceptionally intense season might have been made twice as likely by ocean surface warming. In our statistical model, seasonal atmospheric circulation remains the dominant factor explaining the inter-annual variability and the occurrence of very active seasons. However, our study underscores the importance of rising SSTs that lead to more extreme outcomes in terms of cyclone intensity for the same seasonal atmospheric patterns. Our findings provide a new perspective on the contribution of ocean warming to the increase in recent hurricane activity and illustrate how anthropogenic climate change has contributed to a decisive increase in Atlantic tropical cyclone season activity over the observational period.
- Article
(2348 KB) - Full-text XML
-
Supplement
(5721 KB) - BibTeX
- EndNote


Tropical cyclones (TCs) are highly destructive extreme weather events (MunichRe, 2021), with a notable increase in intensity and associated damages over recent decades (Kossin et al., 2013, 2020; Holland and Bruyère, 2014; Knutson et al., 2019). Under anthropogenically caused climate change, the impact severity of TCs is exacerbated due to more extreme precipitation (van Oldenborgh et al., 2017; Reed et al., 2020) and increased risk of storm surges following from sea level rise (Lin et al., 2016), amongst others.
Whether the observed increase in TC intensity arises from a long-term trend related to global warming, however, remains unresolved. While climate models project an increase in TC intensities (Bhatia et al., 2018; Walsh et al., 2016; Knutson et al., 2020), a recent study suggests that after correcting for missing storm observations prior to satellite observation there is no robust long-term trend in Atlantic major hurricane counts (Vecchi et al., 2022).
TC formation and intensification mostly depends on the atmospheric environment, which varies strongly on inter-annual and intra-seasonal timescales. TC formation mainly requires low vertical wind shear and strong low-level relative vorticity (Frank and Ritchie, 2001; Sharmila and Walsh, 2017) alongside some initial perturbation (Dieng et al., 2017). The maximal potential intensity of a storm mostly depends on the vertical temperature gradient from the ocean surface to the upper troposphere (Emanuel, 1987; Emanuel et al., 2013). Whether a storm reaches its maximum potential intensity is, however, strongly constrained by the large-scale atmospheric circulation. As a result, substantial uncertainties on the impacts of dynamical effects of global warming on changes in TCs globally still exist (Knutson et al., 2019, 2020).
Given the large uncertainty in forced atmospheric circulation changes and assuming that these changes are small in comparison to internal variability (Trenberth et al., 2015), a promising way forward could be to focus on thermodynamically forced changes instead. Using a numerical TC forecast model, Reed et al. (2020) attributed a portion of the rainfall of Hurricane Florence to thermodynamic effects of global warming. This study followed the story-line approach in which dynamical conditions of the weather event are reproduced for different counterfactual thermodynamic forcings. Such approaches are, however, restricted to individual events with clearly defined atmospheric conditions and cannot be directly generalized to seasonal TC activity (Reed et al., 2020).
For a more generalizable approach, the role of internal variability needs to be established and separated from the potential thermodynamic forcing (Shepherd, 2016). Climate models could be used to this extent (Sippel et al., 2019), but this would require a large ensemble of climate simulations with adequate TC representation. Alternatively, circulation analogues can be used. For example, Cattiaux et al. (2010) reproduced European winter temperatures based on observed circulation patterns and their influence on local temperatures.
Here we follow the idea of circulation analogues to construct a probabilistic tropical cyclone season emulator based on the empirically assessed influence of atmospheric circulation patterns over the tropical north Atlantic on TC activity. We find that the sequence of weather patterns throughout the main hurricane season (August–October) explains most of the inter-annual variability in number of storms and their intensities. The full observed variability in TC activity can be reproduced by including sea-surface temperatures (SSTs) over the main development region (MDR see Fig. S6 in the Supplement) as an amplifying factor for most intense TCs. Using counterfactual experiments, we furthermore investigate the extent to which trends in Atlantic SSTs contribute to highly active tropical cyclone seasons under current climatic conditions.
2.1 Data and preprocessing
For the classification of weather patterns we use mean sea level pressure (MSLP) and vertical wind shear (VWS) calculated as the difference between 200 and 850 hPa eastward wind from the ERA5 reanalysis (Hersbach et al., 2020) over the period 1982–2020. Weather patterns are classified over the tropical north Atlantic (10–90∘ W and 10–30∘ N). For the following pre-processing we transform the data from the original 0.28∘ × 0.28∘ to a 1∘ × 1∘ grid. In order to remove the direct influence of TCs in the reanalysis data, we replace the 3 × 3 grid-cell square area encompassing the center of the storm with the average of its surrounding 16 grid cells. Finally, we transform the data from a 1∘ × 1∘ grid to a 2.5∘ × 2.5∘ grid and average 6-hourly data to daily data.
For the construction and validation of the TC emulator, we use daily sea surface temperatures (SST) from the Daily Optimum Interpolation Sea Surface Temperature (DOISST) dataset (Huang et al., 2021). SSTs are averaged over the Atlantic main development region (MDR) defined as 90–20∘ W and 10–20∘ N (see Fig. S6). The majority of Atlantic TCs originate and develop in this region. Since the MDR is commonly used in the literature, we choose to use it here even though it is slightly smaller than the region we use to classify weather patterns.
We use historical climate model simulations from the sixth phase of the Coupled Model Intercomparison Project (CMIP6) to estimate anthropogenically forced trends in Atlantic MDR SSTs over the period 1982–2014. A list of the used models can be found in Table S1 in the Supplement. As a reference for longer SST observations, the Hadley Centre Sea Ice and Sea Surface Temperature dataset (HadISST) is used (Rayner et al., 2003).
We use TC observations from the World Meteorological Organization (WMO) agency provided by the International Best Track Archive for Climate Stewardship (IBTrACS) database (Knapp et al., 2010, 2018). Only storms in the Atlantic basin that are classified as tropical storms are considered, resulting in a total number of 454 storms. Following Bell et al. (2000), we use accumulated cyclone energy (ACE) as a measure of seasonal TC activity:
where vmax is the 6-hourly sustained wind speed in knots (kn) of storms that have at least tropical storm strength according to the Saffir–Simpson hurricane wind scale ( kn).
TCs are classified according to the Saffir–Simpson hurricane wind scale, according to which TCs with sustained winds of more than 64 kn are named hurricanes and TCs with sustained winds above 96 kn are major hurricanes. Following the definitions of the National Oceanic and Atmospheric Administration (NOAA) National Weather Service (CPC, 2021), we classify Atlantic hurricane seasons into above-normal seasons if they produce more than 126.1 ACE or extremely active seasons if the produced more than 159.6 ACE.
2.2 Daily tropical Atlantic weather patterns and sea surface temperatures
We use a self-organizing map algorithm (SOM) to classify daily tropical Atlantic weather into 20 patterns. A SOM is an artificial neural network that is used for dimensionality reduction and can be applied to classify synoptic weather patterns (Hewitson and Crane, 2002). Here we reduce the highly dimensional information of mean sea level pressure (MSLP) and vertical wind shear (VWS) over a 2.5∘ × 2.5∘ grid spanning 10–30∘ N and 90–10∘ W to a 5 × 4 map where each node represents a weather pattern (see Figs. S1–S2). We use an initialization that is based on a principal component analysis to guarantee the reproducibility of the results.
To guarantee that both variables (MSLP and VWS) have equal weight in the classification, we standardize the variables to the 1982–2011 mean and standard deviation. The combination of these two variables is a suitable choice for our application as TC formation and intensification strongly depends on VWS, while MSLP is generally helpful to characterize the prevailing atmospheric circulation.
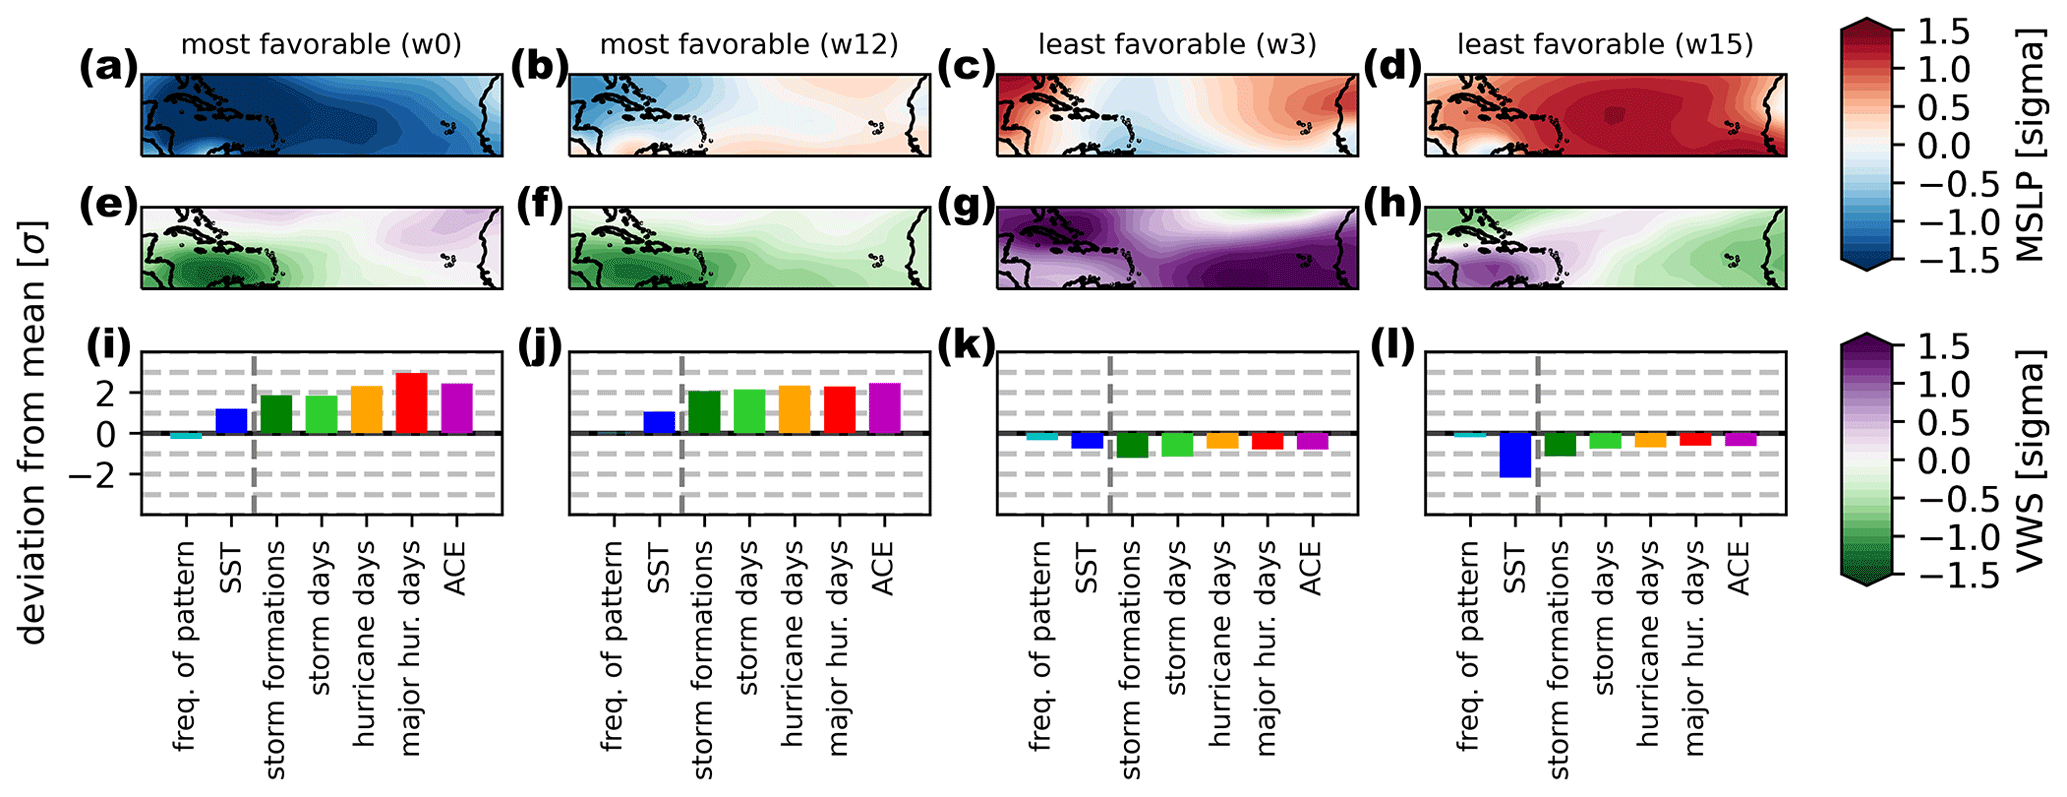
Figure 1Tropical cyclone activity during selected weather patterns. Mean sea level pressure anomalies (a–d) and vertical wind shear anomalies (e–h) for four selected weather patterns w0, w12, w3 and w15. The last row (i–l) shows relative deviations from the average of all weather patterns expressed in standard deviations for the following statistics: frequency of the weather pattern, SST in the MDR, number of storm formations during the weather pattern, storm days, hurricane days, major hurricane days and average ACE generated during days with this weather pattern. A value of 2 indicates that the statistic is 2 standard deviations higher during this weather pattern than for the average over all weather patterns. All 20 weather patterns are shown in Figs. S1, S2 and S3.
Some selected weather patterns are shown in Fig. 1: strong TC activity is observed during weather pattern w0, which is characterized by a large low-pressure anomaly and nearly no vertical wind shear in the east of the MDR. Strong VWS in this region leads to fewer and weaker storms (see weather pattern w3). A strong high-pressure anomaly as in weather pattern w15 is similarly TC inhibiting. A weak pressure gradient from west to east with low VWS in the MDR is associated with high TC activity (w12). All 20 weather patterns are shown in the Supplement (Figs. S1, S2, S3).
The intensities of TCs also depend on SSTs in the region. As shown in Fig. S7, the strongest storms are found over warm SSTs. A quantile regression shows a significant relationship between warm SSTs and above median TC intensities. Weather patterns are not fully independent from SSTs: weather patterns with low-pressure anomalies occur more often on days with warm SST anomalies (see Fig. 1 blue bars). However, no systematic association between SSTs and VWS is apparent (see Figs. S1 and S3). Although we will not be able to treat our weather patterns as independent from SST anomalies in the region, both variables contain distinct information that is relevant for TC intensification.
2.3 Seasonal tropical cyclone emulator
We construct a probabilistic emulator that creates series of storms with maximum sustained wind speeds for each day. TCs are rare events, and their formation and intensification involves complex physical processes. In our emulator we break these processes down into three components that are fully independent from each other: (i) storm formation, (ii) storm duration and (iii) daily storm intensity. In these components the daily weather pattern slightly alters the probabilities for a new storm formation and its duration, and the weather pattern in combination with regionally averaged SSTs alters the probabilities for intensification of an existing storm (see Fig. 2).
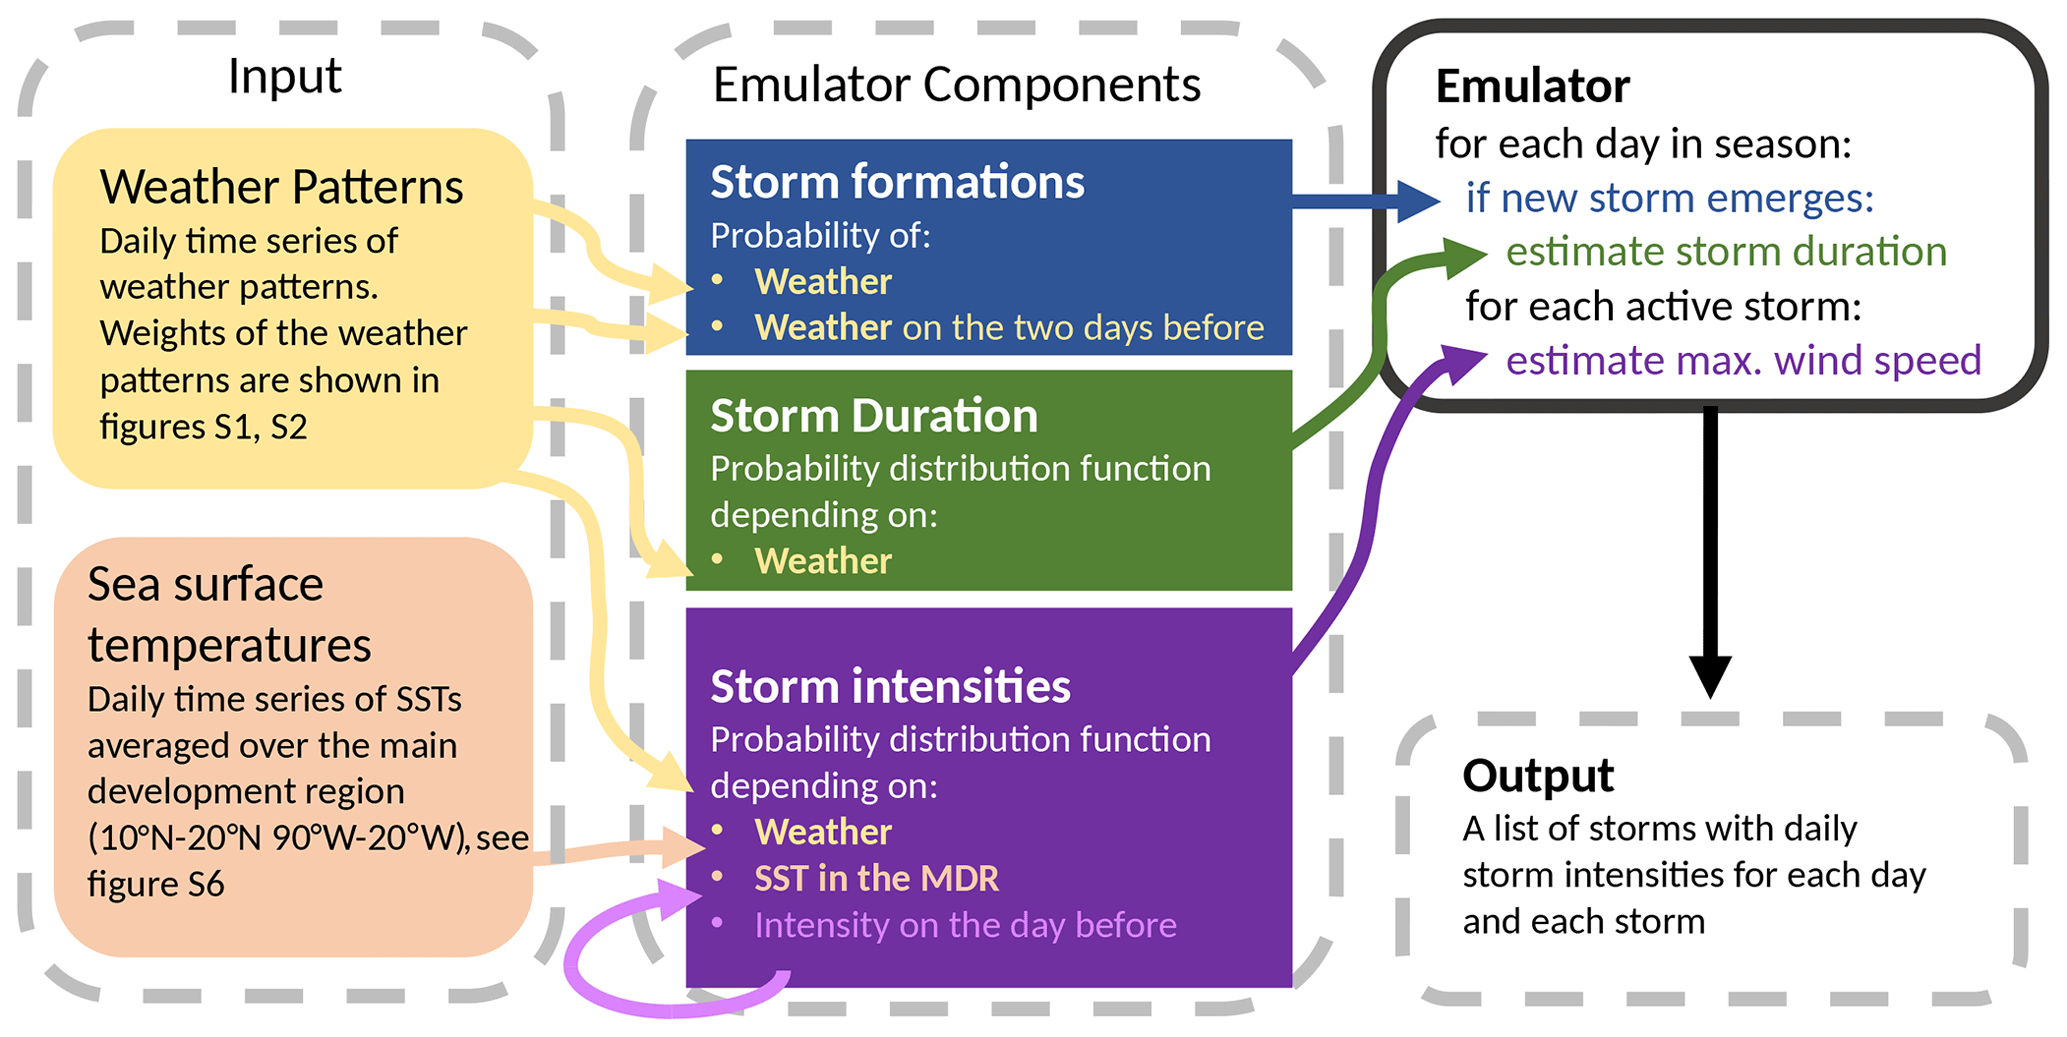
Figure 2Schematic overview of the emulator. The input required to emulate TC seasons is shown on the left side. In the center, the three components of the emulator are listed. On the right side, the functioning of the emulator is shown and the format of the output is indicated. Arrows between the left-hand columns indicate which input is used in which components of the emulator. The light-purple arrow indicates that the estimation of storm intensities depends on the previous intensity of a storm.
2.3.1 Storm formation
The number of storm formations varies strongly between different large-scale weather patterns (Jaye et al., 2019). Storm formation predominantly occurs during weather patterns with low vertical wind shear, high relative humidity in the lower troposphere and the existence of some kind of perturbation. The storm formation component relies on the following assumptions: (i) weather patterns can favor or hamper storm formations (Jaye et al., 2019; Lee et al., 2018) and (ii) persistent weather conditions can further increase or decrease formation probabilities.
Based on these assumptions we estimate the probability of a storm formation event Pgen on a day d with weather pattern w(d) as
The first factor Pobs(gen|w(d)) is the observed probability of storm formations for the given weather pattern w. The second factor includes the probabilities of storm formations 1 and 2 d after the weather pattern that occurred 1 d () and 2 d () earlier respectively. These probabilities are given less weight by applying a square root, and the factor is normalized by a dividing by the overall observed storm formation probability (Pobs(gen|all)).
2.3.2 Storm duration
There are numerous processes that can weaken and eventually dissipate TCs. The most common end of a TC is landfall. As we do not have information about the location of storms in our emulator, estimating the duration of a storm is challenging. For the development of this component we use the following assumptions: (i) storms dissipate when making landfall, (ii) the time a storm has before making landfall is modulated by its formation location and (iii) the formation location is to some extent influenced by weather patterns (see Figs. S4 and S5).
To incorporate this dependence of storm duration on weather patterns, we compute for each weather pattern a Gaussian kernel estimate fg of all storms that have formed on days with that weather pattern or on days of neighboring weather patterns in the SOM grid. In the emulator, the duration D of a storm s is sampled from the Gaussian kernel estimate fg corresponding to the weather pattern during which the storm has formed w(df).
2.3.3 Storm intensity
We quantify storm intensity through the daily maximum sustained wind speed. We use the following assumptions for our daily storm intensity emulations: (i) intensification can be favored or hampered by specific atmospheric circulation patterns (Frank and Ritchie, 2001; Lee et al., 2016), (ii) the intensity of a storm depends on the intensity on the day before, (iii) warmer SSTs in the MDR favor the intensification of intense TCs (Bhatia et al., 2018; Trepanier, 2020), and (iv) the relationship between SSTs and storm strength can be regularized by a quantile regression (see Fig. S7).
Assessing probability density functions (PDFs) for daily storm intensities for all possible combinations of weather patterns, SSTs and storm intensities on the day before is challenging given the insufficient number of storm observations. Therefore, instead of estimating a PDF for the daily intensity from all observations that match to certain conditions (e.g. weather pattern w6, 28 ∘C SST and 60 kn wind speed on the day before), we estimate the intensity PDF from the 100 storm observations that are most similar to these conditions.
Furthermore, the distribution of observed intensities is skewed towards weak storms, which would result in a low intensity bias in a straightforward application of the nearest-neighbor approach (see Fig. S10a–c). We therefore introduce a linear relationship between regionally averaged SSTs and storm intensities (see quantile regression in Fig. S7) to guarantee that the intensities from which we sample are not systematically too weak.
For a given SSTtarget, we transform all observed storm intensities to artificial pseudo-intensities vshifted using the slope βτ of the next quantile τ below the observed storm strength v(s,d):
We use the Euclidean distance metric applied on standardized variables to identify the 100 nearest neighbors in terms of weather pattern and storm intensity on the day before:
For the weather patterns which are not a continuous variable, we consider their coordinates in the SOM grid as locations and calculate differences between weather patterns as the sum of the squared differences in row and column numbers.
3.1 Validation of the emulator
Figure 3 shows the functioning of the emulator for three Atlantic hurricane seasons: 2020 was a highly active season with predominantly warm SSTs and favorable large-scale weather conditions allowing for strong TCs throughout most of the season; 2009 had similarly warm SSTs but less favorable weather conditions resulting in overall fewer days with strong storms; and 1983 was an El Niño year with cool SSTs in the tropical Atlantic and mostly unfavorable weather conditions for TCs in the Atlantic basin. The chance of finding storms and especially the chance of finding major hurricanes in simulations (Fig. 3d) for the respective years reflects the observed weather patterns and SSTs.
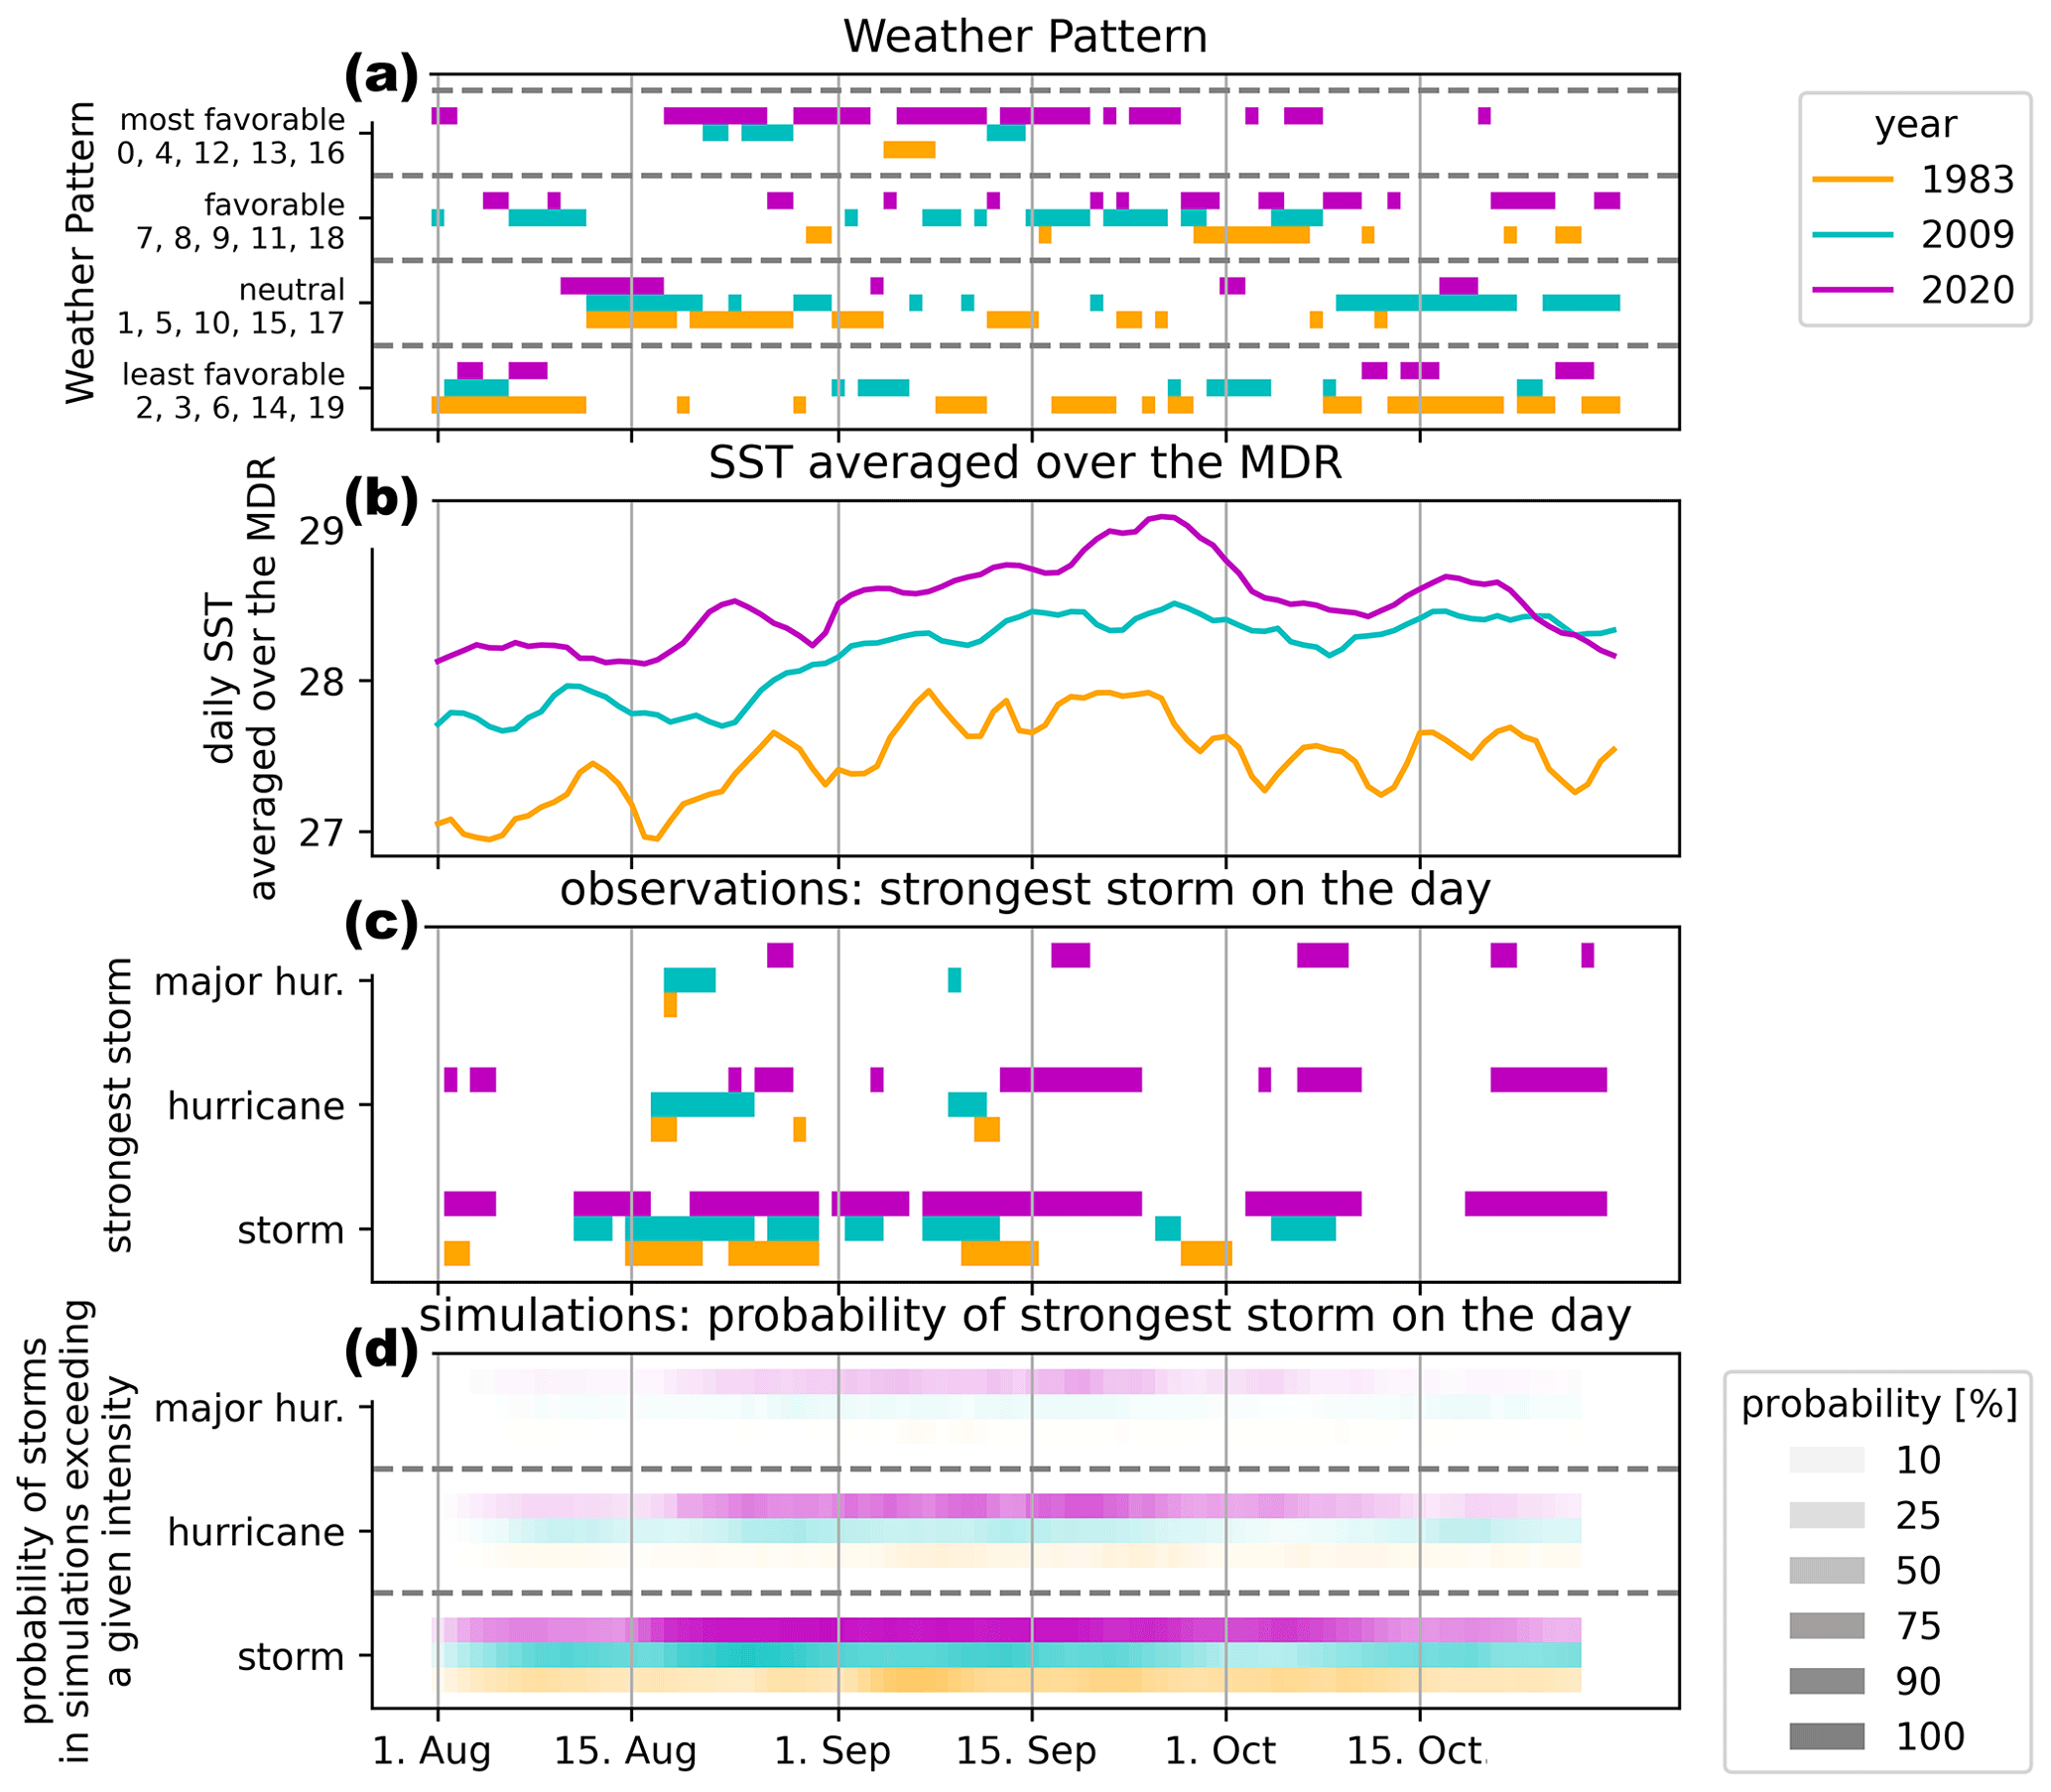
Figure 3Functioning of the tropical cyclone emulator. (a) Sequence of daily weather patterns grouped into four categories from least favorable for TC formation and intensification to most favorable for the years 2020 (purple), 2009 (cyan) and 1983 (orange). (b) Daily SSTs averaged over the main development region for the same years. (c) Intensity of the strongest storm for each day grouped into the categories storm, hurricane and major hurricane. (d) Probability of exceeding the intensity thresholds of panel (c) in simulations from the emulator.
To validate the emulator, we re-simulated every hurricane season between 1982 and 2020 a total of 1000 times using the observed sequence of daily weather patterns and SST averages over the MDR. We construct a new emulator for each decade using all the years but the decade we want to re-simulate as training data.
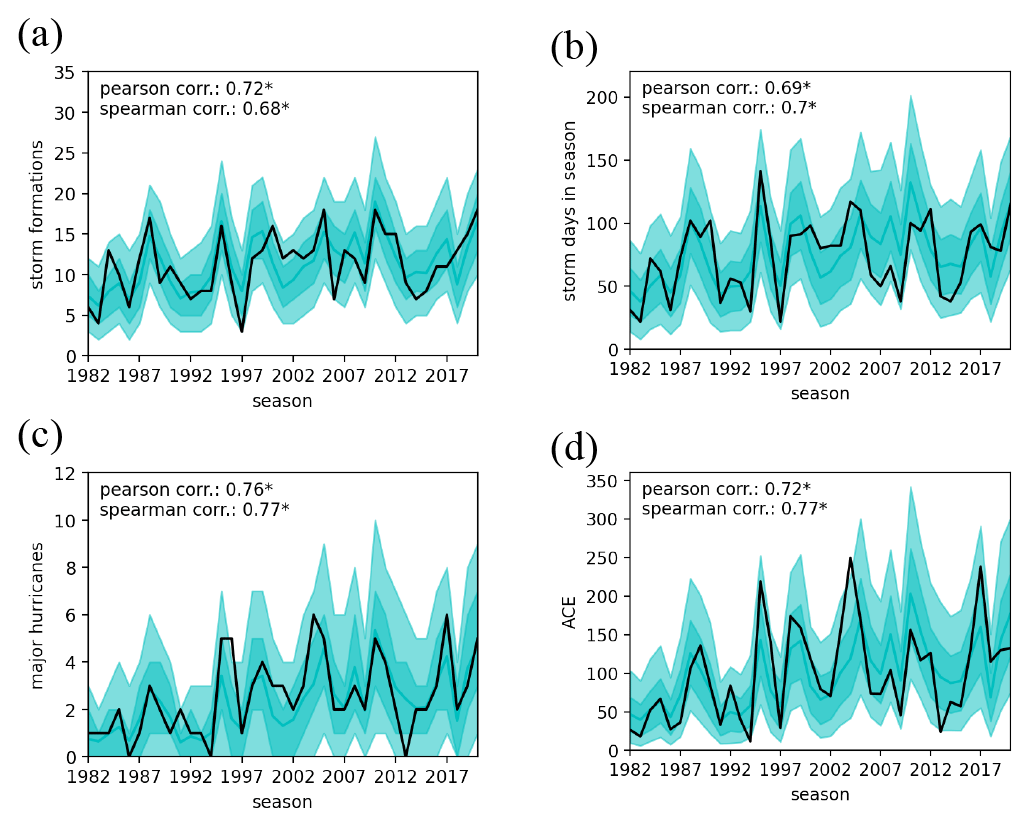
Figure 4Cross-validated hurricane season emulations. (a) Number of storms as observed (black) and simulated (cyan). The light shading shows the 95 % range of the 1000 simulations, and the darker shading shows the 66 % range. The mean is indicated by a solid line. The cross-validated Pearson (Spearman) correlation coefficient between hindcasts and observations is indicated in the legend (see methods for more details on the decadal cross validation). (b) As panel (a) but for the number of storm days in a season. (c) As panel (a) but for the number of major hurricanes in a season. (d) As panel (a) but for the seasonal ACE.
Large-scale weather patterns are sufficient to explain most of the inter-annual variations in the number of storm formations (see Fig. 4a). The remaining spread between individual simulation runs is to be expected as tropical storm formations have a strong stochastic component. Besides favorable weather conditions, storm formation requires a (small-scale) perturbation in the atmospheric flow such as African easterly waves to be initiated (Dieng et al., 2017) – information that is lacking in our emulator.
The number of storm days per season is strongly related to the number of storms. The simulated storm durations enhance the representation of the number of storm days, resulting in a accurate representation of storm durations (see Fig. S5) and a Pearson correlation coefficient of 0.69 between observations and the mean of all simulations (see Fig. 4b).
Finally, the storm intensity component produces a variety of storm intensities including major hurricanes (see Fig. 4c). As for the number of storm days, the number of strong storms is tightly linked to the number of storm formations. But as storm intensification is favored by certain weather patterns and warm SSTs, the potential for intensification alters between years. In combination, this results in an adequate representation of inter-annual variability in seasonal accumulated cyclone energy (ACE) as shown in Fig. 4d.
According to the correlation coefficients, major hurricane counts are slightly better represented than storm counts. While the number of major hurricanes is tightly linked to the amount of storm formations, the storm intensity component is an additional instance controlling under which conditions many major hurricanes are likely. The higher correlation for major hurricane counts is therefore an indication for a meaningful treatment of storm intensification in the emulator.
3.2 Sensitivity analysis
Strong simplifications were required to emulate TCs based on sequences of weather patterns and regionally averaged SSTs. The assumptions on which our methodological choices are made are plausible and appear to work well; they are, however, not without alternatives. We therefore test how alternative emulators perform.
The most critical part is the treatment of SSTs in the intensification component of the emulator as it directly influences some of the results. As shown in Fig. S11, emulators without any SST influence have considerable trends in residuals for major hurricane counts of 0.3 per decade (or 0.9 per kelvin of seasonal SST; see Fig. S11d). This misrepresentation in major hurricanes translates into a negative trend in seasonal ACE residuals (see Fig. S12). Including SSTs in the intensification component of the emulator reduces these trends significantly, which suggests that SSTs contain information that is required for an adequate representation of the strongest TCs.
A simpler way of including SSTs in our emulator could be to estimate intensity probability functions directly from the 100 nearest neighbors in terms of weather patterns, storm intensities on the day before and SSTs. While this approach works well in the range of average conditions, there are systematic deviations between the nearest neighbors and the target conditions for more extreme conditions. As shown in Fig. S10d–e, there is a warm bias for cool SSTs and vice versa, which is a result of too few observations from which the nearest neighbors can be searched. Similarly, there is a bias towards weaker storms in the nearest neighbors (see Fig. S10a–c). Reducing the number of nearest neighbors from 100 to 20 only slightly reduces these biases. Ultimately, this results in a lack of sensitivity in our emulator.
In the Supplement we present a number of additional emulators with slightly altered storm formation (see Fig. S8), storm duration (see Fig. S9) and storm intensity components (Figs. S10–S14). Most of these altered emulators yield similar results which supports the robustness of our results.
3.3 The effect of ocean warming on recent TC activity
We deploy the emulator to assess the contributions of large-scale atmospheric circulation and forced warming of tropical Atlantic SSTs towards the likelihood of extremely active hurricane seasons. According to DOISST and over the period 1982–2020, SSTs in the Atlantic MDR have warmed at a rate of 0.3 K per decade (Fig. 5b). This trend is slightly weaker in the HadISST dataset (Fig. 5a) for which also the global trend in SSTs over the period 1982–2020 is weaker than in other SST datasets (Yang et al., 2021). Using CMIP6 historical simulations, we estimate that the forced trend on SSTs in the MDR throughout the hurricane season is 0.22 K per decade for the period 1982–2014 (Fig. 5a). Thus, the observed SST trend over the 1982–2020 period is to a large extent forced by global warming.

Figure 5Sea surface temperatures averaged over August–October and the MDR. (a) Ensemble mean of historical CMIP6 simulations (red) relative to 1850–1900 and HadISST observations (gray) relative to 1870–1900. The 66 % range of the CMIP6 ensemble is represented by the red shading. Linear trends for CMIP6 (HadISST) over the period 1982–2014 (1982–2020) are indicated by dashed lines. (b) DOISST observations for the period 1982–2020 in blue and respective to the right y axis. Besides the linear trend in DOISST, the linear trend of CMIP6 is indicated by a red dashed line using the left y axis. (c) Counterfactual SST scenarios based DOISST observations from which the CMIP6 trend is removed. This detrended SST time series is shifted to the value of the CMIP6 trend in the year 1982 (cyan) and the year 2020 (purple). The remaining linear trend in these counterfactual scenarios is indicated by a dashed line.
To disentangle forced changes in TC activity from internal variability, we construct counterfactual scenarios in which we first remove the forced SST trend as estimated from CMIP6 simulations for the period 1982–2014. We then shift these detrended SST time series so that on average they match the values of the forced trend for the years 2020 and 1982 and call these artificial SST time series 2020 scenario and 1982 scenario (Fig. 5c). The counterfactual SST scenarios contain the observed year-to-year variations that can be linked to natural modes of variability such as the El Niño–Southern Oscillation (ENSO). The only difference between these two scenarios is that the 2020 scenario has 0.9 K warmer SSTs than the 1982 scenario.
Both counterfactual scenarios contain a small linear trend of 0.08 K per decade (Fig. 5c). This remaining trend reflects that the observed trend in DOISST is not solely due to global warming but that natural climate variability also contributes to the trend over the period 1982–2020.
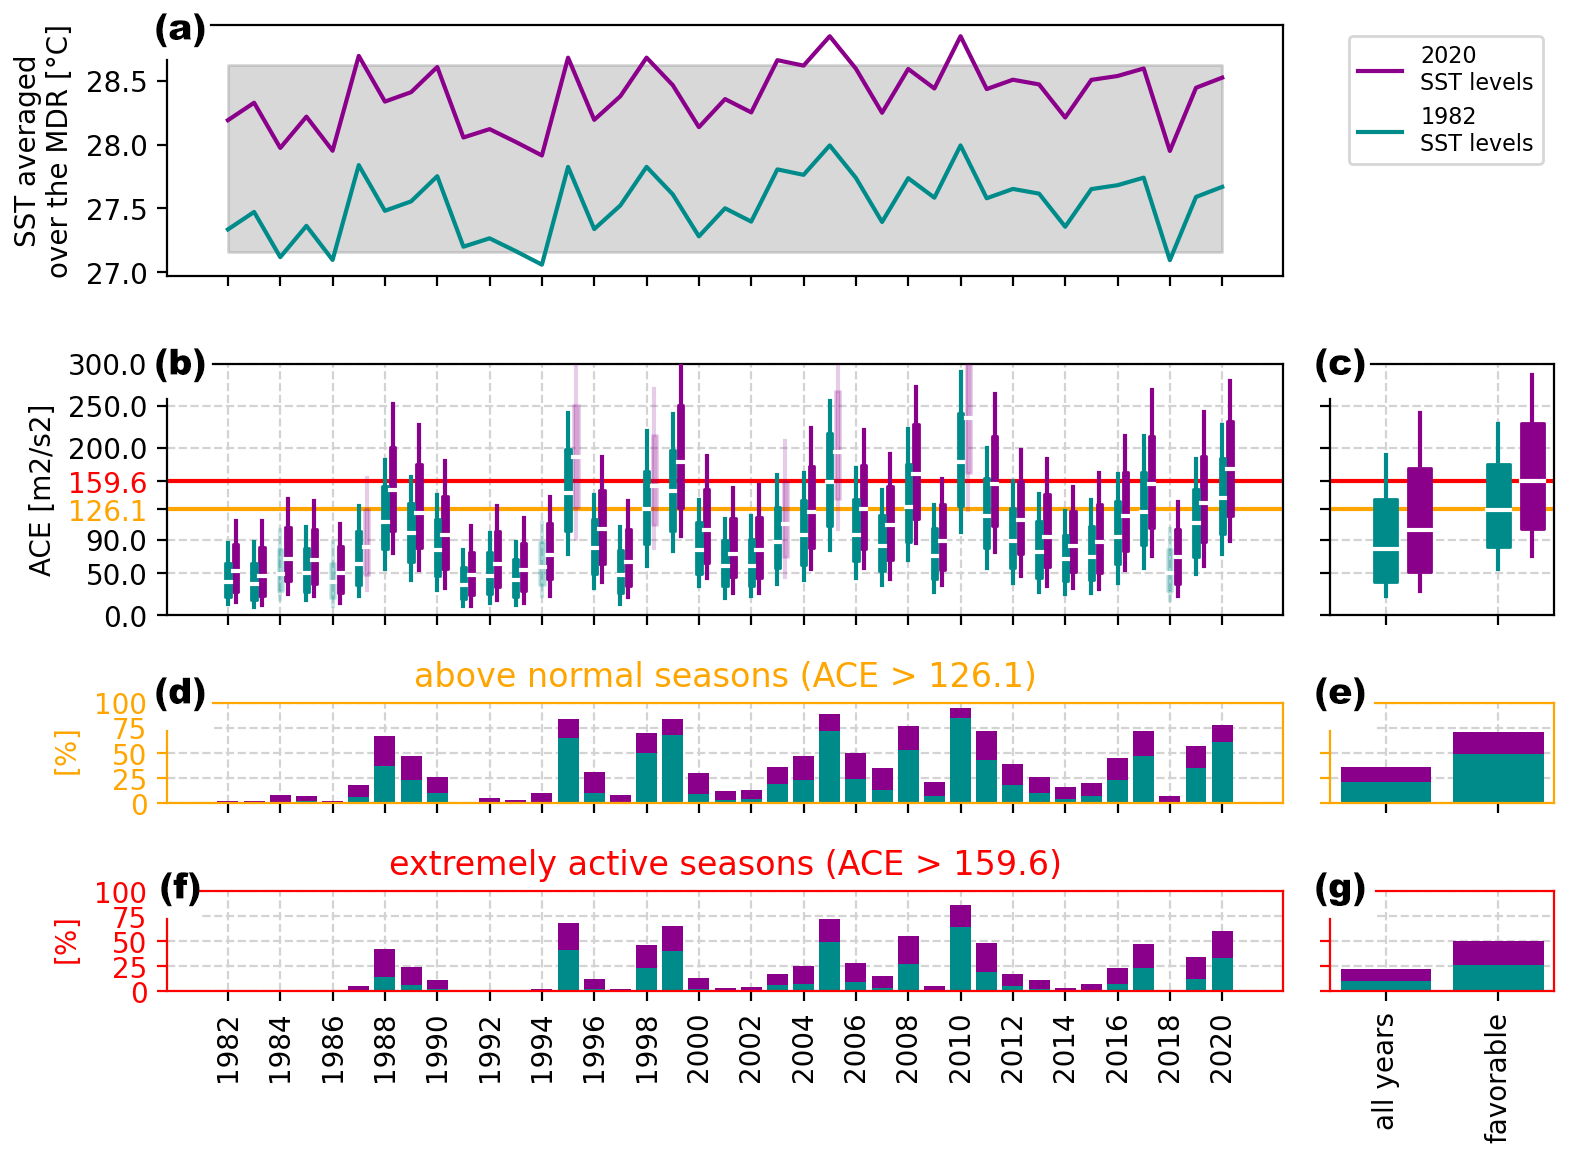
Figure 6Atlantic hurricane seasons under different counterfactual SST scenarios. (a) Two counterfactual SST scenarios: SSTs from which the forced SST trend has been removed and that are shifted to 2020 SST levels (purple) and shifted to 1982 SST levels (cyan). The gray rectangle indicates the range of observed seasonal SST averages. See Fig. 5 for more details. (b) Simulations for the counterfactual scenarios of panel (a) displayed as boxplots. For years where the seasonal SST averages in the counterfactual scenario are outside of the range of observed seasonal SST averages, the simulations are shown in lighter shading. (c) Simulations for all years aggregated and for the most favorable years defined as years for which half of the simulations in the 2020 SST scenario have more than 126.1 ACE. (d) Probability of above-normal seasons (ACE > 126.1). (e) As panel (d) but for all years and favorable years. (f) As panel (d) but for extremely active seasons (ACE > 159.6). (g) As panel (e) but for extremely active seasons.
In the CMIP6 historic simulations, no forced warming in MDR SSTs is simulated for the period before 1980. The long-term average over the period 1850–1900 (27.27 K) is close to the value of the 1982–2014 trend in the year 1982 (27.32 K). Therefore, SSTs in the counterfactual 1982 scenario are similar to pre-industrial levels for the MDR. Despite differences in the 1982–2020 trend, the HadISST dataset confirms the findings that SSTs in the MDR have not warmed considerably before the 1980s.
Over the period 1982–2020, large-scale atmospheric circulation patterns are the dominant factor explaining year-to-year variability in TC activity. Our emulations show high TC activity in the same years irrespective of the counterfactual SSTs (see Fig. 6b). For instance, the low activity in the years 1982–1987 is also simulated in the 2020 scenario, while the years 1995, 2005, 2010 and 2017 have a high likelihood of becoming an extremely active season also in the 1982 scenario.
Nevertheless, differences in seasonal TC activity are apparent between the two scenarios. On average, the seasonal activity is 25 ACE lower in the 1982 scenario as compared to the 2020 scenario (see Fig. 6c). As a result, more than one-third of the seasons that are simulated to be above-normal seasons in the 2020 scenario are below-normal seasons in the 1982 scenario (an above-normal seasonal activity being defined as > 126.1 ACE, CPC, 2021). Similarly, the number of simulations that are classified as extremely active (with ACE > 159.6) doubles from 11 % in the 1982 scenario to 22 % in the 2020 scenario (see Fig. 6g).
Differences between the counterfactual scenarios are stronger in years with high TC activity (see Fig. 6c). For years in which half of the simulations of the 2020 scenario are above-normal seasons, the simulations are on average 36 ACE more active in the 2020 scenario than in the 1982 scenario. For these years the risk of finding an extremely active season (with ACE > 159.6) drops from 50 % under current climate to 27 % in the 1982 scenario (see Fig. 6g). Our results do not imply that increasing sea-surface temperatures lead to more TC formations but point towards a trend of more extreme outcomes for seasons with many TCs. This is in line with a global trend towards more intense tropical cyclones over the observational record as well as projections (Masson-Delmotte et al., 2022).
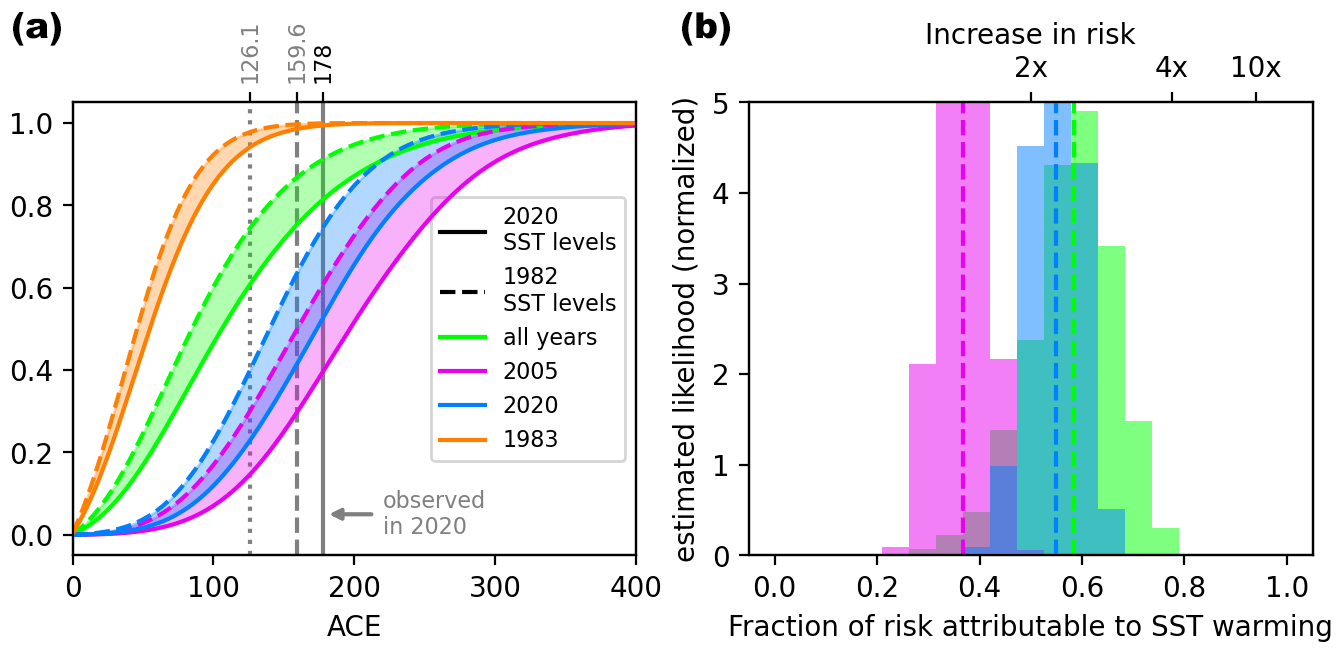
Figure 7Influence of ocean warming on the hurricane season 2020. (a) Cumulative distribution functions for seasonally aggregated ACE for the 2020 scenario (solid) and the 1982 scenario (dashed). All years between 1982–2020 aggregated in green, 2005 in purple, 2020 in blue, and 1983 in orange. The area between the 2020 scenario and the 1982 scenario is shaded. The horizontal gray lines indicate 178 ACE which was observed in 2020 (solid), the threshold for above-normal seasons 126.1 (dotted) and the threshold for extremely active seasons 159.6 (dashed). (b) Fraction of risk of an ACE > 178 season attributable to the SST difference between the 2020 SST levels and 1982 SST levels (dashed lines). The histograms show the fraction of attributable risk (FAR) distributions from a 10000-member bootstrapping for the 1982 SST level scenario, and the vertical lines indicate the median FARs.
Simulations from the emulator can moreover be used to analyze contributions to extremely damaging hurricane seasons such as that of 2020. The 2020 season is one of the most active recorded hurricane seasons with an ACE index of 178 and five major hurricanes in August–October (and two additional major hurricanes in November). The season was characterized by weather patterns that are favorable for TC formation and intensification and relatively warm SSTs. Figure 7a shows the probabilities of finding such a season under counterfactual SST scenarios.
Compared to other years, 2020 has a high probability of becoming an above-normal season (78 %) and a considerable probability of becoming an extremely active season (60 %), and 47 % of the simulations reach the observed ACE of 178 (see Fig. 7a).
Under a counterfactual 1982 SST scenario with similar modes of internal climate variability, weather patterns and short-term variations in Atlantic SSTs, the season would have a lower likelihood of becoming an above-normal hurricane season (61 %), an extremely active season (33 %) or even a season with 178 ACE (21 %).
For 2020 weather conditions, the warming of Atlantic SSTs since the 1980s has increased the probability of finding a season with 178 ACE by a factor of 2.2 (see Fig. 7b). For a year like 2005 which according to our analysis had a higher likelihood of becoming an extremely active season than 2020, the probability of finding a seasonal ACE of 178 is a factor of 1.6 higher in the 2020 scenario as compared to the 1982 scenario. The likelihood of finding 178 ACE in any year irrespective of the weather conditions is increased by a factor of 2.4. The increase in likelihood of finding 178 ACE is higher for seasons with weather conditions that are hampering TC formation and development. For a year like 1983 with very few TC formations, there are no simulations that reach 178 ACE in either of the counterfactual scenarios.
We have demonstrated that the observed Atlantic tropical cyclone activity over the last 40 years can be reproduced with a probabilistic emulator based on large-scale weather patterns and SSTs. Over this period, we observe a trend in weather patterns favoring more active TC seasons. Whether or not this trend in atmospheric circulation can be attributed to anthropogenic climate change or other external drivers such as aerosol loadings (Dunstone et al., 2013) remains an open question.
It is important to highlight that our weather patterns and regional SST time series are not fully independent. Specifically, it appears that years with warm Atlantic SSTs are also years where Atlantic SSTs are warm relative to the rest of the tropics, and it has been argued that this effect of relative SSTs is the dominant contribution to TC activity (Sobel et al., 2016; Murakami et al., 2018). The temperature difference between the tropical Atlantic and other tropical basins has a strong impact on atmospheric circulation. However, our sensitivity analysis suggests that SSTs over the MDR contain relevant information and that our approach to include SSTs in the emulator as an addition to the sequences of weather patterns is suited to simulate intense TCs.
The potential maximum intensity a TC can reach depends on the temperature difference between the ocean surface and the tropopause layer, and it is plausible that increasing SSTs have an amplifying effect on strong TCs (Emanuel, 1987). However, it has been argued that, over the satellite era, tropopause layer cooling might have dominated over the role of SSTs (Emanuel et al., 2013), a hypothesis we cannot exclude based on our analysis.
Ultimately, the integration of SSTs in our model relies on assumptions that are physically motivated and that lead to a better representation of TC activity over the period 1982–2020 than other assumptions. Since the early 1980s, an increase in global average surface air temperature of more than 0.5 K has occurred, and we would argue that over this period SSTs in the region serve as a useful proxy for thermodynamic changes in the climate system.
There is increasing consensus in the scientific literature that the number of tropical cyclones might not or only moderately increase, while the number of most intense storms would increase substantially (Masson-Delmotte et al., 2022). Our emulator results indicate that increasing SSTs could be a potential driver for such an intensification, also allowing for potential avenues to link those changes more directly to anthropogenic climate change.
In this first application of the emulator we have focused on ocean warming. Applying the emulator to future climate projections from state-of-the-art earth system models might, however, also help to estimate the dynamic forcing on TC activity resulting from atmospheric circulation changes. While most climate models have a poor representation of TCs, their projections of atmospheric circulation changes contain valuable information that could be meaningfully analyzed using this TC emulator.
By separating out the thermodynamic and dynamic forcings for observed ACE, our approach allows us to link the observed trend in seasonal cyclone activity and extreme season probability to warming SSTs. Our findings indicate that warming SSTs over the tropical Atlantic might have already contributed significantly to more extreme tropical cyclone seasons and thereby to the fatalities, destruction and trillion dollar losses that these cyclones have caused over the last four decades (MunichRe, 2021). Given the projected increases in SSTs with increasing warming, our findings suggest that the probability of extreme seasons might further increase. To minimize future risks, stringent emission reductions in line with achieving the goals of the Paris Agreement would be required (Masson-Delmotte et al., 2022).
All Python scripts required to perform the analysis and create the plots are available under https://doi.org/10.5281/zenodo.6223723 (Pfleiderer, 2022).
The ERA5 reanalysis can be downloaded from the https://doi.org/10.24381/cds.adbb2d47 (Hersbach et al., 2018). The DOISST dataset can be downloaded from https://www.ncei.noaa.gov/products/optimum-interpolation-sst (last access: 6 January 2022; Huang et al., 2021). The HadISST dataset can be downloaded from https://www.metoffice.gov.uk/hadobs/hadisst/ (last access: 10 January 2022; Rayner et al., 2003). The IBTrACS dataset can be downloaded from https://doi.org/10.25921/82ty-9e16 (Knapp et al., 2018). CMIP6 data can be downloaded from https://esgf-data.dkrz.de/projects/cmip6-dkrz/ (last access: 13 January 2022; (WCRP, 2022)).
The supplement related to this article is available online at: https://doi.org/10.5194/wcd-3-471-2022-supplement.
PP and CFS conceived the study. PP developed the methods with contributions from CFS and SN. PP prepared all figures. PP wrote the manuscript with contributions from all authors.
The contact author has declared that neither they nor their co-authors have any competing interests.
Publisher’s note: Copernicus Publications remains neutral with regard to jurisdictional claims in published maps and institutional affiliations.
We acknowledge the NOAA's International Best Track Archive for Climate Stewardship (IBTrACS), the fifth generation of ECMWF atmospheric reanalyses (ERA5), the Daily Optimum Interpolation Sea Surface Temperature (or DOISST) from NOAA, and the Hadley Centre Sea Ice and Sea Surface Temperature dataset (HadISST). Peter Pfleiderer and Carl-Friedrich Schleussner acknowledge support by the German Federal Ministry of Education and Research (01LN1711A). Shruti Nath was supported by the LAMACLIMA project, receiving funding from the German Federal Ministry of Education and Research (BMBF) and the German Aerospace Center (DLR) as part of AXIS, an ERANET program initiated by JPI Climate (grant no. 01LS1905A), with co-funding from the European Union (grant no. 776608).
This research has been supported by the Bundesministerium für Bildung und Forschung (grant nos. 01LN1711A and 01LS1905A) and the European Union (grant no. 776608).
This paper was edited by Peter Knippertz and reviewed by Jill Trepanier and one anonymous referee.
Bell, G. D., Halpert, M. S., Schnell, R. C., Higgins, R. W., Lawrimore, J., Kousky, V. E., Tinker, R., Thiaw, W., Chelliah, M., and Artusa, A.: Climate Assessment for 1999, B. Am. Meteorol. Soc., 81, S1–S50, 2000. a
Bhatia, K., Vecchi, G., Murakami, H., Underwood, S., and Kossin, J.: Projected Response of Tropical Cyclone Intensity and Intensification in a Global Climate Model, J. Climate, 31, 8281–8303, https://doi.org/10.1175/JCLI-D-17-0898.1, 2018. a, b
Cattiaux, J., Vautard, R., Cassou, C., Yiou, P., Masson-Delmotte, V., and Codron, F.: Winter 2010 in Europe: A Cold Extreme in a Warming Climate: COLD WINTER 2010 IN EUROPE, Geophys. Res. Lett., 37, L20704, https://doi.org/10.1029/2010GL044613, 2010. a
CPC: Climate Prediction Center – Atlantic Hurricane Outlook, https://www.cpc.ncep.noaa.gov/products/outlooks/Background.html, last access: 22 July 2021. a, b
Dieng, A. L., Sall, S. M., Eymard, L., Leduc-Leballeur, M., and Lazar, A.: Trains of African Easterly Waves and Their Relationship to Tropical Cyclone Genesis in the Eastern Atlantic, Mon. Weather Rev., 145, 599–616, https://doi.org/10.1175/MWR-D-15-0277.1, 2017. a, b
Dunstone, N. J., Smith, D. M., Booth, B. B. B., Hermanson, L., and Eade, R.: Anthropogenic Aerosol Forcing of Atlantic Tropical Storms, Nat. Geosci., 6, 534–539, https://doi.org/10.1038/ngeo1854, 2013. a
Emanuel, K., Solomon, S., Folini, D., Davis, S., and Cagnazzo, C.: Influence of Tropical Tropopause Layer Cooling on Atlantic Hurricane Activity, J. Climate, 26, 2288–2301, https://doi.org/10.1175/JCLI-D-12-00242.1, 2013. a, b
Emanuel, K. A.: The Dependence of Hurricane Intensity on Climate, Nature, 326, 483–485, 1987. a, b
Frank, W. M. and Ritchie, E. A.: Effects of Vertical Wind Shear on the Intensity and Structure of Numerically Simulated Hurricanes, Mon. Weather Rev., 129, 2249–2269, https://doi.org/10.1175/1520-0493(2001)129<2249:EOVWSO>2.0.CO;2, 2001. a, b
Hersbach, H., Bell, B., Berrisford, P., Biavati, G., Horányi, A., Muñoz Sabater, J., Nicolas, J., Peubey, C., Radu, R., Rozum, I., Schepers, D., Simmons, A., Soci, C., Dee, D., and Thépaut, J.-N.: ERA5 hourly data on single levels from 1979 to present, Copernicus Climate Change Service (C3S) Climate Data Store (CDS) [data set], https://doi.org/10.24381/cds.adbb2d47, 2018. a
Hersbach, H., Bell, B., Berrisford, P., Hirahara, S., Horányi, A., Muñoz-Sabater, J., Nicolas, J., Peubey, C., Radu, R., Schepers, D., Simmons, A., Soci, C., Abdalla, S., Abellan, X., Balsamo, G., Bechtold, P., Biavati, G., Bidlot, J., Bonavita, M., Chiara, G., Dahlgren, P., Dee, D., Diamantakis, M., Dragani, R., Flemming, J., Forbes, R., Fuentes, M., Geer, A., Haimberger, L., Healy, S., Hogan, R. J., Hólm, E., Janisková, M., Keeley, S., Laloyaux, P., Lopez, P., Lupu, C., Radnoti, G., Rosnay, P., Rozum, I., Vamborg, F., Villaume, S., and Thépaut, J.-N.: The ERA5 Global Reanalysis, Q. J. Roy. Meteor. Soc., 146, 1999–2049, https://doi.org/10.1002/qj.3803, 2020. a
Hewitson, B. and Crane, R.: Self-Organizing Maps: Applications to Synoptic Climatology, Clim. Res., 22, 13–26, https://doi.org/10.3354/cr022013, 2002. a
Holland, G. and Bruyère, C. L.: Recent Intense Hurricane Response to Global Climate Change, Clim. Dynam., 42, 617–627, https://doi.org/10.1007/s00382-013-1713-0, 2014. a
Huang, B., Liu, C., Banzon, V., Freeman, E., Graham, G., Hankins, B., Smith, T., and Zhang, H.-M.: Improvements of the Daily Optimum Interpolation Sea Surface Temperature (DOISST) Version 2.1, J. Climate, 34, 2923–2939, https://doi.org/10.1175/JCLI-D-20-0166.1, 2021 (data available at: https://www.ncei.noaa.gov/products/optimum-interpolation-sst, last access: 6 January 2022). a, b
Jaye, A. B., Bruyère, C. L., and Done, J. M.: Understanding Future Changes in Tropical Cyclogenesis Using Self-Organizing Maps, Weather and Climate Extremes, 26, 100235, https://doi.org/10.1016/j.wace.2019.100235, 2019. a, b
Knapp, K. R., Kruk, M. C., Levinson, D. H., Diamond, H. J., and Neumann, C. J.: The International Best Track Archive for Climate Stewardship (IBTrACS), B. Am. Meteorol. Soc., 91, 363–376, https://doi.org/10.1175/2009BAMS2755.1, 2010. a
Knapp, K. R., Diamond, H. J., Kossin, J. P., Kruk, M. C., and Schreck III, C. J.: International Best Track Archive for Climate Stewardship (IBTrACS) Project, Version 4, NOAA National Centers for Environmental Information [data set], https://doi.org/10.25921/82ty-9e16, 2018. a, b
Knutson, T., Camargo, S. J., Chan, J. C. L., Emanuel, K., Ho, C.-H., Kossin, J., Mohapatra, M., Satoh, M., Sugi, M., Walsh, K., and Wu, L.: Tropical Cyclones and Climate Change Assessment: Part I: Detection and Attribution, B. Am. Meteorol. Soc., 100, 1987–2007, https://doi.org/10.1175/BAMS-D-18-0189.1, 2019. a, b
Knutson, T., Camargo, S. J., Chan, J. C. L., Emanuel, K., Ho, C.-H., Kossin, J., Mohapatra, M., Satoh, M., Sugi, M., Walsh, K., and Wu, L.: Tropical Cyclones and Climate Change Assessment: Part II: Projected Response to Anthropogenic Warming, B. Am. Meteorol. Soc., 101, E303–E322, https://doi.org/10.1175/BAMS-D-18-0194.1, 2020. a, b
Kossin, J. P., Olander, T. L., and Knapp, K. R.: Trend Analysis with a New Global Record of Tropical Cyclone Intensity, J. Climate, 26, 9960–9976, https://doi.org/10.1175/JCLI-D-13-00262.1, 2013. a
Kossin, J. P., Knapp, K. R., Olander, T. L., and Velden, C. S.: Global Increase in Major Tropical Cyclone Exceedance Probability over the Past Four Decades, P. Natl. Acad. Sci. USA, 117, 11975–11980, https://doi.org/10.1073/pnas.1920849117, 2020. a
Lee, C.-Y., Tippett, M. K., Sobel, A. H., and Camargo, S. J.: Autoregressive Modeling for Tropical Cyclone Intensity Climatology, J. Climate, 29, 7815–7830, https://doi.org/10.1175/JCLI-D-15-0909.1, 2016. a
Lee, C.-Y., Tippett, M. K., Sobel, A. H., and Camargo, S. J.: An Environmentally Forced Tropical Cyclone Hazard Model, J. Adv. Model. Earth Syst., 10, 223–241, https://doi.org/10.1002/2017MS001186, 2018. a
Lin, N., Kopp, R. E., Horton, B. P., and Donnelly, J. P.: Hurricane Sandy's Flood Frequency Increasing from Year 1800 to 2100, P. Natl. Acad. Sci. USA, 113, 12071–12075, https://doi.org/10.1073/pnas.1604386113, 2016. a
Masson-Delmotte, V., Zhai, P., Pirani, A., Connors, L., Péan, C., Berger, S., Caud, N., Chen, Y., Goldfarb, L., Gomis, I. M., Huang, M., Leitzell, K., Lonnoy, E., Matthews, J. B. R., Maycock, T. K., Waterfield, T., Yelekçi, O., Yu, R., and Zhou, B.: IPCC: Climate Change 2021: The Physical Science Basis, Contribution of Working Group I to the Sixth Assessment Report of the Intergovernmental Panel on Climate Change, Cambridge University Press, in press, 2022. a, b, c
MunichRe: Tropical Storm Risks: Hurricanes, Typhoons, Cyclones, Munich Re, https://www.munichre.com/en/risks/natural-disasters-losses-are-trending-upwards/hurricanes-typhoons-cyclones.html, last access: 16 September 2021. a, b
Murakami, H., Levin, E., Delworth, T. L., Gudgel, R., and Hsu, P.-C.: Dominant Effect of Relative Tropical Atlantic Warming on Major Hurricane Occurrence, Science, 6711, eaat6711, https://doi.org/10.1126/science.aat6711, 2018. a
Pfleiderer, P.: peterpeterp/tc_emulator: version 3 (Version v3), Zenodo [code], https://doi.org/10.5281/zenodo.6223723, 2022. a
Rayner, N. A., Parker, D. E., Horton, E. B., Folland, C. K., Alexander, L. V., Rowell, D. P., Kent, E. C., and Kaplan, A.: Global Analyses of Sea Surface Temperature, Sea Ice, and Night Marine Air Temperature since the Late Nineteenth Century, J. Geophys. Res., 108, 4407, https://doi.org/10.1029/2002JD002670, 2003 (data available at: https://www.metoffice.gov.uk/hadobs/hadisst/, last access: 10 January 2022). a, b
Reed, K. A., Stansfield, A. M., Wehner, M. F., and Zarzycki, C. M.: Forecasted Attribution of the Human Influence on Hurricane Florence, Sci. Adv., 6, eaaw9253, https://doi.org/10.1126/sciadv.aaw9253, 2020. a, b, c
Sharmila, S. and Walsh, K. J. E.: Impact of Large-scale Dynamical versus Thermodynamical Climate Conditions on Contrasting Tropical Cyclone Genesis Frequency, J. Climate, 30, 8865–8883, https://doi.org/10.1175/JCLI-D-16-0900.1, 2017. a
Shepherd, T. G.: A Common Framework for Approaches to Extreme Event Attribution, Current Climate Change Reports, 2, 28–38, https://doi.org/10.1007/s40641-016-0033-y, 2016. a
Sippel, S., Meinshausen, N., Merrifield, A., Lehner, F., Pendergrass, A. G., Fischer, E., and Knutti, R.: Uncovering the Forced Climate Response from a Single Ensemble Member Using Statistical Learning, J. Climate, 32, 5677–5699, https://doi.org/10.1175/JCLI-D-18-0882.1, 2019. a
Sobel, A. H., Camargo, S. J., Hall, T. M., Lee, C.-Y., Tippett, M. K., and Wing, A. A.: Human Influence on Tropical Cyclone Intensity, Science, 353, 242–246, https://doi.org/10.1126/science.aaf6574, 2016. a
Trenberth, K. E., Fasullo, J. T., and Shepherd, T. G.: Attribution of Climate Extreme Events, Nat. Clim. Change, 5, 725–730, https://doi.org/10.1038/nclimate2657, 2015. a
Trepanier, J. C.: North Atlantic Hurricane Winds in Warmer than Normal Seas, Atmosphere, 11, 293, https://doi.org/10.3390/atmos11030293, 2020. a
van Oldenborgh, G. J., van der Wiel, K., Sebastian, A., Singh, R., Arrighi, J., Otto, F., Haustein, K., Li, S., Vecchi, G., and Cullen, H.: Attribution of Extreme Rainfall from Hurricane Harvey, August 2017, Environ. Res. Lett., 12, 124009, https://doi.org/10.1088/1748-9326/aa9ef2, 2017. a
Vecchi, G., Landsea, C., Zhang, W., Villarini, G., and Knutson, T.: Changes in Atlantic Major Hurricane Frequency Since the Late-19th Century, Research Square, https://doi.org/10.21203/rs.3.rs-153527/v1, in review, 2022. a
Walsh, K. J., McBride, J. L., Klotzbach, P. J., Balachandran, S., Camargo, S. J., Holland, G., Knutson, T. R., Kossin, J. P., Lee, T.-c., Sobel, A., and Sugi, M.: Tropical Cyclones and Climate Change, WIRES: Climate Change, 7, 65–89, https://doi.org/10.1002/wcc.371, 2016. a
World Climate Research Program (WCRP): WCRP Coupled Model Intercomparison Project (Phase 6), WCRP [data set], https://esgf-data.dkrz.de/projects/cmip6-dkrz/, last access: 13 January 2022. a
Yang, C., Leonelli, F. E., Marullo, S., Artale, V., Beggs, H., Nardelli, B. B., Chin, T. M., Toma, V. D., Good, S., Huang, B., Merchant, C. J., Sakurai, T., Santoleri, R., Vazquez-Cuervo, J., Zhang, H.-M., and Pisano, A.: Sea Surface Temperature Intercomparison in the Framework of the Copernicus Climate Change Service (C3S), J. Climate, 34, 5257–5283, https://doi.org/10.1175/JCLI-D-20-0793.1, 2021. a