the Creative Commons Attribution 4.0 License.
the Creative Commons Attribution 4.0 License.
 | 22 May 2023
The teleconnection of extreme El Niño–Southern Oscillation (ENSO) events to the tropical North Atlantic in coupled climate models
Jake W. Casselman
Joke F. Lübbecke
Tobias Bayr
Wenjuan Huo
Sebastian Wahl
Daniela I. V. Domeisen
El Niño–Southern Oscillation (ENSO) is a major source for teleconnections, including towards the tropical North Atlantic (TNA) region, whereby TNA sea surface temperatures (SSTs) are positively correlated with ENSO in boreal spring following an ENSO event. However, the Pacific–Atlantic connection can be impacted by different ENSO characteristics, such as the amplitude, location, and timing of Pacific SST anomalies (SSTAs). Indeed, the TNA SSTAs may respond nonlinearly to strong and extreme El Niño events. However, observational data for the number of extreme ENSO events remain limited, restricting our ability to investigate the influence of observed extreme ENSO events. To overcome this issue and to further evaluate the nonlinearity of the TNA SSTA response, two coupled climate models are used, namely the Community Earth System Model version 1 – Whole Atmosphere Community Climate Model (CESM-WACCM) and the Flexible Ocean and Climate Infrastructure version 1 (FOCI). In both models the TNA SSTAs respond linearly to ENSO during extreme El Niño events but nonlinearly to extreme La Niña events for CESM-WACCM. We investigate differences by using indices for all major mechanisms that connect ENSO to the TNA and compare them with reanalysis. CESM-WACCM and FOCI overall represent the teleconnection well, including that the tropical and extratropical pathways are similar to observations. Our results also show that a large portion of the nonlinearity during La Niña is explained by the interaction between Pacific SSTAs and the overlying upper-level divergence.
- Article
(6590 KB) - Full-text XML
-
Supplement
(9335 KB) - BibTeX
- EndNote


El Niño–Southern Oscillation (ENSO) is the dominant mode of tropical Pacific interannual variability, influencing regions around the globe (Horel and Wallace, 1981; Philander, 1989). One mechanism behind this global influence includes anomalous upper-level divergence and Rossby wave trains through divergent poleward flow (Gill, 1980; Sardeshmukh and Hoskins, 1988; Wang, 2004). Additionally, Kelvin waves propagate eastwards towards the tropical Atlantic, influencing the Walker circulation over South America (Lin et al., 2007). As a result, a robust response to ENSO occurs over the tropical North Atlantic (TNA) region (ENSO–TNA teleconnection hereafter), resulting in positively correlated sea surface temperature anomalies (SSTAs) between the tropical Pacific and Atlantic (Enfield and Mayer, 1997; Trenberth et al., 1998; Alexander and Scott, 2002).
The TNA SSTAs are important for their potential to further influence regions locally and globally. To the south of the TNA, SSTAs can cause anomalous shifts in the Intertropical Convergence Zone (ITCZ) over Brazil, modifying the rainy season in boreal spring (Chiang, 2002; Giannini et al., 2004; Rodrigues et al., 2011). To the west of the TNA, rainfall is heavily controlled by the local Caribbean low-level jet (CLLJ), which can be modulated by the SST gradient between the Pacific and Atlantic, thus allowing TNA SSTAs to influence the region (Enfield and Alfaro, 1999; Giannini et al., 2000; Taylor et al., 2002; Wang, 2007; Taylor et al., 2011). To the east of the TNA, the African monsoon onset and development can also be modified similarly to the ITCZ shift over Brazil, and the TNA SSTAs may also directly influence the static stability over equatorial West Africa (Janicot et al., 2001; Giannini et al., 2008; Kucharski et al., 2009; Rowell, 2013; Harlaß et al., 2015). Finally, the TNA SSTAs can contribute towards inducing a Rossby wave train propagating northward, influencing both the East Atlantic (EA) pattern and East Atlantic–West Russian teleconnection (Li et al., 2007; Lim, 2015; Wulff et al., 2017; Rieke et al., 2021). As a result, the TNA SSTAs can influence precipitation as far downstream as China (Wu et al., 2011; Li and Ruan, 2018; Li et al., 2018). Thus, the better we understand how ENSO's teleconnections are linked to TNA SSTAs, the better we can potentially predict the TNA's influence on other regions.
Understanding the ENSO–TNA teleconnection is complicated by several factors: for example, the connection between Pacific SSTAs and the TNA travels through both a tropical and extratropical pathway (Casselman et al., 2021). Additionally, the TNA SSTA can be influenced by ENSO's strength (Casselman et al., 2021); ENSO's diversity (i.e., central or eastern Pacific El Niño) (Graf and Zanchettin, 2012; Amaya and Foltz, 2014; Taschetto et al., 2016; Feng et al., 2017); ENSO's decay time (Wu and He, 2019); tropical Atlantic SST preconditioning prior to ENSO's influence on the TNA (Giannini et al., 2004; Casselman et al., 2021); and other external influences on the ENSO–TNA teleconnection, such as the North Atlantic Oscillation (NAO) (Cassou and Terray, 2001; George and Saunders, 2001; Wanner et al., 2001; Lee et al., 2008).
Through the extratropics, ENSO projects onto the Pacific North American (PNA) pattern (Horel and Wallace, 1981; Wallace and Gutzler, 1981), whereby the most southeastern lobe (hereafter referred to as Southeastern Low mechanism; Casselman et al., 2021) tends to influence trade winds in the TNA region (Hastenrath, 2000; Taschetto et al., 2016). A decrease in trade winds (i.e., during El Niño) reduces evaporative cooling and induces an SST warming over the TNA region. The Southeastern Low is sensitive to the longitudinal position of El Niño peak SSTAs, where eastern Pacific El Niño events tend to excite the Southeastern Low more effectively than central Pacific events (Taschetto et al., 2016; Casselman et al., 2021).
ENSO's equatorial teleconnection to the TNA region occurs through two different mechanisms. The first mechanism results from anomalous vertical motion over the Pacific SSTAs (a Matsuno–Gill-type response over the tropical Pacific) and an atmospheric Kelvin wave that propagates downstream towards South America (Gill, 1980; Wheeler et al., 2000; Lin et al., 2007; Lee et al., 2009). During El Niño, ascending motion over the central Pacific tends to perturb the Walker circulation and create descending motion over eastern South America, while for La Niña, the opposite occurs over the Pacific, resulting in ascending motion over eastern South America. As a result, the anomalous vertical motion over eastern South America exhibits counterclockwise upper-level rotation during El Niño and clockwise upper-level rotation during La Niña. This response is called the Secondary-Gill-type mechanism (García-Serrano et al., 2017; Casselman et al., 2021, 2022). Furthermore, the anomalous vertical motion over eastern South America and the tropical Atlantic is translated to lower levels, where anomalous surface rotation (i.e., clockwise for El Niño, counterclockwise for La Niña) interacts with the Atlantic trade winds, resulting in tropical Atlantic SSTAs.
Secondly, the propagating atmospheric Kelvin wave also aids in distributing a temperature anomaly along the global tropics, including over the tropical Atlantic. This response is often referred to as the tropospheric temperature (TT) mechanism (Chiang and Sobel, 2002; Sobel et al., 2002; Su et al., 2003; Amaya and Foltz, 2014). The TT mechanism modifies static stability over the Atlantic, inhibiting deep convection during an El Niño event, and enhancing deep convection during La Niña events. Furthermore, during El Niño events, latent heat fluxes are modified over the TNA region, as evaporative cooling is reduced and short wave radiation is enhanced, while the opposite occurs during La Niña events.
Among the numerous aspects that may influence the ENSO–TNA teleconnection, the impact of extreme ENSO events on the teleconnection pathways remains unclear due to the limited number of observed extreme ENSO events. In reanalysis, the magnitude of the TNA SSTAs is nonlinear with respect to the magnitude of the Pacific SSTAs, whereby TNA SSTAs cease to increase markedly between strong and extreme El Niño events (Casselman et al., 2021). However, the source of this nonlinearity remains uncertain. Knowing of such nonlinearities during extreme ENSO events is necessary for predicting the TNA response and may grow in importance as the number of extreme ENSO events possibly increases due to climate change (Fredriksen et al., 2020; McPhaden et al., 2020; Callahan et al., 2021; Cai et al., 2021).
One mechanism that may explain nonlinearities towards the TNA region includes the upper-level divergence over the Pacific. For example, nonlinearities towards the North Pacific (i.e., the Aleutian Low) occur due to a nonlinear relationship between the Pacific SSTAs and upper-level divergence. Once convection is suppressed during La Niña events, further convection reductions do not occur following further negative SSTAs (Jiménez-Esteve and Domeisen, 2019). The mechanism suggested to cause the nonlinearity with upper-level divergence is the threshold for deep convection, which is an SST threshold often cited as between 26 and 27.5 ∘C where convection increases rapidly (Graham and Barnett, 1987; Tompkins, 2001; Johnson and Xie, 2010; Williams et al., 2023). However, as an anomalously warm troposphere (i.e., TT mechanism) often follows an El Niño event, this may also lead to suppressed convection, even when SSTs have a positive anomaly (Izumo et al., 2020). Furthermore, above a temperature threshold that lies around 28 or 29 ∘C convection may also experience a decrease (Graham and Barnett, 1987; Sabin et al., 2013), which may be due to tropical SST gradients and the influence of large-scale moisture convergence towards the location of local convection (Tompkins, 2001). For example, over the Pacific warm pool, small SST gradients exist, which influence the surface convergence and may limit the extent to which deep convection occurs (Sabin et al., 2013). This lack of deep convection can also be seen during ENSO events (Chiodi and Harrison, 2013), where the strongest atmospheric response occurs over the dateline and not necessarily in the region of maximum SSTs (Taschetto et al., 2016).
Regarding the ENSO–TNA teleconnection linearity, the tropical pathway is more linear than the extratropical pathway, but the lack of extreme events in reanalysis remains a key barrier for robustly understanding this teleconnection (Casselman et al., 2021). One method to overcome the lack of observed extreme ENSO events involves using coupled general circulation models (CGCMs). Even so, considerable improvement is still required to overcome major biases within these models, such as SST biases over the Pacific, which influence ENSO's diversity and the eastern Pacific cold tongue region (Bellenger et al., 2014; Richter, 2015; Woelfle et al., 2018; Feng et al., 2020; Ge and Chen, 2020). Therefore, diagnosing biases within coupled models remains an important area of research to better understand the differences between the limited number of observed events and simulated events, as well as to validate if the models are able to realistically simulate the dynamics and teleconnections of the different El Niño event types (Bayr et al., 2019a, b).
This study uses two different coupled climate models to expand on three key aspects of the ENSO–TNA teleconnection, using the suite of indices from Casselman et al. (2021). First, we assess the ability of both coupled models to reproduce the ENSO–TNA teleconnection, including the connecting mechanisms and resulting SSTAs in the tropical Atlantic. Second, we determine the TNA SSTA linearity with respect to ENSO's strength and compare it with results from reanalysis. Finally, using the indices for the teleconnection mechanisms from Casselman et al. (2021), we assess their linearity with respect to the Pacific SSTAs and bring to light potential sources of any nonlinear behavior. By using two different coupled models, we are able to take advantage of different basic state biases (such as SSTs) which may create differences in ENSO diversity and vertical atmospheric motion. In doing so, we can compare model differences in the pathways to improve our understanding of the source of any nonlinearity.
2.1 Data and statistical methods
We use monthly mean fields from the Japanese 55-year Reanalysis (JRA-55) (Kobayashi et al., 2015) and the Extended Reconstructed Sea Surface Temperature (ERSST) dataset version 5 (Huang et al., 2017a). All datasets are from January 1958 until December 2021 (extended from 2019 as used in Casselman et al., 2021) with low-frequency variability longer than 30 years removed using a filter derived from a fast Fourier transform (FFT).
Scatterplot analysis uses a locally weighted scatterplot smoothing (lowess) curve to represent the nonlinear fit (Cleveland, 1979; Cleveland and Devlin, 1988). Here, a lowess curve is a locally weighted polynomial regression that gives more weight to points nearest to the estimated response. Furthermore, this technique is non-parametric, allowing the datasets to be fitted without specifying the fitted linear polynomial function. The bandwidth, or so-called “smoothing parameter,” has been set to 0.3, following the recommended range from Cleveland (1979). Finally, to derive a 95 % confidence interval, we use a bootstrap method with 1000 samples (with replacement) of n data points, where n is the total number of events (Efron and Tibshirani, 1994). In addition to the lowess curve, we plot the linear fit using all data points and an ordinary least squares method. To derive the 95 % interval for the linear fit, we use a bootstrap method with 1000 samples (with replacement). Finally, to derive the deviation from a linear fit, we calculate the root mean squared error (RMSE):
where yi is the observed value and is the value predicted by the linear regression, each for the ith value. Correlation (R) is also used throughout this study, with confidence intervals determined using a Fisher transform (Devore, 1991; Simpson and Polvani, 2016).
2.2 Model simulations
The historical runs from two different CGCMs are used to analyze the ENSO–TNA teleconnection. These models are the Community Earth System Model version 1 – Whole Atmosphere Community Climate Model (CESM-WACCM) (Hurrell et al., 2013) and the Flexible Ocean and Climate Infrastructure version 1 (FOCI) (Matthes et al., 2020). These models are similar in that they are both high-top climate models, with CESM-WACCM using the Whole Atmosphere Community Climate Model 4 (WACCM4; Marsh et al., 2013), while FOCI uses the European Centre Hamburg General Circulation Model (ECHAM6.3; Müller et al., 2018). This feature is important, as better-resolving stratosphere–troposphere coupling helps to remove model biases over the Atlantic region (i.e., warm anomaly in the western tropical Atlantic) (Butler et al., 2016). Furthermore, improving the representation of mean Atlantic SSTs may play an important role in improving our ability to realistically represent the Atlantic's response to ENSO teleconnections (Joseph and Nigam, 2006). WACCM4 has a vertical resolution that extends to 5.1 × 10⁻⁶ hPa over 66 levels, while ECHAM6.3 extends to 0.01 hPa over 95 vertical levels. Horizontally, WACCM4 has a latitudinal resolution of 1.9∘ and longitudinal resolution of 2.5∘, while ECHAM6.3 has a resolution of 1.8∘ in both latitude and longitude. CESM-WACCM also has relaxed stratospheric winds that represent an idealized quasi-biennial oscillation (QBO) using a period of 28 months (Matthes et al., 2010), while FOCI can internally generate a realistic QBO (Matthes et al., 2020). In addition, the models differ in terms of their respective ocean component: CESM-WACCM uses the LANL Parallel Ocean Program version 2 (Pop2; Danabasoglu et al., 2012), which utilizes a tripolar horizontal grid of 1∘ × 1∘ with 60 depth levels, and FOCI uses the Nucleus for European Modelling of the Ocean version 3.6 (NEMO3.6; Matthes et al., 2020), which utilizes a tripolar horizontal grid of 0.5∘ × 0.5∘ and 46 depth levels.
We consider an ensemble of nine simulations from CESM-WACCM with the CMIP5 historical recommendations for external forcings from 1850 until 2004 and then the Representative Concentration Pathway 4.5 (RCP4.5) until 2014. Furthermore, CESM-WACCM uses improved solar forcings from CMIP6. Similarly, the FOCI ensemble consists of nine historical simulations following the CMIP6 external forcings from 1850 until 2014. Both FOCI and CESM-WACCM are restarted from a well-spun-up ocean state. All ensemble members are detrended by removing a linear trend that changes over a 30-year running window with respect to each individual ensemble member, resulting in the removal of the first and last 15 years. We prepare (i.e., detrend, calculate anomalies and climatology) each ensemble member separately, as each ensemble member is a free run and starts from different initial conditions (see Fig. S1 in the Supplement).
2.3 Index definitions and diagnostics
All indices presented in this paper follow those presented by Casselman et al. (2021), including the forthcoming tropical and extratropical indices. Over the tropical Atlantic, we define the TNA SSTAs using the area average over 5–25∘ N, 55–15∘ W (Taschetto et al., 2016). As in Casselman et al. (2021), we define the tropical pathway using the TT and Secondary Gill mechanisms, while the extratropical pathway is defined using the Southeastern Low index. The TT index measures the average tropospheric temperature anomaly between 850 and 200 hPa and over the region of 5∘ N–5∘ S, 70–10∘ W (Amaya and Foltz, 2014). The Secondary Gill response is derived using a maximum covariance analysis (MCA) between the 200 hPa asymmetric streamfunction (mean zonal winds removed) over 30∘ N–30∘ S, 90∘ W–45∘ E and the Pacific SSTAs over 45∘ N–45∘ S, 120∘ E–60∘ W. Here, the streamfunction component of the MCA is used to represent the Secondary Gill response. Finally, the Southeastern Low is measured using the sea level pressure (SLP) area average over 25–35∘ N, 90–70∘ W (see Casselman et al. (2021) for a detailed explanation of each index). Figures S2–S4 show spatial patterns of the aforementioned indices, which overall show very close similarities with reanalysis. This resemblance includes that Fig. S2 clearly shows the PNA pattern, Fig. S3 has a clear global equatorial temperature anomaly, and Fig. S4 shows an upper-level dipole about the Equator over the tropical Atlantic.
We use the 5-month average Niño3.4 SSTAs (averaged SSTs over 5∘ N–5∘ S, 170–120∘ W) from October to February (ONDJF) to quantify ENSO events. We then subsample the events into moderate, strong, and extreme events as ± 0.5–1.0 standard deviations (SD), ± 1.0–2.0 SD, and greater than 2.0 SD (for both positive and negative SD), respectively, following the definition by Casselman et al. (2021). The resulting number of events for each dataset can be seen in Table 1.
Table 1Summary of all ENSO events in CESM-WACCM (1850–2004), FOCI (1850–2004), and JRA-55 (1958–2021) for moderate, strong, and extreme ENSO subsampling ranges.
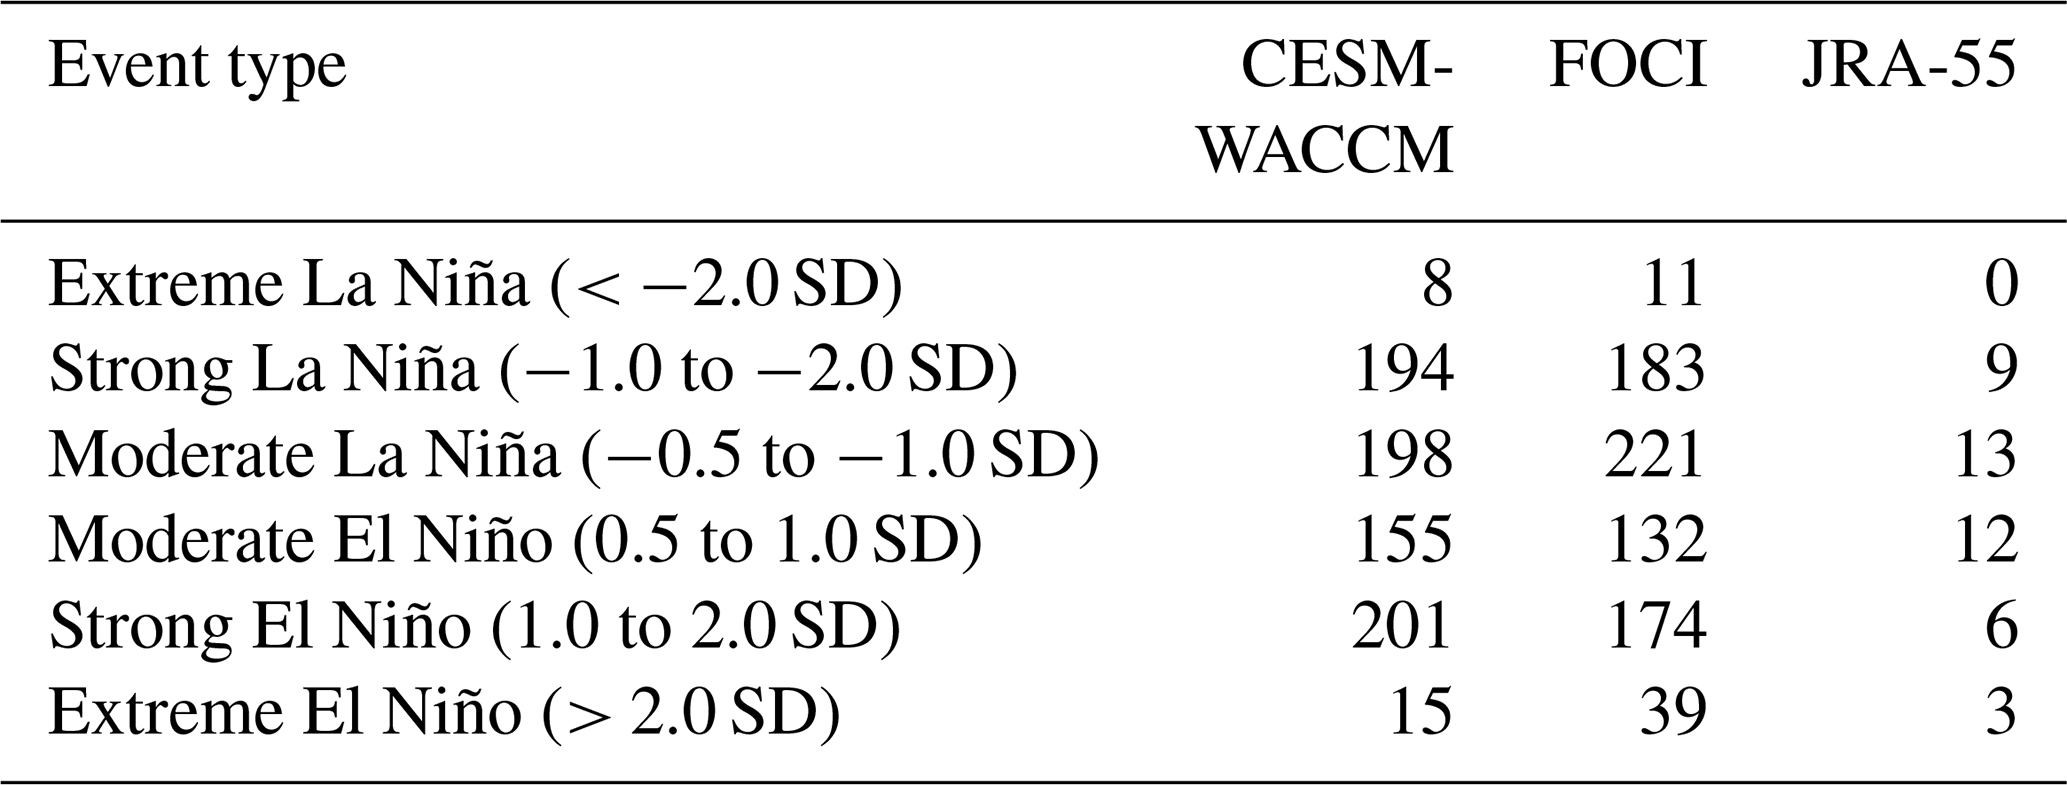
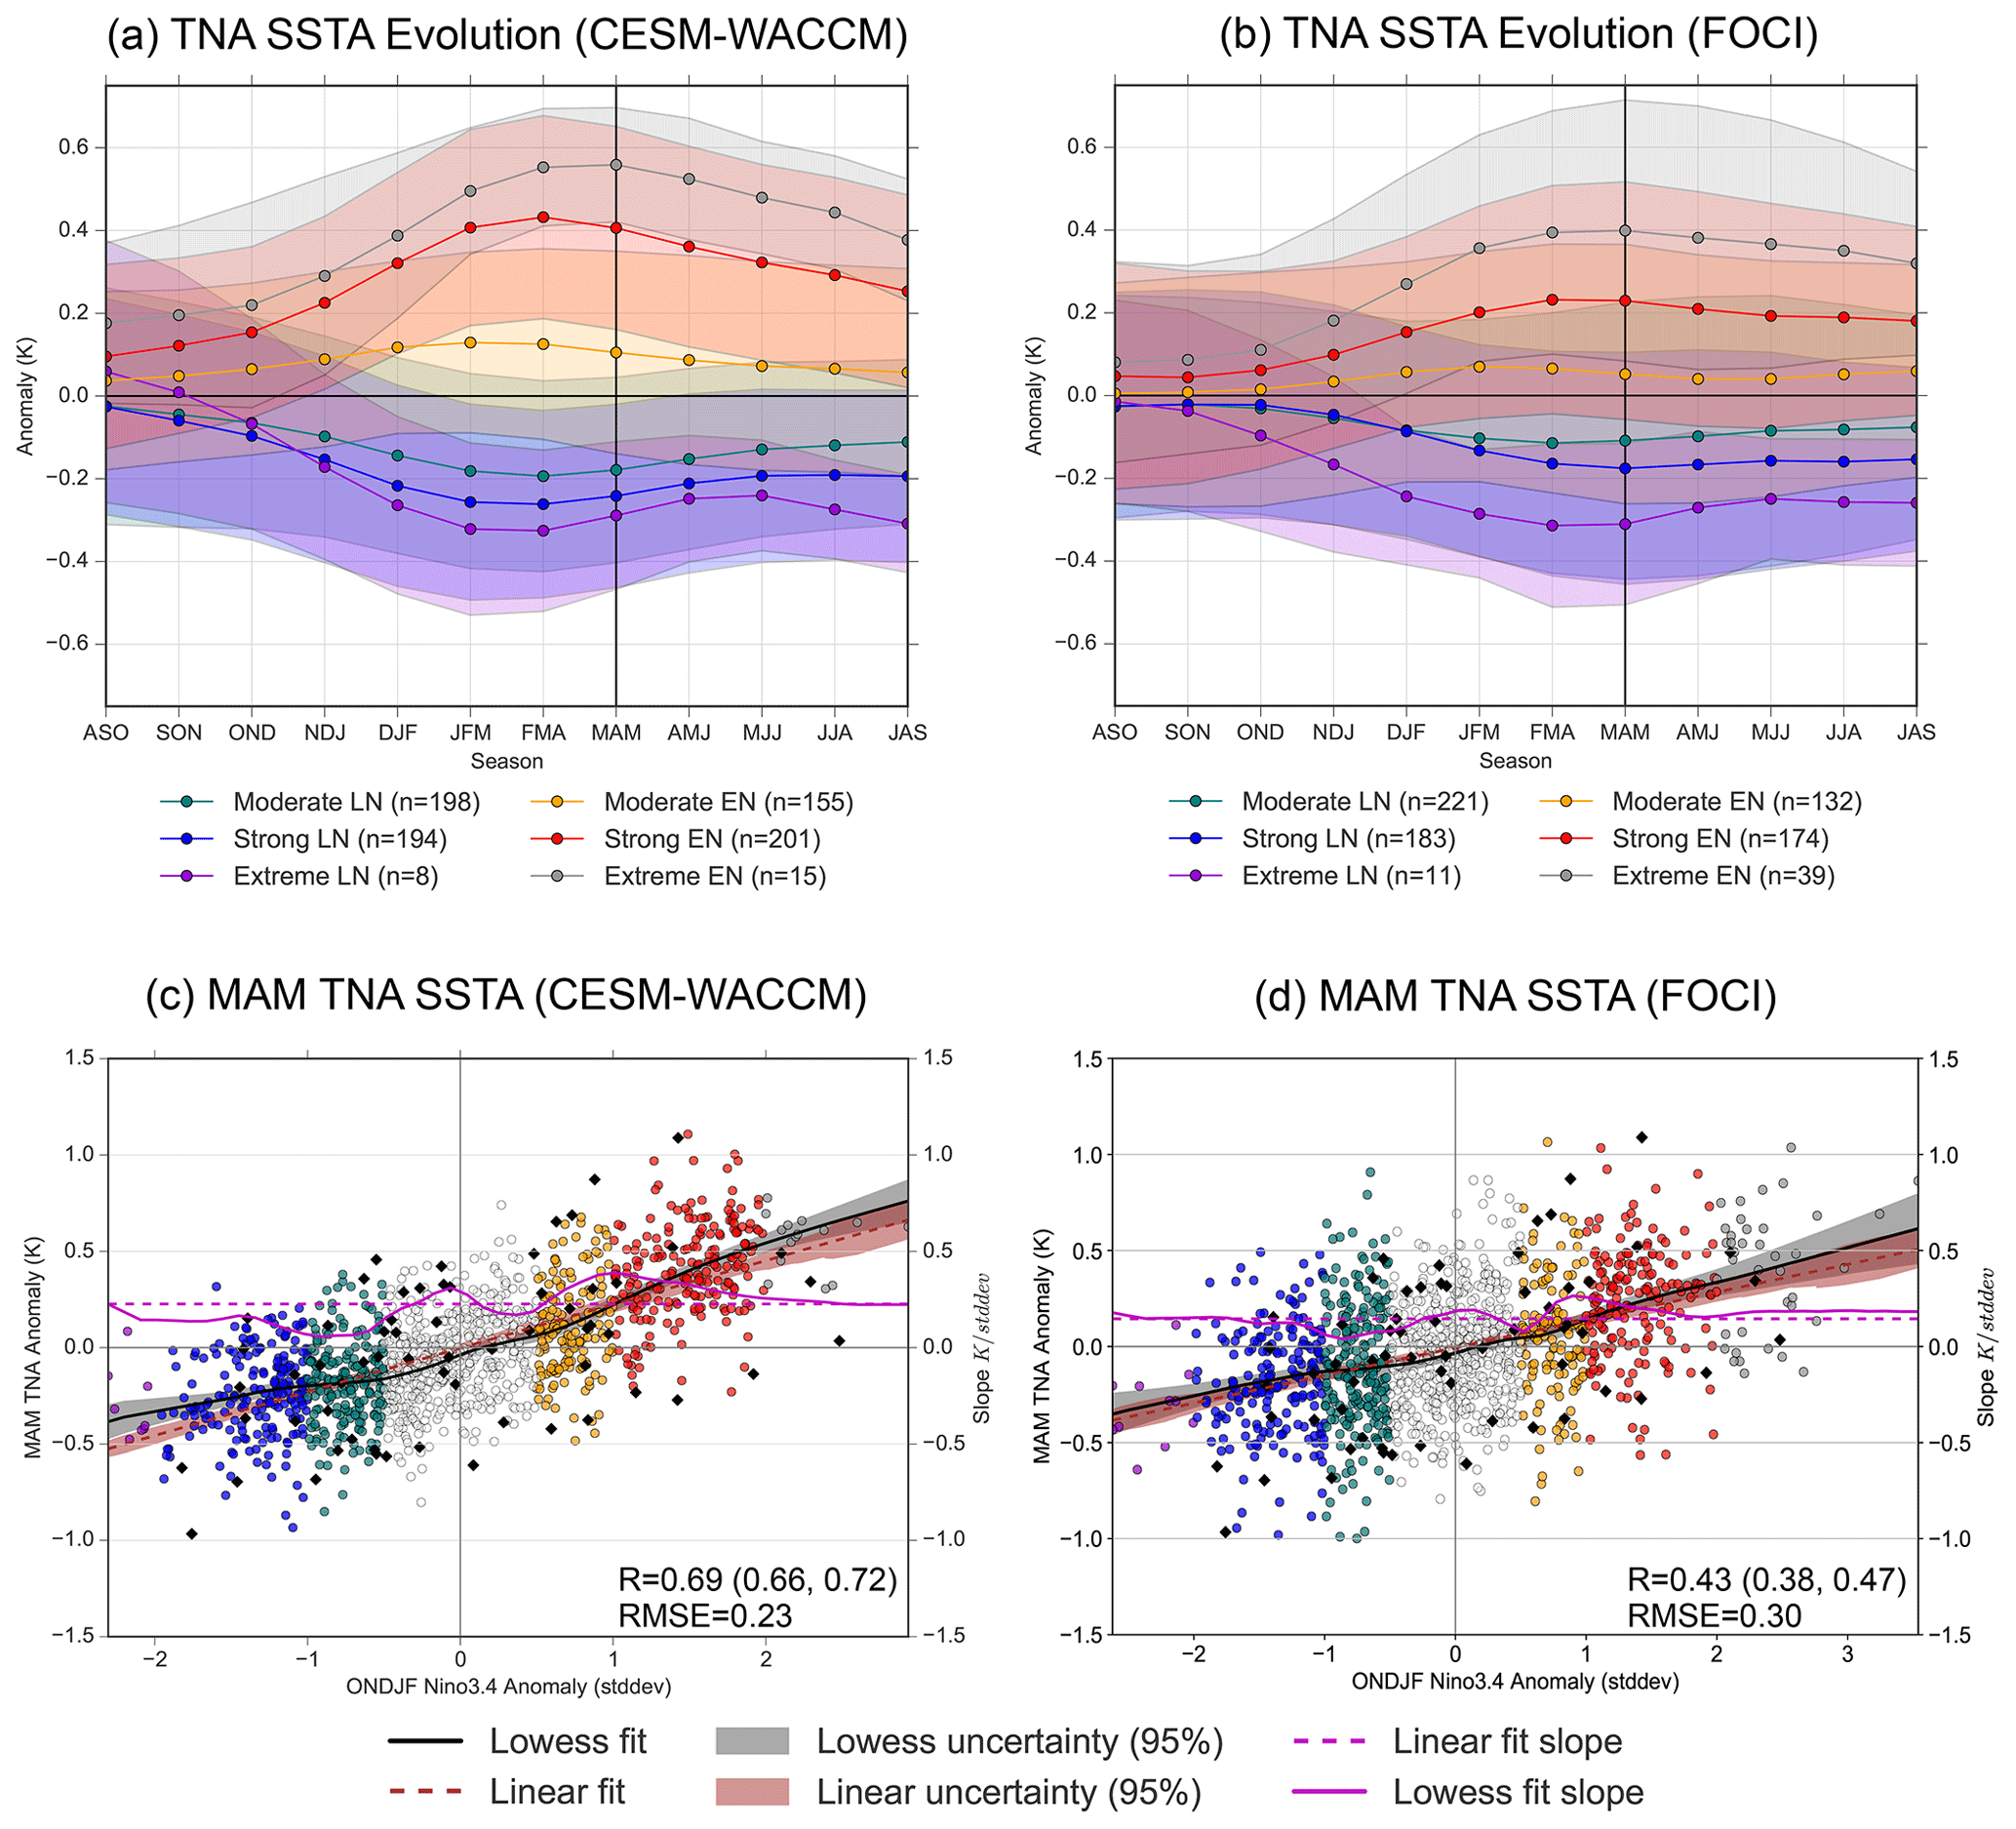
Figure 1Tropical North Atlantic SSTA relationships. (a, b) The composited seasonal evolution of the TNA SSTAs for CESM-WACCM (a) and FOCI (b) following an ENSO event. (c, d) The scatterplots between the TNA SSTAs (in ∘C) and Niño3.4 (in SD) for MAM for CESM-WACCM (c) and FOCI (d). The linear fit is represented by the dashed red line, while the lowess fit is represented by the solid black line (both with a 95 % confidence interval in shading). The slopes of these fits are represented by the dashed and solid magenta lines, respectively, and the right y axis indicates the corresponding slope values. Scatter coloring represents the subsampling ranges from extreme La Niña (in purple) to extreme El Niño (in dark grey) (see labeling below Fig. 1a and b). Neutral events are included in white. Results from JRA-55 (1958–2021) are shown as black diamonds, and an equivalent figure for JRA-55 can be seen in Fig. S10.
3.1 TNA response to ENSO SSTA forcing
To compare the impact of ENSO on the TNA region in CESM-WACCM and FOCI with reanalysis, Fig. 1 shows the seasonal evolution and peak month of the TNA SSTAs following an ENSO event separately for moderate, strong, and extreme ENSO events. For a comparison with JRA-55, see Fig. S5. In both models, TNA SSTAs peak in boreal spring following the decay of ENSO. However, it should be noted that the timing of the peak varies between El Niño and La Niña, with the earlier peaks corresponding more with La Niña. The TNA SSTA peak for CESM-WACCM (February to April, FMA) tends to lead reanalysis (March to May, MAM) by 1 month, while FOCI peaks in the same season as reanalysis (Fig. S5). As the peak of ENSO occurs between November and January (NDJ) for CESM-WACCM, FOCI, and JRA-55 (see Fig. S6), a similar peak timing in the source region implies that the mechanisms connecting the Pacific and Atlantic basins may explain the timing differences between CESM-WACCM and FOCI of the TNA SSTAs, instead of the Pacific itself, which we will look into in the next subsection.
To determine the linearity of the SST response in the Atlantic, Fig. 1c and d show a scatterplot analysis between the ONDJF Niño3.4 and the subsequent MAM mean TNA SSTAs, overlaid with a lowess and linear fit curve, as well as the slopes of each respective line. It should be noted that we chose to analyze the models during the MAM period to enable a straightforward comparison with reanalysis data. We compare the lowess curve and the linear fit to determine the linearity, with areas where the lowess shading does not overlap with the linear fit shading being considered statistically significantly different (> 95 %). However, it should be cautioned that the lowess curve may become less meaningful when fewer data points exist, i.e., for extreme ENSO events. For both CESM-WACCM and FOCI, the TNA SSTAs respond linearly to the strength of ENSO during extreme El Niño, which is different from the results found for this relationship in reanalysis (Casselman et al., 2021). Conversely, the TNA SSTAs respond linearly during extreme La Niña in FOCI but nonlinearly in CESM-WACCM. Specifically, TNA SSTAs in CESM-WACCM begin to plateau during extreme La Niña, whereby nearly all scatter points during extreme La Niña events are located above the linear fit shading, and the lowess 95 % confidence interval is separated from the linear fit shading. This nonlinearity is further evident from the differences in slope between extreme El Niño and extreme La Niña (magenta line), where extreme La Niña has a smaller slope than extreme El Niño in CESM-WACCM, but the slopes are very similar for both extremes' distribution in FOCI. When comparing CESM-WACCM and FOCI, we see that CESM-WACCM's correlation between the Niño3.4 and TNA SSTAs is significantly larger (correlation is 60 % higher than FOCI), indicating that CESM-WACCM simulates a stronger connection between ENSO and the TNA region. Finally, when compared to JRA-55 (black diamonds), both CESM-WACCM and FOCI match JRA-55's TNA response to a given ENSO event's strength, and thus both models capture the response of the TNA correctly.
.
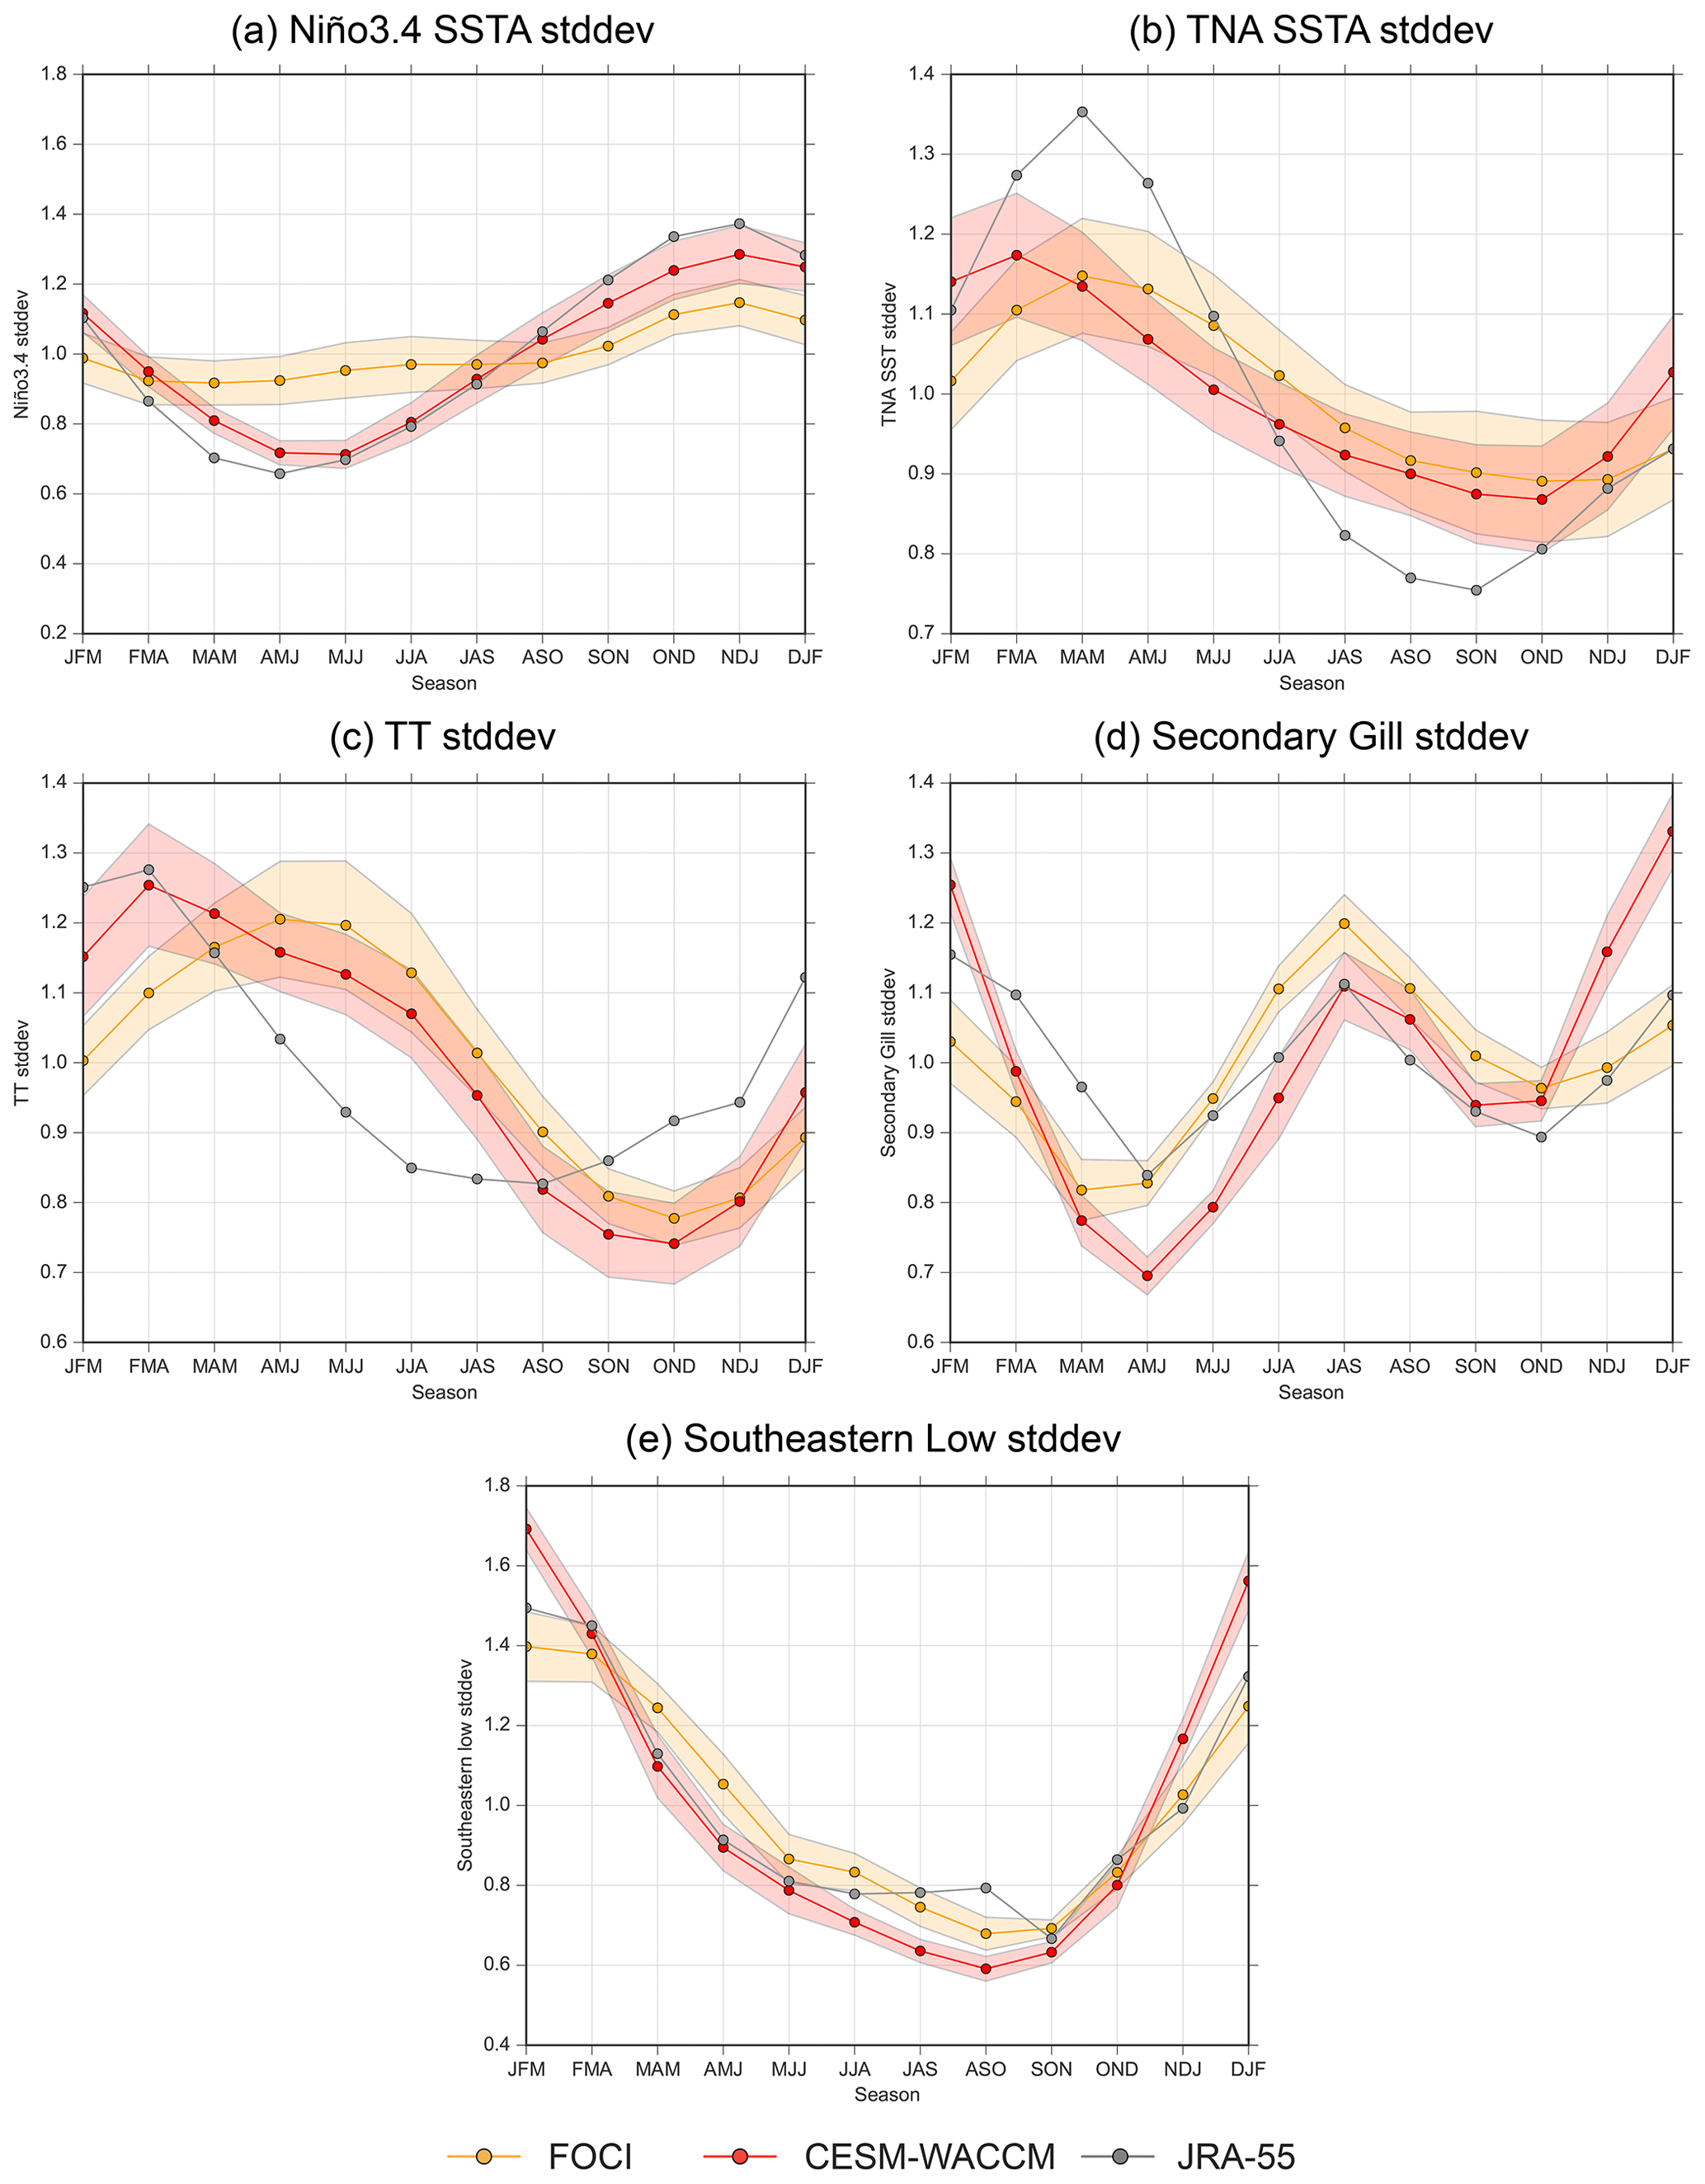
Figure 2Comparison of the mechanism indices' standard deviation (SD) between CESM-WACCM (red), FOCI (yellow), and JRA-55 (grey). Shading represents 1 SD of the ensemble spread, using bootstrapping with 1000 resamples. The standard deviations are normalized with the annual mean standard deviation to better relate to reanalysis. Without normalization, the results are similar and do not change the interpretation meaningfully
3.2 Representation of ENSO teleconnection mechanisms towards TNA region in climate models
In order to assess CESM-WACCM and FOCI's ability to represent the mechanisms connecting ENSO to the TNA, we compare the variance of each index (i.e., TT, Secondary Gill, Southeastern Low) throughout the year (i.e., independent of ENSO), including when the mechanism tends to peak (Fig. 2). Comparing the evolution of ENSO SSTAs between CESM-WACCM and FOCI, the ENSO SSTAs peak in NDJ (Fig. 2a), which is consistent with Fig. S6. However, FOCI has a much weaker phase locking when compared to both CESM-WACCM and JRA-55. Towards the tropical Atlantic, the peak TNA variance occurs 1 month early for CESM-WACCM with respect to both FOCI and reanalysis (Fig. 2b), and both CESM-WACCM and FOCI have a smaller magnitude in boreal spring than JRA-55. This lower magnitude may be due to the smaller magnitude seen in the ENSO SSTAs in NDJ for CESM-WACCM and FOCI (Fig. 2a). It is important to note that these biases are relatively small in absolute terms (approximately 15 % of reanalysis peak), and the origin is not zero.
Figure 2c shows that CESM-WACCM accurately reproduces the peak timing (FMA) and magnitude for the TT mechanism compared to JRA-55, but the decay is delayed following the peak. FOCI also has a similar peak magnitude but peaks 2 months later (in April–June, AMJ) than in the reanalysis and CESM-WACCM. For the Secondary Gill mechanism (Fig. 2d), both models simulate a peak around December–February (DJF), which is 1 month earlier than JRA-55, which is January–March (JFM). Furthermore, FOCI underestimates the variance magnitude in boreal winter, while CESM-WACCM overestimates the magnitude, although, in absolute terms, the differences are small (approximately 10 % of reanalysis peak). For the Southeastern Low (Fig. 2e), both CESM-WACCM and FOCI overlap considerably with the seasonal evolution in JRA-55, including the peak and minimum. CESM-WACCM also has a slight overestimation of Southeastern Low's magnitude in boreal winter. Overall, the two models have common biases when reproducing the set of mechanisms mediating the ENSO–TNA teleconnection, although CESM-WACCM more realistically represents the TT mechanism (especially peak timing). Furthermore, the extratropical pathway shows the most overlap between all three datasets and is likely the most accurately simulated out of the three mechanisms.
Overall, Fig. 2 shows that in CESM-WACCM the mechanism variance consistently peaks during the same season as in JRA-55, with the exception of the Secondary Gill mechanism. The Secondary Gill offset is also consistent with the seasonal evolution following an ENSO event (Fig. S7), which shows that the Secondary Gill mechanism in CESM-WACCM peaks 1 month earlier than in JRA-55 and FOCI. Thus, as all other mechanisms within CESM-WACCM peak during the same time as JRA-55 and FOCI, this result suggests that the offset peak of TNA SSTAs in CESM-WACCM may be due to the Secondary Gill mechanism. However, it remains unclear why FOCI does not have a similar offset in the TNA SSTAs, as the Secondary Gill mechanism is also offset for FOCI.

Figure 3Relationship between the major mechanisms for the tropical and extratropical pathways and the Niño3.4 SSTAs. The Niño3.4 SSTAs are shown for ONDJF, while the mechanisms are shown for their peak seasons (3-month average). Scatterplot colors match those in Fig. 1c and d. Results from JRA-55 (1958–2021) are shown with black diamonds, and the corresponding seasonal evolutions are shown in Fig. S7.
To further determine if CESM-WACCM and FOCI accurately represent the mechanisms connecting ENSO to the TNA and to analyze the linearity of these pathways, Fig. 3 shows scatterplots for the peak seasons for the TT, Secondary Gill, and Southeastern Low indices (the respective seasons are selected based on reanalysis peaks in Fig. S7). With respect to the ONDJF Niño3.4 index, the TT mechanism is significantly nonlinear during extreme La Niña for CESM-WACCM, while FOCI shows a nonlinear relationship that is, however, not significant (i.e., lowess vs. linear shading). In contrast, the Secondary Gill index shows a linear response during extreme La Niña for CESM-WACCM while weak (i.e., lowess curve has minor divergence from linear fit) nonlinearities for FOCI. In contrast, both tropical mechanisms show a relatively linear relationship during extreme El Niño. Thus, the relatively constant slope indicates that the TT response between strong and extreme El Niño events is likely linear, which is in contrast with the results from Casselman et al. (2021). These results clearly show that the tropical pathway towards the TNA is nonlinear, but there are inconsistencies between CESM-WACCM and FOCI. Namely, the nonlinearity for TT is much more significant in CESM-WACCM, and the nonlinearity for the Secondary Gill response is only present in FOCI, albeit it is not significantly different from the linear fit.
When comparing CESM-WACCM and FOCI's TT response to an ENSO event (Fig. 3a and b) to JRA-55's response (black diamonds), the overall TT lowess curve created by FOCI more strongly overlaps with JRA-55 when compared to CESM-WACCM. This stronger overlap is especially noticeable for strong and extreme El Niño, whereby most black diamonds fall beneath the lowess curve for CESM-WACCM but surround the lowess curve for FOCI. However, during extreme La Niña, the CESM-WACCM lowess curve appears to overlap better than FOCI, showing that the strong nonlinearity for CESM-WACCM is more consistent with historical data. For the Secondary Gill mechanism, the slope of the lowess curve for FOCI is too shallow to fully overlap with JRA-55, while CESM-WACCM matches well with JRA-55. Thus, both models can reproduce the tropical response seen in historical data (JRA-55), but each model has minor differences compared to the other model depending on the mechanism (i.e., TT vs. Secondary Gill) and the type of ENSO event (i.e., El Niño vs. La Niña).
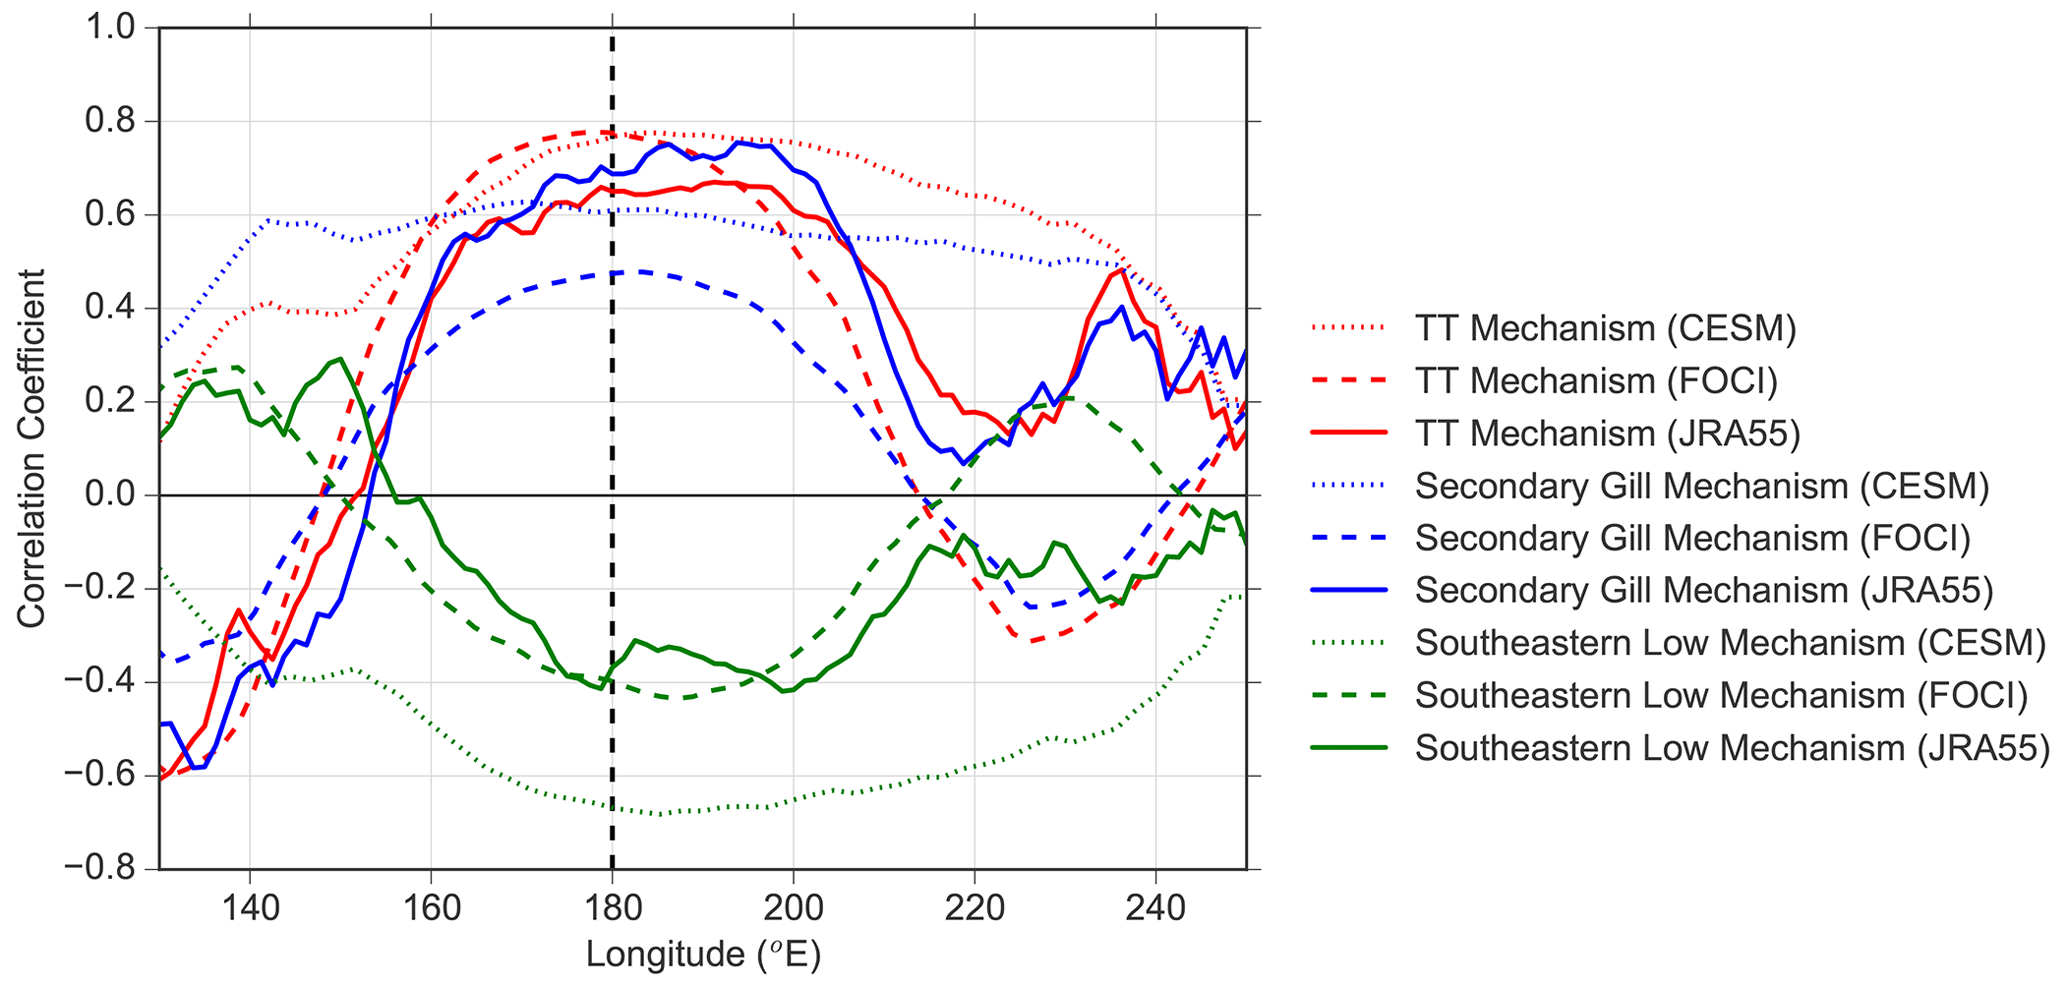
Figure 4Pointwise longitudinal correlation between the peak of the major mechanisms (same mechanisms as Fig. 3) and the ONDJF Pacific 200 hPa divergence averaged between 10∘ S–10∘ N. The respective peak season for each index is used, i.e., FMA for TT (red) and JFM for the Secondary Gill (blue) and Southeastern Low (green). CESM-WACCM (dotted line) and FOCI (dashed line) are also compared to JRA-55 data from 1958 until 2021 (solid line).
CESM-WACCM and FOCI both show similar responses for the extratropical pathway, including a nonlinear response during extreme La Niña (Fig. 3e and f). Here, further negative SSTAs in the tropical Pacific cease to create further increases in the strength of the Southeastern Low anomaly. This nonlinearity is larger in FOCI than CESM-WACCM, as the slope (magenta line) goes to zero for La Niña events stronger than approximately −1.5 SD. The slope during El Niño increases at approximately 0.5 SD in both models but is constant thereafter. Furthermore, when comparing to JRA-55, the lowess curves for both models overlap with reanalysis, showing that both models accurately reproduce the Southeastern Low response to ENSO. When comparing the Southeastern Low in CESM-WACCM and FOCI, the results show that the correlation in CESM-WACCM is significantly (> 95 % using Fisher transform) larger than in FOCI (−0.80 vs. −0.46; Fig. 3e and f). Overall, the large difference in the extratropical pathway correlation between CESM-WACCM and FOCI may also be important for the TNA SSTAs, as it may influence ENSO's effectiveness at perturbing the tropical Atlantic trade winds, as was shown in Ji and Fan (2020).
3.3 Source of nonlinearities between tropical Pacific and Atlantic SSTAs
Up to this point, we have related the ENSO–TNA teleconnections directly to the tropical Pacific SSTAs, showing that nonlinearities are present. However, the source of these nonlinearities remains unknown. As Jiménez-Esteve and Domeisen (2019) showed, a nonlinearity may exist between the tropical Pacific SSTAs and upper-level divergence. Since upper-level divergence is a key component of the ENSO–TNA teleconnection mechanisms (i.e., poleward propagation of Rossby wave train, source of vortex stretching for Kelvin waves; Wheeler and Kiladis, 1999; Lin et al., 2007), nonlinearities between Pacific SSTAs and upper-divergence may also play an important role in the nonlinearities towards the TNA region. Thus, we next relate the mechanisms directly to the tropical Pacific divergence instead of Pacific SSTAs using the same period (ONDJF). However, since it is unclear which regions of divergence are most salient, especially as the SSTA biases may shift the dominant divergence longitudinally, we first conduct a longitudinal correlation analysis using a meridional mean between 10∘ S–10∘ N.
Figure 4 shows a pointwise correlation between the peak season of each index (i.e., TT, Secondary Gill, Southeastern Low) and the ONDJF 200 hPa divergence in the tropical Pacific. The peak correlation is found around the dateline (180∘ E, dashed vertical line) for all indices, but the correlation magnitude varies considerably between CESM-WACCM and FOCI. Compared to the JRA-55 reanalysis, FOCI captures the peak longitude and magnitude of the correlation much better than CESM-WACCM for all indices. The only exception is east of approximately 220∘ E, where FOCI's correlation is often the opposite sign of that of JRA-55. For example, east of approximately 220∘ E, the Southeastern Low is negatively (positively) correlated with divergence for JRA-55 (FOCI).
Regarding the longitudinal distribution, CESM-WACCM also differs from JRA-55 and FOCI as there is a larger correlation in the western Pacific and a less prominent peak overall (also see Fig. S8 for a westward shift in anomalies with respect to JRA-55). When comparing the TT and Secondary Gill correlation in CESM-WACCM in the West Pacific (i.e., 150∘ E), the TT is only approximately 50 % as strong as its peak (that occurs around 180∘ E), while the Secondary Gill response shows a much stronger West Pacific correlation that is comparable to its peak. This distinct shift between the divergence relationship and the TT and Secondary Gill response may be important for explaining the difference in linearity between the TT and Secondary Gill responses for CESM-WACCM, as the West Pacific is an area where divergence responds linearly during La Niña (see Fig. S9). Thus, as the TT is less strongly related to the West Pacific than the Secondary Gill response, the TT is also perturbed less during extreme La Niña, as there is a westward shift.
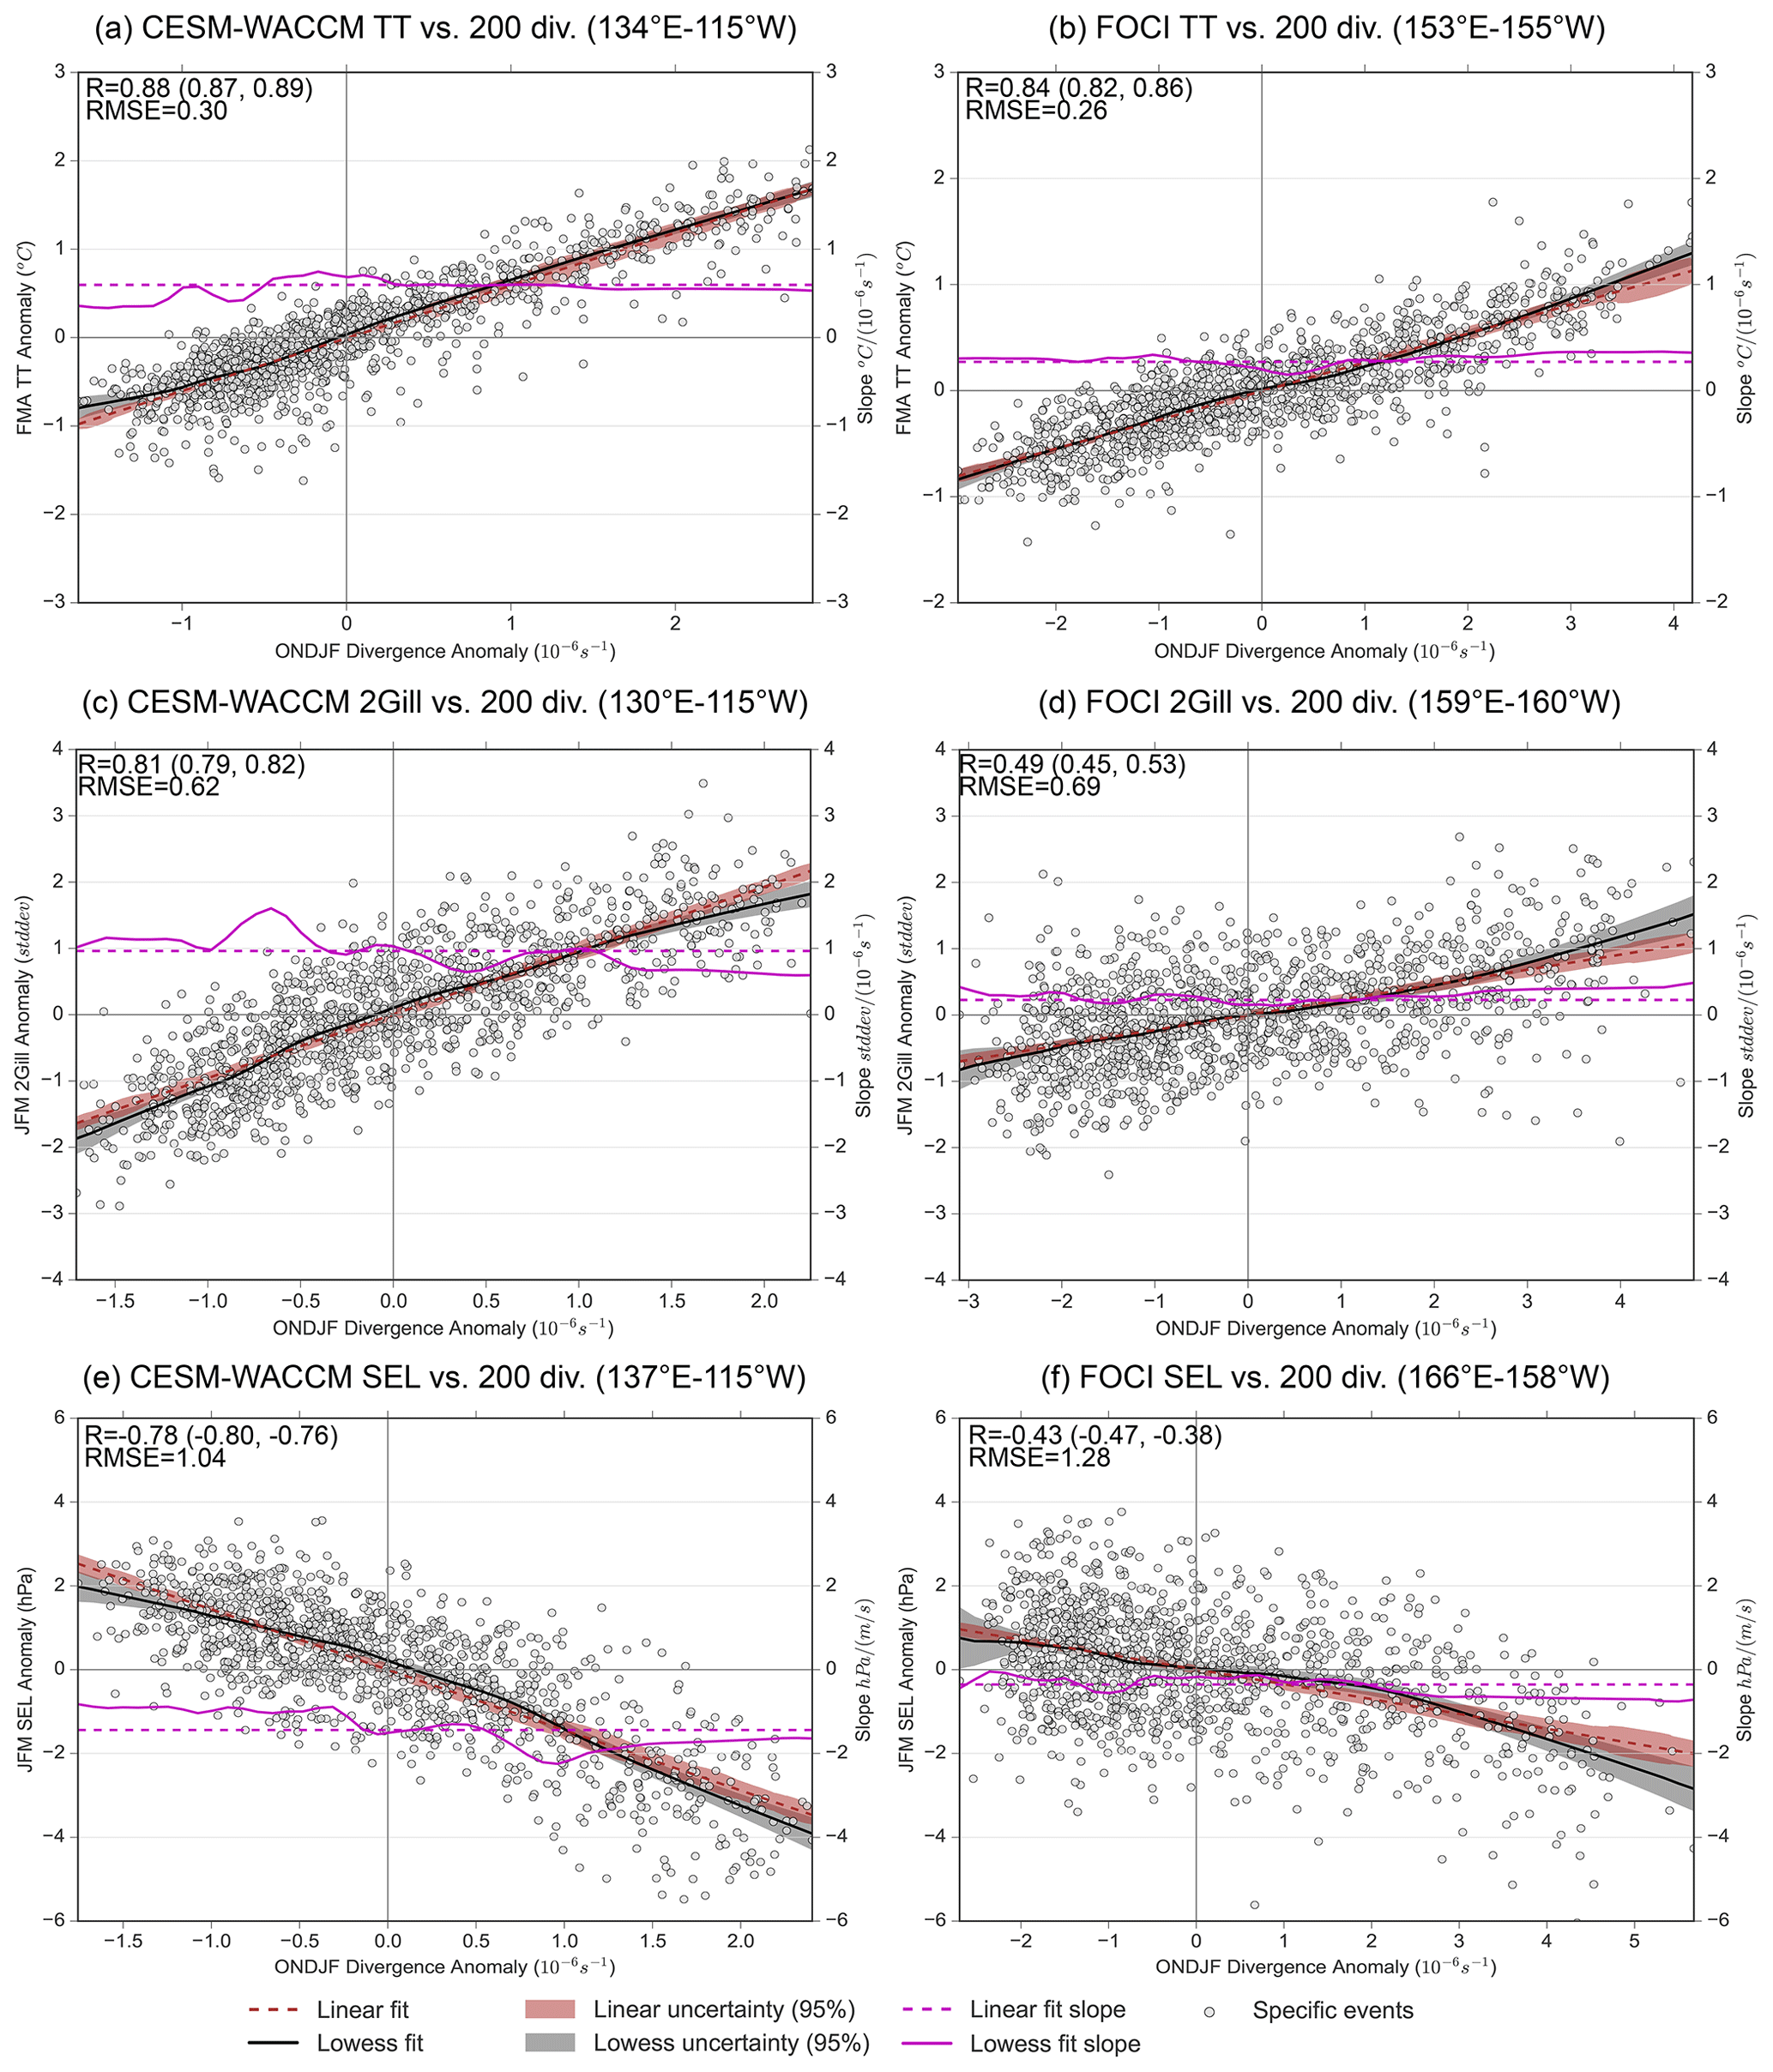
Figure 5Relationships between the major mechanisms for the tropical and extratropical pathways and the 200 hPa divergence anomaly. Scatterplot features match those in Fig. 1c and d, while the divergence anomalies are not separated by ENSO strength, as we no longer subsample based on ENSO.
To determine if the divergence plays an important role in nonlinearities throughout the ENSO–TNA teleconnection, Fig. 5 directly relates the mechanisms to the upper-level divergence averaged over the area that each mechanism correlates most strongly with. We subsample for the peak regions with a correlation coefficient greater than 0.3 (or < −0.30 in the case of the Southeastern Low) in order to capture the local maxima at approximately 180∘ E. It should be noted that the relationships between the mechanisms and divergence are not sensitive to the exact threshold. We find that the tropical pathway is more linear with respect to the upper-level divergence when compared to ENSO SSTAs (Fig. 3). However, even as the lowess and linear curve shading overlap considerably, some key differences occur when using divergence. First, there is an obvious positive skewness in divergence (i.e., maximum positive divergence is larger than maximum negative divergence) for CESM-WACCM and FOCI for both tropical mechanisms (Fig. 5a–d). Second, CESM-WACCM shows a trend in the lowess slope for the relationship between the Secondary Gill mechanism and upper-level divergence, whereby extreme positive upper-level divergence (i.e., extreme El Niño) becomes slightly less effective at perturbing this mechanism (Fig. 5c). FOCI instead shows the opposite nonlinear tendency (extreme positive upper-level divergence becomes slightly more effective as compared to extreme negative upper-level divergence) and has a more scattered relationship than CESM-WACCM (Fig. 5d).
The extratropical pathway also responds more linearly to the 200 hPa divergence when compared to its relationship with SSTAs, but minor nonlinearities remain (i.e., lowess curve in CESM-WACCM only marginally overlaps with linear fit; Fig. 5e and f). Furthermore, the response of the Southeastern Low to divergence in FOCI shows a much lower correlation when compared to CESM-WACCM. Overall, the change observed when relating the teleconnection mechanisms to divergence instead of SSTAs suggests that a potential source for the teleconnection nonlinearities originates from a nonlinearity between the Pacific SSTAs and the upper-level divergence. This finding is consistent with Jiménez-Esteve and Domeisen (2019), who showed the ENSO-Aleutian low nonlinearity arises from nonlinearities with the upper-level divergence. However, the nonlinear relationship between SST and divergence also does not fully explain the nonlinearities found in Fig. 3 because we still see minor changes in the slope between extreme La Niña and extreme El Niño for CESM-WACCM.
To understand why CESM-WACCM's TT mechanism is more nonlinear than in FOCI (concerning Niño3.4 SSTAs), Fig. S9 shows the divergence response over the Pacific to ENSO. Here, along the Equator between 190 and 220∘ E (Fig. S9e and f), the asymmetry between the La Niña and El Niño divergence response is stronger for CESM-WACCM than for FOCI (i.e., slope difference between extreme La Niña and El Niño is larger for CESM-WACCM). As the divergence asymmetries between El Niño and La Niña that occur over the Pacific are different between models, the response over the Atlantic may also be altered. This divergence asymmetry can be further seen in Fig. S10, where the divergence during La Niña responds more linearly in FOCI than CESM-WACCM, and FOCI also better matches JRA-55.
Another key difference in linearity with respect to Niño3.4 SSTAs includes that, for CESM-WACCM, the TT and Secondary Gill responses do not exhibit the same behavior (i.e., TT is nonlinear, while Secondary Gill is linear). One explanation for this difference is seen from the correlation of each index with the upper-level divergence (Fig. 4). Here, the Secondary Gill response is similarly related to much of the Pacific in CESM-WACCM, including the west, which responds more linearly during La Niña than the central or eastern Pacific (see Fig. S9). Conversely, the TT has a stronger peak around the dateline and less connection with the western Pacific, indicating a shift in the areas of divergence most important for the TT and Secondary Gill responses. Most notably, FOCI's correlation overlaps more closely with the connection seen in JRA-55 when compared with CESM-WACCM.
Differences between the modeled responses in divergence following an ENSO event (Fig. S10a and b) could be due to differences in the model physics and mean state biases between the models (see Figs. S11 and S12 for SST biases). However, in CESM-WACCM the 200 hPa divergence response to ENSO in DJF is more biased than FOCI (i.e., La Niña peak is too far west and strength is weaker compared to reanalysis), while the mean state bias in 200 hPa divergence for CESM-WACCM is smaller than in FOCI (Fig. S13a and b). Furthermore, differences in the mean state divergence biases between FOCI and CESM-WACCM may be due to different mechanisms, whereby CESM-WACCM may be due to an ITCZ bias, while FOCI appears more related to an anomalous Walker circulation (see Fig. S13c and d). Such differences may be related to different mean state biases in SSTs (i.e., strength or gradient) over the Pacific, even if the response biases during ENSO events are not related to different background mean state biases in SSTs (Fig. S12). Therefore, we have to note that we cannot fully explain the different behavior in the atmospheric responses during ENSO events of the two models, as the mean state biases do not directly translate into biases in the responses following an ENSO event. To further reveal the causes for the different responses in the two models is an interesting task but beyond the scope of this paper and better addressed in a multi-model study.
Using ensemble simulations from two CGCMs, namely CESM-WACCM and FOCI, we show that overall, the teleconnection between ENSO and the TNA SSTAs is well represented in comparison to reanalysis in both models. The TNA SSTAs following an ENSO event peak during the correct season (i.e., MAM) for FOCI but 1 month early in CESM-WACCM compared to the reanalysis. Compared to the findings of Casselman et al. (2021), we find that, in CESM-WACCM, the TNA SSTA response is linear during extreme El Niño and nonlinear during extreme La Niña, while in FOCI, the TNA SSTA response is linear for all ENSO forcings. Casselman et al. (2021) could not explain the nonlinearity via a mechanism connecting ENSO to the TNA and instead suggested that the Atlantic SST preconditioning may explain the nonlinearity. Specifically, they found a robust correlation between January TNA SSTAs and MAM TNA SSTAs, suggesting that the January SSTAs (i.e., SST preconditioning) act as a strong precursor for the MAM SSTAs. In the here-analyzed model runs, the influence of any anomalous SST preconditioning has been reduced in comparison to results for reanalysis (see boreal winter TNA SSTAs in Figs. 1a and b and S5a). Since the model results show a linear response for extreme El Niño when modulation by preconditioning is minimal, this further supports the notion that the nonlinearity in reanalysis (i.e., a plateau in the magnitude of SSTAs between strong and extreme El Niño) for TNA SSTAs may be due to SST preconditioning.
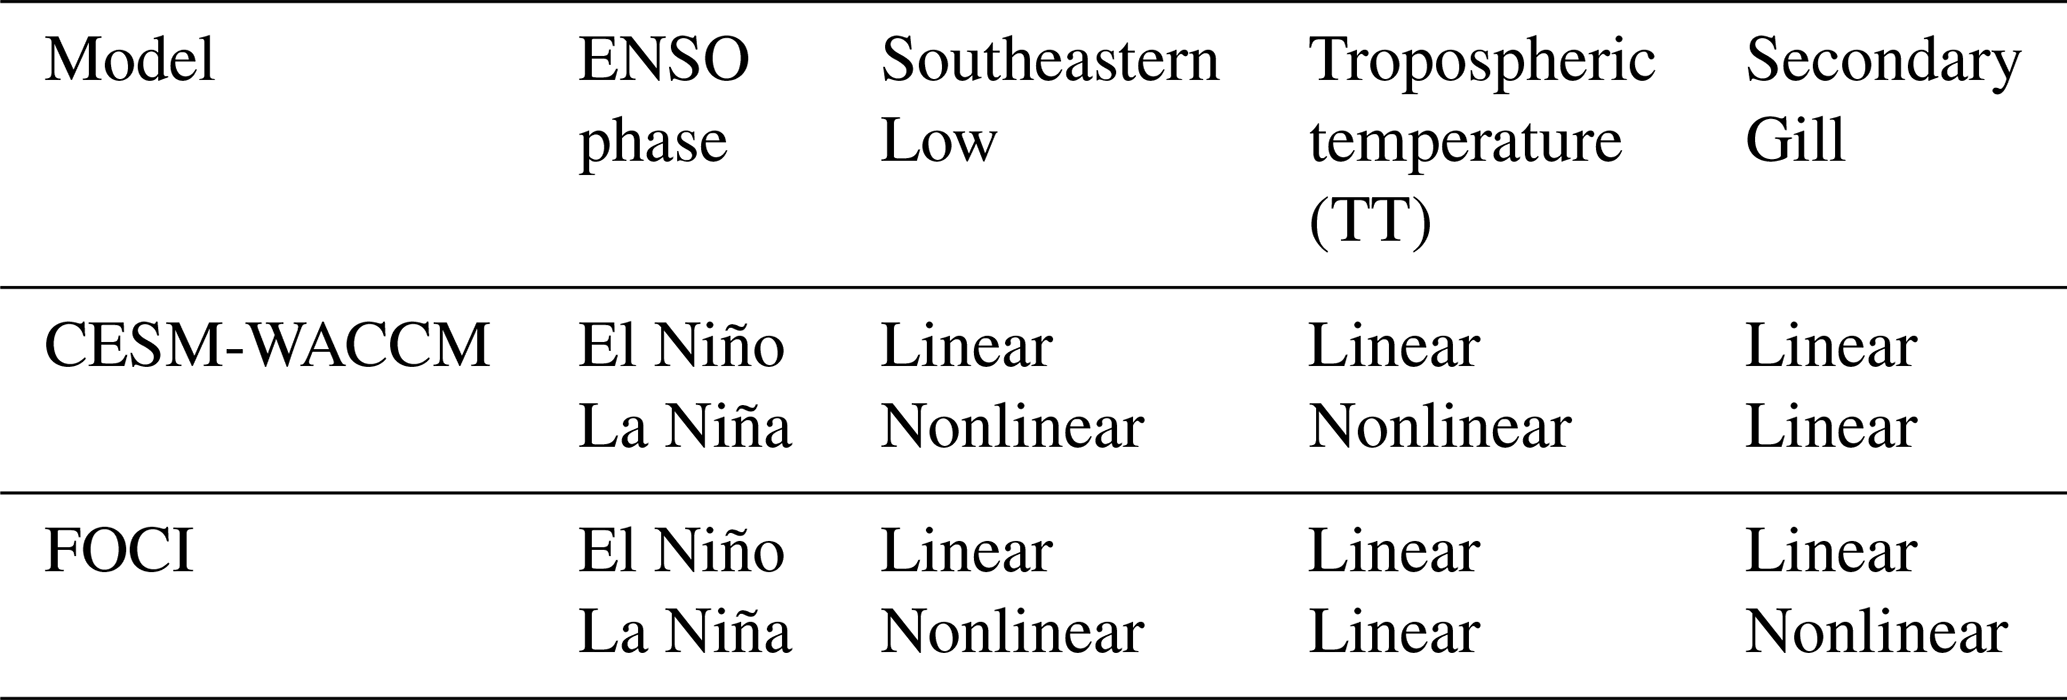
Differences between reanalysis and climate models (especially CESM-WACCM) for extreme La Niña may occur as the maximum strength of the La Niña forcing in reanalysis is too weak (i.e., no extreme events exist) to be influenced by nonlinearities. In climate models, La Niña events tend to be stronger than in reanalysis, and the asymmetry in strength between El Niño and La Niña is weaker (Zhang and Sun, 2014; Sun et al., 2016). The impact of stronger La Niña events is, however, not straightforward, as even with a clear nonlinearity for FOCI through the Southeastern Low and Secondary Gill responses during extreme La Niña, the overall TNA SSTA response remains linear (refer to Table 2 for a summary of the linearity of each mechanism). This linear response may occur due to a superposition of teleconnection mechanisms. Alternatively, this finding may indicate that the TNA SSTAs in FOCI underestimate the nonlinear response to ENSO forcing in comparison to CESM-WACCM, which responds more strongly to nonlinearities in the pathway. An underestimation of the nonlinearity in model ENSO teleconnections is generally observed in comparison to reanalysis data but is difficult to quantify given the limited sample size from observations (Domeisen et al., 2019).
Table 2Summary of the nonlinearities between ENSO and teleconnection mechanisms towards the TNA in CESM-WACCM and FOCI models for El Niño and La Niña phases.
Assessing each model's ability to represent the ENSO–TNA teleconnection mechanisms shows that each model represents the mechanism timing relatively well (Fig. 2c and d). Both models reproduce the seasonality of the extratropical pathway well in terms of both timing and magnitude, while the tropical pathway is less well represented. For example, the Secondary Gill mechanism timing is early for both models by 1 month, while only CESM-WACCM can properly reproduce the TT mechanism's timing. To understand what the source may be for this issue, it is important to note that the ability to reproduce the tropical pathway relies on a proper representation of the Pacific Walker cell. Furthermore, as the Kelvin wave power spectra can also be influenced by precipitation biases (Maher et al., 2018), and FOCI and CESM-WACCM both exhibit an underestimation of precipitation over South America (Matthes et al., 2020; Danabasoglu et al., 2020), this may also help to explain differences in variance. Overall, CESM-WACCM and FOCI both reproduce the TT and Secondary Gill response magnitudes during an ENSO event well (Fig. 3a–d), even if issues exist for reproducing each tropical mechanism's timing.
A key aspect of our study was to use two different climate models, which may result in different representations of the mechanisms due to differences in the mean state biases. Such differences are evident for the longitudinal correlation between the teleconnection mechanisms and upper-level divergence (Fig. 4), where CESM-WACCM does not match reanalysis, unlike FOCI. These differences also mirror the differences in the upper-level divergence response over the Pacific (Fig. S10a and b), where CESM-WACCM also lacks a clear peak in divergence, while FOCI closely matches JRA-55. Furthermore, the small deviation for the divergence in reanalysis (Fig. S10c) gives confidence that this is a robust result, even though the number of events is small (i.e., nine strong La Niña, six strong El Niño). Finally, it is unclear if mean state biases play a role in biased responses during ENSO since biases in upper-level divergence during an ENSO event do not correlate with the model mean state biases for upper-level divergence.
Through the extratropical pathway, we find that when comparing CESM-WACCM and FOCI, the Southeastern Low and ENSO have a significantly higher correlation in CESM-WACCM, which may explain the better connection of ENSO to the TNA region in CESM-WACCM. Initially, the low correlation in FOCI was thought to likely be due to the extratropical pathway being more nonlinear during extreme La Niña for FOCI (see slope differences between CESM-WACCM and FOCI in Fig. 3). However, even when comparing the Southeastern Low to the upper-level divergence, where the relationship is more linear than with SSTAs, the large difference in correlation remains. Therefore, it remains unclear why the pathways have such a large difference in correlation, especially when the basic states for each index are similar. Furthermore, as the Southeastern Low continues to show a nonlinear response when related to upper-level divergence, the nonlinearity between tropical Pacific SSTAs and upper-level divergence does not fully explain the nonlinearity between ENSO and the Southeastern Low.
Overall, this study shows that CESM-WACCM and FOCI can reproduce the ENSO–TNA teleconnection and expands on key differences between climate models and reanalysis, including, for example, biases in upper-level divergence over the tropical Pacific. Future studies could further focus on model biases that drive different upper-level divergence responses, as upper-level divergence nonlinearities play an important role in the ENSO–TNA teleconnection. Furthermore, although we did not expand on the differences between central and eastern ENSO events, there is clearly a longitudinal difference in upper-level divergence between CESM-WACCM and FOCI. This is further highlighted in Fig. S4, which shows that CESM-WACCM has SSTAs that peak further east compared to reanalysis, while SSTAs in FOCI are similar to the SSTAs in reanalysis. Thus, future studies should consider the impact of central and eastern ENSO events on the TNA teleconnection in coupled models. Finally, future research could also examine the weak response of FOCI TNA SSTAs to nonlinearities in the ENSO–TNA teleconnection, a question that remains unanswered in this study.
The NCAR research data archive (https://doi.org/10.5065/D60G3H5B, Japan Meteorological Agency, 2013) was used to obtain the JRA-55 and ERSSTv5 datasets. The Community Earth System Model version 1.0 (CESM 1.0.6) source code used in this study can be found at https://doi.org/10.7289/V5T72FNM (Huang et al., 2017b). Due to licensing issues and since FOCI comprises several component models, the source code for the Flexible Ocean and Climate Infrastructure version 1 (FOCI1) used in this study cannot be fully distributed. The full source code for ECHAM6 (we use 6.3.05p2) can be found at http://www.cesm.ucar.edu/models/cesm1.0 (CESM et al., 2020), https://www.mpimet.mpg.de/en/science/models/mpiesm/echam.html (Rast, 1992), and the source code for NEMO can be found at https://forge.ipsl.jussieu.fr/nemo/wiki/Users/release-3.6 (Madec and the NEMO System Team, 2020) and https://doi.org/10.5281/zenodo.3568061 (Wahl, 2020). Matthes et al. (2020) contains all ECHAM and NEMO source code modifications, as well as the namelist. Raw data sources for CESM-WACCM and FOCI are available from the public archives found in Kruschke et al. (2020) (http://hdl.handle.net/21.14106/8f8299caafde8c36dec6898f8d425cb1d078cd77) and Wahl and Huo (2021) (http://hdl.handle.net/21.14106/62d25c6656418115757b5405c7910e7dbe809d99), respectively.
The supplement related to this article is available online at: https://doi.org/10.5194/wcd-4-471-2023-supplement.
JWC performed the analysis and writing of the manuscript. TB contributed to the interpretation of the results, as well as editing the manuscript. JFL contributed to the interpretation of the results, as well as editing the manuscript. WH contributed to the setup of CESM-WACCM and FOCI and to editing the manuscript. SW contributed to the setup of CESM-WACCM and FOCI and to editing the manuscript. DIVD contributed to the analysis and interpretation of the results, as well as writing the manuscript.
At least one of the (co-)authors is a member of the editorial board of Weather and Climate Dynamics. The peer-review process was guided by an independent editor, and the authors also have no other competing interests to declare.
Publisher's note: Copernicus Publications remains neutral with regard to jurisdictional claims in published maps and institutional affiliations.
The CESM and most of the FOCI simulations were performed at the German Climate Computing Centre (Deutsches Klimarechenzentrum, DKRZ) in Hamburg, Germany. The remaining FOCI simulations used computing time provided on the supercomputer Lise at NHR@Göttingen as part of project shk00018.
This research has been supported by the ETH Zürich Foundation (grant no. ETH-17 18-1), the Deutsche Forschungsgemeinschaft (grant no. 429334714), the Schweizerischer Nationalfonds zur Förderung der Wissenschaftlichen Forschung (grant no. PP00P2_198896), and the Bundesministerium für Bildung und Forschung (grant no. 01LG1906A).
This paper was edited by Paulo Ceppi and reviewed by two anonymous referees.
Alexander, M. and Scott, J.: The influence of ENSO on air–sea interaction in the Atlantic, Geophys. Res. Lett., 29, 46-1–46-4, https://doi.org/10.1029/2001GL014347, 2002. a
Amaya, D. J. and Foltz, G. R.: Impacts of canonical and Modoki El Niño on tropical Atlantic SST, J. Geophys. Res.-Oceans, 119, 777–789, https://doi.org/10.1002/2013JC009476, 2014. a, b, c
Bayr, T., Domeisen, D. I., and Wengel, C.: The effect of the equatorial Pacific cold SST bias on simulated ENSO teleconnections to the North Pacific and California, Clim. Dynam., 53, 3771–3789, https://doi.org/10.1007/s00382-019-04746-9, 2019a. a
Bayr, T., Wengel, C., Latif, M., Dommenget, D., Lübbecke, J., and Park, W.: Error compensation of ENSO atmospheric feedbacks in climate models and its influence on simulated ENSO dynamics, Clim. Dynam., 53, 155–172, https://doi.org/10.1007/s00382-018-4575-7, 2019b. a
Bellenger, H., Guilyardi, E., Leloup, J., Lengaigne, M., and Vialard, J.: ENSO representation in climate models: From CMIP3 to CMIP5, Clim. Dynam., 42, 1999–2018, https://doi.org/10.1007/s00382-013-1783-z, 2014. a
Butler, A. H., Arribas, A., Athanassiadou, M., Baehr, J., Calvo, N., Charlton-Perez, A., Déqué, M., Domeisen, D. I., Fröhlich, K., Hendon, H., Imada, Y., Ishii, M., Iza, M., Karpechko, A. Y., Kumar, A., Maclachlan, C., Merryfield, W. J., Müller, W. A., O'Neill, A., Scaife, A. A., Scinocca, J., Sigmond, M., Stockdale, T. N., and Yasuda, T.: The Climate-system Historical Forecast Project: Do stratosphere-resolving models make better seasonal climate predictions in boreal winter?, Q. J. Roy. Meteor. Soc., 142, 1413–1427, https://doi.org/10.1002/qj.2743, 2016. a
Cai, W., Santoso, A., Collins, M., Dewitte, B., Karamperidou, C., Kug, J. S., Lengaigne, M., McPhaden, M. J., Stuecker, M. F., Taschetto, A. S., Timmermann, A., Wu, L., Yeh, S. W., Wang, G., Ng, B., Jia, F., Yang, Y., Ying, J., Zheng, X. T., Bayr, T., Brown, J. R., Capotondi, A., Cobb, K. M., Gan, B., Geng, T., Ham, Y. G., Jin, F. F., Jo, H. S., Li, X., Lin, X., McGregor, S., Park, J. H., Stein, K., Yang, K., Zhang, L., and Zhong, W.: Changing El Niño–Southern Oscillation in a warming climate, Nature Reviews Earth and Environment, 2, 628–644, https://doi.org/10.1038/s43017-021-00199-z, 2021. a
Callahan, C. W., Chen, C., Rugenstein, M., Bloch-Johnson, J., Yang, S., and Moyer, E. J.: Robust decrease in El Niño/Southern Oscillation amplitude under long-term warming, Nat. Clim. Change, 11, 752–757, https://doi.org/10.1038/s41558-021-01099-2, 2021. a
Casselman, J. W., Taschetto, A. S., and Domeisen, D. I.: Non-linearity in the pathway of El Niño-Southern Oscillation to the tropical North Atlantic, J. Climate, 34, 7277–7296, https://doi.org/10.1175/jcli-d-20-0952.1, 2021. a, b, c, d, e, f, g, h, i, j, k, l, m, n, o, p, q, r, s
Casselman, J. W., Jiménez-Esteve, B., and Domeisen, D. I. V.: Modulation of the El Niño teleconnection to the North Atlantic by the tropical North Atlantic during boreal spring and summer, Weather Clim. Dynam., 3, 1077–1096, https://doi.org/10.5194/wcd-3-1077-2022, 2022. a
Cassou, C. and Terray, L.: Oceanic forcing of the wintertime low-frequency atmospheric variability in the North Atlantic European Sector: A study with the ARPEGE model, J. Climate, 14, 4266–4291, https://doi.org/10.1175/1520-0442(2001)014<4266:OFOTWL>2.0.CO;2, 2001. a
CESM – Community Earth System Model, CESG – Software Engineering Group, and NCAR: CESM1.0 Public Release, CESM [code], http://www.cesm.ucar.edu/models/cesm1.0 (last access: 25 June 2021), 2020. a
Chiang, J. C. and Sobel, A. H.: Tropical tropospheric temperature variations caused by ENSO and their influence on the remote tropical climate, J. Climate, 15, 2616–2631, https://doi.org/10.1175/1520-0442(2002)015<2616:TTTVCB>2.0.CO;2, 2002. a
Chiang, J. C. H.: Deconstructing Atlantic Intertropical Convergence Zone variability: Influence of the local cross-equatorial sea surface temperature gradient and remote forcing from the eastern equatorial Pacific, J. Geophys. Res., 107, 4004, https://doi.org/10.1029/2000JD000307, 2002. a
Chiodi, A. M. and Harrison, D. E.: El Niño impacts on seasonal US atmospheric circulation, temperature, and precipitation anomalies: The OLR-event perspective, J. Climate, 26, 822–837, 2013. a
Cleveland, W. S.: Robust locally weighted regression and smoothing scatterplots, J. Am. Stat. Assoc., 74, 829–836, https://doi.org/10.1080/01621459.1979.10481038, 1979. a, b
Cleveland, W. S. and Devlin, S. J.: Locally weighted regression: An approach to regression analysis by local fitting, J. Am. Stat. Assoc., 83, 596–610, https://doi.org/10.1080/01621459.1988.10478639, 1988. a
Danabasoglu, G., Bates, S. C., Briegleb, B. P., Jayne, S. R., Jochum, M., Large, W. G., Peacock, S., and Yeager, S. G.: The CCSM4 ocean component, J. Climate, 25, 1361–1389, https://doi.org/10.1175/JCLI-D-11-00091.1, 2012. a
Danabasoglu, G., Lamarque, J. F., Bacmeister, J., Bailey, D. A., DuVivier, A. K., Edwards, J., Emmons, L. K., Fasullo, J., Garcia, R., Gettelman, A., Hannay, C., Holland, M. M., Large, W. G., Lauritzen, P. H., Lawrence, D. M., Lenaerts, J. T., Lindsay, K., Lipscomb, W. H., Mills, M. J., Neale, R., Oleson, K. W., Otto-Bliesner, B., Phillips, A. S., Sacks, W., Tilmes, S., van Kampenhout, L., Vertenstein, M., Bertini, A., Dennis, J., Deser, C., Fischer, C., Fox-Kemper, B., Kay, J. E., Kinnison, D., Kushner, P. J., Larson, V. E., Long, M. C., Mickelson, S., Moore, J. K., Nienhouse, E., Polvani, L., Rasch, P. J., and Strand, W. G.: The Community Earth System Model Version 2 (CESM2), J. Adv. Model. Earth Sy., 12, 1–35, https://doi.org/10.1029/2019MS001916, 2020. a
Devore, J. L.: Probability and Statistics for Engineering and the Sciences, Cole Publishing Company, 19, 87, https://doi.org/10.2307/2532427, 1991. a
Domeisen, D. I. V., Garfinkel, C. I., and Butler, A. H.: The Teleconnection of El Niño Southern Oscillation to the Stratosphere, Rev. Geophy., 57, 5–47, https://doi.org/10.1029/2018RG000596, 2019. a
Efron, B. and Tibshirani, R.: An Introduction to the Bootstrap, CRC Press, https://doi.org/10.1201/9780429246593, 1994. a
Enfield, D. B. and Alfaro, E. J.: The dependence of Caribbean rainfall on the interaction of the tropical Atlantic and Pacific Oceans, J. Climate, 12, 2093–2103, https://doi.org/10.1175/1520-0442(1999)012<2093:TDOCRO>2.0.CO;2, 1999. a
Enfield, D. B. and Mayer, D. A.: Tropical atlantic sea surface temperature variability and its relation to El Niño-Southern Oscillation, J. Geophys. Res.-Oceans, 102, 929–945, https://doi.org/10.1029/96jc03296, 1997. a
Feng, J., Chen, W., and Li, Y.: Asymmetry of the winter extra-tropical teleconnections in the Northern Hemisphere associated with two types of ENSO, Clim. Dynam., 48, 2135–2151, https://doi.org/10.1007/s00382-016-3196-2, 2017. a
Feng, J., Lian, T., Ying, J., Li, J., and Li, G.: Do CMIP5 Models show El Niño Diversity?, J. Climate, 33, 1619–1641, https://doi.org/10.1175/JCLI-D-18-0854.1, 2020. a
Fredriksen, H. B., Berner, J., Subramanian, A. C., and Capotondi, A.: How Does El Niño–Southern Oscillation Change Under Global Warming – A First Look at CMIP6, Geophys. Res. Lett., 47, e2020GL090640, https://doi.org/10.1029/2020GL090640, 2020. a
García-Serrano, J., Cassou, C., Douville, H., Giannini, A., and Doblas-Reyes, F. J.: Revisiting the ENSO teleconnection to the tropical North Atlantic, J. Climate, 30, 6945–6957, https://doi.org/10.1175/JCLI-D-16-0641.1, 2017. a
Ge, Z. A. and Chen, L.: Preliminary analysis of the zonal distribution of ENSO-related SSTA in three CMIP5 coupled models, Atmos. Ocean. Sci. Lett., 13, 443–451, https://doi.org/10.1080/16742834.2020.1775475, 2020. a
George, S. E. and Saunders, M. A.: North Atlantic Oscillation impact on tropical north Atlantic winter atmospheric variability, Geophys. Res. Lett., 28, 1015–1018, https://doi.org/10.1029/2000GL012449, 2001. a
Giannini, A., Kushnir, Y., and Cane, M. A.: Interannual variability of Caribbean rainfall, ENSO, and the Atlantic Ocean, J. Climate, 13, 297–311, https://doi.org/10.1175/1520-0442(2000)013<0297:IVOCRE>2.0.CO;2, 2000. a
Giannini, A., Saravanan, R., and Chang, P.: The preconditioning role of Tropical Atlantic Variability in the development of the ENSO teleconnection: Implications for the prediction of Nordeste rainfall, Clim. Dynam., 22, 839–855, https://doi.org/10.1007/s00382-004-0420-2, 2004. a, b
Giannini, A., Biasutti, M., Held, I. M., and Sobel, A. H.: A global perspective on African climate, Climatic Change, 90, 359–383, https://doi.org/10.1007/s10584-008-9396-y, 2008. a
Gill, A. E.: Some simple solutions for heat-induced tropical circulation, Q. J. Roy. Meteor. Soc., 106, 447–462, https://doi.org/10.1002/qj.49710644905, 1980. a, b
Graf, H. F. and Zanchettin, D.: Central pacific El niño, the “subtropical bridge,” and Eurasian climate, J. Geophys. Res.-Atmos., 117, 1–10, https://doi.org/10.1029/2011JD016493, 2012. a
Graham, N. E. and Barnett, T. P.: Sea surface temperature, surface wind divergence, and convection over tropical oceans, Science, https://doi.org/10.1126/science.238.4827.657, 1987. a, b
Harlaß, J., Latif, M., and Park, W.: Improving climate model simulation of tropical Atlantic sea surface temperature: The importance of enhanced vertical atmosphere model resolution, Geophys. Res. Lett., 42, 2401–2408, https://doi.org/10.1002/2015GL063310, 2015. a
Hastenrath, S.: Interannual and longer-term variability of upper air circulation in the Northeast Brazil-tropical Atlantic sector, J. Geophys. Res.-Atmos., 105, 7327–7335, https://doi.org/10.1029/1999JD901104, 2000. a
Horel, J. D. and Wallace, J. M.: Planetary-scale atmospheric phenomena associated with the Southern Oscillation., Mon. Weather Rev., 109, 813–829, https://doi.org/10.1175/1520-0493(1981)109<0813:PSAPAW>2.0.CO;2, 1981. a, b
Huang, B., Thorne, P. W., Banzon, V. F., Boyer, T., Chepurin, G., Lawrimore, J. H., Menne, M. J., Smith, T. M., Vose, R. S., and Zhang, H. M.: Extended reconstructed Sea surface temperature, Version 5 (ERSSTv5): Upgrades, validations, and intercomparisons, J. Climate, 30, 8179–8205, https://doi.org/10.1175/JCLI-D-16-0836.1, 2017a. a
Huang, B., Thorne, P. W., Banzon, V. F., Boyer, T., Chepurin, G., Lawrimore, J. H., Menne, M. J., Smith, T. M., Vose, R. S., and Zhang, H. M.: NOAA Extended Reconstructed Sea Surface Temperature (ERSST), Version 5, NOAA National Centers for Environmental Information [data set], https://doi.org/10.7289/V5T72FNM, 2017b. a
Hurrell, J. W., Holland, M. M., Gent, P. R., Ghan, S., Kay, J. E., Kushner, P. J., Lamarque, J. F., Large, W. G., Lawrence, D., Lindsay, K., Lipscomb, W. H., Long, M. C., Mahowald, N., Marsh, D. R., Neale, R. B., Rasch, P., Vavrus, S., Vertenstein, M., Bader, D., Collins, W. D., Hack, J. J., Kiehl, J., and Marshall, S.: The community earth system model: A framework for collaborative research, B. Am. Meteorol. Soc., 94, 1339–1360, https://doi.org/10.1175/BAMS-D-12-00121.1, 2013. a
Izumo, T., Vialard, J., Lengaigne, M., and Suresh, I.: Relevance of Relative Sea Surface Temperature for Tropical Rainfall Interannual Variability, Geophys. Res. Lett., 47, e2019GL086182, https://doi.org/10.1029/2019GL086182, 2020. a
Janicot, S., Trzaska, S., and Poccard, I.: Summer Sahel-ENSO teleconnection and decadal time scale SST variations, Clim. Dynam., 18, 303–320, https://doi.org/10.1007/s003820100172, 2001. a
Japan Meteorological Agency: JRA-55: Japanese 55-year Reanalysis, Monthly Means and Variances, Research Data Archive at the National Center for Atmospheric Research, Computational and Information Systems Laboratory, Boulder, CO [data set], https://doi.org/10.5065/D60G3H5B, 2013. a
Ji, L. and Fan, K.: Effect of Atlantic Sea Surface Temperature in May on Intraseasonal Variability of Eurasian NDVI in Summer, J. Geophys. Res.-Atmos., 125, e2019JD031991, https://doi.org/10.1029/2019JD031991, 2020. a
Jiménez-Esteve, B. and Domeisen, D. I. V.: Nonlinearity in the North Pacific Atmospheric Response to a Linear ENSO Forcing, Geophys. Res. Lett., 46, 2271–2281, https://doi.org/10.1029/2018GL081226, 2019. a, b, c
Johnson, N. C. and Xie, S. P.: Changes in the sea surface temperature threshold for tropical convection, Nat. Geosci., 3, 842–845, https://doi.org/10.1038/ngeo1008, 2010. a
Joseph, R. and Nigam, S.: ENSO evolution and teleconnections in IPCC's twentieth-century climate simulations: Realistic representation?, J. Climate, 19, 4360–4377, https://doi.org/10.1175/JCLI3846.1, 2006. a
Kobayashi, S., Ota, Y., Harada, Y., Ebita, A., Moriya, M., Onoda, H., Onogi, K., Kamahori, H., Kobayashi, C., Endo, H., Miyaoka, K., and Kiyotoshi, T.: The JRA-55 reanalysis: General specifications and basic characteristics, J. Meteorol. Soc. Jpn., 93, 5–48, https://doi.org/10.2151/jmsj.2015-001, 2015. a
Kruschke, T., Matthes, K., and Wahl, S.: CESM1.0.6 full solar variability ensemble, DKRZ [data set], http://hdl.handle.net/21.14106/8f8299caafde8c36dec6898f8d425cb1d078cd77 (last access: 25 June 2021), 2020. a
Kucharski, F., Bracco, A., Yoo, J. H., Tompkins, A. M., Feudale, L., Ruti, P., and Dell'Aquila, A.: A Gill-Matsuno-type mechanism explains the tropical Atlantic influence on African and Indian monsoon rainfall, Q. J. Roy. Meteor. Soc., 135, 569–579, https://doi.org/10.1002/qj.406, 2009. a
Lee, S.-K., Enfield, D. B., and Wang, C.: Why do some El Niños have no impact on tropical North Atlantic SST?, Geophys. Res. Lett., 35, L16705, https://doi.org/10.1029/2008GL034734, 2008. a
Lee, S. K., Wang, C., and Mapes, B. E.: A simple atmospheric model of the local and teleconnection responses to tropical heating anomalies, J. Climate, 22, 272–284, https://doi.org/10.1175/2008JCLI2303.1, 2009. a
Li, G., Chen, J., Wang, X., Luo, X., Yang, D., Zhou, W., Tan, Y., and Yan, H.: Remote impact of North Atlantic sea surface temperature on rainfall in southwestern China during boreal spring, Clim. Dynam., 50, 541–553, https://doi.org/10.1007/s00382-017-3625-x, 2018. a
Li, J. and Ruan, C.: The North Atlantic–Eurasian teleconnection in summer and its effects on Eurasian climates, Environ. Res. Lett., 13, 024007, https://doi.org/10.1088/1748-9326/aa9d33, 2018. a
Li, S., Robinson, W. A., Hoerling, M. P., and Weickmann, K. M.: Dynamics of the extratropical response to a tropical Atlantic SST anomaly, J. Climate, 20, 560–574, https://doi.org/10.1175/JCLI4014.1, 2007. a
Lim, Y. K.: The East Atlantic/West Russia (EA/WR) teleconnection in the North Atlantic: climate impact and relation to Rossby wave propagation, Clim. Dynam., 44, 3211–3222, https://doi.org/10.1007/s00382-014-2381-4, 2015. a
Lin, H., Derome, J., and Brunet, G.: The nonlinear transient atmospheric response to tropical forcing, J. Climate, 20, 5642–5665, https://doi.org/10.1175/2007JCLI1383.1, 2007. a, b, c
Madec, G. and the NEMO System Team: NEMO Release 3.6, IPSL [code], https://forge.ipsl.jussieu.fr/nemo/wiki/Users/release-3.6 (last access: 18 May 2020), 2020. a
Maher, P., Vallis, G. K., Sherwood, S. C., Webb, M. J., and Sansom, P. G.: The Impact of Parameterized Convection on Climatological Precipitation in Atmospheric Global Climate Models, Geophys. Res. Lett., 45, 3728–3736, https://doi.org/10.1002/2017GL076826, 2018. a
Marsh, D. R., Mills, M. J., Kinnison, D. E., Lamarque, J. F., Calvo, N., and Polvani, L. M.: Climate change from 1850 to 2005 simulated in CESM1(WACCM), J. Climate, 26, 7372–7391, https://doi.org/10.1175/JCLI-D-12-00558.1, 2013. a
Matthes, K., Marsh, D. R., Garcia, R. R., Kinnison, D. E., Sassi, F., and Walters, S.: Role of the QBO in modulating the influence of the 11 year solar cycle on the atmosphere using constant forcings, J. Geophys. Res.-Atmos., 115, 1–17, https://doi.org/10.1029/2009JD013020, 2010. a
Matthes, K., Biastoch, A., Wahl, S., Harlaß, J., Martin, T., Brücher, T., Drews, A., Ehlert, D., Getzlaff, K., Krüger, F., Rath, W., Scheinert, M., Schwarzkopf, F. U., Bayr, T., Schmidt, H., and Park, W.: The Flexible Ocean and Climate Infrastructure version 1 (FOCI1): mean state and variability, Geosci. Model Dev., 13, 2533–2568, https://doi.org/10.5194/gmd-13-2533-2020, 2020. a, b, c, d, e
McPhaden, M. J., Santoso, A., and Cai, W.: Introduction to El Niño Southern Oscillation in a Changing Climate, in: El Niño Southern Oscillation in a Changing Climate, John Wiley & Sons, https://doi.org/10.1002/9781119548164.ch1, pp. 1–19, 2020. a
Müller, W. A., Jungclaus, J. H., Mauritsen, T., Baehr, J., Bittner, M., Budich, R., Bunzel, F., Esch, M., Ghosh, R., Haak, H., Ilyina, T., Kleine, T., Kornblueh, L., Li, H., Modali, K., Notz, D., Pohlmann, H., Roeckner, E., Stemmler, I., Tian, F., and Marotzke, J.: A Higher-resolution Version of the Max Planck Institute Earth System Model (MPI-ESM1.2-HR), J. Adv. Model. Earth Sy., 10, 1383–1413, https://doi.org/10.1029/2017MS001217, 2018. a
Philander, S. G.: El Nino, La Nina, and the Southern Oscillation, Academic Press, https://doi.org/10.2307/j.ctv36zpbx.12, 1989. a
Rast, S.: ECHAM Versions 3 to 6, Max-Planck Institut für Meteorologie, https://www.mpimet.mpg.de/en/science/models/mpiesm/echam.html (last access: 18 May 2020), 1992. a
Richter, I.: Climate model biases in the eastern tropical oceans: Causes, impacts and ways forward, WIREs Clim. Change, 6, 345–358, https://doi.org/10.1002/wcc.338, 2015. a
Rieke, O., Greatbatch, R. J., and Gollan, G.: Nonstationarity of the link between the Tropics and the summer East Atlantic pattern, Atmos. Sci. Lett., 22, 1–9, https://doi.org/10.1002/asl.1026, 2021. a
Rodrigues, R. R., Haarsma, R. J., Campos, E. J., and Ambrizzi, T.: The impacts of inter-El Niño variability on the tropical Atlantic and northeast Brazil climate, J. Climate, 24, 3402–3422, https://doi.org/10.1175/2011JCLI3983.1, 2011. a
Rowell, D. P.: Simulating SST teleconnections to Africa: What is the state of the art?, J. Climate, 26, 5397–5418, https://doi.org/10.1175/JCLI-D-12-00761.1, 2013. a
Sabin, T. P., Babu, C. A., and Joseph, P. V.: SST-convection relation over tropical oceans, Int. J. Climatol., 33, 1424–1435, https://doi.org/10.1002/joc.3522, 2013. a, b
Sardeshmukh, P. D. and Hoskins, B. J.: The generation of global rotational flow by steady idealized tropical divergence, J. Atmos. Sci., 45, 1228–1251, https://doi.org/10.1175/1520-0469(1988)045<1228:TGOGRF>2.0.CO;2, 1988. a
Simpson, I. R. and Polvani, L. M.: Revisiting the relationship between jet position, forced response, and annular mode variability in the southern midlatitudes, Geophys. Res. Lett., 43, 2896–2903, https://doi.org/10.1002/2016GL067989, 2016. a
Sobel, A. H., Held, I. M., and Bretherton, C. S.: The ENSO signal in tropical tropospheric temperature, J. Climate, 15, 2702–2706, https://doi.org/10.1175/1520-0442(2002)015<2702:TESITT>2.0.CO;2, 2002. a
Su, H., Neelin, J. D., and Meyerson, J. E.: Sensitivity of tropical tropospheric temperature to sea surface temperature forcing, J. Climate, 16, 1283–1301, https://doi.org/10.1175/1520-0442(2003)16<1283:SOTTTT>2.0.CO;2, 2003. a
Sun, Y., Wang, F., and Sun, D. Z.: Weak ENSO asymmetry due to weak nonlinear air–sea interaction in CMIP5 climate models, Adv. Atmos. Sci., 33, 352–364, https://doi.org/10.1007/s00376-015-5018-6, 2016. a
Taschetto, A. S., Rodrigues, R. R., Meehl, G. A., McGregor, S., and England, M. H.: How sensitive are the Pacific–tropical North Atlantic teleconnections to the position and intensity of El Niño-related warming?, Clim. Dynam., 46, 1841–1860, https://doi.org/10.1007/s00382-015-2679-x, 2016. a, b, c, d, e
Taylor, M. A., Enfield, D. B., and Chen, A. A.: Influence of the tropical Atlantic versus the tropical Pacific on Caribbean rainfall, J. Geophys. Res.-Oceans, 107, 3127, https://doi.org/10.1029/2001jc001097, 2002. a
Taylor, M. A., Stephenson, T. S., Owino, A., Chen, A. A., and Campbell, J. D.: Tropical gradient influences on Caribbean rainfall, J. Geophys. Res.-Atmos., 116, 1–14, https://doi.org/10.1029/2010JD015580, 2011. a
Tompkins, A. M.: On the relationship between tropical convection and sea surface temperature, J. Climate, 14, 633–637, https://doi.org/10.1175/1520-0442(2001)014<0633:OTRBTC>2.0.CO;2, 2001. a, b
Trenberth, K. E., Branstator, G. W., Karoly, D., Kumar, A., Lau, N. C., and Ropelewski, C.: Progress during TOGA in understanding and modeling global teleconnections associated with tropical sea surface temperatures, J. Geophys. Res.-Oceans, 103, 14291–14324, https://doi.org/10.1029/97jc01444, 1998. a
Wahl, S.: Supplementary Materila for the Flexible Ocean and Climate Infrastructure Version 1 (FOCI1): Mean State and Variability, Zenodo [code], https://doi.org/10.5281/zenodo.3568061, 2020. a
Wahl, S. and Huo, W.: SOLAR-FULL-FOCI ensemble (SOLCHECK), DOKU at DKRZ [data set], http://hdl.handle.net/21.14106/62d25c6656418115757b5405c7910e7dbe809d99 (last access: 23 September 2021), 2021. a
Wallace, J. M. and Gutzler, D. S.: Teleconnections in the geopotential height field during the Northern Hemisphere winter., Mon. Weather Rev., 109, 784–812, https://doi.org/10.1175/1520-0493(1981)109<0784:TITGHF>2.0.CO;2, 1981. a
Wang, C.: ENSO, Atlantic Climate Variability, and the Walker and Hadley Circulations, in: The Hadley Circulation: Present, Past and Future, Springer, Dordrecht, 173–202, https://doi.org/10.1007/978-1-4020-2944-8_7, 2004. a
Wang, C.: Variability of the Caribbean Low-Level Jet and its relations to climate, Clim. Dynam., 29, 411–422, https://doi.org/10.1007/s00382-007-0243-z, 2007. a
Wanner, H., Brönnimann, S., Casty, C., Gyalistras, D., Luterbacher, J., Schmutz, C., Stephenson, D. B., and Xoplaki, E.: North Atlantic oscillation - Concepts and studies, Surv. Geophys., 22, 321–381, https://doi.org/10.1023/A:1014217317898, 2001. a
Wheeler, M. and Kiladis, G. N.: Convectively Coupled Equatorial Waves: Analysis of Clouds and Temperature in the Wavenumber–Frequency Domain, J. Atmos. Sci., 56, 374–399, https://doi.org/10.1175/1520-0469(1999)056<0374:CCEWAO>2.0.CO;2, 1999. a
Wheeler, M., Kiladis, G. N., and Webster, P. J.: Large-scale dynamical fields associated with convectively coupled equatorial waves, J. Atmos. Sci., 57, 613–640, https://doi.org/10.1175/1520-0469(2000)057<0613:LSDFAW>2.0.CO;2, 2000. a
Williams, A. I. L., Jeevanjee, N., and Bloch-Johnson, J.: Circus Tents, Convective Thresholds, and the Non-Linear Climate Response to Tropical SSTs, Geophys. Res. Lett., 50, e2022GL101499, https://doi.org/10.1029/2022GL101499, 2023. a
Woelfle, M. D., Yu, S., Bretherton, C. S., and Pritchard, M. S.: Sensitivity of Coupled Tropical Pacific Model Biases to Convective Parameterization in CESM1, J. Adv. Model. Earth Sy., 10, 126–144, https://doi.org/10.1002/2017MS001176, 2018. a
Wu, R. and He, Z.: Northern Tropical Atlantic Warming in El Niño Decaying Spring: Impacts of El Niño Amplitude, Geophys. Res. Lett., 46, 14072–14081, https://doi.org/10.1029/2019GL085840, 2019. a
Wu, R., Yang, S., Liu, S., Sun, L., Lian, Y., and Gao, Z.: Northeast China summer temperature and North Atlantic SST, J. Geophys. Res.-Atmos., 116, 1–16, https://doi.org/10.1029/2011JD015779, 2011. a
Wulff, C. O., Greatbatch, R. J., Domeisen, D. I. V., Gollan, G., and Hansen, F.: Tropical Forcing of the Summer East Atlantic Pattern, Geophys. Res. Lett., 44, 166–11, https://doi.org/10.1002/2017GL075493, 2017. a
Zhang, T. and Sun, D. Z.: ENSO asymmetry in CMIP5 models, J. Climate, 27, 4070–4093, https://doi.org/10.1175/JCLI-D-13-00454.1, 2014. a