the Creative Commons Attribution 4.0 License.
the Creative Commons Attribution 4.0 License.
 | 12 Jun 2026
Predictability of cyclones associated with heavy precipitation events in the Sahara
Guorong Ling
Hilla Afargan-Gerstman
Heavy precipitation events (HPEs) are a precious source of water in the Sahara, but often trigger devastating flooding. These events are strongly associated with surface cyclones, making accurate cyclone forecasting crucial for predicting hazards related to HPEs and their impacts. In this study, we investigate the predictability of HPE-associated cyclones across the Sahara and its drivers. We use ERA5 reanalysis and ECMWF reforecasts initialized between December 2000 and November 2020. Forecast skill on short-, medium-, and extended-range timescales is evaluated based on the overlapping areas of observed and forecasted cyclones over the Sahara. Results show that the lead time of skillful prediction is up to about 10 d. Forecast skill varies strongly with season. At short lead times, skill is higher in winter, whereas at medium to extended lead times, skill is relatively high in summer, albeit with increased false alarm rates. These seasonal differences are also reflected in cyclone location and characteristics: deeper northern Sahara cyclones are predicted better than shallower ones, while in summer, skillful forecasts are found mainly in the southwestern Sahara. Northern Saharan cyclones are better predicted when Rossby wave patterns are persistent, whereas transitions between circulation patterns correspond to reduced forecast skill. These findings suggest that the predictability of HPE-associated cyclones in the Sahara is flow-dependent, and that high predictive skill can extend to subseasonal timescales under favorable flow conditions. Understanding these variations across regions, seasons, and circulation patterns is key to improving the predictability of HPEs and their related impacts.
- Article
(9114 KB) - Full-text XML
- BibTeX
- EndNote


The Sahara is the largest warm desert in the world (Tucker et al., 1991). Most of the Sahara is hyper-arid (Middleton and Thomas, 1992), and likely contains the driest region on Earth (Kelley, 2014). Yet, heavy precipitation events (HPEs) are actually quite common in the Sahara – occurring on average every other day (Armon et al., 2024), and often trigger flash floods (e.g. Fink and Knippertz, 2003; Schepanski et al., 2012; Yin et al., 2023), some of them highly destructive (Moawad et al., 2016; Armon et al., 2025). Rainfall water is also a valuable resource in the Sahara, with as little as a few mm already making significant recharge of groundwater or even surface reservoirs (e.g. Cuthbert et al., 2019; Rieder et al., 2025). Precipitation forecast, fundamental in real-time flood risk mitigation and water resource management, is constantly improving, but has much worse skill over deserts (e.g. Kalma and Franks, 2003; Rinat et al., 2021; Cordeira et al., 2025), where the combination of sparse observations, small-scale precipitation generation processes and short-duration storms (e.g. Sharon, 1972; Belachsen et al., 2017) pose a major predictability challenge.
Despite these challenges, heavy precipitation in the Sahara, particularly, though not exclusively, in its northern half and during winter, is often associated with surface cyclones (Fig. 1; Nicholson, 1981; Morin et al., 2020; Armon et al., 2024). This link suggests, therefore, that forecasting cyclones may provide an indirect but powerful pathway to improving desert rainfall predictions. Understanding cyclone predictability in and near the Sahara is therefore key in improving precipitation forecasting, ultimately enabling better preparedness for desert flood hazards and water resource management.
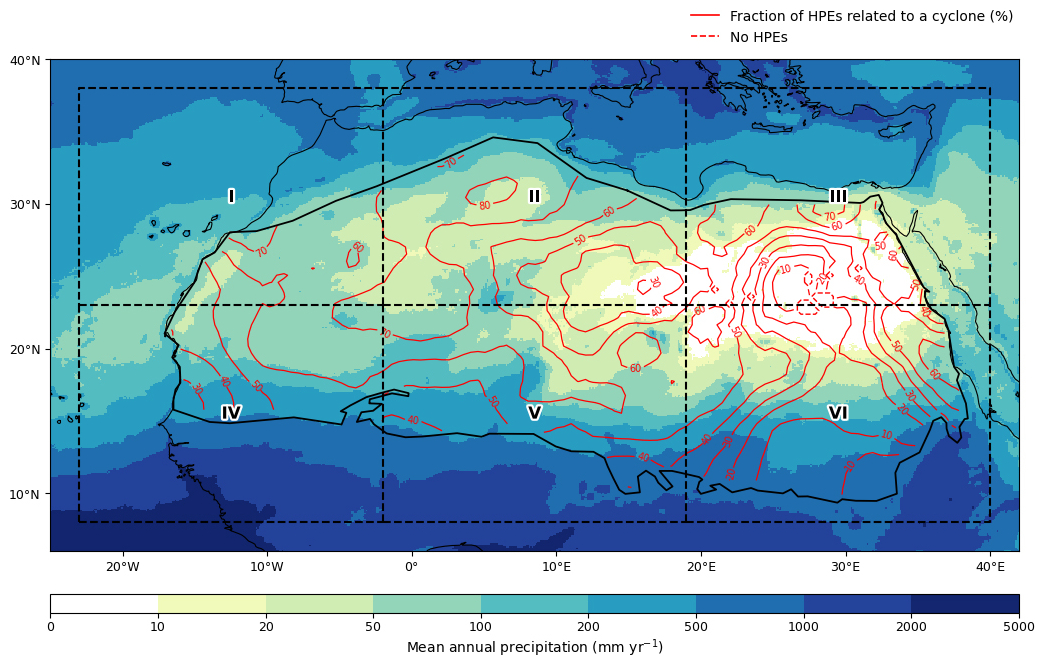
Figure 1Mean annual precipitation (colors) and the fraction of HPEs associated with cyclones compared to all HPEs (red contours). Precipitation is from satellite-based data, and HPEs and their association with cyclones are based on Armon et al. (2024) (Sect. 2.1.1). The thick black solid line represents the boundary of the Sahara (Kelso and Patterson, 2010), while the outer black dashed lines indicate the study region, which is divided into six subregions (I–VI).
As numerical weather models are inherently limited by uncertainties in initial conditions and unresolved physics (Mason, 1986; Slingo and Palmer, 2011), forecast skill is often evaluated across an ensemble of forecasts, produced by perturbing their initial conditions (Leutbecher and Palmer, 2008; Palmer, 2017). However, cyclone predictability is marked by significant regional discrepancies. Afargan-Gerstman et al. (2024) demonstrated that Saharan cyclones exhibit a negative bias of approximately 4 %. Since this bias is of the same order of magnitude as the climatological cyclone frequency in this region (4 %–5 % of winter days), it suggests the forecast model may fail to capture the dynamics of these cyclones, highlighting a potential deficiency in its representation of Saharan cyclones.
Cyclones in the Sahara originate through various dynamical processes that vary regionally and seasonally. The northwestern Sahara experiences peak precipitation in the fall, when extratropical cyclones migrate southward over the eastern North Atlantic, drawing moisture from tropical latitudes to the desert (e.g. Skinner and Poulsen, 2016; Chaqdid et al., 2023) and advecting Atlantic moisture around the Atlas Mountains (Rieder et al., 2025). In the northeastern Sahara, HPEs are much rarer and occur sporadically, mostly outside the summer months (Morin et al., 2020). They are mainly associated with Mediterranean cyclones (e.g. Ammar et al., 2014; Armon et al., 2025; Flaounas et al., 2025) or indirectly with Tropical Plumes that form when mid-latitude cyclones intrude southward, passing through the Mediterranean towards the Sahara (e.g. Rubin et al., 2007; Armon et al., 2018). Occasionally, the active Red Sea trough, often enclosing a surface cyclone (Ziv et al., 2022), can also produce rainfall in the region (De Vries et al., 2013). In the southern Sahara, HPEs occur mostly in summer, when the tropical monsoon belt extends northward. Shallow monsoon lows, sometimes invigorated by African easterly waves, emerging from the Sahel are a major source of precipitation (Nicholson, 2000; Russell and Aiyyer, 2020). In addition, more stationary, thermally driven systems such as the Saharan heat low (Lavaysse et al., 2009a; Engelstaedter et al., 2015) and the Sudan monsoon low (El-Fandy, 1948), which are typically dry on their poleward side, can trigger convection along their equatorward flanks, occasionally generating rainfall that propagates northward (e.g. Peyrillé et al., 2007). Finally, Rossby wave breaking (RWB) is known to be a key driver for precipitation in arid regions, including the Sahara, with contributions of up to 90 % of daily precipitation extremes in arid regions located equatorward and downstream of the midlatitude storm tracks (De Vries et al., 2024).
As surface cyclones are synoptic-scale systems embedded in the large-scale flow, it may be expected that cyclones exhibit a certain level of predictability that can be inherited from the background circulation. At short lead times, numerical weather prediction models indeed provide skillful forecasts of individual cyclones, typically up to a few days (Froude, 2009; Zheng et al., 2019; Ngoungue Langue et al., 2021; Elless, 2018; Li et al., 2016). Beyond this range, however, forecast errors grow rapidly and predictability decreases, partly due to the amplification and downstream propagation of errors within the large-scale flow.
Persistent circulation regimes and teleconnection patterns can give rise to enhanced predictability on subseasonal to seasonal (S2S) timescales (Domeisen et al., 2022). These patterns, such as the North Atlantic Oscillation (NAO), the East Atlantic (EA) pattern, the Madden–Julian Oscillation (MJO) (e.g. Stan et al., 2022), and variability in the stratospheric polar vortex, modulate cyclone activity and thus provide potential sources of extended-range S2S predictability (Zheng et al., 2019; Black et al., 2017; Afargan-Gerstman et al., 2024; Rupp et al., 2024). Additionally, synoptic weather systems are often embedded in mid-tropospheric Rossby waves along the jet stream (Wirth et al., 2018), and induce high-impact weather through coupling between the tropics and the extratropics (e.g. Martius et al., 2008; De Vries et al., 2013, 2024). This suggests that Rossby wave patterns and breaking act as potential precursors of high-impact cyclones in subtropical regions.
Despite, and perhaps because of the role of large-scale circulation in modulating cyclone activity, the ability of numerical models to exploit this predictability varies across flow regimes (e.g. Rodwell et al., 2018; Spaeth et al., 2024). Specifically, the predictability of Saharan cyclones remains poorly understood. An important question that therefore arises is how predictable Saharan cyclones are, and what atmospheric conditions contribute to enhanced predictability of these cyclones. This study addresses this question by systematically assessing the forecast skill of HPE-associated Saharan cyclones and identifying the atmospheric factors linked to their predictability.
The paper is structured as follows. Section 2 describes the data and study region, and presents a feature-oriented method for assessing Saharan cyclone forecast skill. The temporal and spatial variations of the forecast skill, and the association between large-scale weather patterns and the forecast skill of HPE-associated cyclones are presented in Sect. 3. Finally, Sect. 4 discusses the dynamical processes modulating cyclone predictability across Saharan regions and seasons, and raises potential directions for future research.
2.1 Data
To investigate the predictability of HPE-associated cyclones in the Sahara and the factors controlling it, we use three main datasets: (a) observed HPEs derived from the Integrated Multi-satellitE Retrievals for GPM (IMERG) precipitation dataset between 2000 and 2021 (Armon et al., 2024); (b) meteorological fields from the fifth generation ECMWF atmospheric reanalysis (ERA5) dataset (Hersbach et al., 2020), together with cyclone masks identified by Sprenger et al. (2017) based on the same dataset; and (c) subseasonal ensemble reforecasts from ECMWF, covering 2000–2020. These datasets provide the observational, reanalysis, and forecast basis for the analyses presented in the following sections.
2.1.1 Saharan HPEs
We use a catalog of Saharan HPEs between June 2000 and May 2021 from Armon et al. (2024) to extract the cyclones matching the reforecast data period (Sect. 2.1.3). These events are identified and obtained using daily-aggregated precipitation from IMERG Version 06. Although newer versions of IMERG (e.g. V07) introduce some changes in event statistics, applying the same detection approach to V07 yields consistent climatological patterns and extreme-event characteristics (not shown). Events in this catalog are detected when rainfall exceeds the local 90th percentile of rainy days (daily rain ≥1 mm). Neighboring threshold-exceeding grid cells are merged into continuous storm areas larger than 1000 km2, and nearby events in space or time are connected. This approach captures only large, coherent rain systems and filters out isolated or noisy rainfall signals.
From the nearly 42 000 HPEs in the catalog, we retain ∼12 500, which are statistically associated with cyclones using a Monte Carlo distance test according to Armon et al. (2024). For each HPE, we compute the minimum distance to the nearest cyclone mask (Sect. 2.1.2) at 6-hourly resolution. HPEs overlapping a cyclone (distance=0) are directly classified as associated. For non-overlapping cases, we adopt the approach taken by Armon et al. (2024), where they compared the observed distance to a null distribution obtained from 100 cyclone fields sampled from randomly selected dates. The fifth percentile (α=5 %) of these distances defines a threshold below which proximity is unlikely to occur by chance. Applying this across all HPEs yielded a representative separation distance of ∼180 km. HPEs with distances ≤180 km were therefore classified as cyclone-associated. Because random cyclones are sampled from all dates (including rainy conditions), this threshold provides a conservative estimate, reducing false associations.
2.1.2 ERA5 dataset and cyclone data
To characterize the meteorological conditions during HPE-associated cyclones and to verify their forecasts, we use the ERA5 reanalysis dataset (Hersbach et al., 2020). Specifically, we use mean sea level pressure (MSLP), 500 hPa geopotential height (GH500), and 850 hPa temperature (T850) data, with a temporal resolution of 3 h at a 0.5° spatial resolution. To associate each Saharan HPE with a nearby cyclone, we use surface cyclone data produced by Sprenger et al. (2017). This approach applies an objective cyclone detection and tracking algorithm (Wernli and Schwierz, 2006) based on MSLP, defining cyclones as enclosed regions containing one or more sea level pressure minima. For every cyclone, the algorithm yields a two-dimensional binary cyclone mask field.
2.1.3 Subseasonal reforecast data
To evaluate the predictability of Saharan HPE-associated cyclones, we use ECMWF ensemble reforecasts. These reforecasts were initialized between December 2000 and November 2020, with a 6 h time interval and a 46 d forecast period from several model versions: CY47R1, CY47R2, and CY47R3. The reforecasts consist of 11 ensemble members initialized twice a week, on Monday and Thursday. Their horizontal resolution ranges from 16 km during days 0–15 to 32 km after day 15 of the forecast. These reforecasts are part of the S2S Prediction research project database, an ongoing research effort to improve forecast skill and understanding of the climate system on subseasonal to seasonal timescales (Vitart et al., 2017). The cyclone detection algorithm is applied to the 10 reforecast perturbed ensemble members.
2.2 Methods
2.2.1 HPE-associated cyclone identification
To associate cyclones with observed HPEs, we calculate the distance between the precipitation mass center of a given HPE and the location of the nearest cyclone center according to its minimum sea level pressure at 12:00 UTC on the date of maximum precipitation volume. Cases where the detected cyclone is located at a distance ≥ 2000 km and/or outside the six subregions (Fig. 1) are discarded. The 2000 km threshold represents a pragmatic upper bound to avoid HPE attribution to remote cyclones; sensitivity tests (1000–3000 km) indicate that results are only weakly affected by increasing the threshold beyond this value ( % at 3000 km), whereas smaller thresholds would substantially reduce the sample size ( % at 1000 km). It is important to note that proximity alone does not guarantee a causal dynamical link between a cyclone and an HPE. However, in the absence of a universally accepted method for attributing precipitation to specific cyclones, spatial proximity is commonly used as a practical proxy (e.g. Pfahl and Wernli, 2012; Armon et al., 2024). Selecting the nearest cyclone maximizes the likelihood that the identified system is the most relevant to the precipitation event, while avoiding more subjective or computationally intensive tracking approaches. An example of this approach, showing the association of the nearest cyclone with an HPE during 20–24 November 2014 is shown in Fig. A1. It is important to note that in our methodology, a single cyclone may be associated with more than one HPE. Nonetheless, when calculating average values (e.g. composites across events), every cyclone is counted only once. Each cyclone mask is expanded by 6° (Figs. 2 and A1) to obtain an ad-hoc study region in which we evaluate the forecasted cyclone (as explained next). The 6° buffer region defines the spatial domain for forecast verification and allows identification of relevant cyclones while limiting the inclusion of weather systems that are too distant to be compared with. Repeating the analyses with 2 and 10° buffer regions provided qualitatively similar results (not shown).
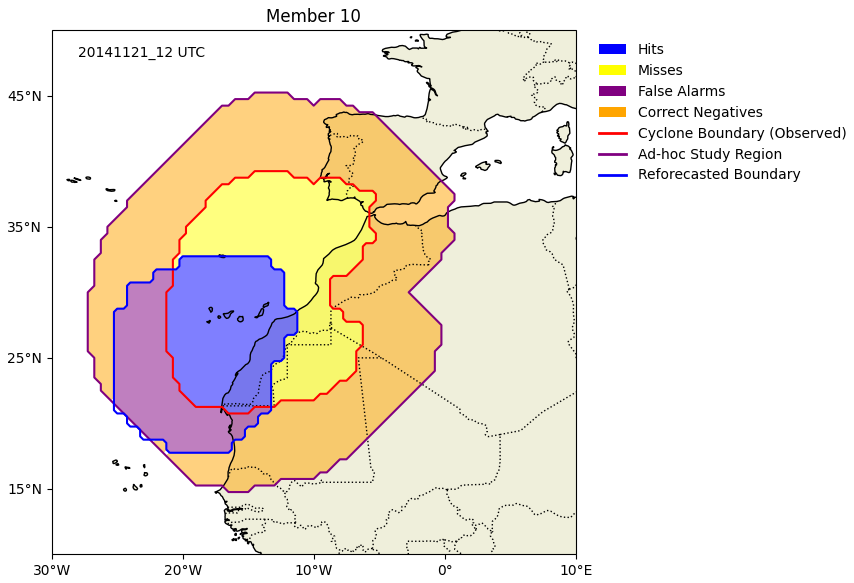
Figure 2An example of the area-based, four-category verification method (Sect. 2.2.2). The red line denotes the border of the observed cyclone in Fig. A1. The purple line delimits the ad-hoc study region corresponding to this cyclone, which is derived by expanding the border of the cyclone by 6°. An example for cyclone prediction, from the reforecast ensemble member 10, with a lead time of 3.5 d is marked with a blue line. The four categories in the contingency table (Table 1), namely hits (in blue), misses (yellow), false alarms (purple), and correct negatives (orange) are shown by the filled areas.
2.2.2 Forecast verification
We verify the reforecasts against reanalysis using (a) the areal storm coverage (cyclone mask) and (b) MSLP.
For the areal storm coverage, we use a four-category contingency table (Table 1 and Fig. 2). This contingency table is constructed by summing the area of the grid points that meet each category in the table within the corresponding ad-hoc study region for each ensemble member and forecast lead time. Such a contingency table is explained for the following example: an HPE-associated cyclone was observed on 21 November 2014 over the northwestern Sahara and the nearby area in the Atlantic Ocean (red line in Fig. 2). An ad-hoc study region is constructed using a 6° buffer around its location (purple line). Ensemble member 10, at a 3.5 d lead time, predicted the presence of a cyclone to the southwest of the observed cyclone (blue line). The contingency table for this case is composed of hits (pixels where both the forecasted and observed cyclone are present; blue area), misses (observed only; yellow area), false alarms (forecasted only; purple area), and correct negatives (cyclone is not observed nor forecasted; orange area).
Table 1An example of a contingency table for verification of reforecasts. The value of each category for a verified case study is calculated based on the corresponding area within the cyclone-related study area.

Based on the contingency table we calculate the following skill scores: hit rate (or probability of detection; POD), false alarm ratio (FAR), Gilbert skill score (GSS), and Hanssen–Kuipers discriminant (HK). The GSS incorporates information from both the POD and FAR, providing a more comprehensive measure of forecast performance. However, because the GSS is sensitive to the base rate of events (Hogan et al., 2010), we also use HK skill, which is less affected by the base rate variations (Candogan Yossef et al., 2012). The scores are defined as follows (Roebber, 2009; Hogan et al., 2010):
where hits.
To evaluate the performance of the model in forecasting HPE-associated cyclones for different seasons, a season-based analysis is performed. For this purpose, we calculate the average values of POD and FAR as well as their spreads for reforecasts with lead times from 0.5 d to 15.5 d. For each cyclone, the POD and FAR skill scores are calculated by averaging the values from the 10 ensemble reforecast members at the corresponding lead time. The number of cyclones with available reforecasts is recorded for each lead time.
As a reference for comparing the POD results, the climatological background of cyclone frequency is computed as follows: first, the mean cyclone frequency over all ad-hoc study regions is computed. Then, for each of these regions, we compute the mean grid-box-area-weighted cyclone frequency. Finally, to obtain the climatological frequency, we average all ad-hoc-based frequencies by season.
In addition, we use GSS and HK values for evaluating the regional variability of cyclone skill for two lead times (3.5 and 10.5 d). We define hit members as reforecast members where the skill (GSS or HK) exceeds a threshold of 30 % for certain lead times and hit counts as the number of hit members for each case. The 30 % threshold was chosen to highlight regions where forecast skill is substantially higher than a random forecast (i.e. GSS=0); sensitivity tests using thresholds of 0 %, 20 %, and 40 % yield qualitatively similar spatial patterns.
Lastly, to examine the evolution of MSLP magnitude forecast error, we calculate the MSLP root mean square error (RMSE) for reforecasts with lead times ranging from 0.5 to 15.5 d for every season. At each forecast lead time, the MSLP RMSE values are averaged within the ad-hoc study region across the 10 members of the ensemble. These values are compared with the standard deviation of MSLP averaged over all ad-hoc study regions for all cases within every season.
2.2.3 Atmospheric patterns associated with high and low forecast skill
To evaluate model performance and relate forecast skill variations to large-scale atmospheric conditions, we classify events according to their GSS values, with the upper 40 % and lower 40 % of the events classified as high- and low-skill cases, respectively. The 40 % threshold represents a compromise between maintaining sufficient sample size for robust composites and ensuring a clear separation between high- and low-skill events; sensitivity tests (30 % and 50 %) indicate that the resulting large-scale patterns are not strongly dependent on this choice. To analyze their associated large-scale environments, composites of anomaly fields are constructed for three selected variables (MSLP, GH500, and T850), averaged separately over the high- and low-skill groups. All anomalies are calculated by subtracting the corresponding monthly climatological mean from the large-scale fields corresponding to 12:00 UTC on event days. Monthly climatologies are derived from ERA5 reanalysis data by averaging absolute fields at 12:00 UTC for all dates in each month from December 2000 to November 2020. Statistical significance of the GH500 anomaly fields is evaluated using the bootstrap resampling test (2000 resamples) at the 0.05 significance level (α=0.05). Anomalies are considered significant at the two-sided 5 % level when zero lies outside the 95 % bootstrap confidence interval of the mean.
3.1 Evaluating HPE-associated cyclone forecast skill over the Sahara
The predictability of Saharan cyclones associated with HPEs is evaluated through area-based (feature-oriented) forecast skill metrics (POD and FAR) and MSLP error growth (Figs. 3 and 4). Both POD and FAR values are based on the spatial overlap between observed and forecast cyclones (see Sect. 2.2.2 for their respective definitions).
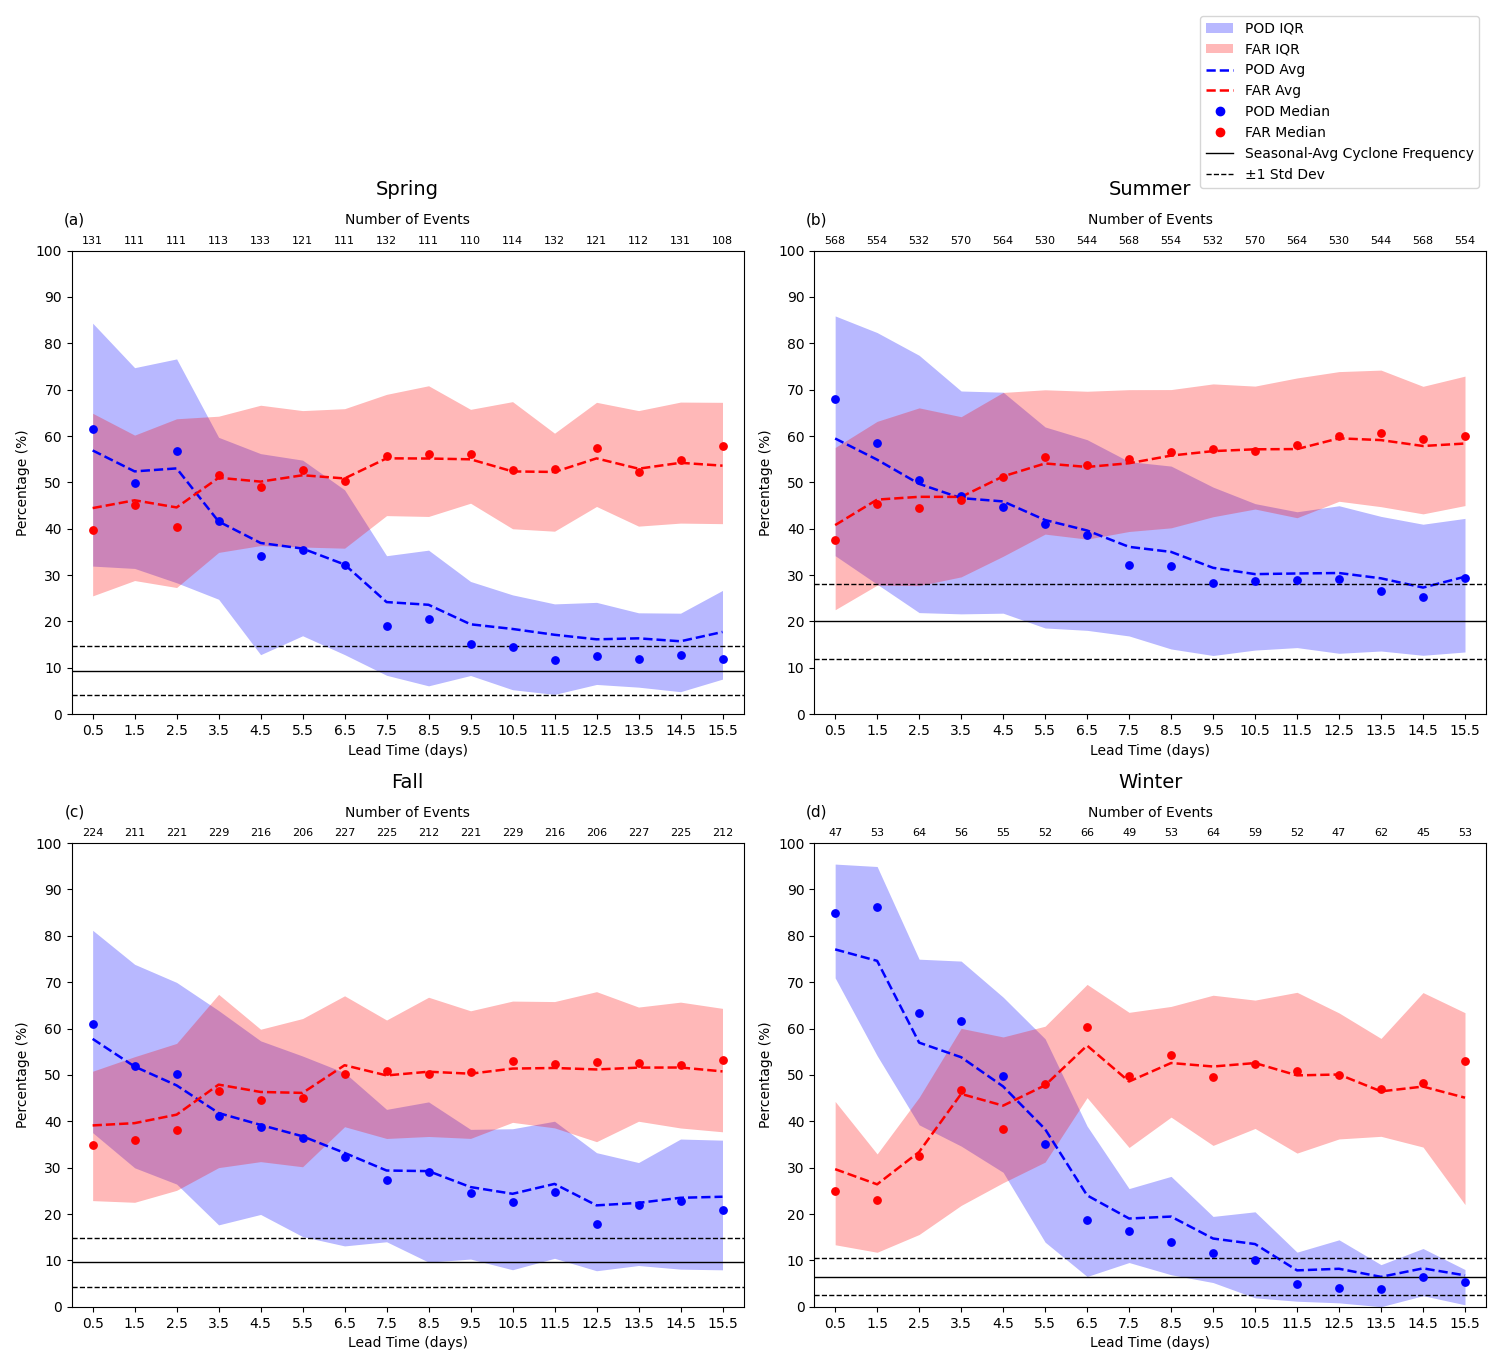
Figure 3Probability of detection (POD) and false alarm ratio (FAR) of HPE-associated cyclones in the Sahara by lead time and season. Average POD (blue) and FAR (red) and their distribution in ECMWF reforecasts with lead time, ranging from 0.5 to 15.5 d and separated by season. The numbers above each x-tick label correspond to the number of events that have available forecasts at this lead time. The black solid line shows the average climatological frequency of cyclone coverage, computed as the weighted cyclone frequency at each grid point of each cyclone area. Black dashed lines indicate ±1 standard deviation of the climatological frequency. For POD and FAR, dashed lines represent the mean, shaded areas denote the interquartile range, and dots signify the median values across the lead-time range.
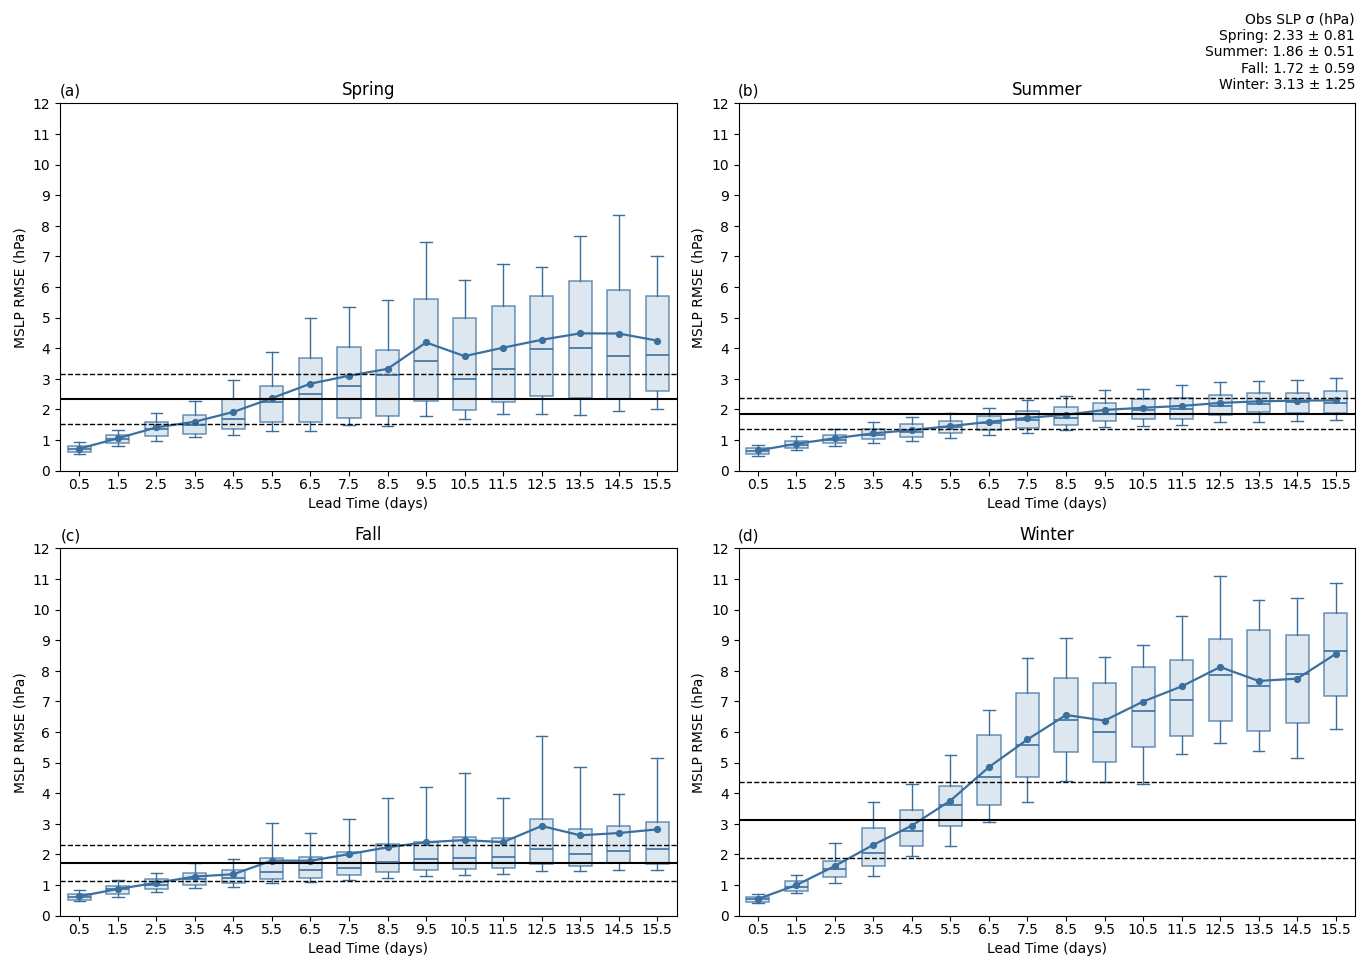
Figure 4Variation of RMSE of HPE-associated cyclones' MSLP by lead time and season. Mean RMSE values are represented by bold blue lines, and their distributions are shown using boxplots (horizontal lines = median values, boxes are interquartile ranges, and whiskers represent the 10th–90th ranges). The mean standard deviation of RMSE is shown with black solid lines. These are derived by averaging standard deviations of observed MSLP at each grid point for each ad-hoc study area over all cyclone cases for each season (Sect. 2.2.2). A range of ±σ from the mean standard deviation value is denoted by the black dashed lines.
While forecast skill generally decreases with lead time, the rate of skill decrease and the associated error growth exhibit a strong temporal and seasonal dependence. In the short-range (up to 4.5 d), winter forecasts outperform summer, characterized by higher POD, smaller POD spread, and lower FAR (Fig. 3b and d). This suggests that winter systems, often driven by large-scale baroclinic instability, are more robustly captured by the model at lead times close to initialization.
Conversely, summer cyclones exhibit higher skill in the medium-to-extended range (5–15 d; Fig. 3b). During this period, summer POD remains higher than winter and stays consistently above the climatological frequency. However, this extended skill is offset by a FAR of approximately 60 %, indicating that while the model captures the presence of the HPE-associated cyclones in summer, it suffers from a high rate of false alarms. Spring and fall exhibit similar skill evolution, yet with a more gradual decay of skill compared to winter (Fig. 3a and c). Interestingly, fall maintains skill levels slightly above climatology even at longer lead times.
To further examine changes in the prediction skill of HPE-associated cyclones beyond the area-based skill metrics, we analyze the RMSE of MSLP as a proxy for forecast bias (Fig. 4). The magnitude of the RMSE is strongly modulated by the season, with winter forecasts showing the highest bias (and the fastest error growth) compared to the other seasons.
For all seasons except summer, the RMSE mean exceeds the climatological standard deviation of MSLP beyond 5.5 d, marking the limit of useful forecast skill (Fig. 4). In summer, the error remains below this threshold until day 9.5, confirming that summer HPE-associated cyclones tend to have a longer predictability horizon.
Notably, FAR values tend to stabilize at around 5.5 d, while the RMSE continues to grow at medium-to-extended lead times. The difference between the FAR and RMSE suggests that at the medium–extended range, whether a cyclone exists or not does not change anymore, but their magnitude (MSLP) and structure characteristics become increasingly difficult to resolve at these lead times.
3.2 Regional variability of forecast skill across the Sahara
The forecast skill for HPE-associated cyclones is not uniform, exhibiting a pronounced regional dependency across the Sahara. This spatial variability is evident when comparing short-range (3.5 d) and medium-range (10.5 d) lead times (Figs. 5 and 6, respectively), suggesting that local environmental factors, surface characteristics or orography may influence predictability limits of cyclones differently across the region. The choice of a short-range lead time of 3.5 d corresponds to the lead time at which the POD and FAR have similar values, while the choice of 10.5 d corresponds to a medium-range forecast lead time at which the POD values are close to their minimum value (Fig. 3).

Figure 5The distribution of hit counts (the number of forecast ensemble members surpassing the defined GSS threshold) of all cyclones located within the study region for four seasons at a lead time 3.5 d. Circles show the locations of cyclone centers. Colors refer to hit counts for different cases.
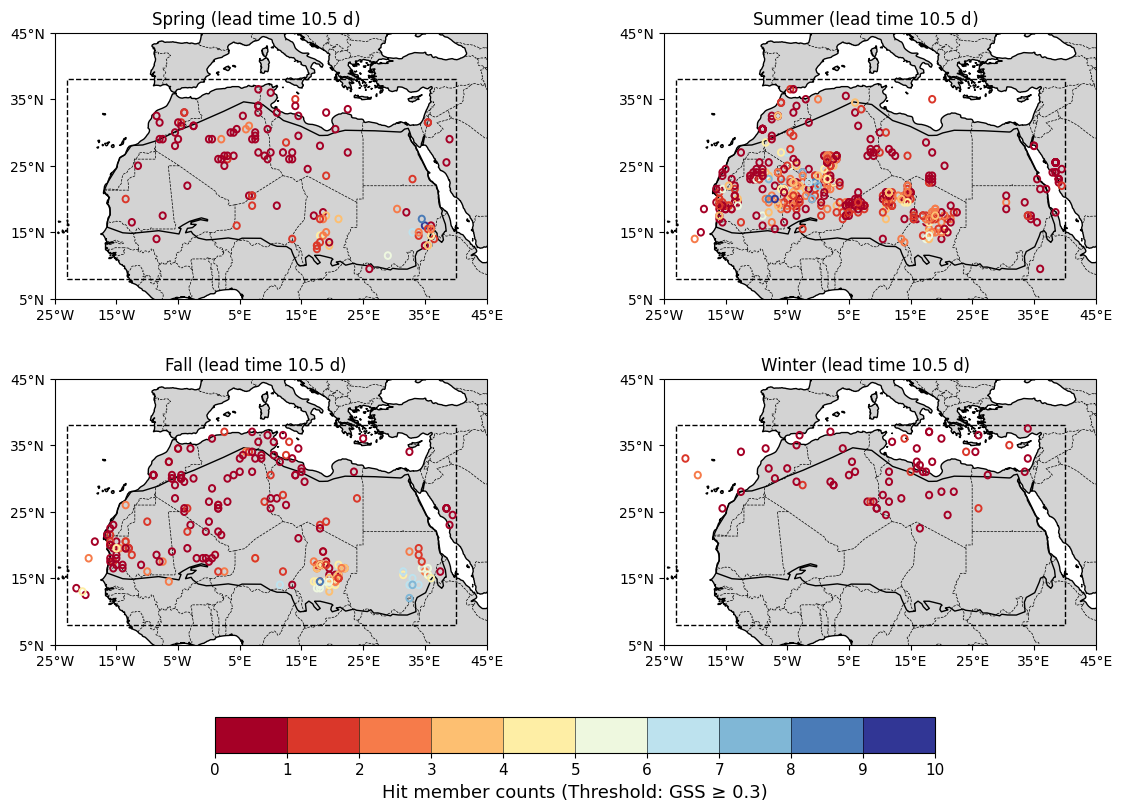
Figure 6Similar to Fig. 5, but for forecast lead time of 10.5 d.
At the lead time of 3.5 d, the forecast skill (measured by hit counts, i.e. the number of members surpassing a GSS threshold; Sect. 2.2.2) exhibits mixed results across the study region, with some distinct spatial patterns (Fig. 5). In summer, high-skill cyclone forecasts (defined here as forecasts with hit counts greater than 5 members) are concentrated in the southwestern part of the Sahara, where HPE-associated cyclones are also more frequent. In winter, the number of high-skill cyclone forecasts is lower in the central part of the Sahara and mostly higher over the central Mediterranean. In fall and spring, high-skill cyclone forecasts tend to be located in the southeastern Sahara, with mixed hit count values over the rest of the domain.
As the lead time increases to 10.5 d, the number of high-skill cyclones decreases dramatically throughout the domain (Fig. 6). A higher concentration of high skill forecasts is observed over the southeastern Sahara during spring and fall, and over the southwestern Sahara during summer. In winter, almost all cyclones exhibit near-zero hit counts at these lead times. The high number of ensemble members with high skill at the lead time of 10.5 d for summer, compared to other seasons, can be attributed to the higher climatological frequency of cyclones in the western part of the study region (Stephenson et al., 2008), as well as to their persistence. Therefore, to verify the robustness of these results, we also compute the skill based on the HK metric (Sect. 2.2.2). Although the HK-based skill is generally higher than the GSS-based skill, the HK-based skill shows similar spatial patterns to those shown with GSS (Figs. A2 and A3), further indicating that the forecast skill in summer is higher than a random forecast on the medium-range or extended-range forecast timescales.
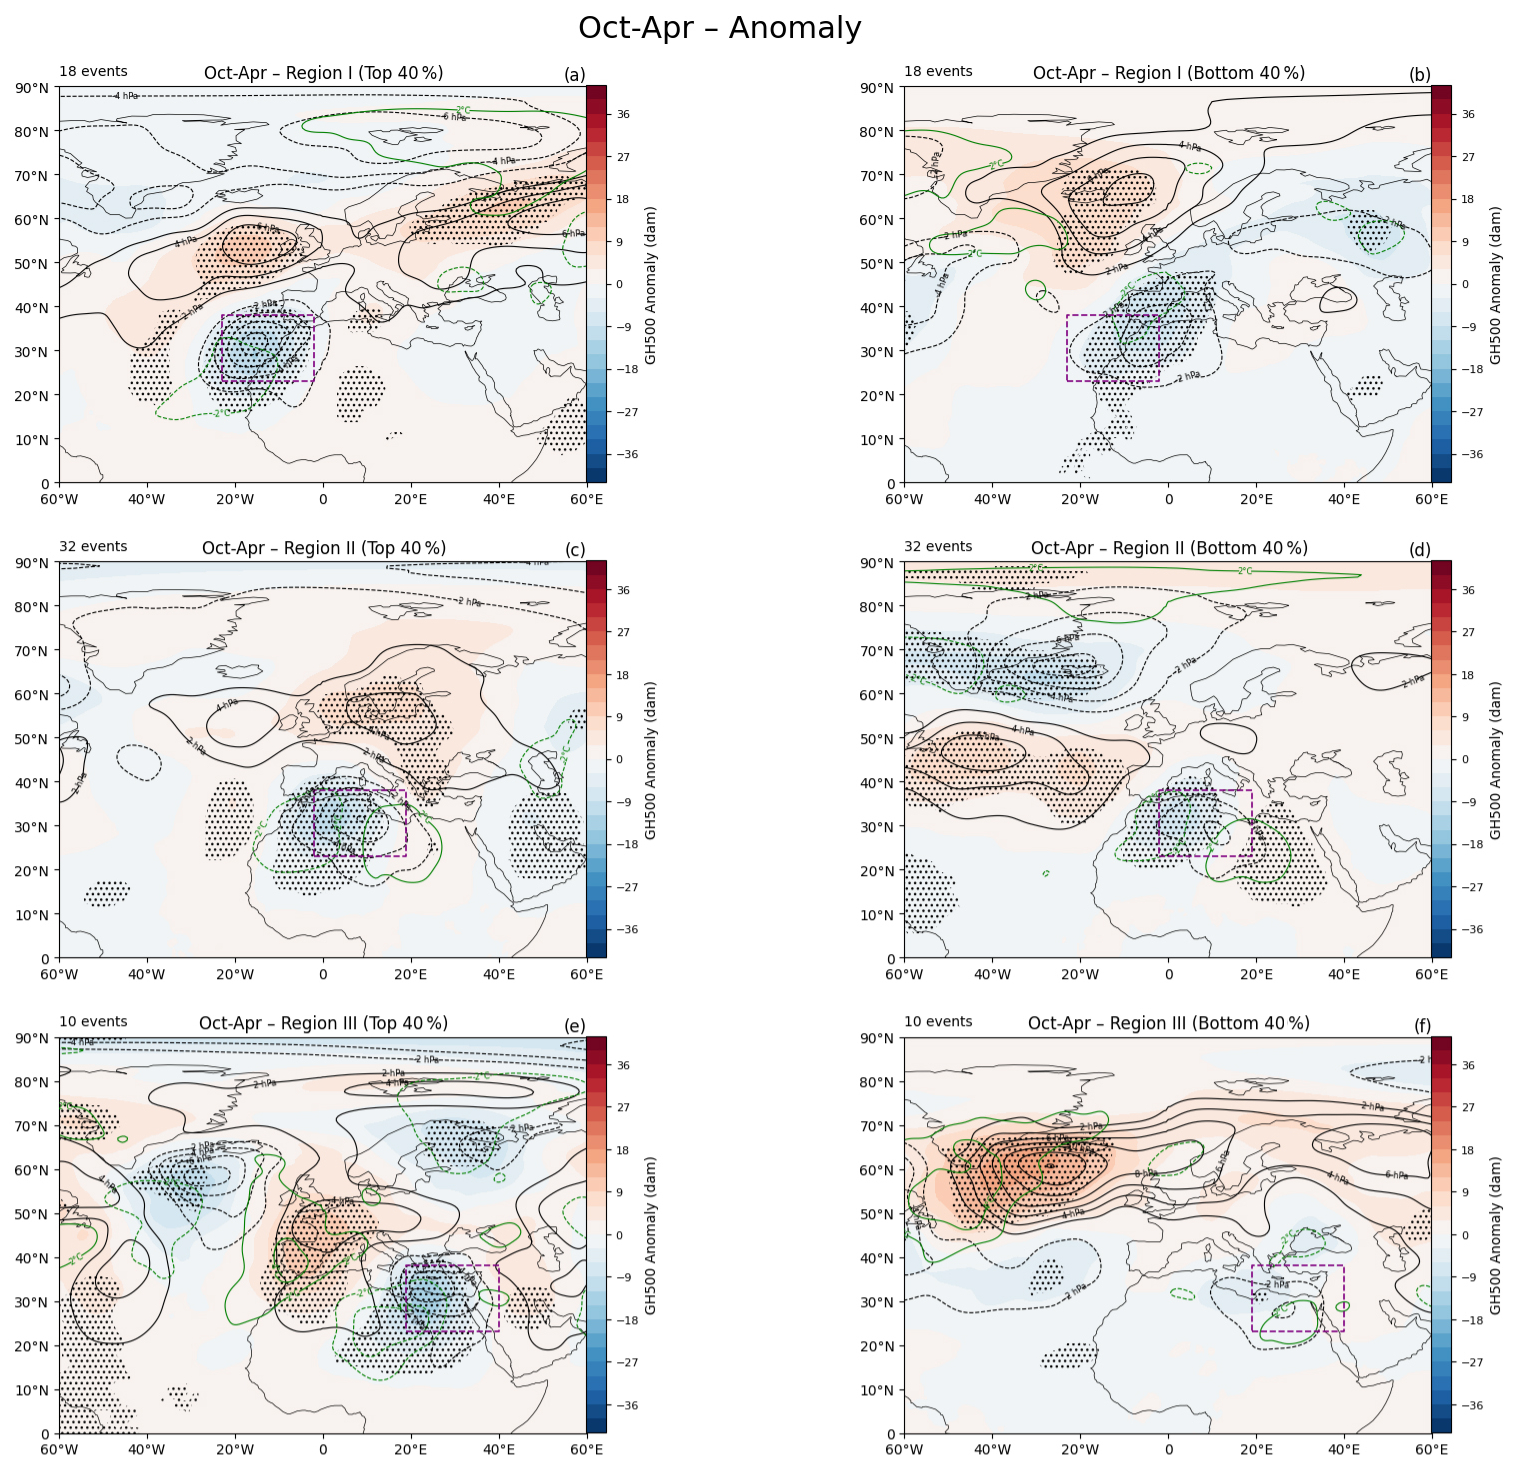
Figure 7GH500 (shading), MSLP (black contours, dashed when negative, 2 hPa interval), and T850 (green contours, 2 °C interval) anomalies for the high- (a, c, e) and low-skill cases (b, d, f), defined according to their corresponding GSS values for reforecasts with a 5.5 d lead time. Each row represents a different region in the northern Sahara (regions I, II, and III) in the extended-winter season (October–April). The number of cyclones in each group is annotated on the top left of each subplot. Hatching represents GH500 anomalies that are significant at α=0.05. The zero anomaly contours for both MSLP and T850 are not shown. Readers are referred to the Appendix for a visualization of the significance testing of the T850 anomalies (Fig. A4).
3.3 Large-scale atmospheric circulation patterns associated with northern Sahara cyclones
During the cold/extended-winter season (i.e. October to April), HPEs in the northern Sahara are often associated with surface cyclones (Sect. 1 and Fig. 1). These cyclones are deeper compared to southern Sahara cyclones, and originate in many cases from the North Atlantic storm track, or emerge locally at the lee-side of the Atlas Mountains. However, the role of large-scale circulation factors for the predictability of HPE-associated cyclones remains unresolved.
To identify sources of forecast bias in northern Saharan cyclones, we explore the large-scale factors that lead to enhanced or reduced storm predictability. Specifically, we analyze large-scale circulation patterns associated with the high- and low-skill cases with respect to their GSS scores during the extended-winter season in three subregions of the northern Sahara (Region I–III in Fig. 1). This analysis is performed using forecasts with lead times of 5.5 and 10.5 d (Figs. 7 and 8, respectively). Performing the analysis over both short–medium- and medium–extended-range forecasts helps distinguish what dominant large-scale circulation patterns are identified on different forecast ranges. For each composite, anomaly fields averaged over the high-skill and low-skill reforecasts for GH500 (color shading), MSLP (black contours), and T850 (blue contours) are shown (Figs. 7 and 8). Similar analysis for the meteorological winter season (December to February) was performed (not shown), exhibiting similar results, yet with a smaller sample size.
At forecast lead time of 5.5 d, high-skill cases in the northwestern Sahara (Region I) are generally associated with deeper cyclones (measured by MSLP anomalies) over the western side of the region and a cold anomaly to the southwest of the MSLP anomaly, while low skill is exhibited for shallower and more easterly located cyclones (Fig. 7a and b). The high-skill cases are also associated with a north–south MSLP dipole pattern over the eastern North-Atlantic (as in Rex-type blocking; Rex, 1950), with the positive geopotential height anomaly located south of Iceland and west of Ireland. This high pressure system is a part of a zonally extended high anomaly in the high-skill cases, while in the low-skill cases, the high is located more to the northwest, over Iceland, and is not extended further to the east. In the other two northern subregions, deeper cyclones also generally correspond to the high-skill cases (Fig. 7c–f), especially in the northeastern Sahara (Region III).
Apart from the depth of the cyclones, the forecast skill for the northern Sahara (Region II) is relatively low when both the Icelandic low and the Azores high are stronger than climatology (Fig. 7d). In the northeastern Sahara (Region III), the difference between the high- and low-skill cases is accentuated – forecasts with high skill are associated on average with deeper surface cyclones, with a clear thermal structure (cold anomaly to the southwest of the cyclone and a shallower warm anomaly to the east), and are accompanied by an upper-level negative anomaly resembling a cutoff low, with a series of highs surrounding this low (Fig. 7e). In contrast, low-skill forecasts are associated with shallower surface cyclones, on average, and a series of high pressure anomalies extending at around latitude 60° N, peaking near Iceland (Fig. 7f).
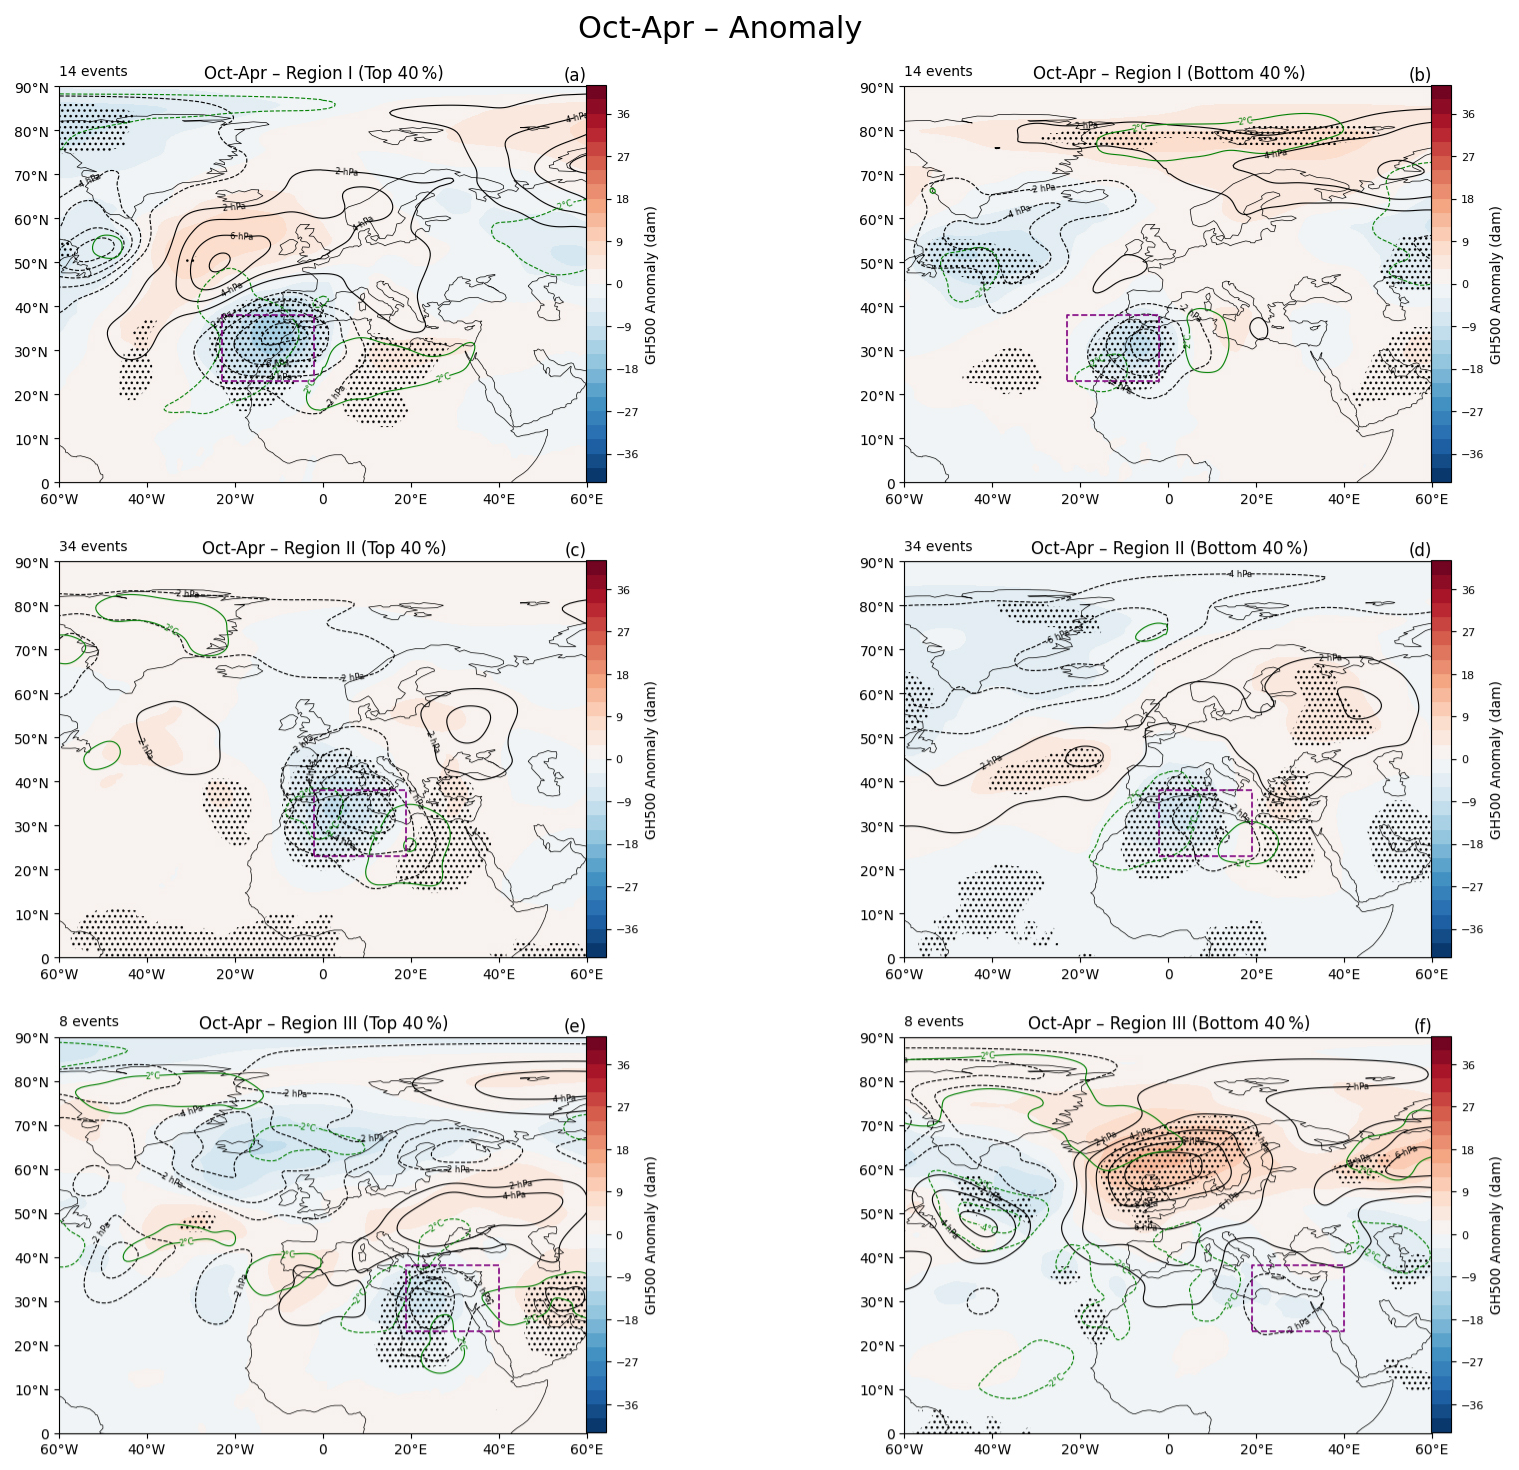
Compared with the 5.5 d lead time, the large-scale patterns in the high- and low-skill cases for the northwestern Sahara (Region I) at a 10.5 d lead time follow generally similar patterns, with a few exceptions: (a) the positive MSLP anomaly in the high-skill cases is weaker and does not extent eastwards, (b) a warm anomaly and a more prominent upper-level high pressure anomaly appear to the east of the region in the low-skill cases, and (c) the high over Iceland in the low-skill cases is less prominent (Fig. 8a and b). For the same lead time, the patterns in the central northern Sahara (Region II) are quite similar to the ones for the 5.5 d lead time, although the prominent high over Europe disappears in the high-skill cases (Fig. 8c and d). Interestingly, while the wave pattern exists in the high-skill cases for the northeastern Sahara (Region III), albeit with a lower magnitude, for the 10.5 d lead time, the low-skill cases are associated with an eastward shift in the position of the ridge from the North Atlantic towards the UK and Scandinavia (Fig. 8e and f).
The wave pattern associated with high skill forecasts in Region I emerge 10 d prior to the HPE over North America (Fig. A6a; around 120–90° W longitude), from which it propagates to the subtropics. In contrast, the low skill forecasts in Region I, are characterized by a transition from one wave pattern to another (Fig. A6b; ∼50–10° W), around 5 d prior to the HPE. In region III, high skill cyclone forecasts are linked to a persistent wave pattern, emerging 5–6 d before the peak of the HPE-associated cyclone (Fig. A6c; ∼0–45° E), whereas such pattern is absent for the low skill events (Fig. A6d). Region II, on the other hand, shows a more subtle difference between high and low skill cases. Overall, these results indicate that transitions between large-scale circulation patterns represent periods of reduced predictability for Saharan cyclones compared to persistent regimes. Particularly, the presence of Rossby waves triggered by remote drivers can act as a predictable signal, enhancing forecast skill across the Sahara up to 10 d in advance.
In this study, we investigate the predictability of cyclones associated with the occurrence of heavy precipitation in the Sahara, focusing on their temporal, regional, and seasonal variability. While precipitation forecasts in arid regions often show limited skill, making it difficult to anticipate both flood hazards and opportunities for water-resource replenishment, increased cyclone predictability offers a pathway to extend the effective lead time for such high-impact events. For this purpose, we use a catalog of HPE-associated cyclones, independently identified from satellite observations. The predictability of these cyclones is then evaluated using 10 ensemble member ECMWF reforecasts, with each member verified against ERA5 reanalysis.
Verification of cyclone predictions requires an integrated perspective that accounts for the intensity, structure, and location of the cyclone at each lead time. Traditional cyclone verification methods evaluate cyclone predictability based on tracking of cyclone centers and intensity (e.g. Froude et al., 2007; Neu et al., 2013; Rudeva et al., 2014; Korfe and Colle, 2018). However, these methods do not take into account situations in which there is a spatial or temporal mismatch between the forecasted and observed cyclones (the double penalty problem; Gilleland et al., 2009). To overcome this issue, our study uses an area-based (“feature-oriented”) method to assess the forecast skill of cyclones at lead times ranging from 0.5 to 15.5 d. Using this approach, the verification takes into account cyclones even in situations in which other methods would have underestimated the practical forecast skill.
Cyclone predictability across the Sahara varies with the geographic location and the season. The highest short-range skill of HPE-associated cyclones is in winter (Fig. 3), when HPE-associated cyclones are found mainly in the northern part of the Sahara. At longer lead times, however, a higher skill is found in summer and fall, and the region of relatively high skill shifts southward (Fig. 6). Interestingly, summer cyclone forecasts remain skillful compared to a random forecast even on the medium- and extended-range timescales. In all seasons, cyclone predictability approaches climatological values at lead time of 10.5 d, indicating that the skillful prediction limit is around this threshold. This predictability limit coincides with that indicated by Zhang et al. (2019), although they obtained this limit for midlatitude weather systems from the perspective of error variance in prediction models with higher resolution.
The sensitivity of cyclone forecast skill to geographic location and season reflects the distinct characteristics of HPE-associated cyclones in the Sahara, notably their interaction with the large-scale flow patterns. Over the northern Sahara, deeper cyclones are better predicted; a promising result given that cyclone depth is commonly associated with stronger dynamical forcing and a higher likelihood of producing high-impact weather. In some cases, these cyclones are associated with a mid-tropospheric Rossby wave pattern (Figs. 7 and 8; Fig. A6). Rossby waves are associated with either high or low predictability (see also Prestel-Kupferer et al., 2024): Persistent Rossby wave packets can be associated with enhanced predictability and the occurrence of extreme weather events (Wirth and Eichhorn, 2014; Grazzini and Vitart, 2015). However, these Rossby wave packets may also act as “predictability barriers” over the North Atlantic, particularly for forecasts initialized before their onset, thus limiting the forecast skill (Sánchez et al., 2020; Prestel-Kupferer et al., 2024). Furthermore, in the downstream region of Rossby waves, the growth of forecast errors and ensemble spread can lead to a decrease in predictability (Baumgart et al., 2018; Rodwell et al., 2018; Zheng et al., 2013).
Our results show that HPE-associated Saharan cyclones are better predicted when a persistent Rossby wave pattern reaches the area from afar. When wave patterns are generated nearby, and not long before the HPE occurs, prediction skill tends to be worse, unless a stationary, mid-tropospheric low occurs a few days prior to the storm (Fig. A6e). These findings are consistent with previous studies on large-scale weather regime transitions in the Euro-Atlantic sector, indicating that transitions between flow patterns pose significant predictability challenges (e.g. Ferranti et al., 2015; Hauser et al., 2026).
Furthermore, Rossby wave breaking (RWB) may also play a role in the occurrence of HPE-associated cyclones in the northern Sahara, predominantly for anticyclonic RWB events (De Vries et al., 2024; Tamarin-Brodsky and Harnik, 2024). Taken together, these findings suggest that Rossby waves are associated with both increased and decreased predictability, implying that improved understanding of Rossby waves and their interaction with cyclones over the Sahara, can help to improve model accuracy in predicting HPE-associated cyclones.
In the southern Sahara, on the other hand, cyclones tend to be associated with other large-scale factors, including the occurrence of the Saharan heat low, African easterly waves, transient heat lows, and the Sudan monsoon low (Lavaysse et al., 2009b; Berry et al., 2007; Alpert and Ziv, 1989; Tsvieli and Zangvil, 2005). However, since the development of surface cyclones in this region is modulated by mesoscale processes, including latent heat release and moist convection (e.g. Gaetani et al., 2017; Maranan et al., 2019), their analysis falls outside the scope of this study, which focuses on synoptic-scale predictability.
For HPEs not associated with surface cyclones, especially in the extreme arid areas of the northeastern Sahara, other systems, such as tropical plumes (Yokochi et al., 2019), reversed jet axis (Dayan and Abramski, 1983), and mesoscale convective systems (Trzeciak et al., 2017), need further investigation to better understand the predictability of these non-cyclone-associated HPEs.
This study has several limitations that should be considered when interpreting the results. First, the HPE catalog is based on IMERG V06 (Armon et al., 2024), and the representation of precipitation extremes in satellite products over data-sparse regions such as the Sahara remains an open question, particularly at daily scales. Second, the attribution of cyclones to HPEs relies on simplified assumptions, including the use of a single daily reference time (12:00 UTC) and proximity-based matching, which do not explicitly account for the full temporal evolution or physical association between cyclones and precipitation. Third, the evaluation of forecast skill is based on a limited ensemble size (10 members) and a finite number of cases, which is only a few tens in some subregions in the seasons with the least events, which may affect the robustness of the results. Further improvement to our analysis could be achieved with a larger sample size, for example, by utilizing large ensembles of subseasonal forecasts (i.e. with 50 or 100 members), which would increase the statistical robustness of the analysis. We provide here insight into the broader predictability across the entire Sahara over timescales of days to weeks. Future studies, focusing on specific regions and specific case-studies could shed light on the synoptic- or even finer scale processes involved and how the predictability of cyclones is modulated throughout their lifecycle. Despite these limitations, the consistency of the results across regions, seasons, and methodological sensitivity tests suggests that the main conclusions are robust.
Identifying when and where the forecast model struggles to predict storms is a crucial step towards improving forecast accuracy. For instance, the finding that summer cyclones possess a longer predictability horizon, yet suffer from a ∼60 % FAR, suggests a systematic model bias. Improved or tuned parametrization of convection and boundary layer schemes for the arid Sahara can help with such a bias. Our findings can help with identifying key regimes of predictability for the Sahara. Specifically, our results highlight the seasonal predictability dependency; winter skill is suggested to be initial conditions-limited while summer skill is physics scheme-limited. This may allow for seasonally-optimized forecasting strategies. In addition, the strong regional dependency identified in our study points toward localized errors, possibly linked to Saharan surface properties (surface albedo, soil moisture) or complex topography (e.g. the Atlas Mountains or Ahaggar Mountains). Taken together, these dependencies can aid in highlighting existing model deficiencies and guide future model development.
In summary, our analysis suggests that seasonality and dominant circulation patterns exert a strong control on predictability of Saharan cyclones. Further studies of potential relationships between cyclone frequency and large-scale atmospheric circulation patterns are required to determine the relative role of these factors, as well as cyclone characteristics, for predictability. A better understanding of the mechanisms governing cyclone predictability in this region will help provide improved HPE forecasts in arid subtropical flood-prone regions, thus mitigating their devastating impacts.
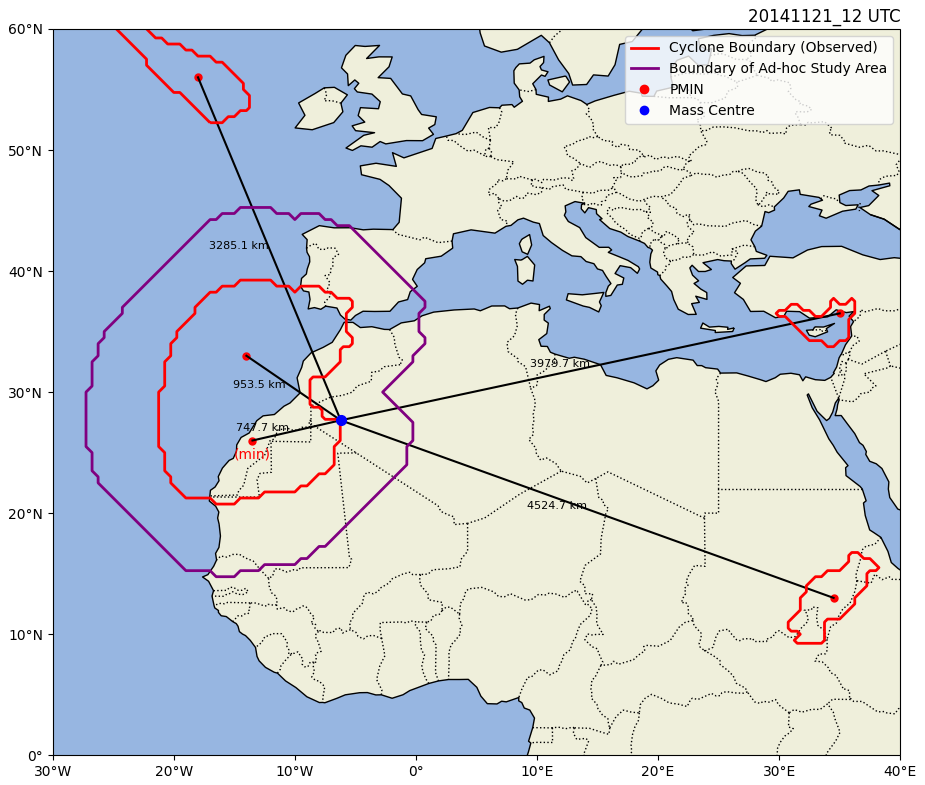
Figure A1Association of a cyclone with an HPE. The blue dot represents the mass center of an example HPE from 20–24 November 2014. Red dots represent the cyclone centers (minimum pressure), while the red lines denote the borders of cyclones on 21 November 2014 (date of maximum precipitation volume for this HPE). The distances between the mass center and each cyclone center are annotated in the plot. The pressure minimum with the shortest distance to the precipitation mass center is marked with (min) and its corresponding cyclone is the cyclone we have marked as associated with this specific HPE. The border of the associated cyclone is expanded by 6° to obtain an ad-hoc study region (purple line).
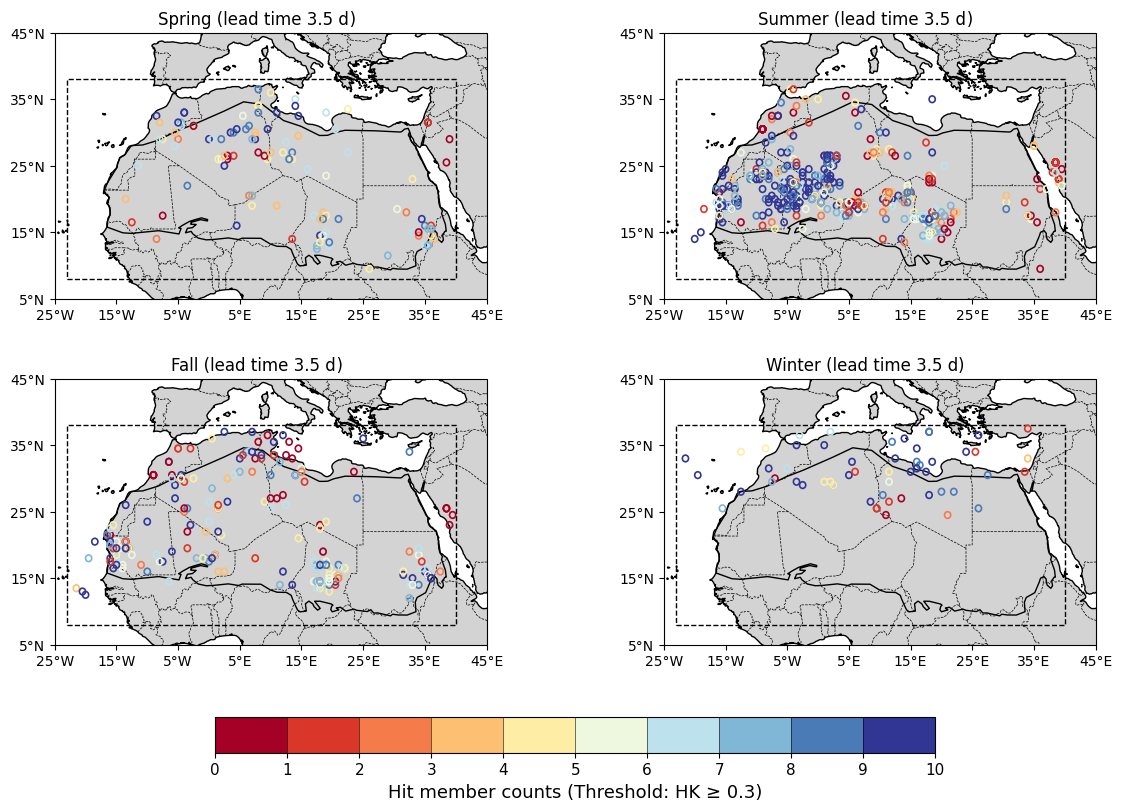
Figure A2Similar to Fig. 5, but for the forecast skill measured with the HK.
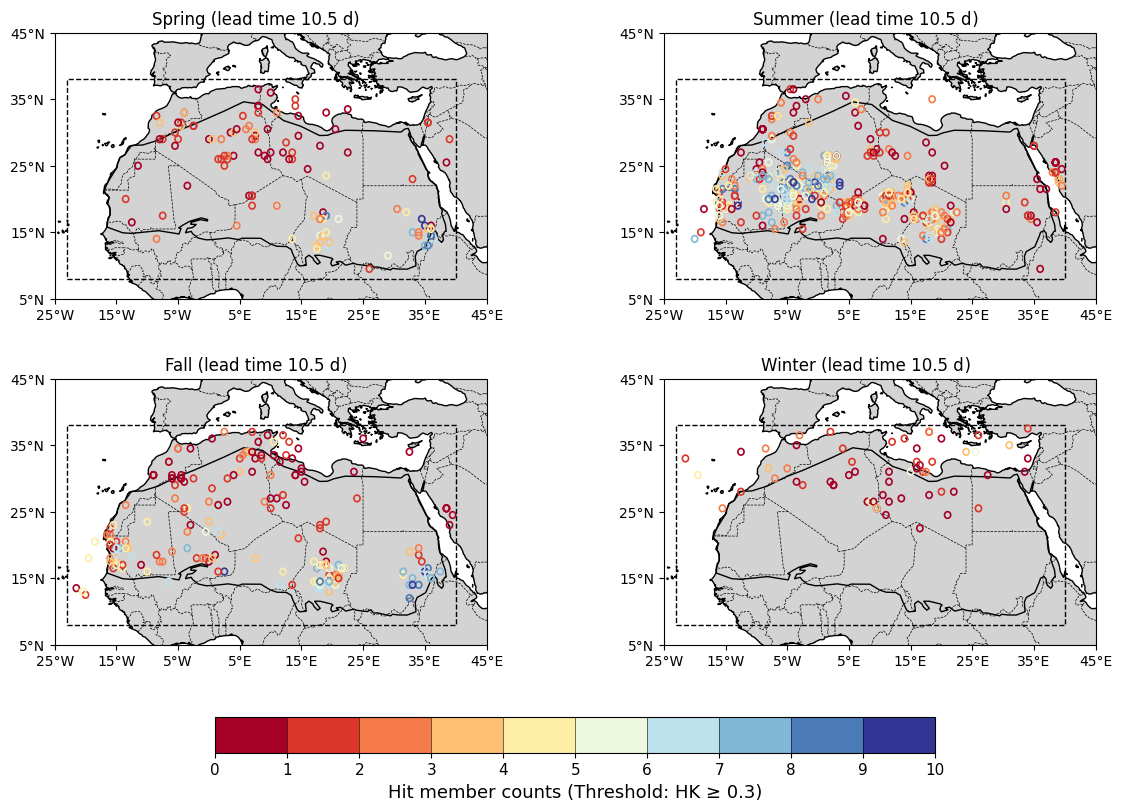
Figure A3Similar to Fig. 6, but for the forecast skill measured with the HK.
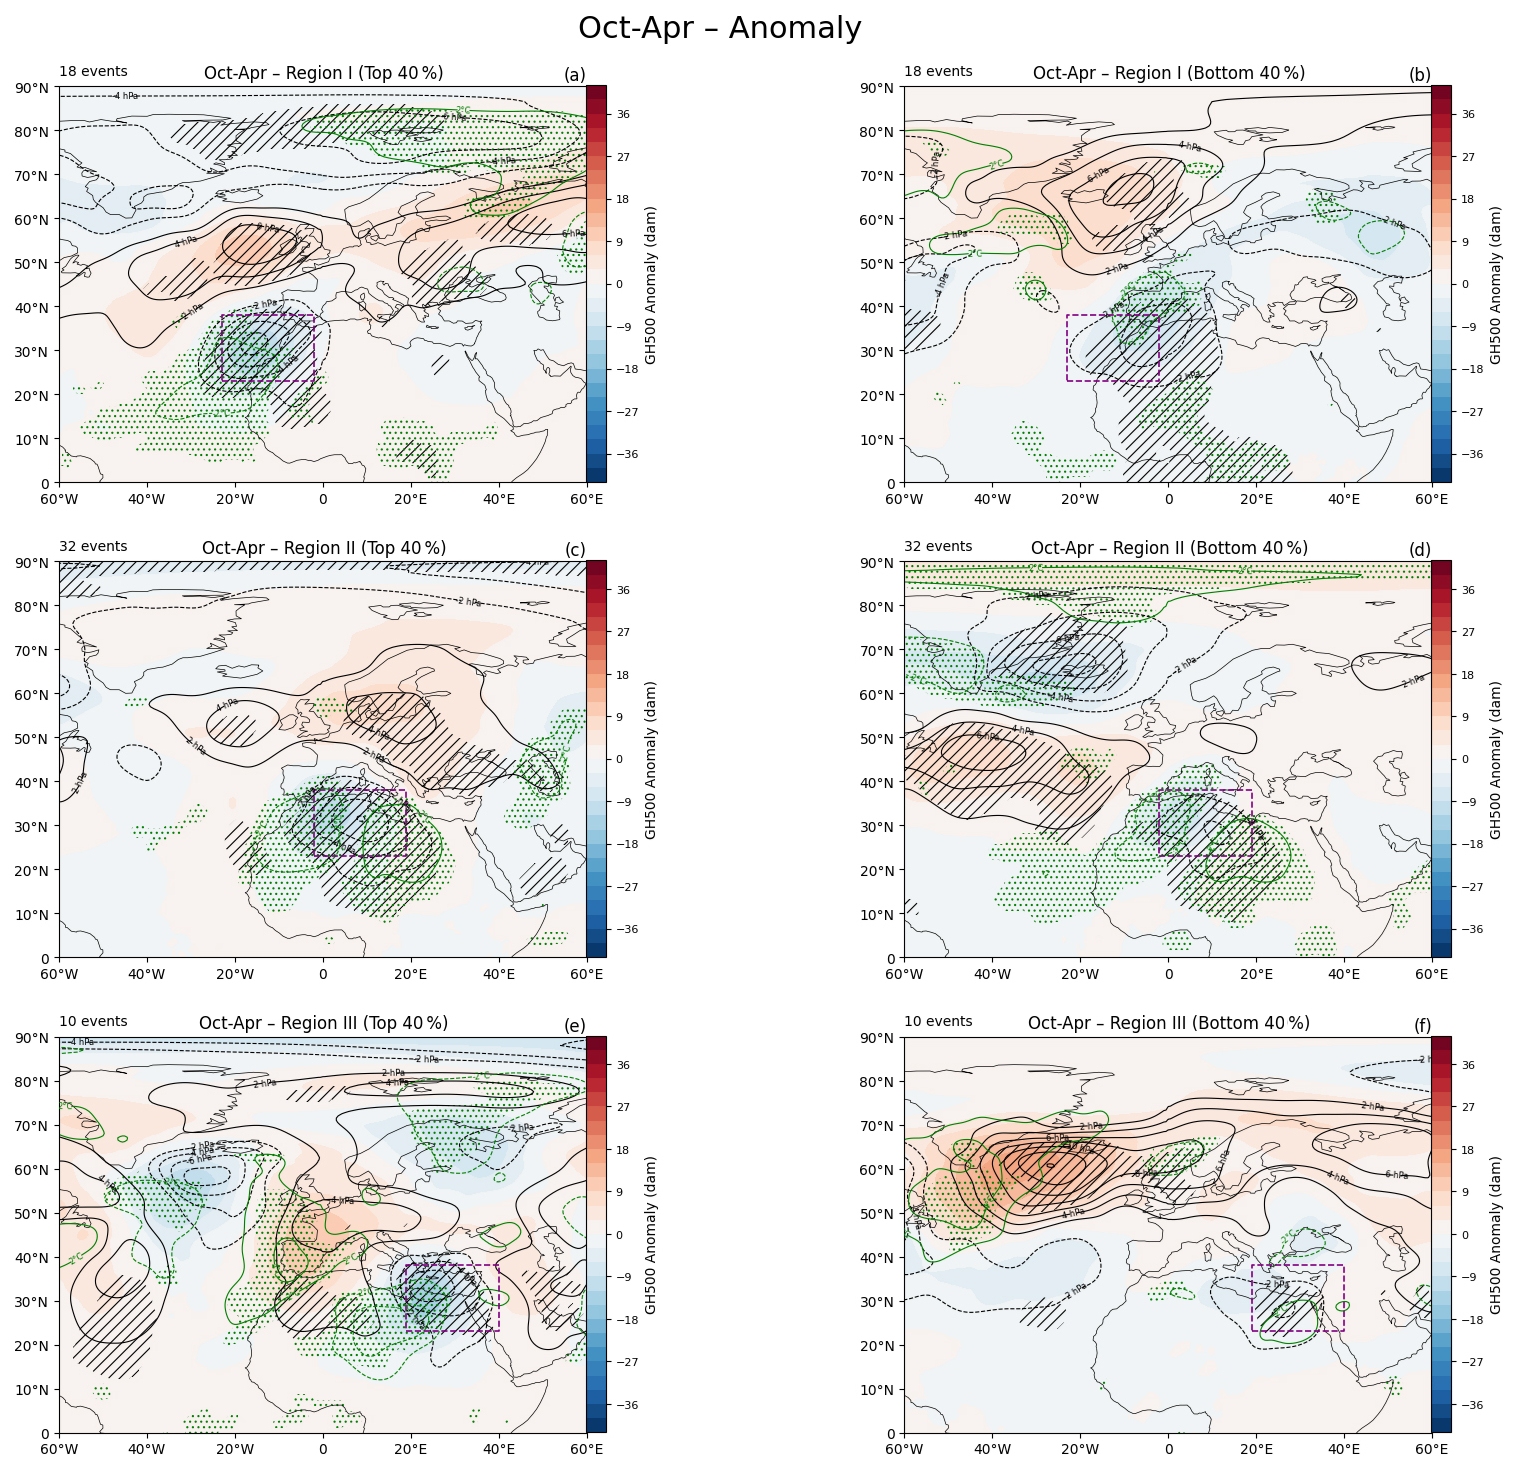
Figure A4Similar to Fig. 7, but here, green stippling represents T850 anomalies.
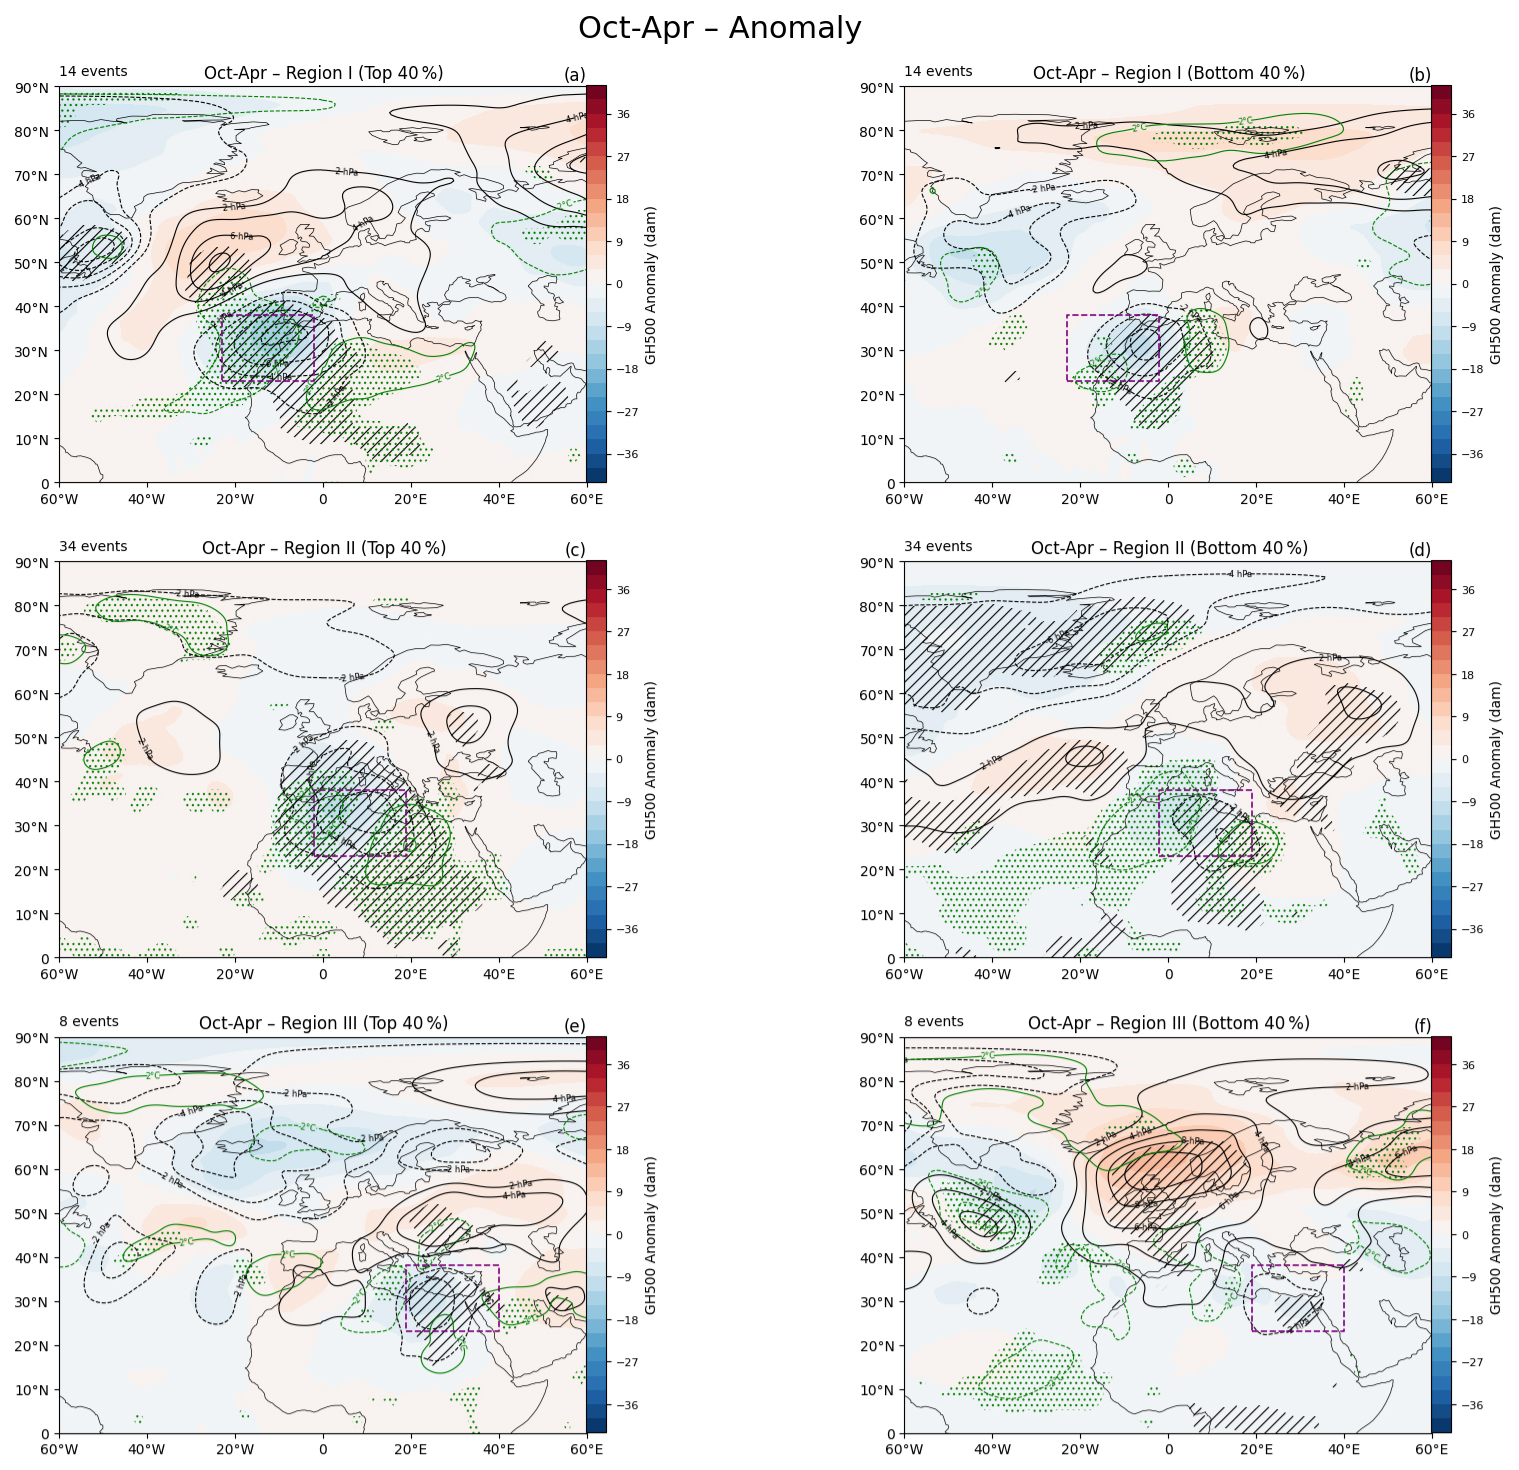
Figure A5Similar to Fig. 8, but here, green stippling represents T850 anomalies.
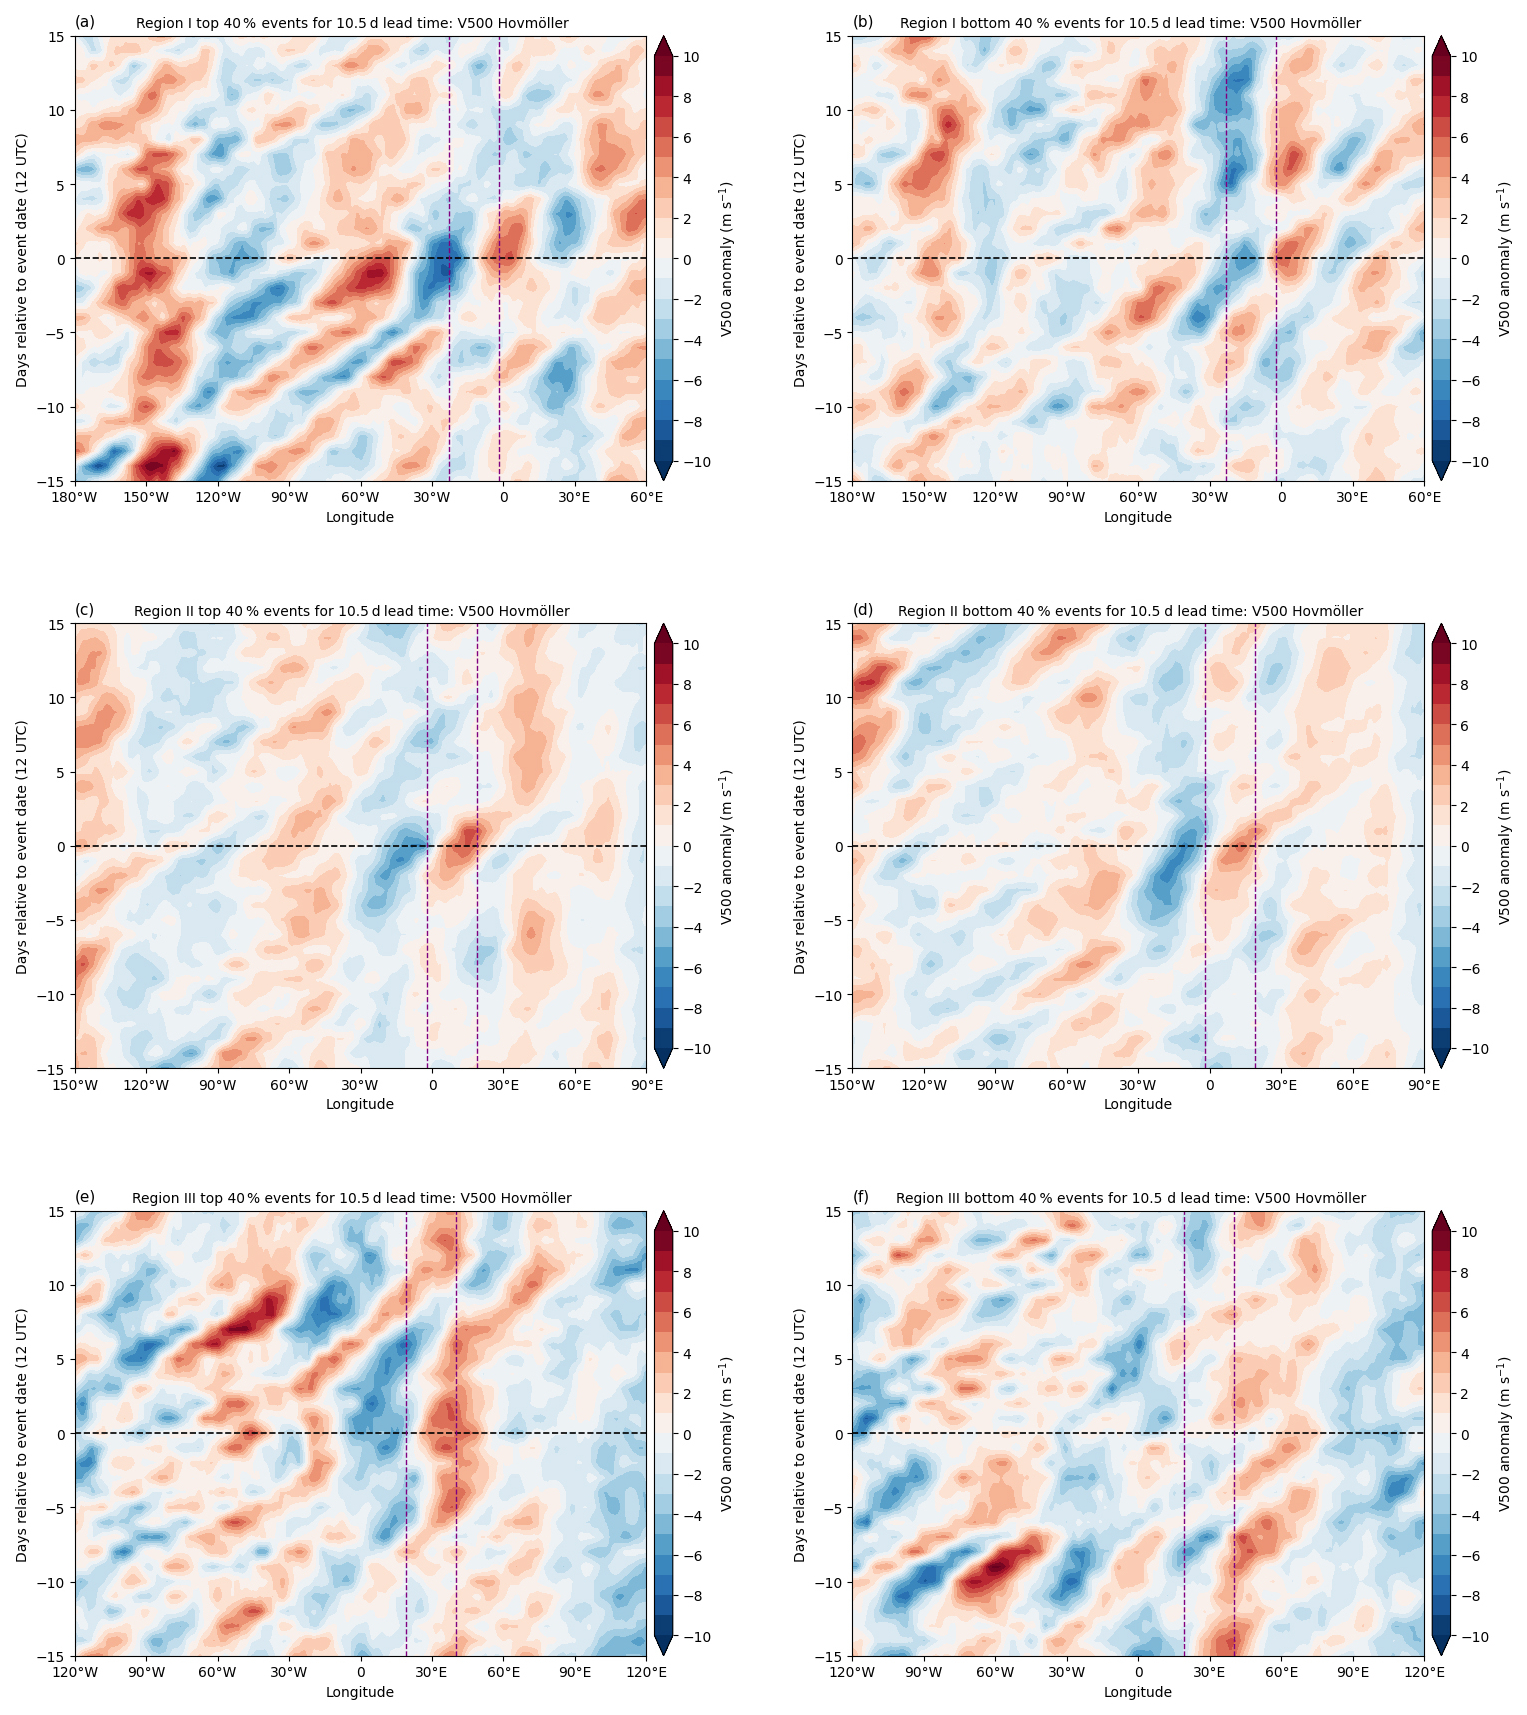
Figure A6Hovmöller diagram of the meridional wind (m s−1; color shading) at 500 hPa, averaged between 20 and 50° N for cyclone events predicted with the upper 40 % (left panels) and lower 40 % (right) skill at a lead time of 10.5 d (Sect. 3.3). Dashed purple lines represent the respective subregion.
ERA5 reanalysis dataset (Hersbach et al., 2020) is freely available through the Copernicus Climate Change Service at https://doi.org/10.24381/cds.adbb2d47 (Copernicus Climate Change Service (C3S), 2023). ECMWF IFS hindcast data are available from the ECMWF public data archive (https://apps.ecmwf.int/archive-catalogue/, last access: 5 June 2026). The Saharan HPE dataset is available through Armon et al. (2024). An example of the verification method and the corresponding figures are archived on Zenodo at https://doi.org/10.5281/zenodo.19557134 (Ling et al., 2026).
HAG and MA designed the study. GL carried out the analysis and visualizations. All authors contributed to the writing and editing of the manuscript.
The contact author has declared that none of the authors has any competing interests.
Publisher's note: Copernicus Publications remains neutral with regard to jurisdictional claims made in the text, published maps, institutional affiliations, or any other geographical representation in this paper. The authors bear the ultimate responsibility for providing appropriate place names. Views expressed in the text are those of the authors and do not necessarily reflect the views of the publisher.
The authors thank Michael Sprenger and Dominik Büeler for providing the cyclone masks for ERA5 and ECMWF reforecasts. We also thank Heini Wernli and Daniela Domeisen for fruitful discussions, and two anonymous reviewers for their helpful comments. Support from the Swiss National Science Foundation through project PZ00P2_223676 to HAG is gratefully acknowledged. MA was supported by the Swiss National Science Foundation (grant no. TMPFP2_216989); by the Med World and Tuning for Deserts consortia, funded by the Council for Higher Education in Israel; and by the Israel Science Foundation research grant (ISF's no. 4089/25) and the Maimonides Fund's Future Scientists Center.
This research has been supported by the Schweizerischer Nationalfonds zur Förderung der Wissenschaftlichen Forschung (grant nos. PZ00P2_223676 and TMPFP2_216989), the Israel Science Foundation (grant no. 4089/25), and the Council for Higher Education, Planning and Budgeting Committee of the Council for Higher Education of Israel (Med World consortium and Tuning for Deserts consortium).
This paper was edited by Silvio Davolio and reviewed by two anonymous referees.
Afargan-Gerstman, H., Büeler, D., Wulff, C. O., Sprenger, M., and Domeisen, D. I. V.: Stratospheric influence on the winter North Atlantic storm track in subseasonal reforecasts, Weather Clim. Dynam., 5, 231–249, https://doi.org/10.5194/wcd-5-231-2024, 2024. a, b
Alpert, P. and Ziv, B.: The Sharav Cyclone: observations and some theoretical considerations, J. Geophys. Res., 94, 18495–18514, https://doi.org/10.1029/jd094id15p18495, 1989. a
Ammar, K., El-Metwally, M., Almazroui, M., and Abdel Wahab, M.: A climatological analysis of Saharan cyclones, Clim. Dynam., 43, 483–501, https://doi.org/10.1007/s00382-013-2025-0, 2014. a
Armon, M., Dente, E., Smith, J. A., Enzel, Y., and Morin, E.: Synoptic-scale control over modern rainfall and flood patterns in the Levant drylands with implications for past climates, J. Hydrometeorol., 19, 1077–1096, https://doi.org/10.1175/JHM-D-18-0013.1, 2018. a
Armon, M., de Vries, A. J., Marra, F., Peleg, N., and Wernli, H.: Saharan rainfall climatology and its relationship with surface cyclones, Weather and Climate Extremes, 43, 100638, https://doi.org/10.1016/j.wace.2023.100638, 2024. a, b, c, d, e, f, g, h, i, j
Armon, M., Shmilovitz, Y., and Dente, E.: Anatomy of a foreseeable disaster: lessons from the 2023 dam-breaching flood in Derna, Libya, Science Advances, 11, eadu2865, https://doi.org/10.1126/sciadv.adu2865, 2025. a, b
Baumgart, M., Riemer, M., Wirth, V., Teubler, F., and Lang, S. T.: Potential vorticity dynamics of forecast errors: a quantitative case study, Mon. Weather Rev., 146, 1405–1425, 2018. a
Belachsen, I., Marra, F., Peleg, N., and Morin, E.: Convective rainfall in a dry climate: relations with synoptic systems and flash-flood generation in the Dead Sea region, Hydrol. Earth Syst. Sci., 21, 5165–5180, https://doi.org/10.5194/hess-21-5165-2017, 2017. a
Berry, G., Thorncroft, C., and Hewson, T.: African easterly waves during 2004–analysis using objective techniques, Mon. Weather Rev., 135, 1251–1267, https://doi.org/10.1175/MWR3343.1, 2007. a
Black, J., Johnson, N. C., Baxter, S., Feldstein, S. B., Harnos, D. S., and L'Heureux, M. L.: The predictors and forecast skill of Northern Hemisphere teleconnection patterns for lead times of 3–4 weeks, Mon. Weather Rev., 145, 2855–2877, https://doi.org/10.1175/MWR-D-16-0394.1, 2017. a
Candogan Yossef, N., van Beek, L. P. H., Kwadijk, J. C. J., and Bierkens, M. F. P.: Assessment of the potential forecasting skill of a global hydrological model in reproducing the occurrence of monthly flow extremes, Hydrol. Earth Syst. Sci., 16, 4233–4246, https://doi.org/10.5194/hess-16-4233-2012, 2012. a
Chaqdid, A., Tuel, A., El Fatimy, A., and El Moçayd, N.: Extreme rainfall events in Morocco: spatial dependence and climate drivers, Weather and Climate Extremes, 40, 100556, https://doi.org/10.1016/j.wace.2023.100556, 2023. a
Copernicus Climate Change Service (C3S): ERA5 hourly data on single levels from 1940 to present, Copernicus Climate Change Service (C3S) Climate Data Store (CDS) [data set], https://doi.org/10.24381/cds.adbb2d47, 2023. a
Cordeira, J. M., Ralph, F. M., Talbot, C., Forbis, J., Novak, D. R., Nelson, J. A., Mahoney, K., Weihs, R., Slinskey, E., and Delle Monache, L.: A summary of U.S. watershed precipitation forecast skill and the National Forecast-Informed Reservoir Operations Expansion Pathfinder effort, Weather Forecast., 40, 1529–1542, https://doi.org/10.1175/WAF-D-24-0188.1, 2025. a
Cuthbert, M. O., Taylor, R. G., Favreau, G., Todd, M. C., Shamsudduha, M., Villholth, K. G., MacDonald, A. M., Scanlon, B. R., Kotchoni, D. O., Vouillamoz, J. M., Lawson, F. M., Adjomayi, P. A., Kashaigili, J., Seddon, D., Sorensen, J. P., Ebrahim, G. Y., Owor, M., Nyenje, P. M., Nazoumou, Y., Goni, I., Ousmane, B. I., Sibanda, T., Ascott, M. J., Macdonald, D. M., Agyekum, W., Koussoubé, Y., Wanke, H., Kim, H., Wada, Y., Lo, M. H., Oki, T., and Kukuric, N.: Observed controls on resilience of groundwater to climate variability in sub-Saharan Africa, Nature, 572, 230–234, https://doi.org/10.1038/s41586-019-1441-7, 2019. a
Dayan, U. and Abramski, R.: Heavy rain in the Middle East related to unusual jet stream properties, B. Am. Meteorol. Soc., 64, 1138–1140, https://doi.org/10.1175/1520-0477(1983)064<1138:HRITME>2.0.CO;2, 1983. a
De Vries, A. J., Tyrlis, E., Edry, D., Krichak, S. O., Steil, B., and Lelieveld, J.: Extreme precipitation events in the Middle East: dynamics of the Active Red Sea Trough, J. Geophys. Res.-Atmos., 118, 7087–7108, https://doi.org/10.1002/jgrd.50569, 2013. a, b
De Vries, A. J., Armon, M., Klingmüller, K., Portmann, R., Röthlisberger, M., and Domeisen, D. I. V.: Breaking Rossby waves drive extreme precipitation in the world's arid regions, Communications Earth and Environment, 5, 493, https://doi.org/10.1038/s43247-024-01633-y 2024. a, b, c
Domeisen, D. I. V., White, C. J., Afargan-Gerstman, H., Muñoz, Á. G., Janiga, M. A., Vitart, F., Wulff, C. O., Antoine, S., Ardilouze, C., Batté, L., Bloomfield, H. C., Brayshaw, D. J., Camargo, S. J., Charlton-Pérez, A., Collins, D., Cowan, T., del Mar Chaves, M., Ferranti, L., Gómez, R., González, P. L. M., González Romero, C., Infanti, J. M., Karozis, S., Kim, H., Kolstad, E. W., LaJoie, E., Lledó, L., Magnusson, L., Malguzzi, P., Manrique-Suñén, A., Mastrangelo, D., Materia, S., Medina, H., Palma, L., Pineda, L. E., Sfetsos, A., Son, S.-W., Soret, A., Strazzo, S., and Tian, D.: Advances in the subseasonal prediction of extreme events: relevant case studies across the globe, B. Am. Meteorol. Soc., 103, E1473–E1501, https://doi.org/10.1175/BAMS-D-20-0221.1, 2022. a
El-Fandy, M.: The effect of the sudan monsoon low on the development of thundery conditions in Egpyt, Palestine and Syria, Q. J. Roy. Meteor. Soc., 74, 31–38, https://doi.org/10.1002/qj.49707431904, 1948. a
Elless, T. J.: Predictability of African easterly waves in an operational ensemble prediction system, PhD thesis, University at Albany, State University of New York, https://doi.org/10.54014/K5ZC-ZFZ3, 2018. a
Engelstaedter, S., Washington, R., Flamant, C., Parker, D. J., Allen, C., and Todd, M.: The Saharan heat low and moisture transport pathways in the central Sahara – multiaircraft observations and Africa-LAM evaluation, J. Geophys. Res.-Atmos., 120, 4417–4442, https://doi.org/10.1002/2015JD023123, 2015. a
Ferranti, L., Corti, S., and Janousek, M.: Flow-dependent verification of the ECMWF ensemble over the Euro-Atlantic sector, Q. J. Roy. Meteor. Soc., 141, 916–924, 2015. a
Fink, A. H. and Knippertz, P.: An extreme precipitation event in southern Morocco in spring 2002 and some hydrological implications, Weather, 58, 377–387, https://doi.org/10.1256/wea.256.02, 2003. a
Flaounas, E., Dafis, S., Davolio, S., Faranda, D., Ferrarin, C., Hartmuth, K., Hochman, A., Koutroulis, A., Khodayar, S., Miglietta, M. M., Pantillon, F., Patlakas, P., Sprenger, M., and Thurnherr, I.: Dynamics, predictability, impacts and climate change considerations of the catastrophic Mediterranean Storm Daniel (2023), Weather Clim. Dynam., 6, 1515–1538, https://doi.org/10.5194/wcd-6-1515-2025, 2025. a
Froude, L. S.: Regional differences in the prediction of extratropical cyclones by the ECMWF Ensemble Prediction System, Mon. Weather Rev., 137, 893–911, https://doi.org/10.1175/2008MWR2610.1, 2009. a
Froude, L. S. R., Bengtsson, L., and Hodges, K. I.: The predictability of extratropical storm tracks and the sensitivity of their prediction to the observing system, Mon. Weather Rev., 135, 315–333, https://doi.org/10.1175/MWR3274.1, 2007. a
Gaetani, M., Messori, G., Zhang, Q., Flamant, C., and Pausata, F. S. R.: Understanding the mechanisms behind the northward extension of the West African monsoon during the mid-holocene, J. Climate, 30, 7621–7642, https://doi.org/10.1175/JCLI-D-16-0299.1, 2017. a
Gilleland, E., Ahijevych, D., Brown, B. G., Casati, B., and Ebert, E. E.: Intercomparison of spatial forecast verification methods, Weather Forecast., 24, 1416–1430, https://doi.org/10.1175/2009WAF2222269.1, 2009. a
Grazzini, F. and Vitart, F.: Atmospheric predictability and Rossby wave packets, Q. J. Roy. Meteor. Soc., 141, 2793–2802, 2015. a
Hauser, S., Cavallo, S. M., Magnusson, L., Martin, J. E., and Parsons, D. B.: Exceptionally poor and good medium-range forecasts of the large-scale circulation over Europe in ERA5 reforecasts, Q. J. Roy. Meteor. Soc., 152, e70117, https://doi.org/10.1002/qj.70117, 2026. a
Hersbach, H., Bell, B., Berrisford, P., Hirahara, S., Horányi, A., Muñoz-Sabater, J., Nicolas, J., Peubey, C., Radu, R., Schepers, D., Simmons, A., Soci, C., Abdalla, S., Abellan, X., Balsamo, G., Bechtold, P., Biavati, G., Bidlot, J., Bonavita, M., De Chiara, G., Dahlgren, P., Dee, D., Diamantakis, M., Dragani, R., Flemming, J., Forbes, R., Fuentes, M., Geer, A., Haimberger, L., Healy, S., Hogan, R. J., Hólm, E., Janisková, M., Keeley, S., Laloyaux, P., Lopez, P., Lupu, C., Radnoti, G., de Rosnay, P., Rozum, I., Vamborg, F., Villaume, S., and Thépaut, J.-N.: The ERA5 global reanalysis, Q. J. Roy. Meteor. Soc., 146, 1999–2049, https://doi.org/10.1002/qj.3803, 2020. a, b, c
Hogan, R. J., Ferro, C. A., Jolliffe, I. T., and Stephenson, D. B.: Equitability revisited: why the “equitable threat score” is not equitable, Weather Forecast., 25, 710–726, https://doi.org/10.1175/2009WAF2222350.1, 2010. a, b
Kalma, J. D. and Franks, S. W.: Rainfall in arid and semi-arid regions, in: Understanding Water in a Dry Environment: Hydrological Processes in Arid and Semi-arid Zones, edited by: Simmers, I., CRC Press, London, https://doi.org/10.1201/9780203971307-7 31–80, 2003. a
Kelley, O. a.: Where the least rainfall occurs in the Sahara Desert, the TRMM radar reveals a different pattern of rainfall each season, J. Climate, 27, 6919–6939, https://doi.org/10.1175/JCLI-D-14-00145.1, 2014. a
Kelso, N. V. and Patterson, T.: Introducing Natural Earth Data – naturalearthdata.com, Geographia Technica, 5, 82–89, 2010. a
Korfe, N. G. and Colle, B. A.: Evaluation of cool-season extratropical cyclones in a multimodel ensemble for eastern North America and the western Atlantic Ocean, Weather Forecast., 33, 109–127, https://doi.org/10.1175/WAF-D-17-0036.1, 2018. a
Lavaysse, C., Flamant, C., Janicot, S., Parker, D. J., Lafore, J. P., Sultan, B., and Pelon, J.: Seasonal evolution of the West African heat low: a climatological perspective, Clim. Dynam., 33, 313–330, https://doi.org/10.1007/s00382-009-0553-4, 2009a. a
Lavaysse, C., Flamant, C., Janicot, S., Parker, D. J., Lafore, J.-P., Sultan, B., and Pelon, J.: Seasonal evolution of the West African heat low: a climatological perspective, Clim. Dynam., 33, 313–330, https://doi.org/10.1007/s00382-009-0553-4, 2009b. a
Leutbecher, M. and Palmer, T. N.: Ensemble forecasting, J. Comput. Phys., 227, 3515–3539, https://doi.org/10.1016/j.jcp.2007.02.014, 2008. a
Li, W., Wang, Z., and Peng, M. S.: Evaluating tropical cyclone forecasts from the NCEP Global Ensemble Forecasting System (GEFS) reforecast version 2, Weather Forecast., 31, 895–916, https://doi.org/10.1175/WAF-D-15-0176.1, 2016. a
Ling, G., Afargan-Gerstman, H., and Armon, M.: Predictability of cyclones associated with heavy precipitation events in the Sahara, Zenodo [code], https://doi.org/10.5281/zenodo.19557134, 2026. a
Maranan, M., Fink, A. H., Knippertz, P., Francis, S. D., Akpo, A. B., Jegede, G., and Yorke, C.: Interactions between convection and a moist vortex associated with an extreme rainfall event over southern West Africa, Mon. Weather Rev., 147, 2309–2328, https://doi.org/10.1175/MWR-D-18-0396.1, 2019. a
Martius, O., Schwierz, C., and Davies, H.: Far-upstream precursors of heavy precipitation events on the Alpine south-side, Q. J. Roy. Meteor. Soc., 134, 417–428, 2008. a
Mason, B. J.: Numerical weather prediction, Contemp. Phys., 27, 463–472, https://doi.org/10.1080/00107518608211024, 1986. a
Middleton, N. J. and Thomas, D. S. G.: World Atlas of Desertification, Edward Arnold, London, https://doi.org/10.1002/ldr.3400030407, 1992. a
Moawad, M. B., Abdel Aziz, A. O., and Mamtimin, B.: Flash floods in the Sahara: a case study for the 28 January 2013 flood in Qena, Egypt, Geomat. Nat. Haz. Risk, 7, 215–236, https://doi.org/10.1080/19475705.2014.885467, 2016. a
Morin, E., Marra, F., and Armon, M.: Dryland precipitation climatology from satellite observations, in: Satellite Precipitation Measurement: Volume 2, edited by: Levizzani, V., Kidd, C., Kirschbaum, D. B., Kummerow, C. D., Nakamura, K., and Turk, F. J., Vol. 69 of Advances in Global Change Research, Springer International Publishing, Cham, https://doi.org/10.1007/978-3-030-35798-6_19, 843–859, 2020. a, b
Neu, U., Akperov, M. G., Bellenbaum, N., Benestad, R., Blender, R., Caballero, R., Cocozza, A., Dacre, H. F., Feng, Y., Fraedrich, K., Grieger, J., Gulev, S., Hanley, J., Hewson, T., Inatsu, M., Keay, K., Kew, S. F., Kindem, I., Leckebusch, G. C., Liberato, M. L. R., Lionello, P., Mokhov, I. I., Pinto, J. G., Raible, C. C., Reale, M., Rudeva, I., Schuster, M., Simmonds, I., Sinclair, M., Sprenger, M., Tilinina, N. D., Trigo, I. F., Ulbrich, S., Ulbrich, U., Wang, X. L., and Wernli, H.: IMILAST: a community effort to intercompare extratropical cyclone detection and tracking algorithms, B. Am. Meteorol. Soc., 94, 529–547, https://doi.org/10.1175/BAMS-D-11-00154.1, 2013. a
Ngoungue Langue, C. G., Lavaysse, C., Vrac, M., Peyrillé, P., and Flamant, C.: Seasonal forecasts of the Saharan heat low characteristics: a multi-model assessment, Weather Clim. Dynam., 2, 893–912, https://doi.org/10.5194/wcd-2-893-2021, 2021. a
Nicholson, S. E.: Rainfall and atmospheric circulation during drought periods and wetter years in West Africa, Mon. Weather Rev., 109, 2191–2208, https://doi.org/10.1175/1520-0493(1981)109<2191:RAACDD>2.0.CO;2, 1981. a
Nicholson, S. E.: The nature of rainfall variability over Africa on time scales of decades to millenia, Global Planet. Change, 26, 137–158, https://doi.org/10.1016/S0921-8181(00)00040-0, 2000. a
Palmer, T.: The primacy of doubt: evolution of numerical weather prediction from determinism to probability, J. Adv. Model. Earth Sy., 9, 730–734, https://doi.org/10.1002/2017MS000999, 2017. a
Peyrillé, P., Lafore, J.-P., and Redelsperger, J.-L.: An idealized two-dimensional framework to study the West African Monsoon. Part I: Validation and key controlling factors, J. Atmos. Sci., 64, 2765–2782, https://doi.org/10.1175/JAS3919.1, 2007. a
Pfahl, S. and Wernli, H.: Quantifying the relevance of cyclones for precipitation extremes, J. Climate, 25, 6770–6780, https://doi.org/10.1175/JCLI-D-11-00705.1, 2012. a
Prestel-Kupferer, I., Riemer, M., Schmidt, S., and Teubler, F.: Predictability of midlatitude Rossby-wave packets, Q. J. Roy. Meteor. Soc., 150, 5057–5073, 2024. a, b
Rex, D. F.: Blocking action in the middle troposphere and its effect upon regional climate, Tellus, 2, 275–301, https://doi.org/10.3402/tellusa.v2i4.8603, 1950. a
Rieder, J. C., Aemisegger, F., Dente, E., and Armon, M.: Meteorological ingredients of heavy precipitation and subsequent lake-filling episodes in the northwestern Sahara, Hydrol. Earth Syst. Sci., 29, 1395–1427, https://doi.org/10.5194/hess-29-1395-2025, 2025. a, b
Rinat, Y., Marra, F., Armon, M., Metzger, A., Levi, Y., Khain, P., Vadislavsky, E., Rosensaft, M., and Morin, E.: Hydrometeorological analysis and forecasting of a 3 d flash-flood-triggering desert rainstorm, Nat. Hazards Earth Syst. Sci., 21, 917–939, https://doi.org/10.5194/nhess-21-917-2021, 2021. a
Rodwell, M. J., Richardson, D. S., Parsons, D. B., and Wernli, H.: Flow-dependent reliability: a path to more skillful ensemble forecasts, B. Am. Meteorol. Soc., 99, 1015–1026, 2018. a, b
Roebber, P. J.: Visualizing multiple measures of forecast quality, Weather Forecast., 24, 601–608, https://doi.org/10.1175/2008WAF2222159.1, 2009. a
Rubin, S., Ziv, B., and Paldor, N.: Tropical plumes over eastern North Africa as a source of rain in the Middle East, Mon. Weather Rev., 135, 4135–4148, https://doi.org/10.1175/2007MWR1919.1, 2007. a
Rudeva, I., Gulev, S. K., Simmonds, I., and Tilinina, N.: The sensitivity of characteristics of cyclone activity to identification procedures in tracking algorithms, Tellus A, 66, 24961, https://doi.org/10.3402/tellusa.v66.24961, 2014. a
Rupp, P., Spaeth, J., Afargan-Gerstman, H., Büeler, D., Sprenger, M., and Birner, T.: The impact of synoptic storm likelihood on European subseasonal forecast uncertainty and their modulation by the stratosphere, Weather Clim. Dynam., 5, 1287–1298, https://doi.org/10.5194/wcd-5-1287-2024, 2024. a
Russell, J. O. and Aiyyer, A.: The potential vorticity structure and dynamics of African easterly waves, J. Atmos. Sci., 77, 871–890, https://doi.org/10.1175/JAS-D-19-0019.1, 2020. a
Sánchez, C., Methven, J., Gray, S., and Cullen, M.: Linking rapid forecast error growth to diabatic processes, Q. J. Roy. Meteor. Soc., 146, 3548–3569, 2020. a
Schepanski, K., Wright, T. J., and Knippertz, P.: Evidence for flash floods over deserts from loss of coherence in InSAR imagery, J. Geophys. Res.-Atmos., 117, 1–10, https://doi.org/10.1029/2012JD017580, 2012. a
Sharon, D.: The spottiness of rainfall in a desert area, J. Hydrol., 17, 161–175, https://doi.org/10.1016/0022-1694(72)90002-9, 1972. a
Skinner, C. B. and Poulsen, C. J.: The role of fall season tropical plumes in enhancing Saharan rainfall during the African Humid Period, Geophys. Res. Lett., 43, 349–358, https://doi.org/10.1002/2015GL066318, 2016. a
Slingo, J. and Palmer, T.: Uncertainty in weather and climate prediction, Philos. T. Roy. Soc. A, 369, 4751–4767, https://doi.org/10.1098/rsta.2011.0161, 2011. a
Spaeth, J., Rupp, P., Osman, M., Grams, C., and Birner, T.: Flow-dependence of ensemble spread of subseasonal forecasts explored via North Atlantic-European weather regimes, Geophys. Res. Lett., 51, e2024GL109733, https://doi.org/10.1029/2024GL109733, 2024. a
Sprenger, M., Fragkoulidis, G., Binder, H., Croci-Maspoli, M., Graf, P., Grams, C. M., Knippertz, P., Madonna, E., Schemm, S., Škerlak, B., and Wernli, H.: Global climatologies of Eulerian and Lagrangian flow features based on ERA-Interim, B. Am. Meteorol. Soc., 98, 1739–1748, https://doi.org/10.1175/BAMS-D-15-00299.1, 2017. a, b
Stan, C., Zheng, C., Chang, E. K.-M., Domeisen, D. I. V., Garfinkel, C. I., Jenney, A. M., Kim, H., Lim, Y.-K., Lin, H., Robertson, A., Schwartz, C., Vitart, F., Wang, J., and Yadav, P.: Advances in the prediction of MJO teleconnections in the S2S forecast systems, B. Am. Meteorol. Soc., 103, E1426–E1447, https://doi.org/10.1175/BAMS-D-21-0130.1, 2022. a
Stephenson, D. B., Casati, B., Ferro, C. A. T., and Wilson, C. A.: The extreme dependency score: a non-vanishing measure for forecasts of rare events, Meteorol. Appl., 15, 41–50, https://doi.org/10.1002/met.53, 2008. a
Tamarin-Brodsky, T. and Harnik, N.: The relation between Rossby wave-breaking events and low-level weather systems, Weather Clim. Dynam., 5, 87–108, https://doi.org/10.5194/wcd-5-87-2024, 2024. a
Trzeciak, T. M., Garcia-Carreras, L., and Marsham, J. H.: Cross-Saharan transport of water vapor via recycled cold pool outflows from moist convection, Geophys. Res. Lett., 44, 1554–1563, https://doi.org/10.1002/2016GL072108, 2017. a
Tsvieli, Y. and Zangvil, A.: Synoptic climatological analysis of “wet” and “dry” Red Sea troughs over Israel, Int. J. Climatol., 25, 1997–2016, https://doi.org/10.1002/joc.1232, 2005. a
Tucker, C. J., Dregne, H. E., and Newcomb, W. W.: Expansion and contraction of the Sahara Desert from 1980 to 1990, Science, 253, 299–301, https://doi.org/10.1126/science.253.5017.299, 1991. a
Vitart, F., Ardilouze, C., Bonet, A., Brookshaw, A., Chen, M., Codorean, C., Déqué, M., Ferranti, L., Fucile, E., Fuentes, M., Hendon, H., Hodgson, J., Kang, H.-S., Kumar, A., Lin, H., Liu, G., Liu, X., Malguzzi, P., Mallas, I., Manoussakis, M., Mastrangelo, D., MacLachlan, C., McLean, P., Minami, A., Mladek, R., Nakazawa, T., Najm, S., Nie, Y., Rixen, M., Robertson, A. W., Ruti, P., Sun, C., Takaya, Y., Tolstykh, M., Venuti, F., Waliser, D., Woolnough, S., Wu, T., Won, D.-J., Xiao, H., Zaripov, R., and Zhang, L.: The subseasonal to seasonal (S2S) prediction project database, B. Am. Meteorol. Soc., 98, 163–173, https://doi.org/10.1175/BAMS-D-16-0017.1, 2017. a
Wernli, H. and Schwierz, C.: Surface cyclones in the ERA-40 dataset (1958–2001). Part I: Novel identification method and global climatology, J. Atmos. Sci., 63, 2486–2507, https://doi.org/10.1175/JAS3766.1, 2006. a
Wirth, V. and Eichhorn, J.: Long-lived Rossby wave trains as precursors to strong winter cyclones over Europe, Q. J. Roy. Meteor. Soc., 140, 729–737, 2014. a
Wirth, V., Riemer, M., Chang, E. K., and Martius, O.: Rossby wave packets on the midlatitude waveguide – a review, Mon. Weather Rev., 146, 1965–2001, 2018. a
Yin, J., Gao, Y., Chen, R., Yu, D., Wilby, R., Wright, N., Ge, Y., Bricker, J., Gong, H., and Guan, M.: Flash floods: why are more of them devastating the world's driest regions?, Nature, 615, 212–215, https://doi.org/10.1038/d41586-023-00626-9, 2023. a
Yokochi, R., Ram, R., Zappala, J. C., Jiang, W., Adar, E., Bernier, R., Burg, A., Dayan, U., Lu, Z.-T., Mueller, P., Purtschert, R., and Yechieli, Y.: Radiokrypton unveils dual moisture sources of a deep desert aquifer, P. Natl. Acad. Sci. USA, 116, 201904260, https://doi.org/10.1073/pnas.1904260116, 2019. a
Zhang, F., Sun, Y. Q., Magnusson, L., Buizza, R., Lin, S.-J., Chen, J.-H., and Emanuel, K.: What is the predictability limit of midlatitude weather?, J. Atmos. Sci., 76, 1077–1091, https://doi.org/10.1175/JAS-D-18-0269.1, 2019. a
Zheng, C., Chang, E. K.-M., Kim, H., Zhang, M., and Wang, W.: Subseasonal to seasonal prediction of wintertime Northern Hemisphere extratropical cyclone activity by S2S and NMME models, J. Geophys. Res.-Atmos., 124, 12057–12077, https://doi.org/10.1029/2019JD031252, 2019. a, b
Zheng, M., Chang, E. K., and Colle, B. A.: Ensemble sensitivity tools for assessing extratropical cyclone intensity and track predictability, Weather Forecast., 28, 1133–1156, 2013. a
Ziv, B., Saaroni, H., Etkin, A., Harpaz, T., and Shendrik, L.: Formation of cyclones over the East Mediterranean within Red-Sea Troughs, Int. J. Climatol., 42, 577–596, https://doi.org/10.1002/joc.7261, 2022. a