
the Creative Commons Attribution 4.0 License.
the Creative Commons Attribution 4.0 License.
 | 06 Jul 2026
Distinct bias structures for extratropical cyclones with strong or weak diabatic heating
Clemens Spensberger
Linus Magnusson
Thomas Spengler
The development of extratropical cyclones (ETCs) is often significantly altered by diabatic processes, yet the representation of these processes in numerical weather prediction models has been shown to lead to significant forecast biases. To provide a systematic quantification of 12-h ETC forecast errors, this study uses a cyclone-centred composite framework for North Atlantic wintertime (DJF) ETCs using the ERA5 reanalysis for the period 1979 to 2022. Cyclones are categorised into strong and weak diabatic heating at the time of their maximum intensification based on the domain-averaged 70th and 30th percentiles of vertically integrated diabatic heating.
While both groups exhibit a systematic underestimation of cyclone intensity, the error structures are markedly distinct. The weak heating group is characterised by an intensity underestimation near the cyclone core, whereas the strong heating group features a pronounced southwestward displacement bias together with a domain-wide intensity underestimation.
After removing the displacement bias, the strong heating group exhibits distinct structural errors. In the warm sector, a clear underestimation of moisture transport and temperature, combined with an underdeveloped upper-level ridge, indicates a mis-representation of the intense moisture transport pathways and associated warm-sector moist processes. Conversely, in the cold sector, low-level winds are overestimated within the cold conveyor belt (CCB), sting jet (SJ), and dry intrusion (DI) regions. The wind field biases are accompanied by a pronounced overestimation of 850 hPa kinematic frontogenesis near the centre. The strong frontogenesis is associated with an enhanced secondary circulation and vertical velocity, yielding the overestimation of total column liquid water observed along the bent-back warm front. In contrast, cyclones in the weak heating group exhibit an underestimation of wind speed and moisture near the centre, consistent with the near-centre intensity underestimation. Overall, our findings demonstrate the critical impact of diabatic heating on structural forecast biases, highlighting that the representation of moist processes and the interaction with atmospheric dynamics through diabatic processes is a key area for future model developments.
- Article
(8976 KB) - Full-text XML
-
Supplement
(1754 KB) - BibTeX
- EndNote


Extratropical cyclones (ETCs) represent a fundamental component of mid-latitude weather, contributing substantially to the global energy balance through the poleward transport of heat (Holton and Hakim, 2013) as well as being the main cause of extreme wind and precipitation events, yielding significant socio-economic losses (Pinto et al., 2012; Catto and Pfahl, 2013). The intensity and detailed structure of ETCs, particularly for extreme cases, are closely linked to diabatic processes, predominantly related to latent heat release associated with phase changes (e.g., Robertson and Smith, 1983; Vaughan et al., 2015; Joos and Forbes, 2016). Consequently, the representation of these physical processes through parameterisations in numerical weather prediction (NWP) models remains a key source of forecast errors and biases (Davies and Didone, 2013; Martínez-Alvarado et al., 2014b, 2016; Baumgart et al., 2018; Grams et al., 2018; Wimmer et al., 2022). Unsurprisingly, diabatic heating has thus been identified as a major contributor to forecast deficiencies for ETCs (Wernli and Gray, 2024; Sánchez et al., 2020). However, we still lack a systematic understanding how diabatic heating influences structural NWP errors for cyclones. Hence, we employ cyclone-centred composites to contrast NWP biases and errors in ETC cases categorised by strong versus weak diabatic heating.
The well-known forecast failures of severe storms, such as the QE II storm (1978) and the President's Day storm (1979), served as a wake-up call for extensive research into the role of diabatic processes in cyclone evolution (Gyakum, 1983; Bosart, 1981). Subsequent investigations rapidly established that latent heat release associated with moist processes is vital to simulate realistic cyclone development, demonstrating the capacity of latent heating to significantly intensify cyclones and fundamentally modify frontal structures (Davis et al., 1993; Balasubramanian and Yau, 1994; Binder et al., 2016; Joos and Forbes, 2016). Specifically, diabatic heating can modify key substructures, such as Warm Conveyor Belts (WCBs) and Cold Conveyor Belts (CCBs). While diabatic heating along WCBs can modify upper-tropospheric Potential Vorticity (PV) and thus the larger-scale flow (Wernli, 1997; Harvey et al., 2020; Oertel et al., 2020), diabatic heating in CCBs is related to the maintenance of frontal precipitation and the cloud structure in the cyclone core (Browning, 1990; Schultz, 2001; Martínez-Alvarado et al., 2014a). Furthermore, the descent of dry intrusions (DIs) over the relatively moist low-level flow enhances surface turbulent heat fluxes. This process reduces the static stability of the boundary layer on the cyclone's cold side and further modifies the CCB structure (Raveh-Rubin, 2017). Given the profound influence on both the intensity and structural details of ETCs, a systematic analysis focusing on the impact of diabatic heating on the structural representation of extratropical cyclones in NWP models is therefore essential.
Accurately representing diabatic heating and associated moist processes remains a challenge for numerical weather prediction (NWP) models. Forbes (2008) demonstrated that underestimating specific diabatic processes within frontal zones can lead to significant forecast errors. Furthermore, sensitivity experiments have shown that differences in microphysics schemes directly impact the forecast accuracy of cyclone structure and intensity (Martínez-Alvarado and Plant, 2014; Joos and Forbes, 2016; Crezee et al., 2017). As demonstrated by Gray et al. (2014), Pfahl et al. (2015), and Binder et al. (2020), the erroneous representation of latent heat release within these models not only degrades local weather predictions, but also negatively impacts the downstream evolution of meso- and synoptic-scale flows. However, because these previous findings mainly rely on case studies or sensitivity experiments, a systematic understanding of how diabatic heating impacts the forecast errors of ETCs is still lacking.
Given the aforementioned systematic biases in ETCs forecasts, we extend the study by Yu et al. (2025) by employing a cyclone-centred composite framework to quantify short-term (12-h) forecast biases for wintertime maritime ETCs categorised into strong and weak diabatic heating. We select the 12-h forecast lead time, as error growth during this initial period is predominantly dominated by diabatic processes (Baumgart et al., 2019), making a comparison with the respective analysis highly effective in isolating “fast-physics” errors in NWP models (Xie et al., 2012; Klocke and Rodwell, 2014). We focus on wintertime maritime ETCs, as their intensification and structural evolution are critically influenced by diabatic processes (Hoskins and Hodges, 2002; Joos and Forbes, 2016). By applying a composite approach, we provide a statistically aggregated view of how different diabatic conditions yield systematic structures in forecast biases. The objective of this study is to identify the link between the intensity of diabatic heating and 12-h ETC forecast biases to guide future model improvements.
2.1 Data and variables
We perform our analysis over the North Atlantic using the European Centre for Medium Range Weather Forecasting (ECMWF) ERA5 reanalysis for the period from 1979 to 2022 at a spatial resolution of 0.5° × 0.5° for DJF (December, January, February) (Hersbach et al., 2020). Following Yu et al. (2025), we calculate 12-h forecast errors using the analyses and respective 12-h forecasts. Specifically, the forecast data utilised here serve as the background fields (first-guess trajectories) for the ERA5 4D-Var data assimilation. We select the short-range forecasts initialised at 06:00 and 18:00 UTC because they provide the background for the subsequent 09:00–21:00 and 21:00–09:00 UTC assimilation windows, respectively, ensuring close consistency between the forecasts and analyses. Such close consistency is desirable, as the differences between these internally coupled forecasts and analyses can serve as a robust indicator of the model's physical realism (Rodwell and Palmer, 2007). Note that conditioning the verification on analysis-defined cases can introduce a selection bias. This selection bias is minimised by choosing a 12-h lead time, though we acknowledge that the challenge to disentangle the signal from this bias.
We use mean sea level pressure (MSLP), temperature at 850 hPa, wind at 925 hPa, total column water vapour (TCWV), total column liquid water (TCLW), total column ice water (TCIW), water vapour flux (WVF), and potential vorticity (PV) as well as geopotential height at 300 hPa. In addition, to evaluate the low-level circulation and frontal dynamics, we compute tangential and radial wind components at 925 hPa relative to the cyclone centre, as well as kinematic frontogenesis at 850 hPa (e.g., Miller, 1948)
where θ is potential temperature, and (u,v) are the horizontal wind components.
2.2 Cyclone detection and tracking
ETCs are detected and tracked using the algorithm based on Murray and Simmonds (1991a, b), as implemented and refined by Spensberger and Marcheggiani (2024) and Marcheggiani et al. (2025) (algorithm is publicly available as part of dynlib, Spensberger, 2024). We identify cyclones as local maxima in the Laplacian of the analysis MSLP field and track them over time using a nearest-neighbour approach combined with the most probable propagation direction. In addition, we apply several criteria to filter out non-developing and spurious systems: tracks must have a minimum lifetime of 24 h and travel a minimum distance of 500 km during their lifetime over the North Atlantic region (30–68° N, 80° W–12° E). All tracked cyclone centres are required to be identified as a closed system at least once within their lifetime, in line with Murray and Simmonds (1991a, b). Specifically, the cyclone centre must be enclosed by at least one closed isobar, ensuring the feature develops into a distinct low-pressure system rather than an open trough. After applying these criteria, a total of 2667 cyclone positions are retained. Our subsequent composite analysis focuses on the timestep of maximum intensification, defined as the most rapid decrease in central sea level pressure. Given that our analysis is based on 06:00 or 18:00 UTC, we chose the analysis time closest to the timestep of maximum intensification. Other timesteps, such as genesis or maximum intensity, feature similar but weaker patterns (see Fig. S1 in the Supplement).
2.3 Compositing based on vertically integrated diabatic heating
To classify ETCs into strong and weak diabatic categories, we use the diabatic temperature tendencies derived from the ERA5 short-term forecasts. Following Tsopouridis et al. (2021b) and Weijenborg and Spengler (2020), these tendencies are accumulated over a ±3-h around the respective timesteps. Specifically, we take the diabatic temperature tendency due to physical parameterisations (originally on model levels and interpolated to pressure levels) and subtract the radiative diabatic tendencies. Following Papritz and Spengler (2015), radiation is excluded because it acts as a slow background cooling.
We vertically integrate the diabatic heating over the 700–300 hPa layer and then average it within a 750 km radius around the cyclone centre at the time of maximum intensification (similar to Tsopouridis et al., 2021a). By focusing on the free troposphere, the direct diabatic influence of the lower tropopause/boundary layer (typically below 700 hPa) is excluded.
Cyclones with the heating above the 70th percentile are classified as strong heating (red shading in Fig. 1a), while cyclones below the 30th percentile are classified as weak heating (blue shading in Fig. 1a). Note that maximum intensification of strong heating cyclones predominantly occurs at lower latitudes, often located around the SST front regions along the Gulf Stream, whereas weak heating cyclones occur more frequently at higher latitudes (Fig. 1b). Although our classification method is for the free troposphere (700–300 hPa), this distinct latitudinal distribution demonstrates the indirect role of the lower troposphere/boundary layer. More surface sensible and latent heat fluxes over higher SST provide favourable conditions for the strong heating cyclones. To ensure that the presented bias patterns are related to diabatic heating rather than latitudinal differences, we also analysed cyclones restricted to a latitudinal band between 45–55° N. As the results are qualitatively the same (not shown), we perform our analysis on all cyclones in the Atlantic.
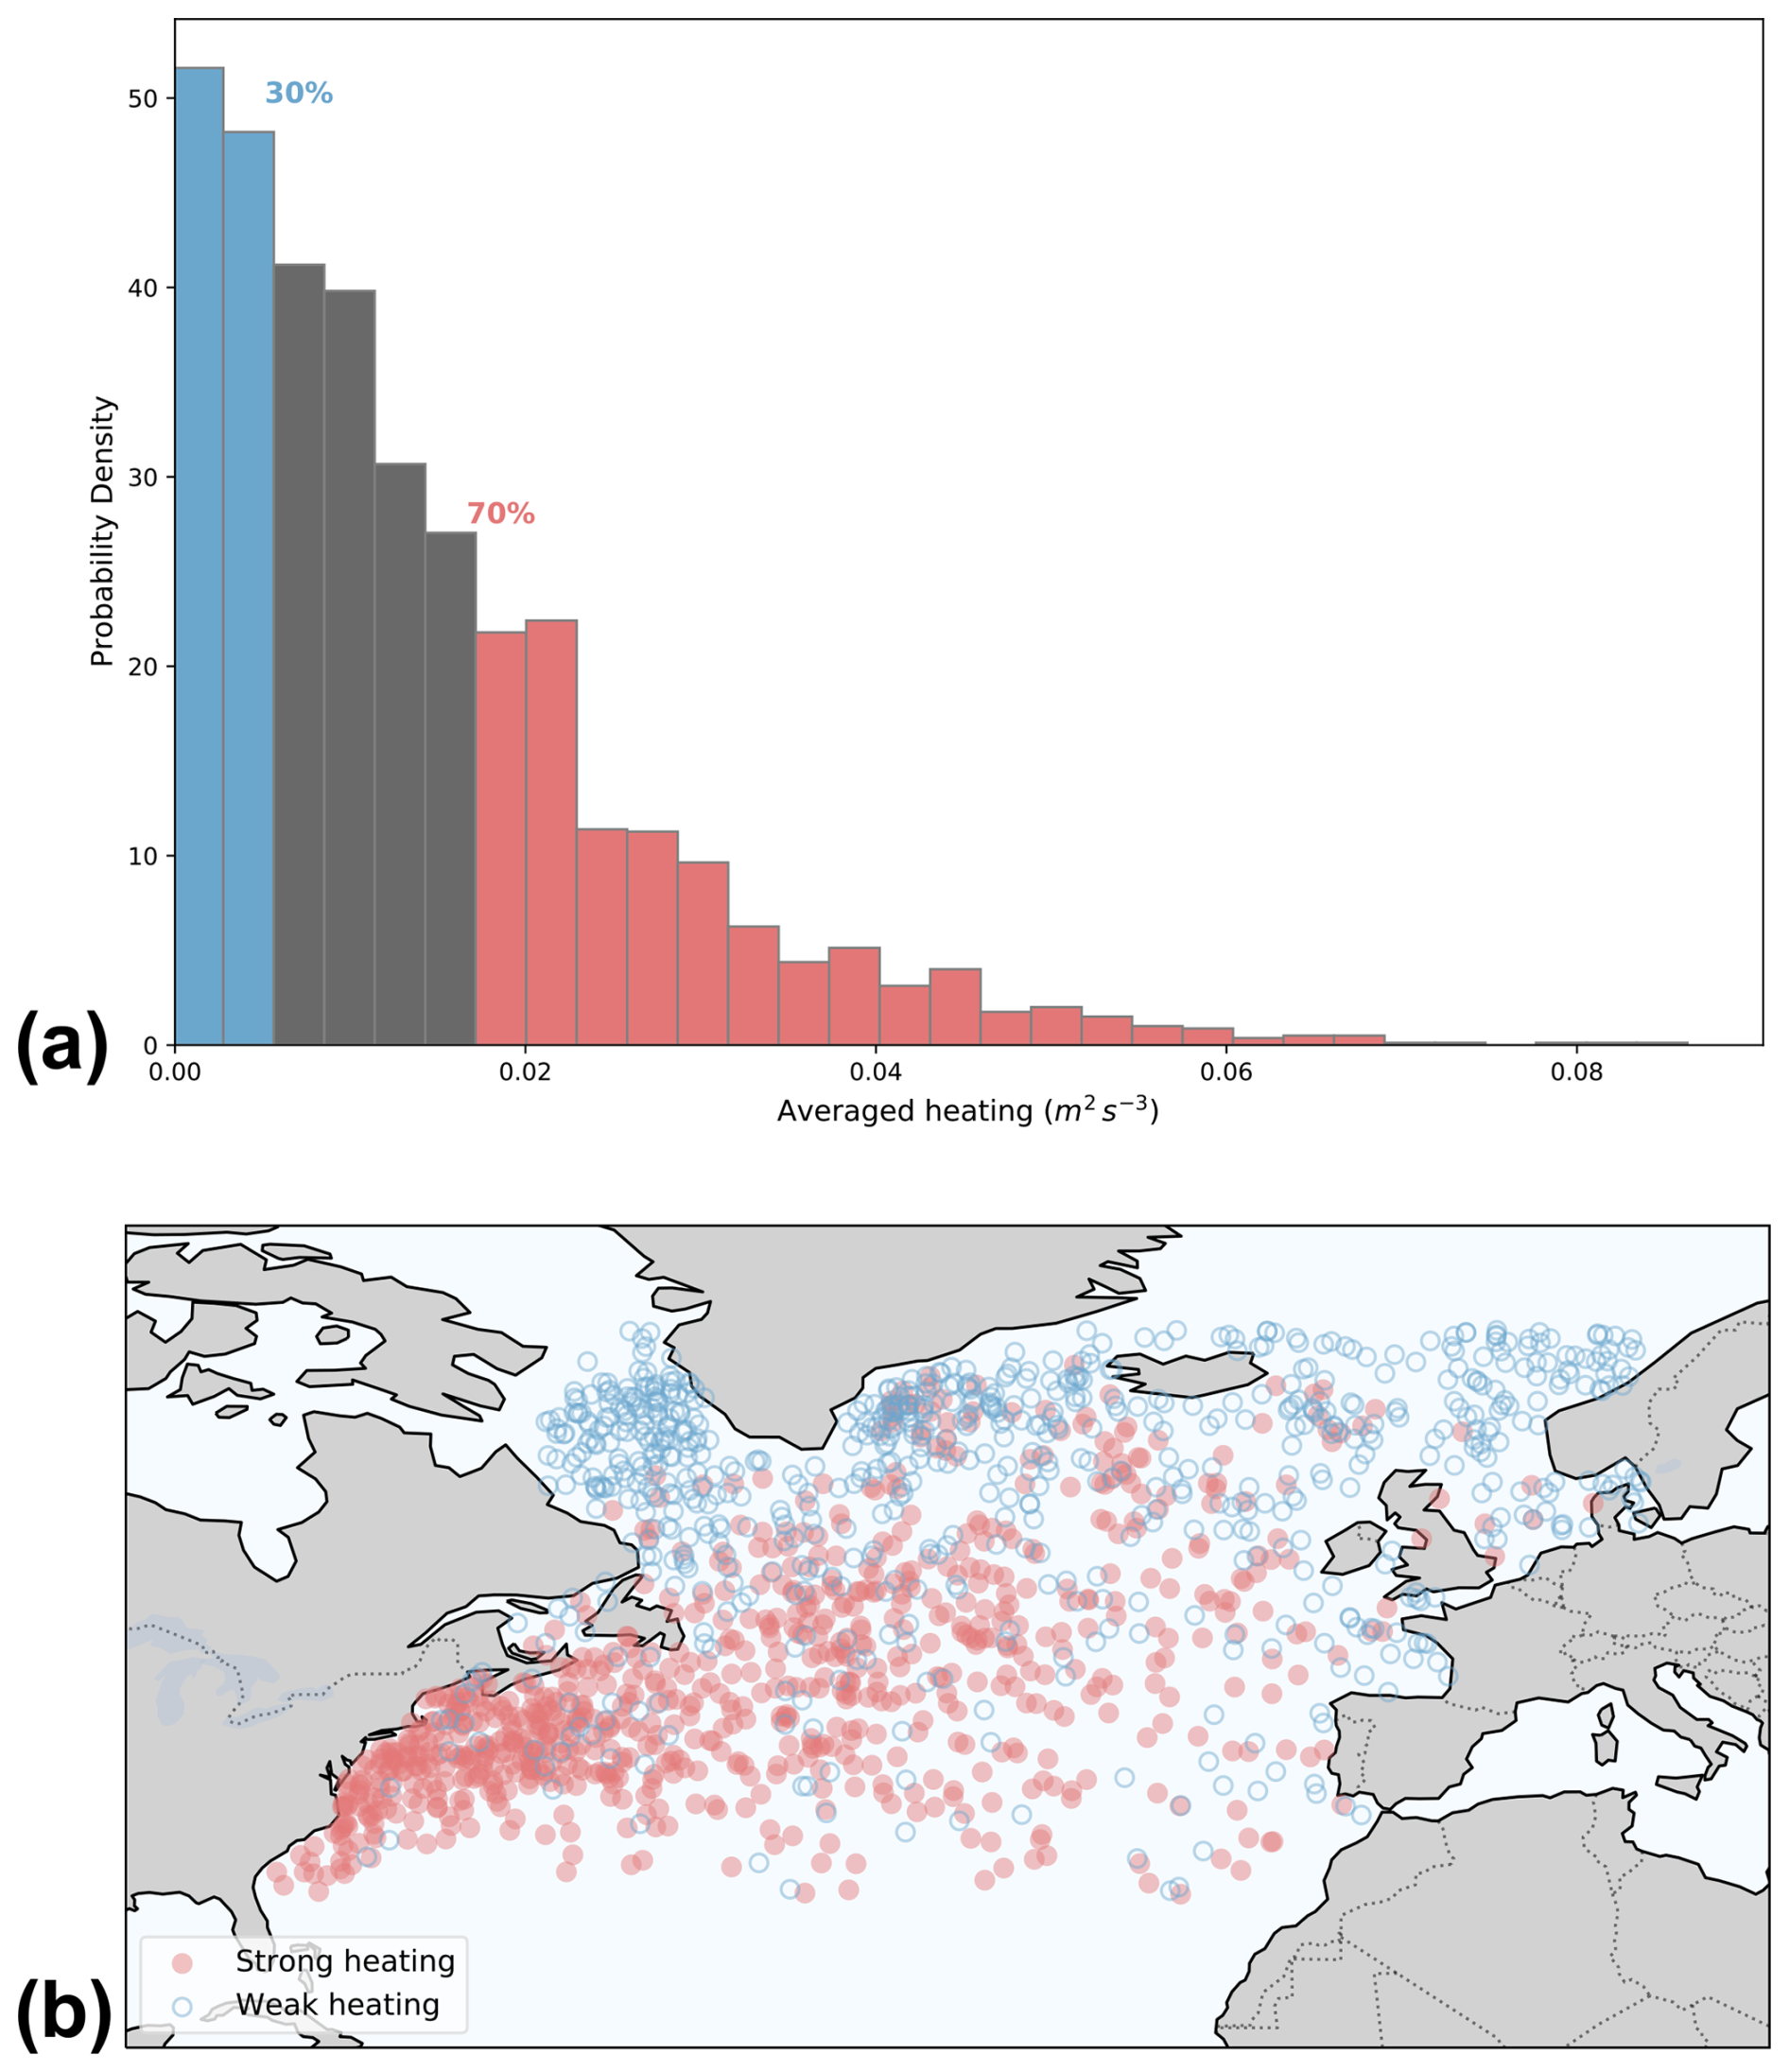
Figure 1(a) Probability density function of the vertical integral of diabatic heating (excluding radiation) averaged over the horizontal extent of the cyclone (m2 s−3) at maximum intensification, and (b) geographical distribution of cyclone centres for the strong and weak heating groups at maximum intensification.
We analyse cyclone forecast biases at maximum intensification using cyclone-relative composites for the two heating categories. Following Catto et al. (2010), cyclone-relative composites were calculated by averaging over all cyclones. During this procedure, all fields are rotated to align the propagation direction of each cyclone along the x axis. As individual cyclones move in diverse directions, this rotation is essential to prevent misalignment of features, such as warm and cold fronts, that would then be smoothed out during the averaging process.
2.4 Re-aligning cyclone centres
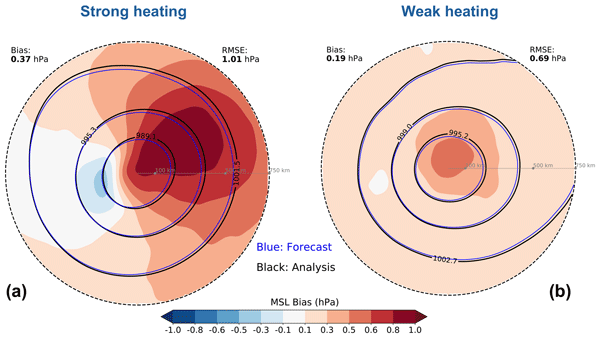
The thus derived composites illustrate why we chose to include one additional step in the analysis method (Fig. 2). Cyclone-centred error composites for both weak and strong heating show a systematic underestimation of intensity, with forecasted MSLP contours (blue contours) having a smaller radius compared to the analysis (black contours, Fig. 2a, b). For weak heating, this intensity underestimation is also clearly depicted by the positive MSLP bias (shading, Fig. 2b) and the corresponding negative bias in the 925 hPa wind around the cyclone centre (Fig. 2d).
For strong heating, however, the MSLP bias features a pronounced dipole pattern (Fig. 2a), attributable to a southwestward displacement of the forecasted cyclone, implying a too slow propagation of the cyclone in the forecast. This positional bias is supported by the strong dipole pattern observed in the 925 hPa wind field near the centre (Fig. 2c). This bias is consistent with intense diabatic heating accelerating cyclones (Stoelinga, 1996; Coronel et al., 2015). The combined bias in both intensity and propagation is also congruent with the ECMWF model generally forecasting too shallow and too slow cyclones in the Northern Hemisphere winter (Froude et al., 2007). While the forecast bias for weak heating is predominantly associated with an underestimation of intensity, a slight southwestward displacement is also evident.
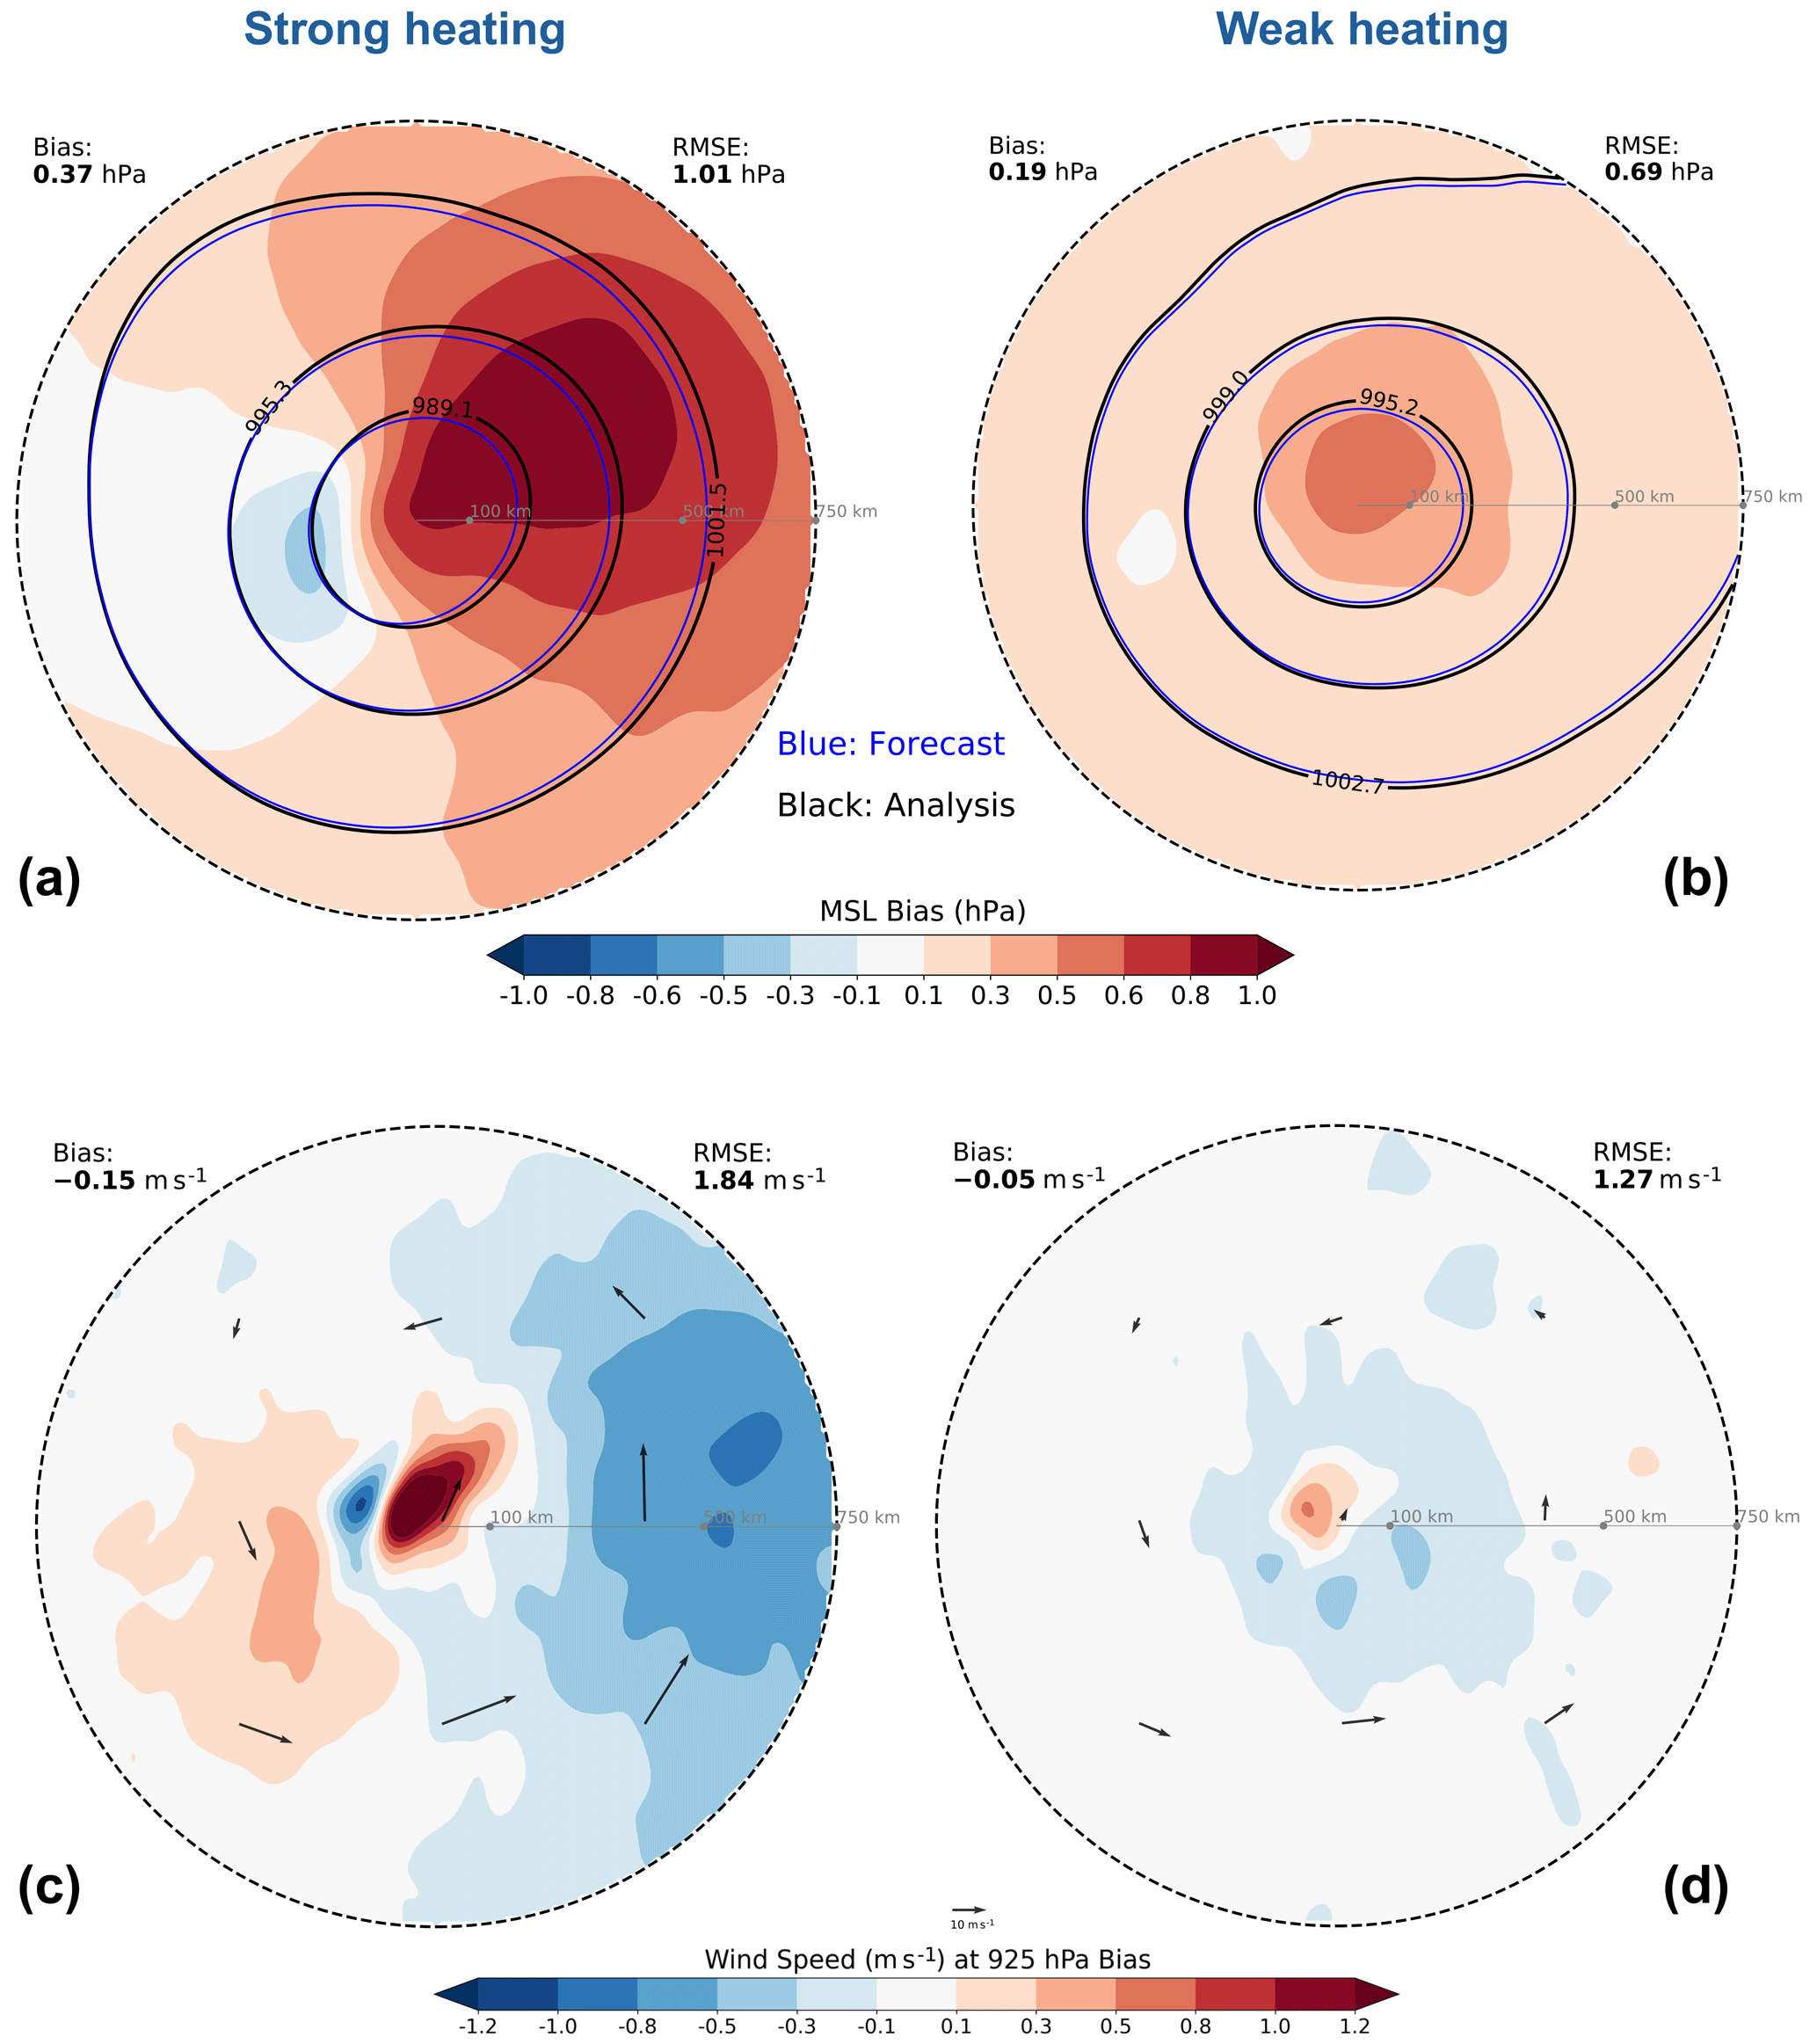
Figure 2Biases for (a, c) strong heating group and (b, d) weak heating group: (a, b) mean sea level pressure (MSLP) (hPa) bias composite (shading), analysis composite (black contours), forecast composite (blue contours) and (c, d) wind speed bias (m s−1) at 925 hPa (shading), black (blue) quivers show analysis (forecast) wind composite.
To focus on cyclone-centre-relative errors, we remove the aforementioned positional bias by redefining the respective cyclone centres in both analysis and forecast as the location of the nearest minimum in MSLP compared to the originally detected cyclone centre in the analysis. Analogous to the tracking, the MSLP field is spatially filtered using spectral triangular truncation (T84). This filtering procedure effectively filters out small-scale noise. We require that the identified MSLP minima in both the analysis and forecast must be within a 250 km radius of the originally detected centre in the analysis. Any cyclone record failing this criterion is discarded.
The “strong” and “weak” heating groups, defined as the top and bottom 30 % of the diabatic heating distribution, initially comprise 801 and 799 cyclones, respectively. After this filtering and re-centring, a total of 774 and 627 analysis-forecast pairs are retained for the strong and weak heating group, respectively. A smaller proportion of strong heating cyclones is filtered out, which physically reflects that their kinematic centres and MSLP minima are more consistently co-located. We use the recentred data for analysis and forecast to compile our cyclone-centred composite analysis. Given that both analysis and forecast are now centred on the position of minimum MSLP, the positional bias in the composites has been removed (compare Figs. 2 and 3).
3.1 MSLP and 925 hPa wind
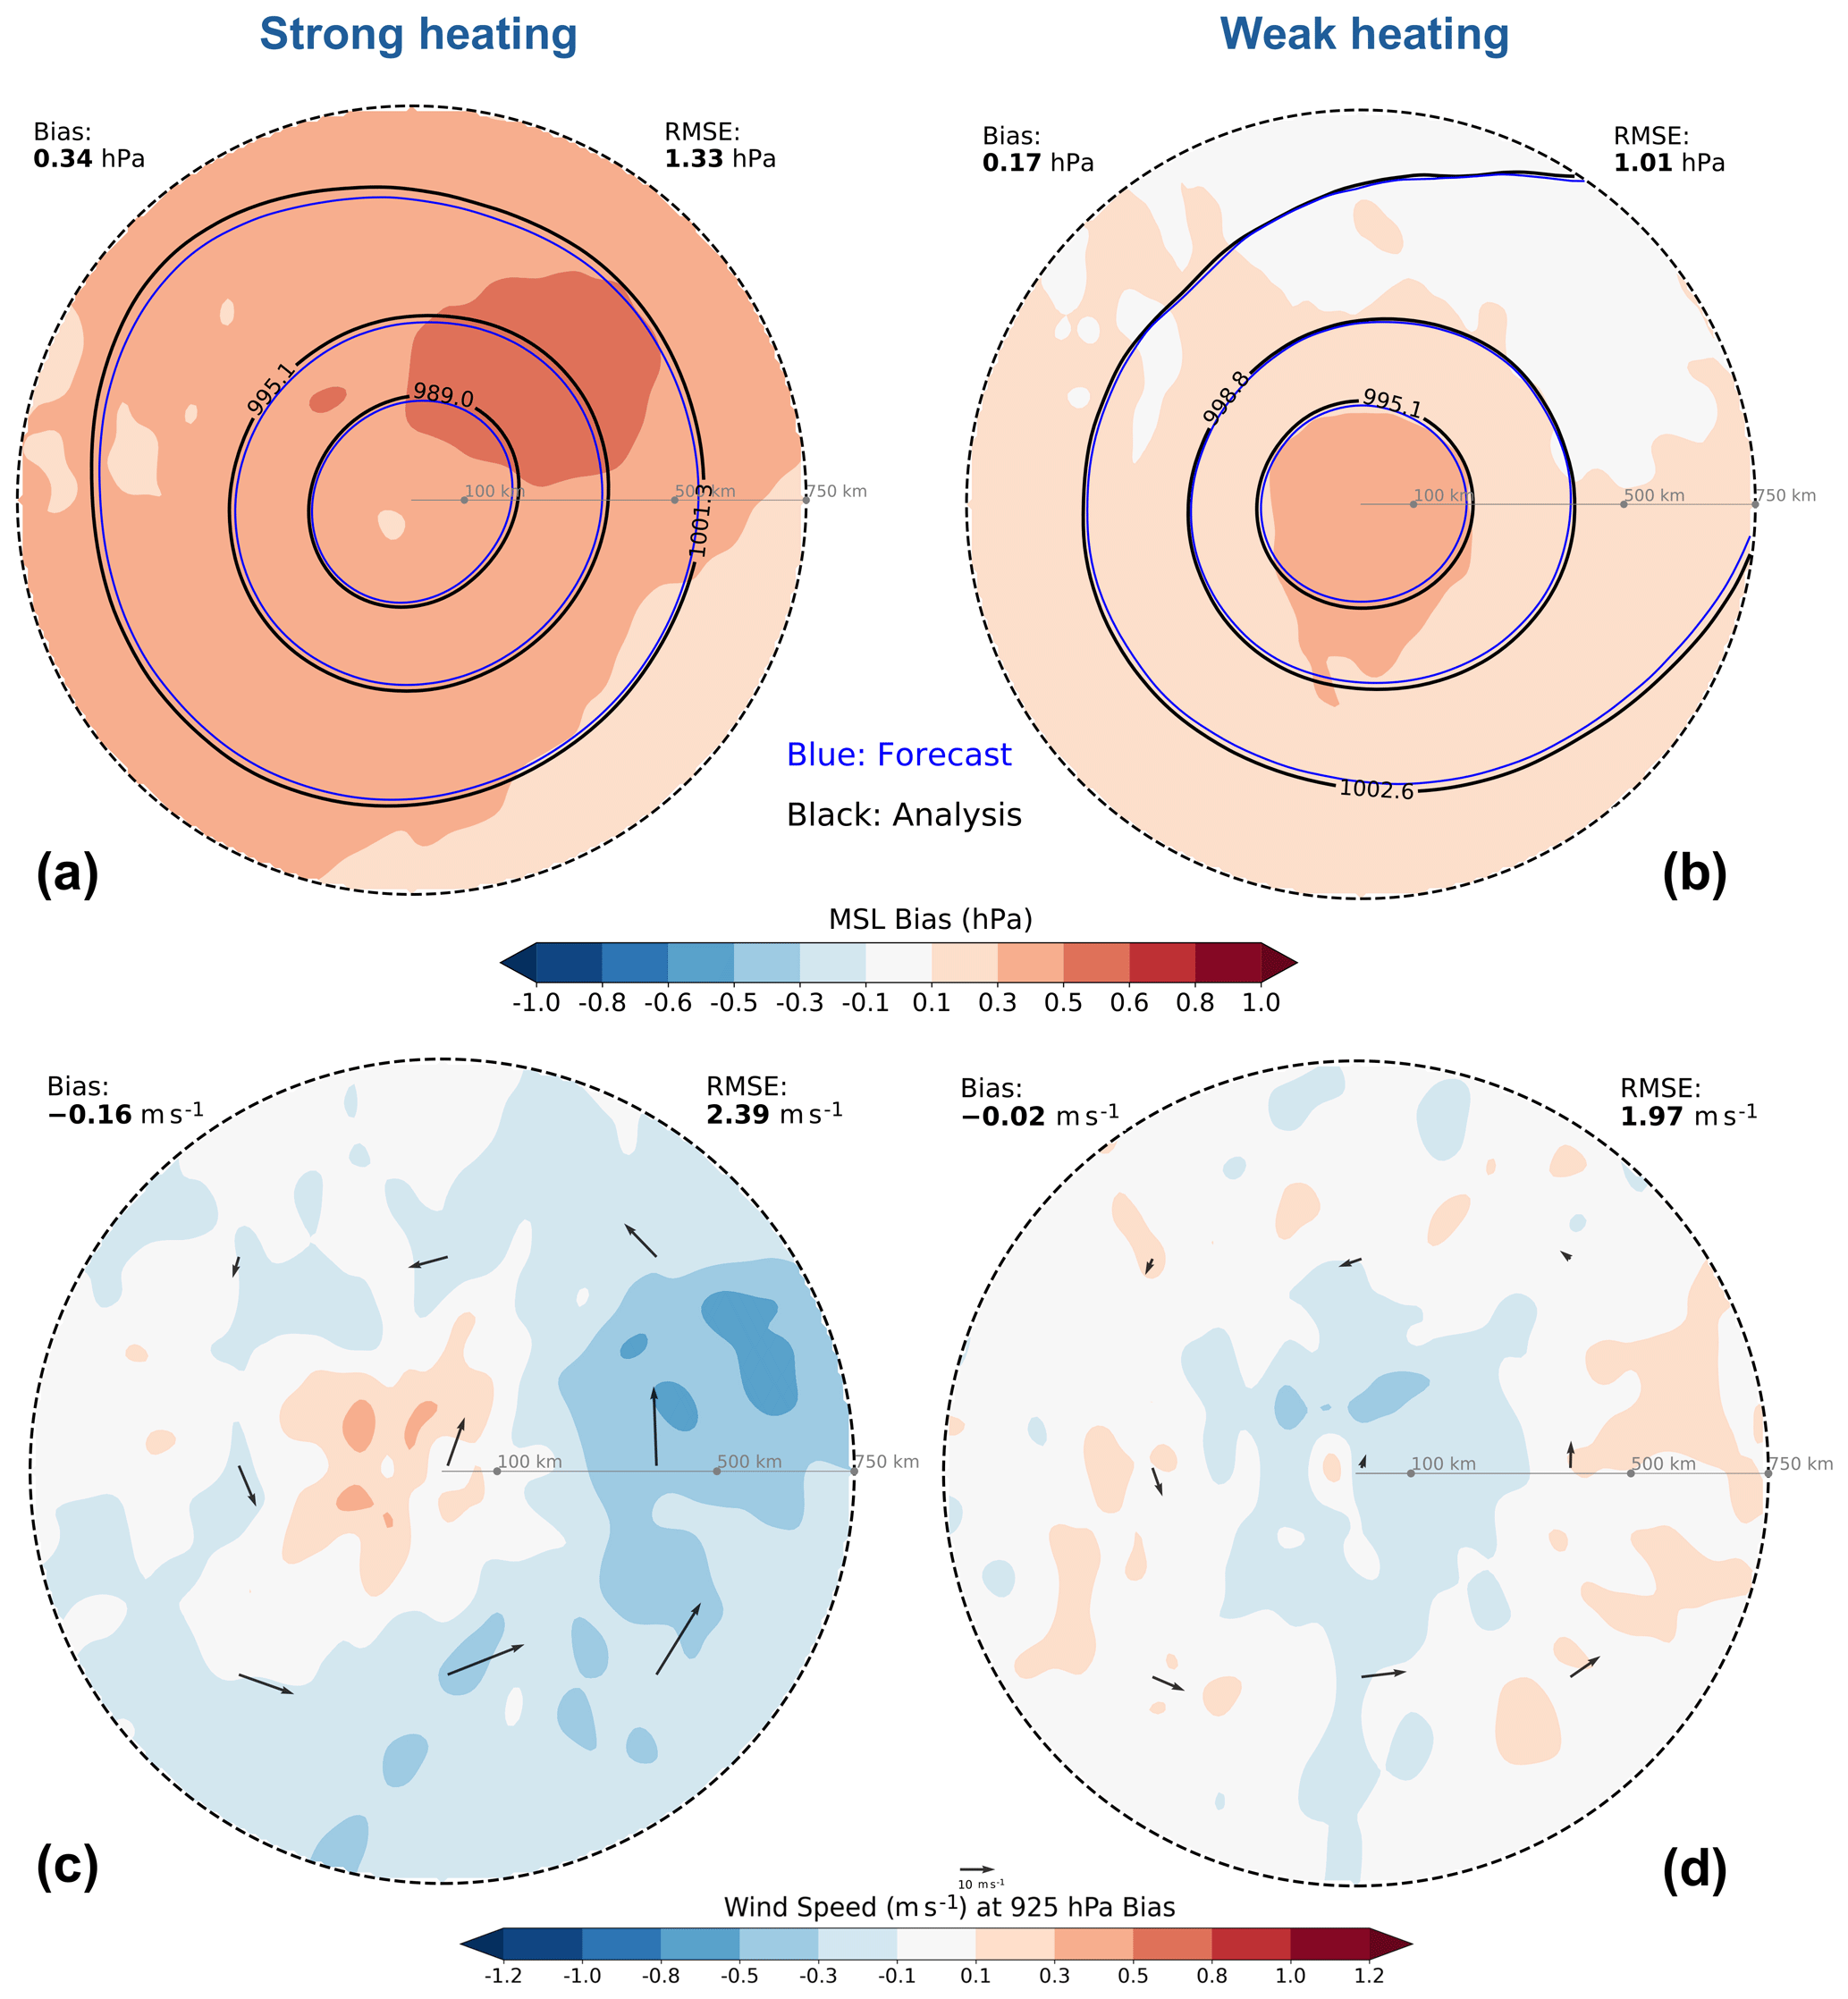
Cyclone-centred MSLP biases reveal an underestimation of cyclone intensity, with structural differences for the two groups (Fig. 3a, b). In the strong heating group, a broad area of positive bias is evident (Fig. 3a, shading), indicating that the forecasted cyclones are generally too weak. This intensity underestimation is also visible in the forecasted MSLP contours (blue), which exhibit a smaller radius compared to the analysis (black). Furthermore, the spatial location of the maximum underestimation in the strong heating group is in the upper right-hand quadrant of the composite centre. In contrast, for the weak heating group, the intensity underestimation is mainly around the cyclone centre (Fig. 3b).
Notably, a comparison with the non-centred results (Fig. 2a, b) reveals that the recentred composites (Fig. 3a, b) exhibit a smaller domain-averaged bias but a larger domain-averaged RMSE. This counter-intuitive increase is most likely due to the elimination of error compensation, where the position bias originally masked the systemic intensity underestimation. Specifically, in the non-recentred composite (Fig. 2a, b), the southwestward displacement partially overlaps with the regions of intensity underestimation, leading to a cancellation of biases over the left-hand quadrants of the composite. Once recentred (Fig. 3a, b), this spatial offset is removed, revealing a more consistent and domain-wide intensity bias. While recentring reduces the large error magnitudes near the cyclone centre, broadly distributed errors lead to a higher domain-averaged RMSE.
The weak heating group displays an underestimation of 925 hPa wind around the cyclone centre (Fig. 3d), which is consistent with the underestimated depression in MSLP (Fig. 3b). The strong heating group exhibits a wind speed underestimation in the warm sector (Fig. 3c). However, an overestimation manifests in the cold sector region, associated with Cold Conveyor Belts (CCBs), dry intrusions (DIs), and sting jets (SJs) (Schultz, 2001; Browning, 1997, 2004). One potential explanation for this overestimation is that the stronger forecasted winds may actually be closer to reality. The incremental 4D-Var assimilation system in ERA5 computes analysis increments at a reduced spatial resolution (Hersbach et al., 2020; ECMWF, 2016). Hence, highly localised sharp wind gradients are often smoothed out. This is consistent with previous findings that marine CCB jets are underestimated in ERA5 (Gentile and Gray, 2023). Despite these spatial variations, both heating groups demonstrate a domain-averaged underestimation of 925 hPa wind speed, which generally aligns with previous feature-based analyses (Yu et al., 2025).
3.2 Moisture fields
For the strong heating group, the total column water vapour (TCWV) composite reveals a distinct negative bias, indicative of a moisture deficit in the forecast (Fig. 4a). This underestimation is most pronounced in the warm sector, especially along the boundaries of high TCWV filament (about 4 %). A comparison of the composite contours shows that the water vapour in the forecast (blue) is narrower compared to the analysis (black). In addition, a pronounced negative bias of the water vapour flux (WVF) is evident in both the along and across components relative to cyclone propagation on the warm side of the cyclone (Fig. 4e, f). The TCWV deficit is thus consistent with insufficient moisture transport in the warm sector, most likely coinciding with warm conveyor belts (WCBs).
To quantify the linkage with WCBs, we employ moisture transport axes (MTAs, Spensberger et al., 2025) and create a mask around them with a 200-km distance threshold around the identified axis (see Yu et al., 2025). The MTA algorithm extracts well-defined maxima in the water vapour transport (Spensberger et al., 2025), effectively capturing coherent moisture filaments, which are variously known as atmospheric rivers, warm moist intrusions, and WCBs. For the strong heating group, the MTA frequency in the warm sector reaches over 70 %, whereas it remains below 10 % for the weak heating group (Fig. S2). Hence, for strong heating cyclones, there is a strong link between the aforementioned biases and biases in WCBs.
The high-value core of total column ice water (TCIW) is located at the upper right-hand quadrant of the composite cyclone, with its trailing region at the bottom right-hand quadrant. There is a negligible bias within the maximum of TCIW, with negative/positive biases at the leading/trailing edge of the TCIW maximum (Fig. 4b). The TCIW plume in the forecast (blue contours) is more elongated than in the analysis (black contours). This more elongated structure of the forecasted TCIW is the main cause of the positive bias in the trailing region, indicating that the ice water is less cyclonically wrapped up in the forecast. This weaker wrap-up is consistent with the insufficient moisture transport and underestimated wind (Fig. 3c, d).
In contrast to the underestimation for vapour, the total column liquid water (TCLW) shows a notable positive bias (approximately 10 % overestimation) within the upper two quadrants of the composite close to the cyclone centre, commonly referred to as the cloud head region. (Fig. 4c). Given that the strong heating group is fundamentally characterised by free tropospheric diabatic heating and the associated intense moisture filaments (MTAs), this bias points toward error sources from both microphysics and dynamics.
The positive TCLW bias is concentrated within the strong ascent region (Fig. 4c). Given the corresponding negative biases in TCWV, this positive bias strongly suggests an under-representation of precipitation efficiency within the microphysical scheme, where liquid droplets remain suspended instead of precipitating out. Furthermore, as liquid water is not directly constrained by data assimilation (DA) (Geer et al., 2017), the model must rely on indirect corrections via adjustments to thermodynamic and kinematic observations, which may feature systematic deviations, potentially yielding the positive liquid water bias.
Given that vertical velocity in the analysis is diagnosed and not directly observed, we employ the kinematic frontogenesis of potential temperature (θ) as a proxy, as it quantifies the dynamic forcing that drives a secondary vertical motion (Sawyer, 1956; Eliassen, 1962). Pronounced frontogenesis at 850 hPa is evident in the upper left- and right-hand quadrants of the cyclone centre (Fig. 4d). The frontogenesis positioned closer to the cyclone centre is associated with a positive bias in frontogenesis near the centre (∼17 %). As Martínez-Alvarado et al. (2014b) showed that latent heating strongly influences cyclone frontal structure, this bias reflects a feedback between dynamic and diabatic processes. In accordance with thermal wind balance, the resulting enhanced temperature gradient corresponds to a stronger vertical shear of the geostrophic wind, consistent with the wind speed overestimation (Fig. 3c). The intensified frontogenesis is also associated with a secondary circulation that produces enhanced vertical motion on the warm side of the front (not shown). This ascent can enhance condensation, resulting in an overestimation of liquid water along the warm front (Fig. 4c).
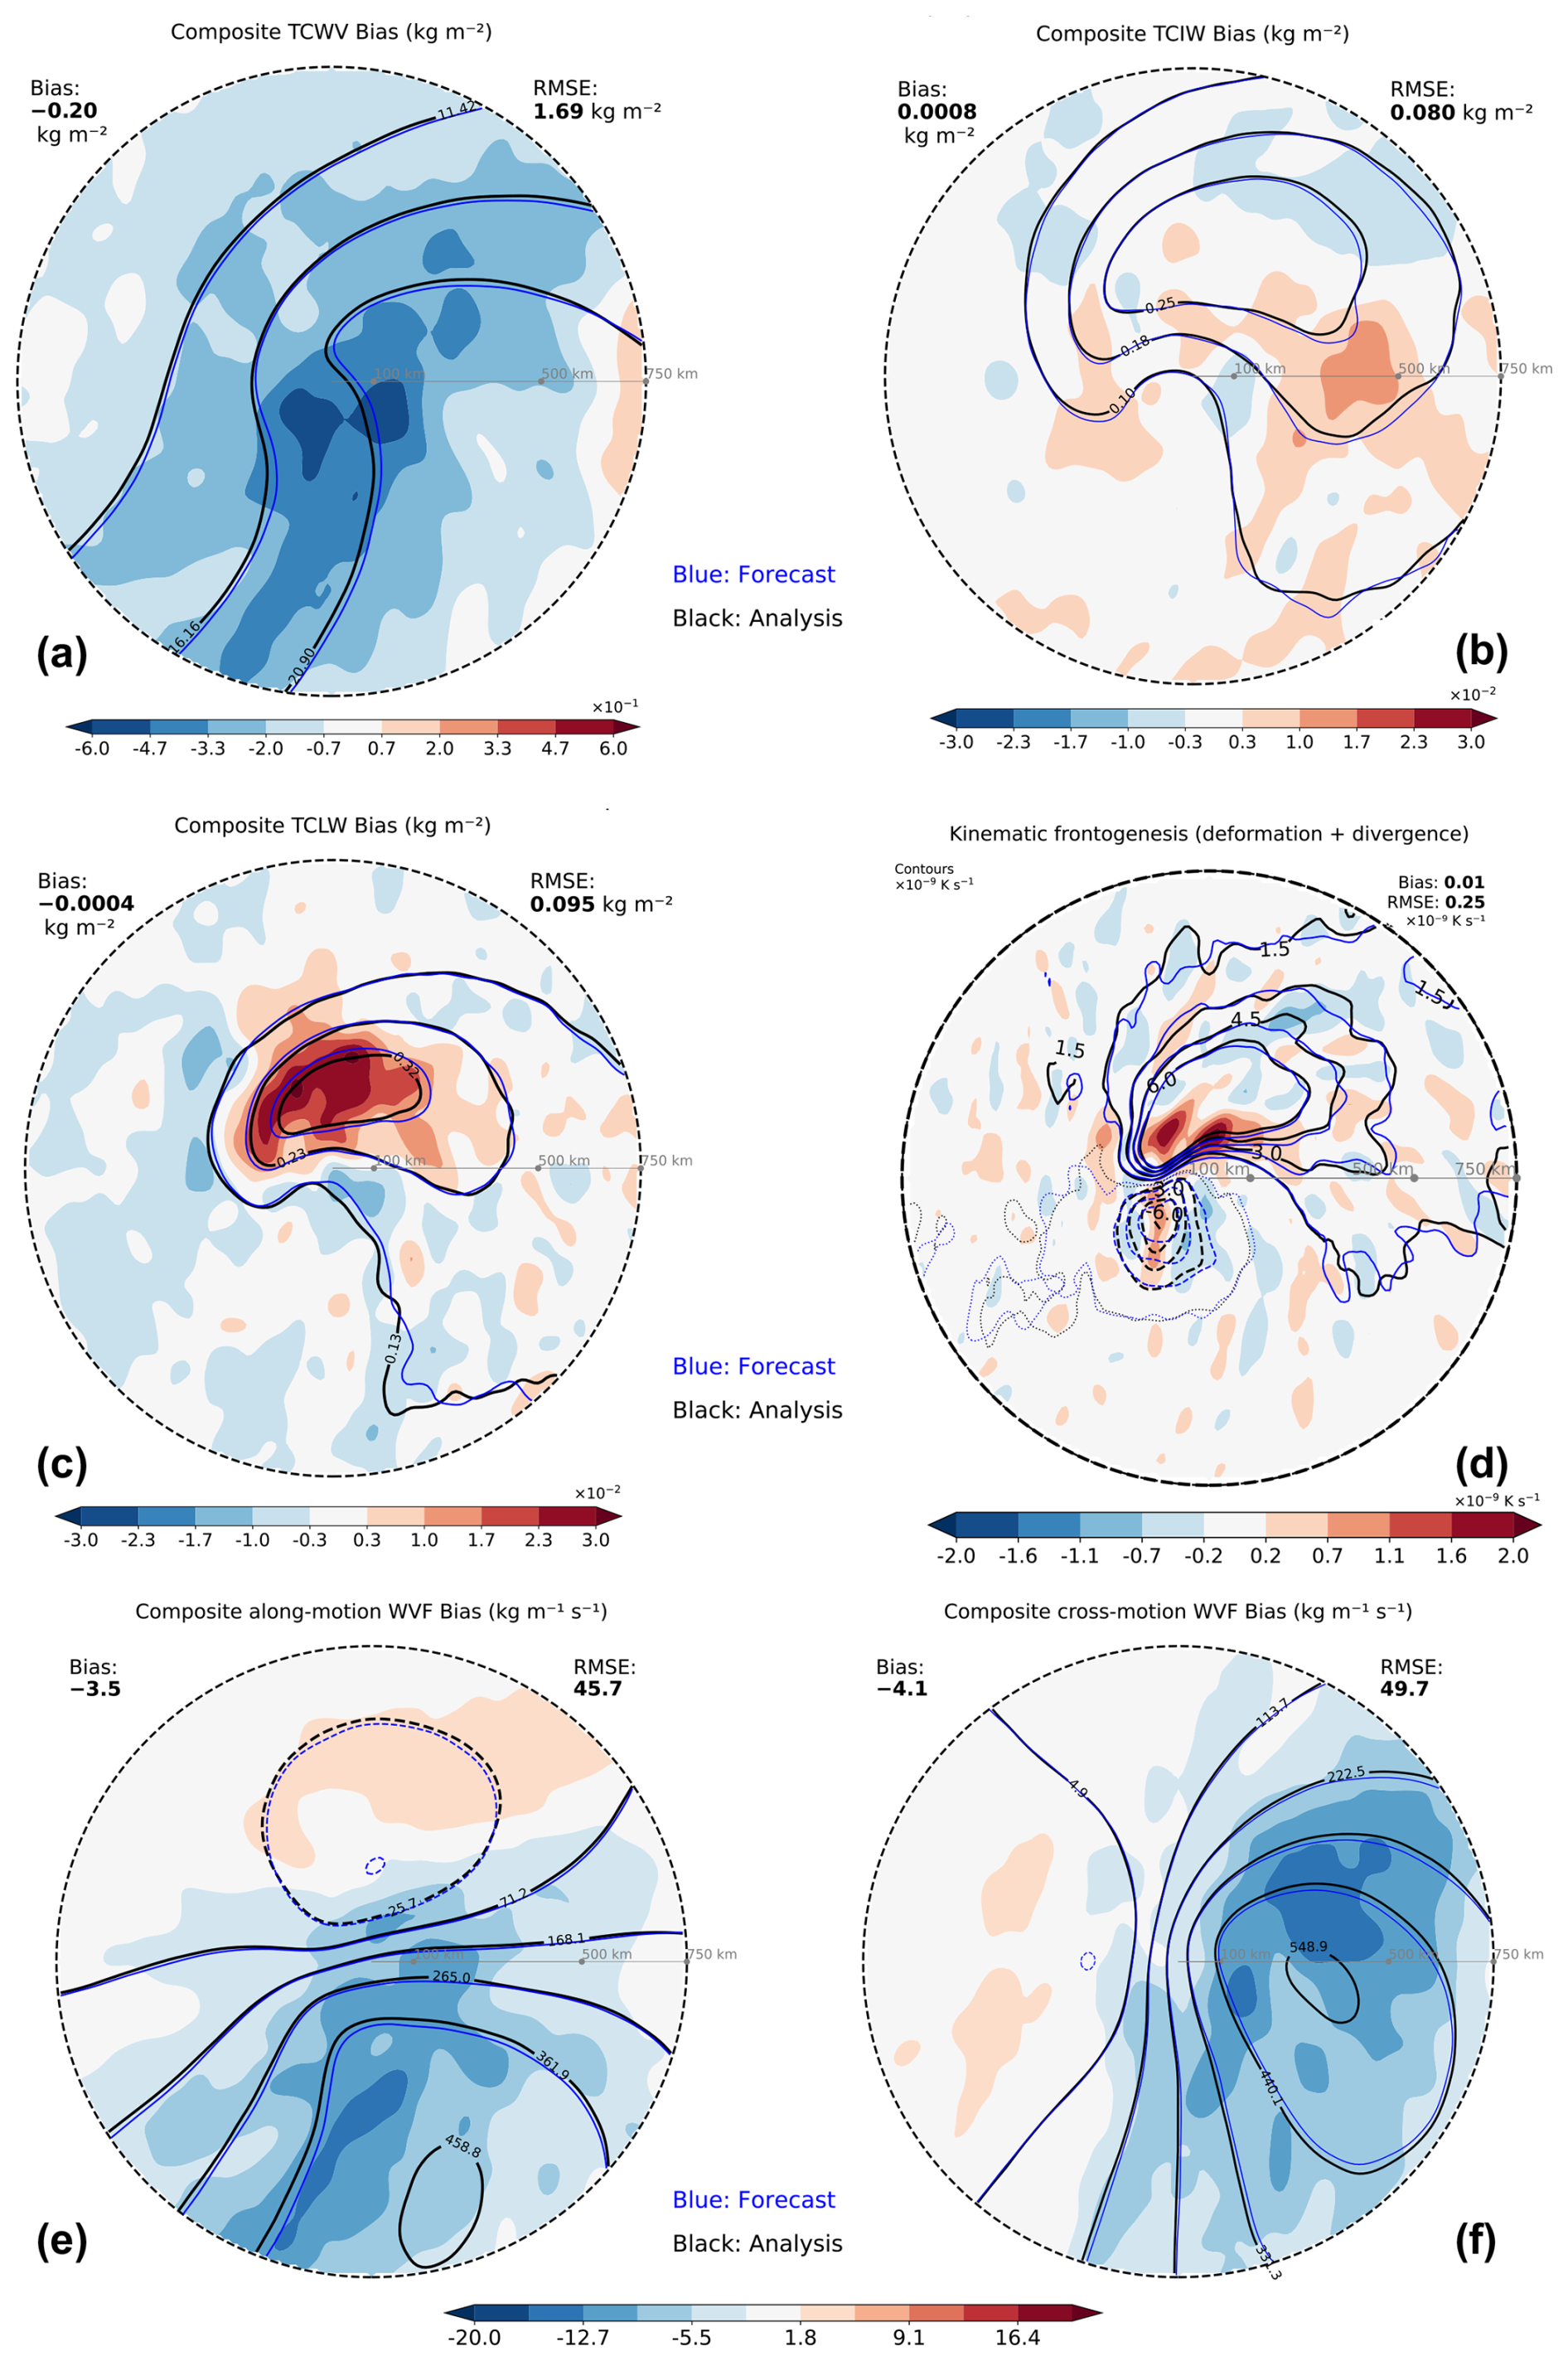
Figure 4Biases for the strong heating group: (a) total column water vapour, (b) total column ice water, (c) total column liquid water, (d) kinematic frontogenesis, (e) along-motion water vapour flux, and (f) cross-motion water vapour flux.
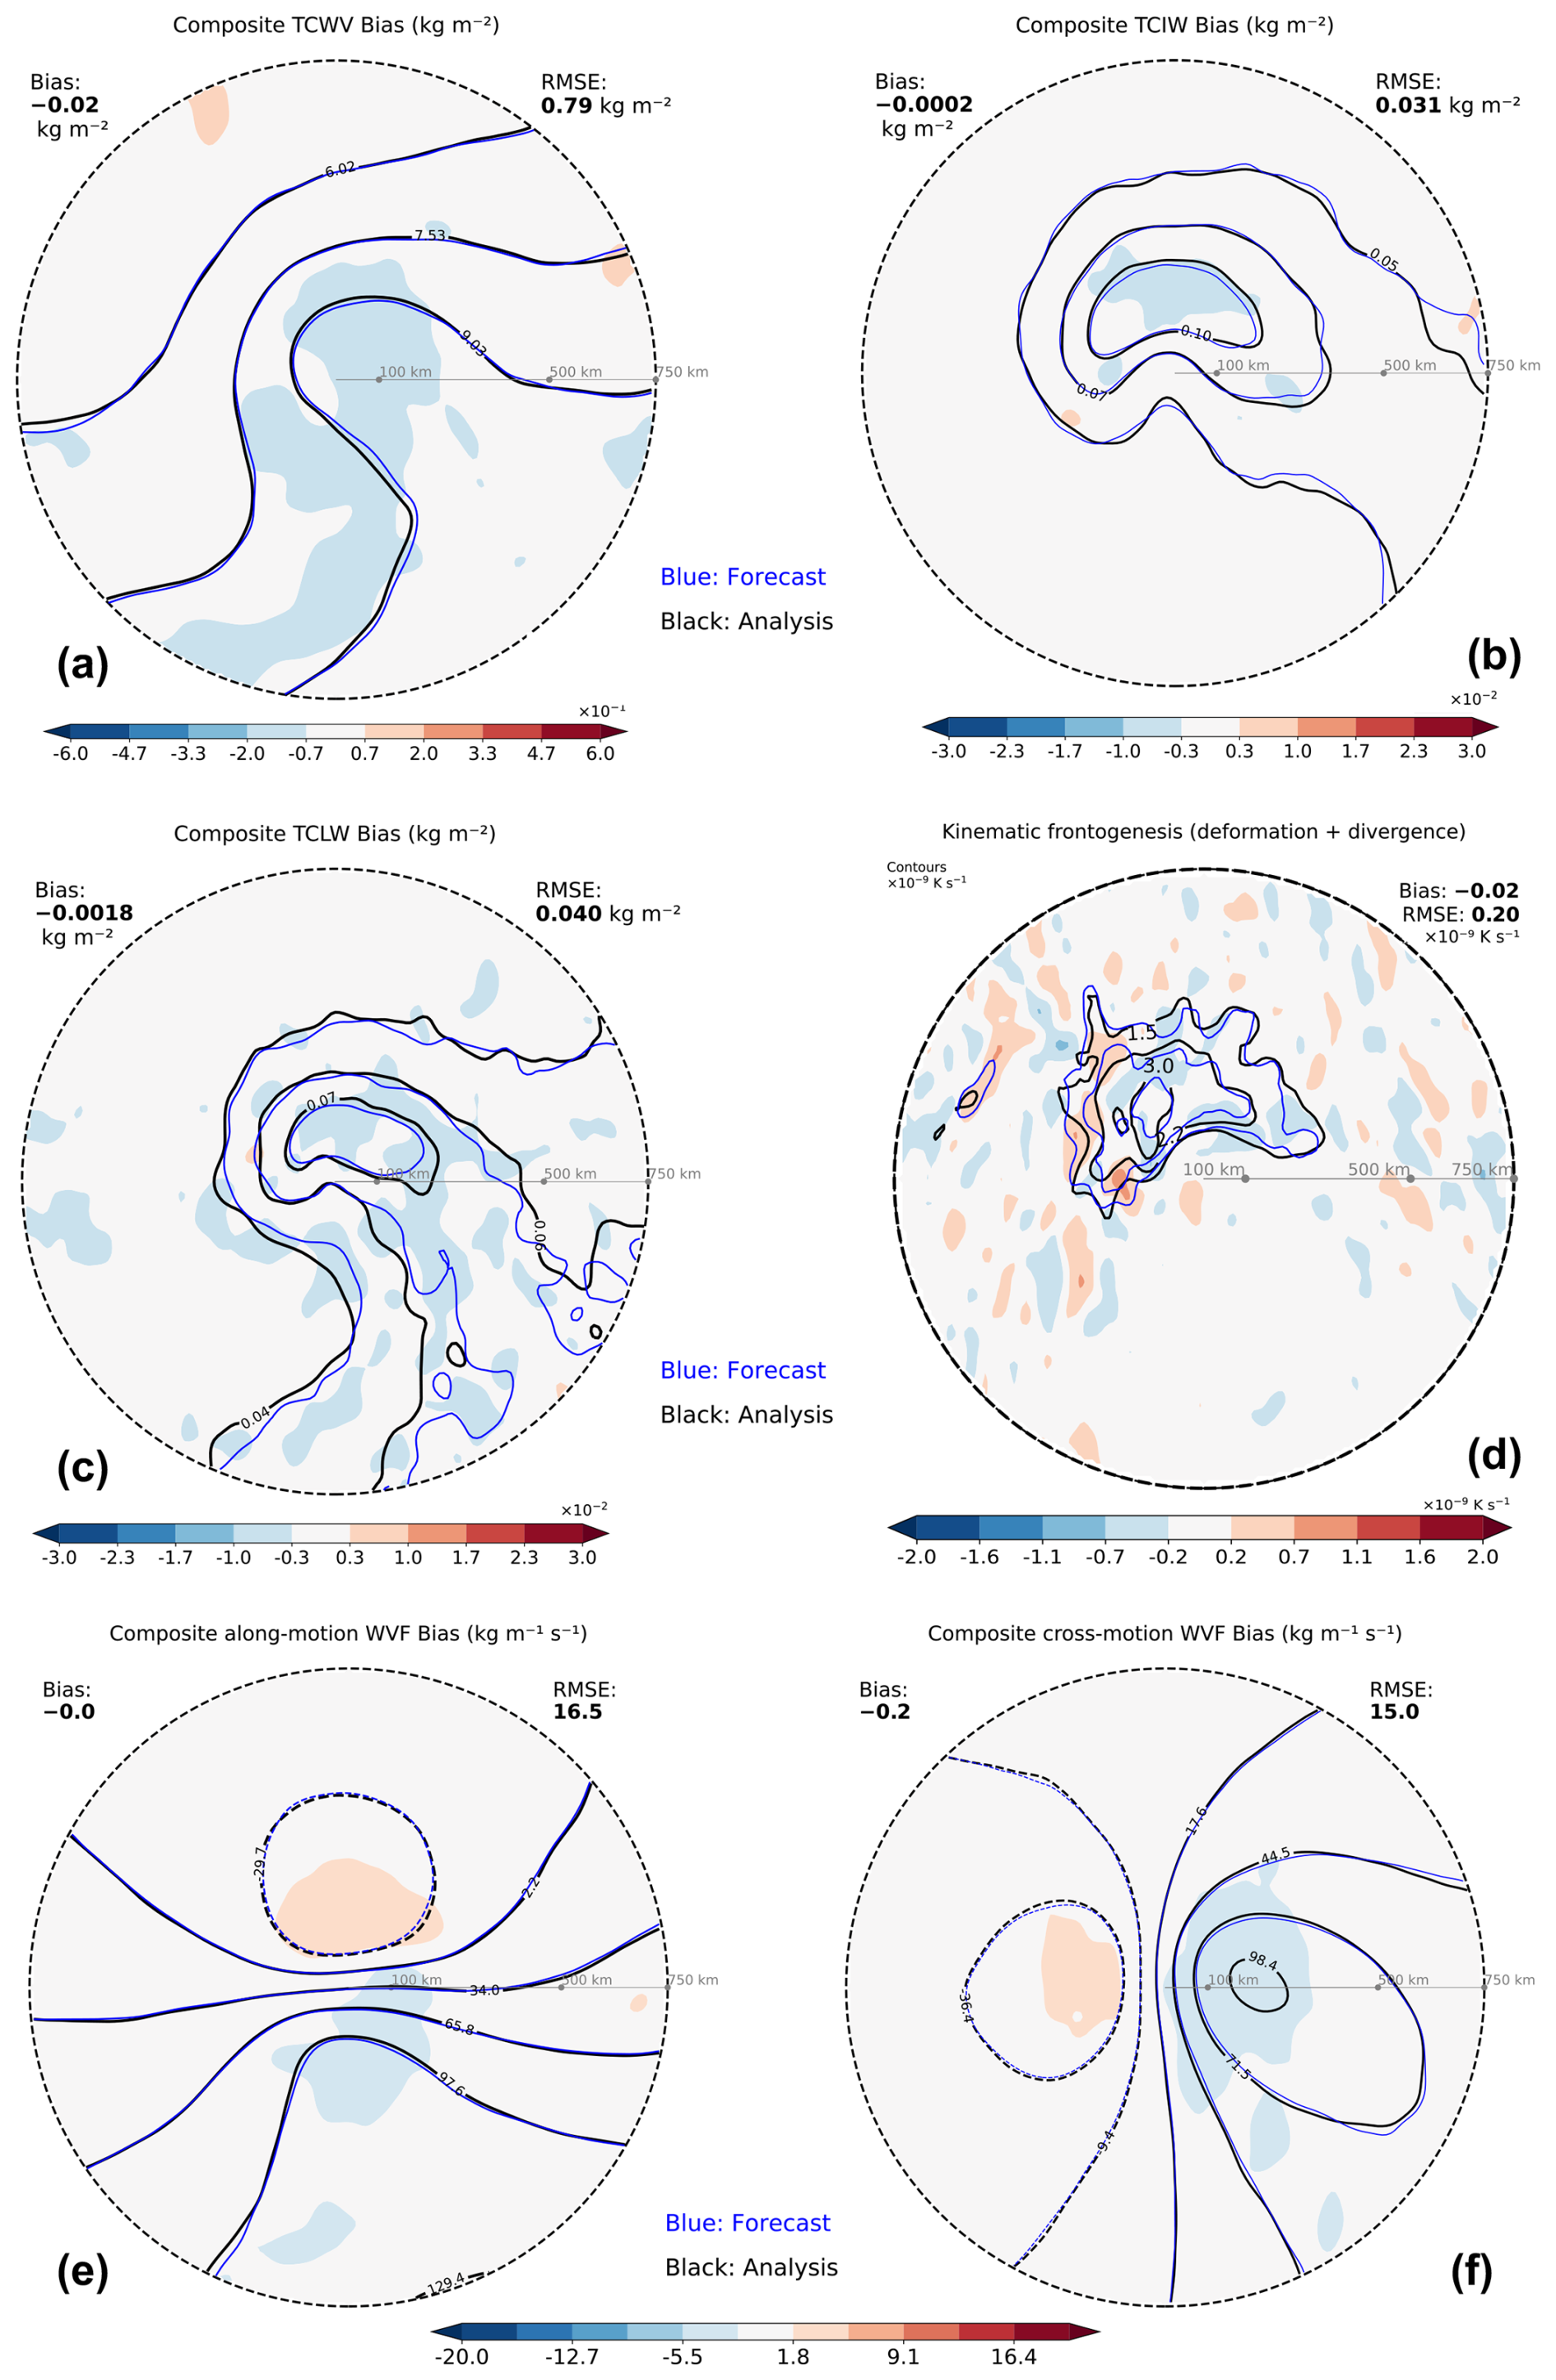
Compared with the strong heating group, the weak heating group exhibits a much weaker bias of TCWV, mainly around the centre (approximately 1 %) as well as on the left side of the high TCWV filament (Fig. 5a). Accordingly, moisture transport also shows only very weak biases near the centre (Fig. 5e, f). The biases are smaller and exhibit a more symmetric distribution of positive and negative bias compared with the strong heating group (compare Figs. 4e, f and 5e, f). Unlike the strong heating group, where pronounced warm sector biases are associated with a high frequency of intense moisture transport, the weak heating group exhibits a very low MTA frequency (Fig. S2b). Correspondingly, the moisture biases in this group remain small and symmetric. Furthermore, because weak heating cyclones primarily occur at higher latitudes (Fig. 1b), the colder background environment limits the moisture supply, resulting in weaker biases.
Both TCIW and TCLW composites also display notably smaller negative biases in the respective high-value regions (∼1 %, Fig. 5b, c). The smaller biases for both liquid and frozen water for the weak heating group is likely also related to the lower moisture availability at higher latitudes, also resulting in the reduced diabatic heating.
Consistent with the biases above, the bias in kinematic frontogenesis is also much smaller compared to the strong heating group (Fig. 5d). This primarily reflects the weaker baroclinicity and frontogenetic intensity of these higher-latitude cyclones.
3.3 Low-level tangential and radial wind components and temperature
For cyclones with strong heating, tangential winds at 925 hPa are underestimated in the warm sector, indicating a weaker cyclonic circulation in forecasts (Fig. 6a). This is consistent with the underestimated wind at 925 hPa (Fig. 3c) as well as the underestimated moisture transport (Fig. 4e, f). In contrast, tangential winds are overestimated near the cyclone centre, consistent with the wind bias around the CCB, DI, and SJ (Fig. 3c). The latter overestimation of cyclonic wind is also associated with the overestimation of frontogenesis (Fig. 4d). An accurate representation of these winds is particularly important, as the CCB region is most frequently associated with compound wind-wave hazards (Gentile and Gray, 2023), with SJs often contributing to extreme wind gusts (Clark and Gray, 2018).
Radial wind also features a domain-averaged positive bias, indicating an underestimation of inflow in the forecast (Fig. 6c), which is consistent with the previously reported wind direction bias for cyclones (Yu et al., 2025). Notably, a pronounced negative bias is observed in the radial wind within the upper right-hand quadrant of the composite cyclone near the centre. This negative bias indicates an overestimation of inflow (convergence), which aligns with the overestimated vertical motion related to the frontogenesis bias (Fig. 4d).
The low-level tangential wind composite for cyclones with weak heating exhibits a clear underestimation near the cyclone centre (Fig. 6b). This indicates a weaker cyclonic circulation in the forecast, consistent with cyclones in this group being forecasted too weak (Fig. 3b). Correspondingly, the radial wind component generally displays a small domain-averaged positive bias (Fig. 6d). The clearest positive bias is located in the warm sector. This reflects a weaker inflow and insufficient convergence within the warm sector, which is essential for cyclonic development and warm frontal ascent.
These cyclonic circulation biases are associated with the thermal structure through altered temperature advection. The temperature bias for the strong heating group shows a pronounced cold bias in the upper right-hand quadrant. This is consistent with the underestimated cyclonic flow and water vapour transport in the warm sector, thus featuring reduced warm air advection (Figs. 3c, 4e,f, and 6a). Additionally, the lower-left quadrant also exhibits a notable cold bias. This cold bias is linked to the upper level potential vorticity (PV) biases discussed in the following section.
For the weak heating group, the temperature bias at 850 hPa manifests as a cold bias in the warm sector (lower-right quadrant) and a warm bias in the cold sector (upper-left quadrant, Fig. 6f). This pattern is consistent with the underestimation of cyclone intensity.
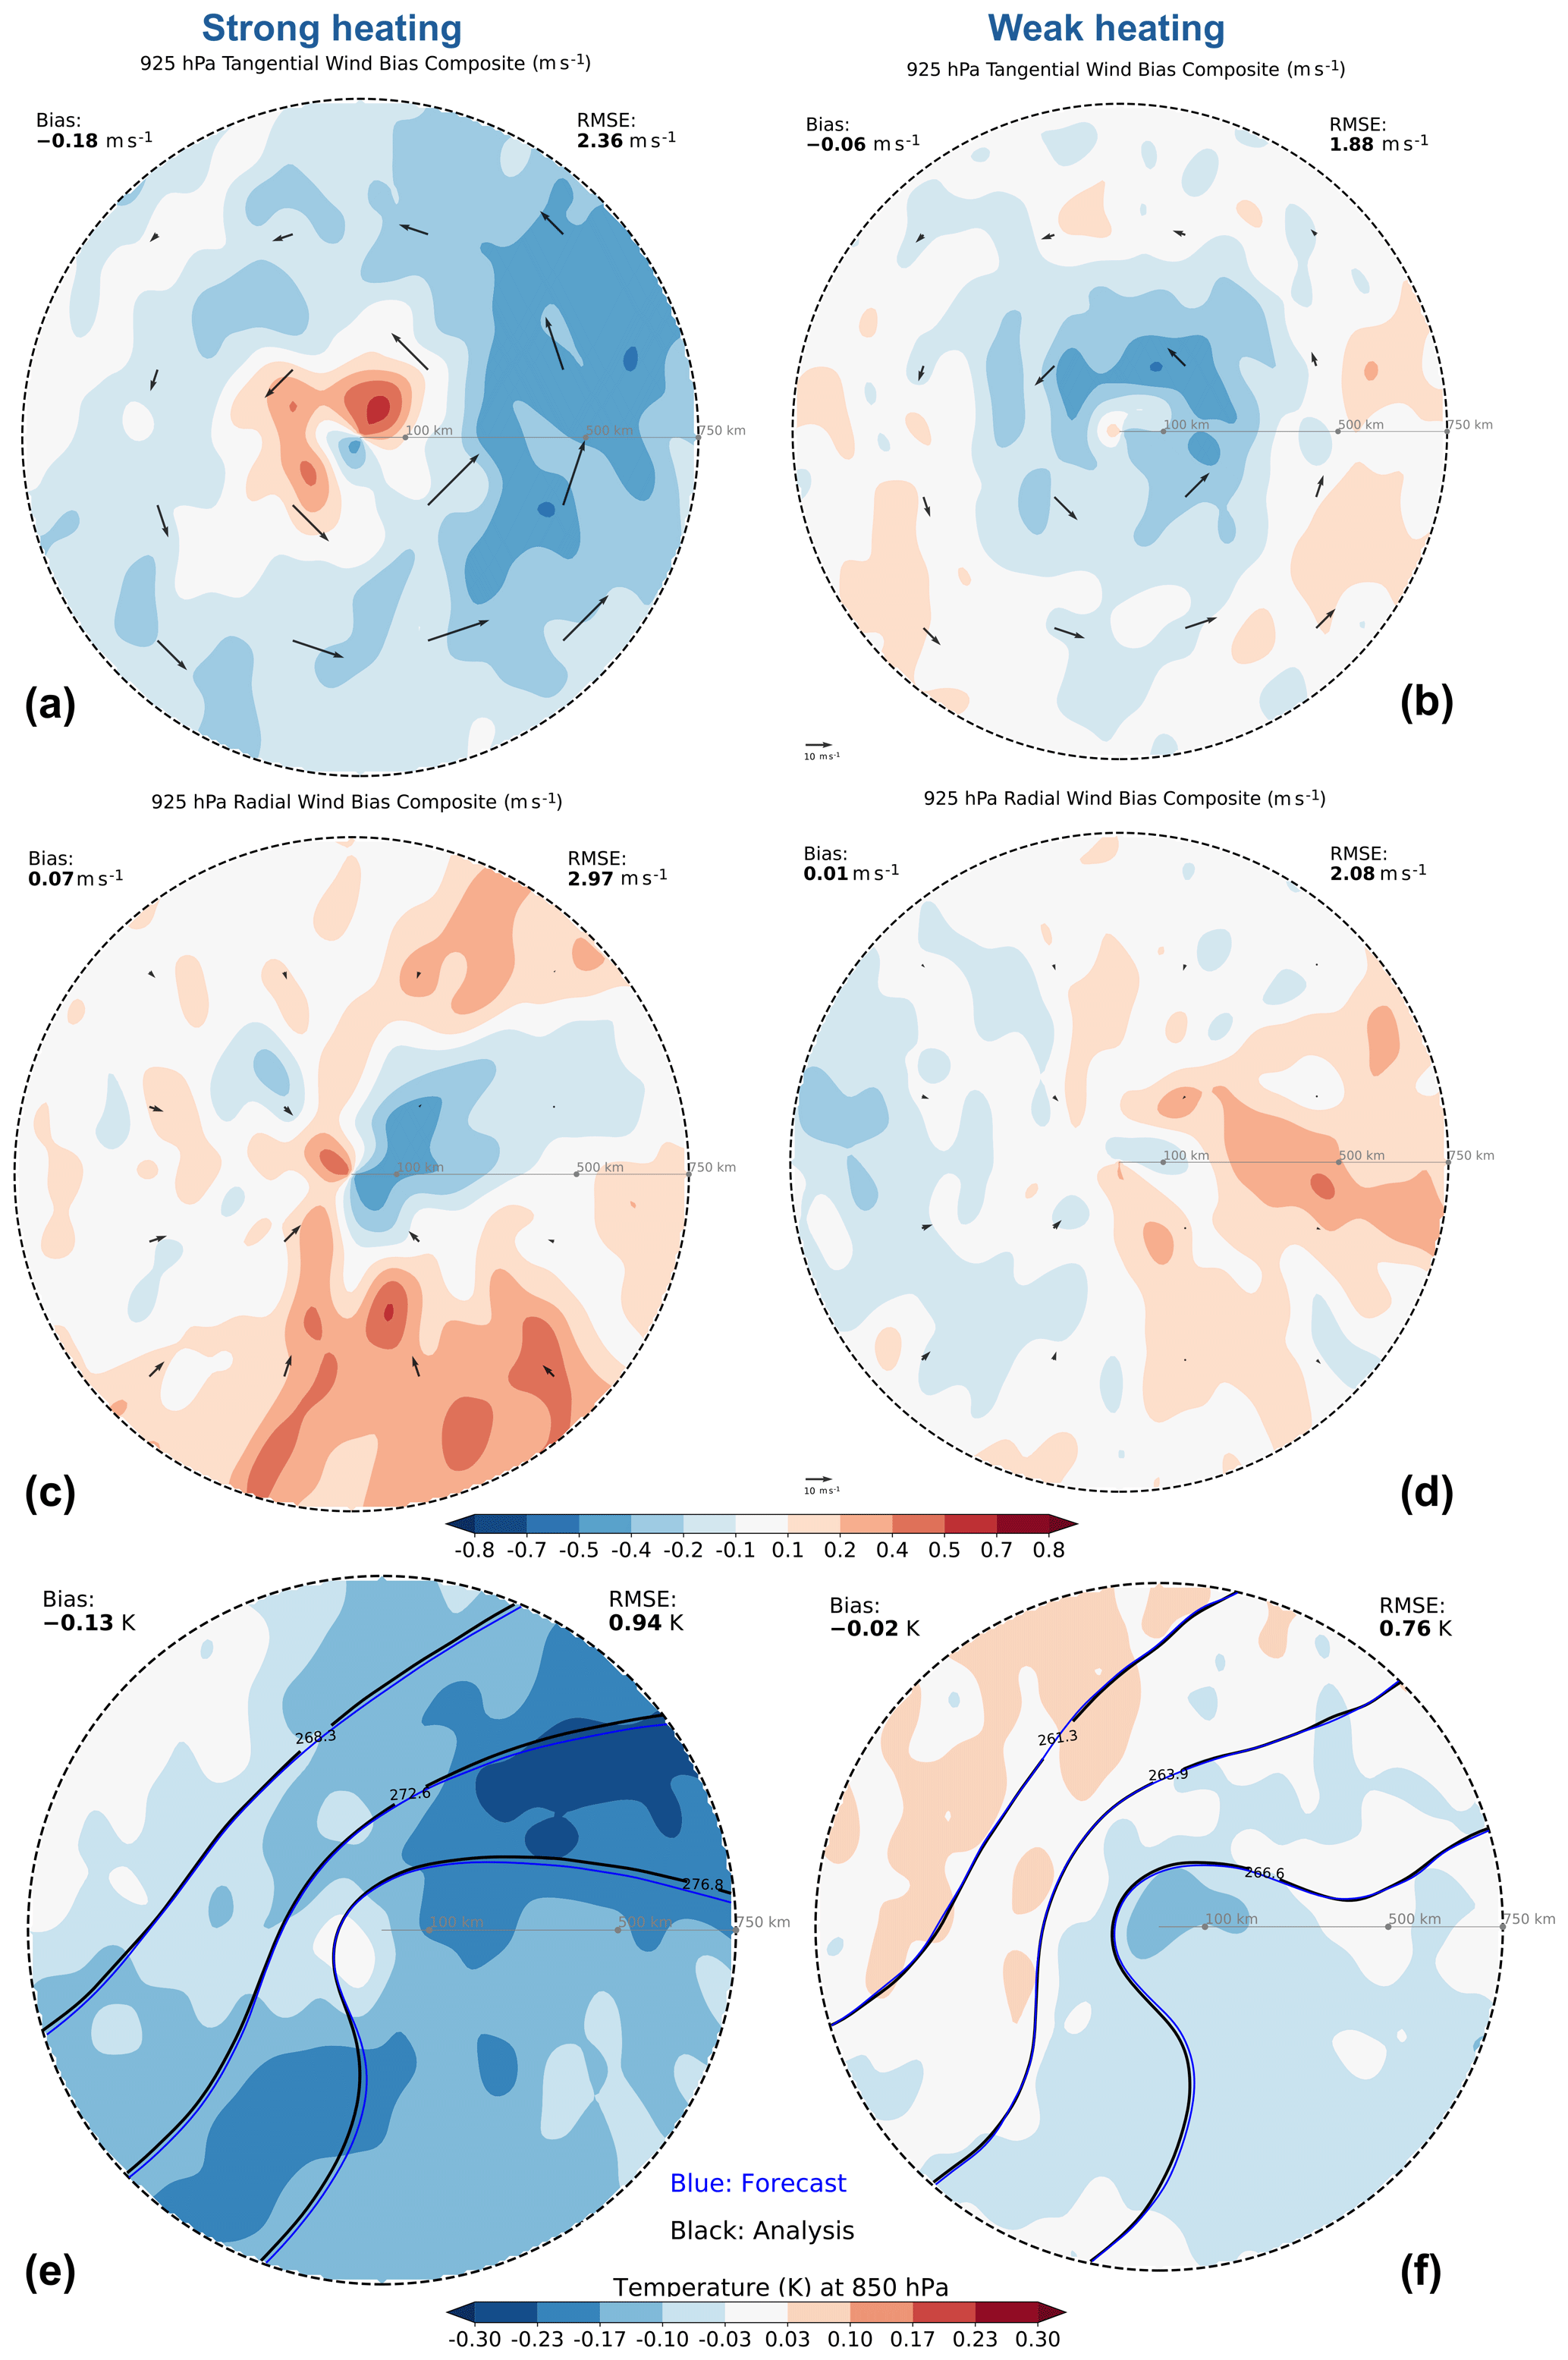
Figure 6Biases for (a, c, e) the strong heating group and (b, d, f) the weak heating group. Panels (a, b): tangential wind bias composite at 925 hPa (shading) with analysis composite (quivers). Panels (c, d): radial wind bias at 925 hPa (shading) with analysis wind composite (quivers). Panels (e, f): temperature bias at 850 hPa (shading) with analysis/forecast composite (black/blue contours).
3.4 Upper-level circulation at 300 hPa
The upper-level PV field for the strong heating group displays a distinct trough-ridge pattern, with a pronounced positive bias around the ridge (Fig. 7a). This underestimation of the upper-level ridge in the presence of strong diabatic heating is consistent with previous studies (Martínez-Alvarado et al., 2016; Grams et al., 2018; Oertel et al., 2020). Furthermore, although the trough axis generally exhibits an underestimation (negative bias), there is an elongated positive PV bias along the trough axis, indicating an overestimation of PV in the forecast. The positive PV bias co-locates with the cold bias in the lower-left quadrant (Fig. 6e). This overestimation of upper level PV is likely associated with enhanced descending along dry intrusions (DI), which can result in larger cold and dry air advection within the cold sector (Catto and Raveh-Rubin, 2019).
Consistent with the upper level PV bias, the bias in geopotential height at 300 hPa for cyclones with strong heating features an underestimation of the ridge (Fig. 7c). Note, however, that the trough is not underestimated in terms of geopotential. The biases in both the upper-level PV and geopotential dynamically reflect the misrepresentations of diabatic heating, which is specifically tied to the deficits in WCBs. This aligns with previous studies showing that an underestimation in WCB intensity results in a weaker negative PV anomaly and thus a weaker upper-level ridge (Martínez-Alvarado et al., 2016; Grams et al., 2018; Harvey et al., 2020; Oertel et al., 2020). As demonstrated by Coronel et al. (2015), diabatic amplification of the downstream ridge alters the upper-level steering flow, typically deflecting the cyclone track poleward. Therefore, the underdevelopment of the downstream upper-level ridge can be related to the southward displacement bias for the strong heating group.
The PV composite for the weak heating group shows a maximum in PV above the cyclone centre, with contours extending upstream (Fig. 7b). The bias generally features an underestimation of upper-tropospheric PV, consistent with a weaker cyclone in terms of MSLP (Fig. 3b). In contrast to the strong heating group, the geopotential height field in the weak heating group generally shows a spatially uniform positive bias (Fig. 7d), consistent with the PV trough being underestimated, as well as the underestimation of cyclone intensity (Fig. 3b).
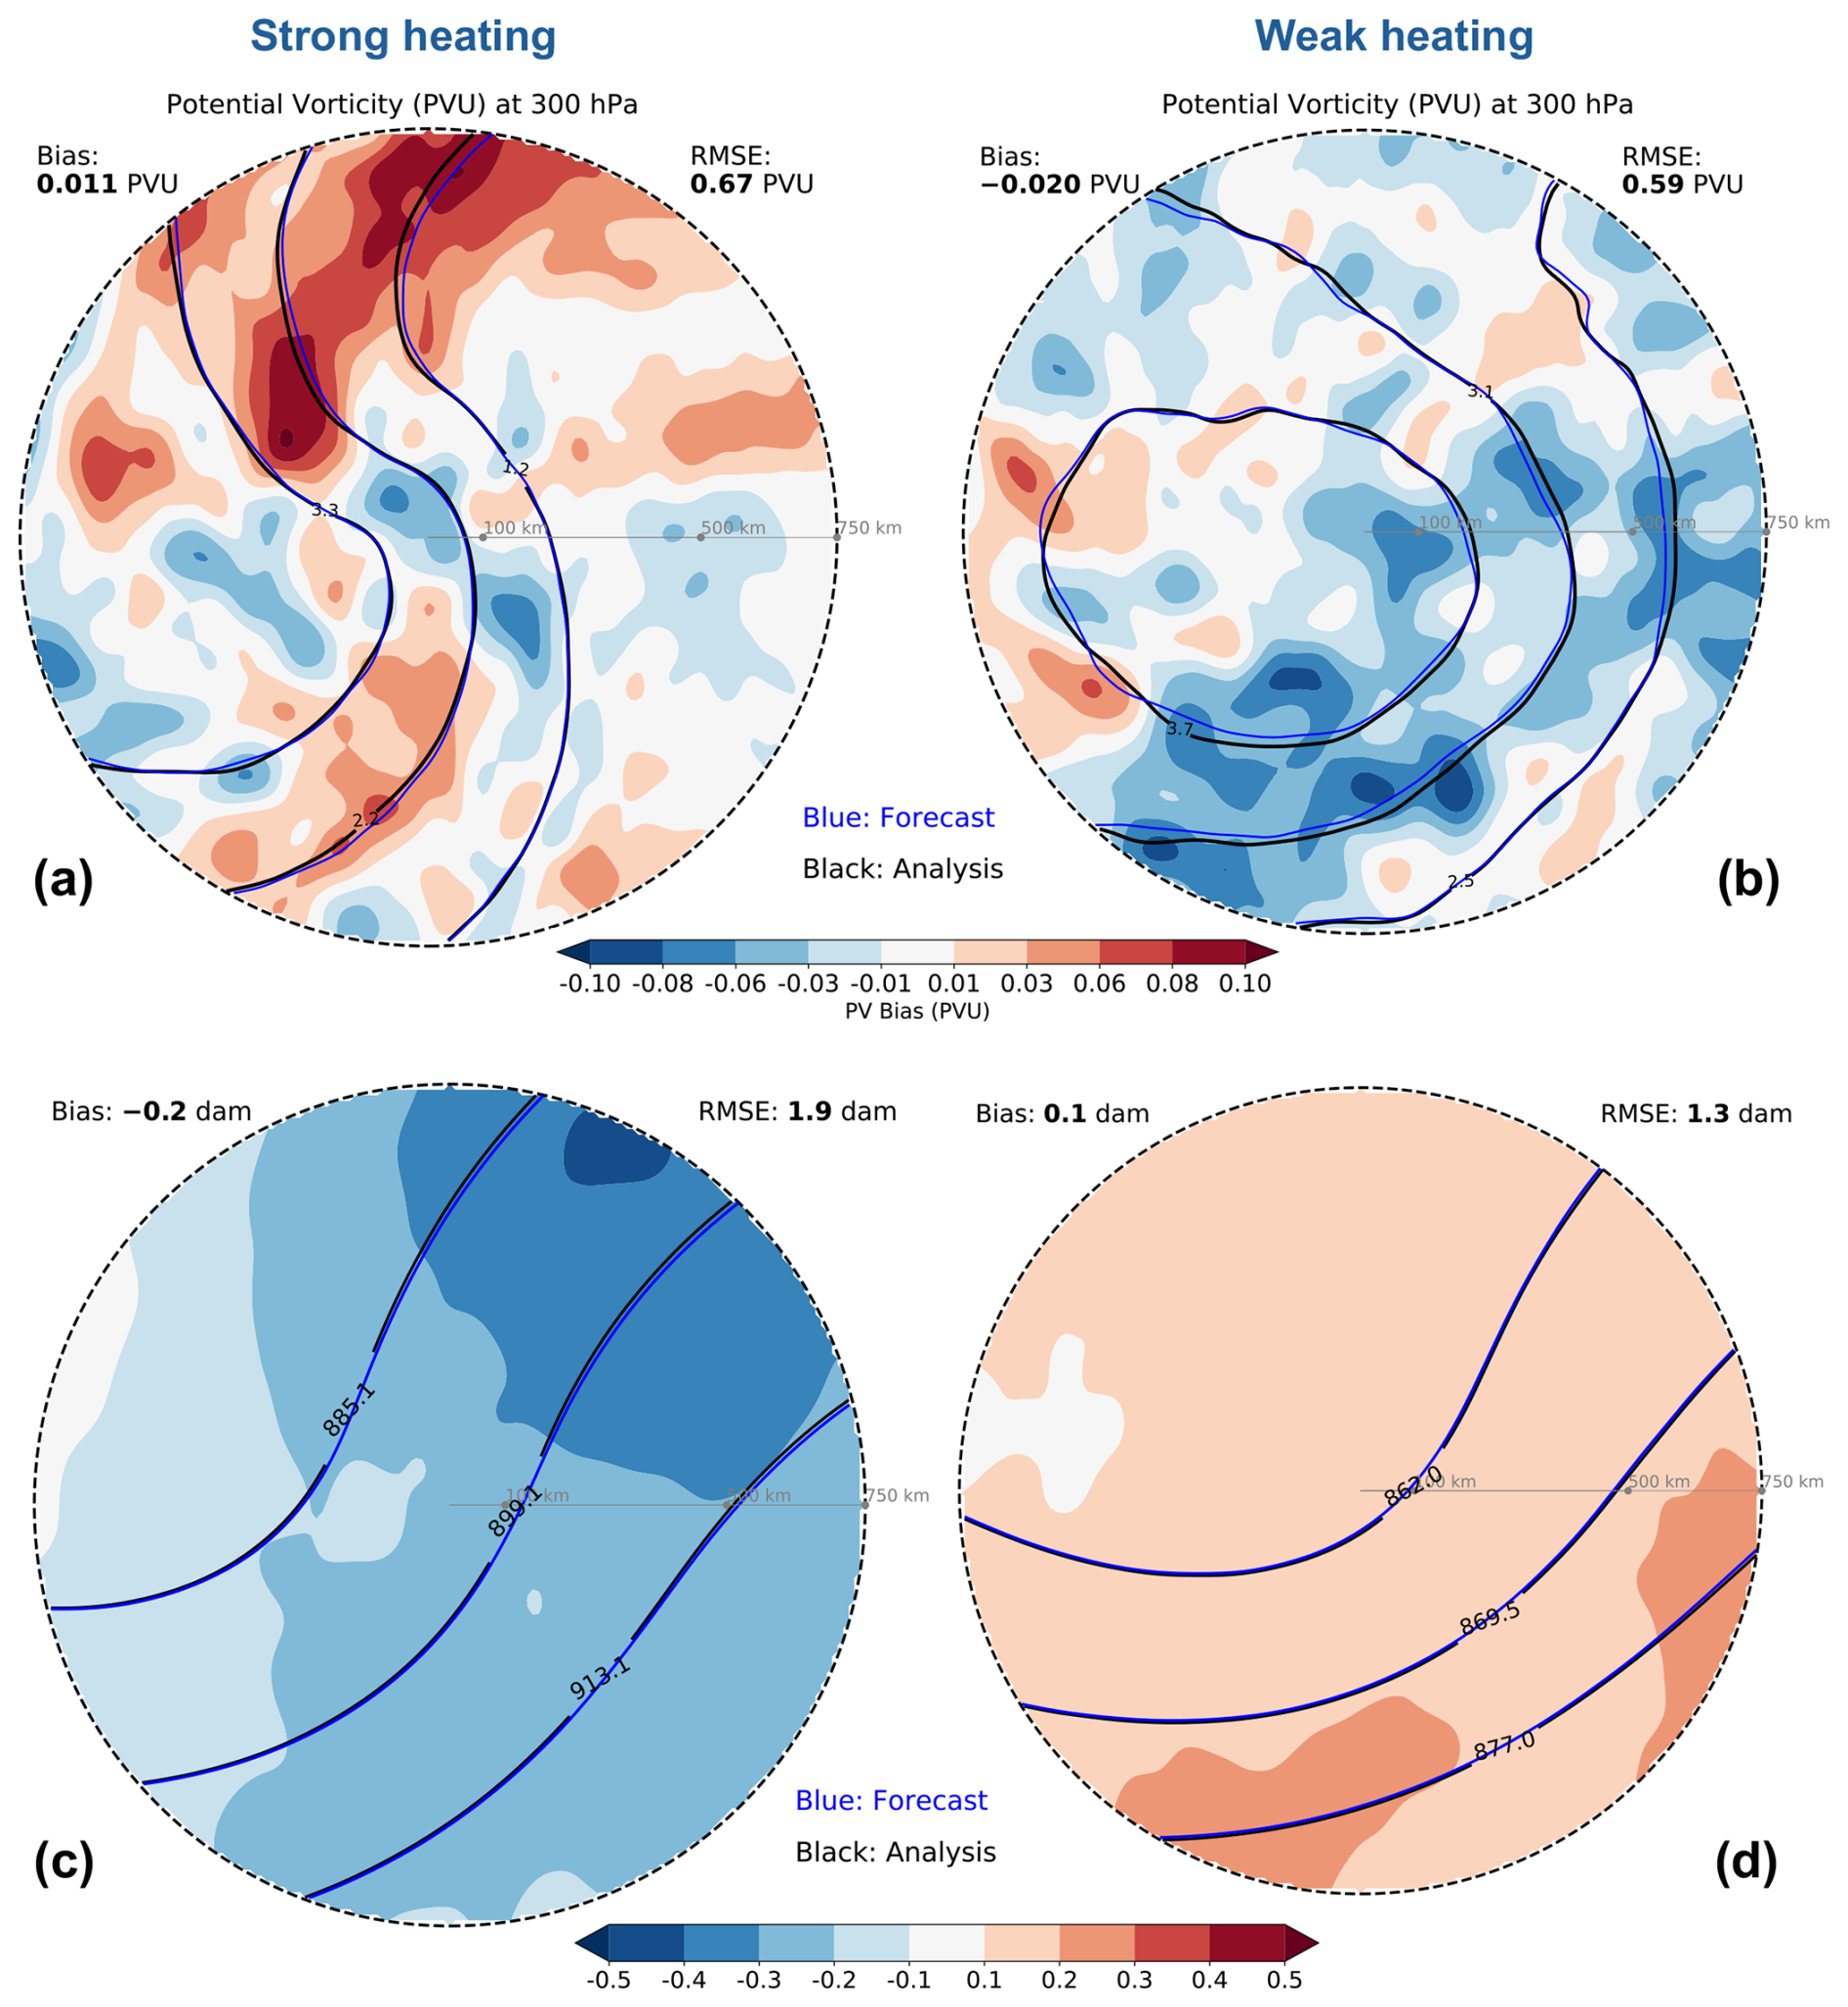
Figure 7Biases for (a, c) the strong heating group and (b, d) the weak heating group. Panels (a, b): potential vorticity (PV) bias composite at 300 hPa (shading) with analysis composite (black contours), forecast composite (blue contours). Panels (c, d): geopotential height at 300 hPa.
This study employs a cyclone-centred composite framework to quantify short-term (12-h) forecast biases for wintertime (DJF) maritime extratropical cyclones (ETCs) within the ERA5 for the period 1979–2022. To compare the influence of diabatic processes, cyclones are categorised into groups based on strong and weak intensity of domain-averaged diabatic heating. Overall, 12-h forecasts of North Atlantic extratropical cyclones underestimate cyclone intensity at the time of maximum intensification. Notably, the bias patterns differ distinctly between the strong and weak heating groups. Although the 12-h forecast biases are of small absolute amplitude, their physical relevance is significant: cyclones with stronger diabatic heating manifest more pronounced biases tied to specific physical processes. Specifically, while forecasts underestimate cyclone inten-sity near the cyclone centre for the weak heating group, forecasts for the strong heating group not only underestimate cyclone intensity but also feature a propagation bias, manifesting as a southwestward displacement of the cyclone position.
The pronounced southwestward displacement bias observed in the strong heating group can be directly linked to the influence of diabatic heating. Given that diabatic heating accelerates cyclones, the propagation bias suggests a misrepresentation of diabatic heating in the forecasts. The slower propagation speed would imply an underestimation of diabatic heating for the strong heating group. The southward displacement can be related to the underdevelopment of the downstream upper-level ridge in the strong heating group. The combination of the southward and westward propagation bias explain the distinct southwestward displacement in the strong heating group.
With the displacement bias removed, the primary near-centred intensity underestimation is confirmed for the weak heating group. This is evident in the clear underestimation of low-level cyclonic flow around the cyclone centre. As well as the near-centred underestimations in TCWV, TCLW, TCIW, and WVF. Additionally, the low-level temperature field reveals a cold bias in the warm sector and a warm bias in the cold sector, indicative of a weaker horizontal temperature gradient across the system and an insufficient baroclinic development in the forecast. At the upper levels, the PV field also features a systematic underestimation, consistent with the shallower, weaker surface system.
With the displacement bias removed, the strong heating group exhibits a domain-wide positive MSLP bias, reflecting an underestimation of cyclone intensity. This underestimation manifests particularly in the warm sector, with consistent negative biases in low-level cyclonic flow, water vapour, and water vapour transport, alongside a cold temperature bias. In the upper troposphere, this is accompanied by an underestimated geopotential ridge and an overestimated upper-level PV. Combined with the high occurrence frequency of MTAs (a proxy for WCBs) in this group, these systematic biases indicate a clear misrepresentation of WCBs at the time of maximum intensification.
In contrast, strong heating cyclones feature a pronounced overestimation of total column liquid water along the bent-back warm front, a region typically characterised by intense latent heat release. Composite 850 hPa kinematic frontogenesis reveals a more inward spatial configuration of the frontogenetic zone relative to the cyclone centre in the high-latent heating forecast than in the analysis, resulting in a pronounced overestimation of frontogenesis near the centre. This intensification of frontogenesis is associated with the overestimated wind speeds within the CCB/SJ/DI region, which enhance the local kinematic deformation and convergence. To maintain thermal wind balance, this strengthened frontogenesis indicates an intensified secondary circulation, with enhanced ascent on the warm side of the front. The intensified ascent can lead to an increase in condensation, thereby resulting in the observed positive bias in total column liquid water. This overestimation of liquid water points to a possible bias in precipitation efficiency, whereby liquid droplets remain suspended in the atmospheric column rather than precipitating out. This can be exacerbated by limitations of the data assimilation (DA), as liquid water is not directly constrained and the DA relies on indirect adjustments to thermodynamic and kinematic fields.
The biases across different fields features both signs and specific asymmetries with physically coherent spatial structures, indicating that our results are not only due to effects of conditional verification, which is already minimised by choosing a relatively short lead time. We acknowledge, however, that fully disentangling the biases remains difficult.
It remains an open question whether the wind speed overestimation for the CCB/SJ/DI regions in the forecasts reflects a true model bias or a systematic underestimation within the analysis. This bias may arise from the scarcity of high resolution observations over the open ocean, which limits the data assimilation system's ability to resolve localised, high-intensity features such as the CCB and SJ. Consequently, the resulting analysis may represent a smoothed state, failing to capture the full magnitude of the wind field, thus making a potentially physically more realistic forecast appear as a positive bias. Addressing this uncertainty requires targeted observations, such as those planned for the upcoming NAWDIC (North Atlantic Waveguide and Downstream Impact Campaign; Raveh-Rubin et al., 2025), which aims to provide detailed observations. How the bias in this area may change with increasing both model resolution as well as observations requires further investigation.
Data from ERA5 (Hersbach et al., 2020) are available at https://doi.org/10.24381/cds.adbb2d47. Cyclone tracks based on ERA5 data are openly available at https://doi.org/10.11582/2024.00023. The Python library dynlib (Spensberger and Marcheggiani, 2024) is available https://doi.org/10.11582/2024.00023.
The supplement related to this article is available online at https://doi.org/10.5194/wcd-7-1117-2026-supplement.
QY performed data analyses and prepared the paper. CS, LM and TS contributed to the interpretation of the results and to the writing of the paper.
The contact author has declared that none of the authors has any competing interests.
Publisher's note: Copernicus Publications remains neutral with regard to jurisdictional claims made in the text, published maps, institutional affiliations, or any other geographical representation in this paper. The authors bear the ultimate responsibility for providing appropriate place names. Views expressed in the text are those of the authors and do not necessarily reflect the views of the publisher.
We thank ECMWF for making the reanalysis data openly available. This work was carried out as part of the BALMCAST project.
This research has been supported by the Research Council of Norway (Norges Forskningsråd, grant no. 324081).
This paper was edited by Juerg Schmidli and reviewed by two anonymous referees.
Balasubramanian, G. and Yau, M.: The effects of convection on a simulated marine cyclone, J. Atmos. Sci., 51, 2397–2417, https://doi.org/10.1175/1520-0469(1994)051<2397:teocoa>2.0.co;2, 1994.
Baumgart, M., Riemer, M., Wirth, V., Teubler, F., and Lang, S. T.: Potential vorticity dynamics of forecast errors: A quantitative case study, Mon. Weather Rev., 146, 1405–1425, https://doi.org/10.1175/mwr-d-17-0196.1, 2018.
Baumgart, M., Ghinassi, P., Wirth, V., Selz, T., Craig, G. C., and Riemer, M.: Quantitative view on the processes governing the upscale error growth up to the planetary scale using a stochastic convection scheme, Mon. Weather Rev., 147, 1713–1731, https://doi.org/10.1175/mwr-d-18-0292.1, 2019.
Binder, H., Boettcher, M., Joos, H., and Wernli, H.: The role of warm conveyor belts for the intensification of extratropical cyclones in Northern Hemisphere winter, J. Atmos. Sci., 73, 3997–4020, https://doi.org/10.1175/jas-d-15-0302.1, 2016.
Binder, H., Boettcher, M., Joos, H., Sprenger, M., and Wernli, H.: Vertical cloud structure of warm conveyor belts – a comparison and evaluation of ERA5 reanalysis, CloudSat and CALIPSO data, Weather Clim. Dynam., 1, 577–595, https://doi.org/10.5194/wcd-1-577-2020, 2020.
Bosart, L. F.: The Presidents' Day snowstorm of 18–19 February 1979: A subsynoptic-scale event, Mon. Weather Rev., 109, 1542–1566, https://doi.org/10.1175/1520-0493(1981)109<1542:tpdsof>2.0.co;2, 1981.
Browning, K.: The dry intrusion perspective of extra-tropical cyclone development, Meteorol. Appl., 4, 317–324, https://doi.org/10.1017/s1350482797000613, 1997.
Browning, K.: The sting at the end of the tail: Damaging winds associated with extratropical cyclones, Q. J. Roy. Meteorol. Soc., 130, 375–399, https://doi.org/10.1256/qj.02.143, 2004.
Browning, K. A.: Organization of clouds and precipitation in extratropical cyclones, in: Extratropical cyclones: the Erik Palmén memorial volume, pp. 129–153, Springer, https://doi.org/10.1007/978-1-944970-33-8_8, 1990.
Catto, J. L. and Pfahl, S.: The importance of fronts for extreme precipitation, J. Geophys. Res.-Atmos., 118, 10–791, https://doi.org/10.1002/jgrd.50852, 2013.
Catto, J. L. and Raveh-Rubin, S.: Climatology and dynamics of the link between dry intrusions and cold fronts during winter. Part I: global climatology, Clim. Dynam., 53, 1873–1892, https://doi.org/10.1007/s00382-019-04745-w, 2019.
Catto, J. L., Shaffrey, L. C., and Hodges, K. I.: Can climate models capture the structure of extratropical cyclones?, J. Climate, 23, 1621–1635, https://doi.org/10.1175/2009jcli3318.1, 2010.
Clark, P. A. and Gray, S. L.: Sting jets in extratropical cyclones: a review, Q. J. Roy. Meteorol. Soc., 144, 943–969, https://doi.org/10.1002/qj.3267, 2018.
Coronel, B., Ricard, D., Rivière, G., and Arbogast, P.: Role of moist processes in the tracks of idealized midlatitude surface cyclones, J. Atmos. Sci., 72, 2979–2996, https://doi.org/10.1175/jas-d-14-0337.1, 2015.
Crezee, B., Joos, H., and Wernli, H.: The microphysical building blocks of low-level potential vorticity anomalies in an idealized extratropical cyclone, J. Atmos. Sci., 74, 1403–1416, https://doi.org/10.1175/jas-d-16-0260.1, 2017.
Davies, H. C. and Didone, M.: Diagnosis and dynamics of forecast error growth, Mon. Weather Rev., 141, 2483–2501, https://doi.org/10.1175/mwr-d-12-00242.1, 2013.
Davis, C. A., Stoelinga, M. T., and Kuo, Y.-H.: The integrated effect of condensation in numerical simulations of extratropical cyclogenesis, Mon. Weather Rev., 121, 2309–2330, https://doi.org/10.1175/1520-0493(1993)121<2309:tieoci>2.0.co;2, 1993.
ECMWF: IFS Documentation CY41R2 – Part II: Data Assimilation, Tech. rep., European Centre for Medium-Range Weather Forecasts, Reading, UK, https://www.ecmwf.int/en/elibrary/16648-part-ii-data-assimilation (last access: 12 March 2026), 2016.
Eliassen, A.: On the vertical circulation in frontal zones, Geofysiske Publikasjoner, 24, 147–160, https://geofysikk.org/NGF/GeoPub/NGF_GP_Vol24_no4.pdf (last access: 7 June 2026), 1962.
Forbes, R. M.: Microphysics: From intricacy to simplicity, in: ECMWF Seminar on Parametrization of Subgrid Physical Processes, pp. 129–148, https://www.ecmwf.int/sites/default/files/elibrary/2009/9442-microphysics-intricacy-simplicity.pdf (last access: 20 May 2026), 2008.
Froude, L. S., Bengtsson, L., and Hodges, K. I.: The predictability of extratropical storm tracks and the sensitivity of their prediction to the observing system, Mon. Weather Rev., 135, 315–333, https://doi.org/10.1175/mwr3274.1, 2007.
Geer, A., Ahlgrimm, M., Bechtold, P., Bonavita, M., Bormann, N., English, S., Fielding, M., Forbes, R., Hogan, R., Hólm, E., Janisková, M., Lonitz, K., Lopez, P., Matricardi, M., Sandu, I., and Weston, P.: Assimilating observations sensitive to cloud and precipitation, European Centre for Medium-Range Weather Forecasts, https://doi.org/10.21957/sz7cr1dym, 2017.
Gentile, E. S. and Gray, S. L.: Attribution of observed extreme marine wind speeds and associated hazards to midlatitude cyclone conveyor belt jets near the British Isles, Int. J. Climatol., 43, 2735–2753, https://doi.org/10.1002/joc.7999, 2023.
Grams, C. M., Magnusson, L., and Madonna, E.: An atmospheric dynamics perspective on the amplification and propagation of forecast error in numerical weather prediction models: A case study, Q. J. Roy. Meteoro. Soc., 144, 2577–2591, https://doi.org/10.1002/qj.3353, 2018.
Gray, S. L., Dunning, C., Methven, J., Masato, G., and Chagnon, J. M.: Systematic model forecast error in Rossby wave structure, Geophys. Res. Lett., 41, 2979–2987, https://doi.org/10.1002/2014gl059282, 2014.
Gyakum, J. R.: On the evolution of the QE II storm. II: Dynamic and thermodynamic structure, Mon. Weather Rev., 111, 1156–1173, https://doi.org/10.1175/1520-0493(1983)111<1156:oteoti>2.0.co;2, 1983.
Harvey, B., Methven, J., Sanchez, C., and Schäfler, A.: Diabatic generation of negative potential vorticity and its impact on the North Atlantic jet stream, Q. J. Roy. Meteorol. Soc., 146, 1477–1497, https://doi.org/10.1002/qj.3747, 2020.
Hersbach, H., Bell, B., Berrisford, P., Hirahara, S., Horányi, A., Muñoz-Sabater, J., Nicolas, J., Peubey, C., Radu, R., Schepers, D., Simmons, A., Soci, C., Abdalla, S., Abellan, X., Balsamo, G., Bechtold, P., Biavati, G., Bidlot, J., Bonavita, M., De Chiara, G., Dahlgren, P., Dee, D., Diamantakis, M., Dragani, R., Flemming, J., Forbes, R., Fuentes, M., Geer, A., Haimberger, L., Healy, S., Hogan, R. J., Hólm, E., Janisková, M., Keeley, S., Laloyaux, P., Lopez, P., Lupu, C., Radnoti, G., de Rosnay, P., Rozum, I., Vamborg, F., Villaume, S., and Thépaut, J.-N.: The ERA5 global reanalysis, Q. J. Roy. Meteorol. Soc., 146, 1999–2049, https://doi.org/10.1002/qj.3803, 2020.
Holton, J. R. and Hakim, G. J.: An introduction to dynamic meteorology, vol. 88, Academic press, https://doi.org/10.1016/C2009-0-63394-8, 2013.
Hoskins, B. J. and Hodges, K. I.: New perspectives on the Northern Hemisphere winter storm tracks, J. Atmos. Sci., 59, 1041–1061, https://doi.org/10.1175/1520-0469(2002)059<1041:npotnh>2.0.co;2, 2002.
Joos, H. and Forbes, R. M.: Impact of different IFS microphysics on a warm conveyor belt and the downstream flow evolution, Q. J. Roy. Meteorol. Soc., 142, 2727–2739, https://doi.org/10.1002/qj.2863, 2016.
Klocke, D. and Rodwell, M.: A comparison of two numerical weather prediction methods for diagnosing fast-physics errors in climate models, Q. J. Roy. Meteorol. Soc., 140, 517–524, https://doi.org/10.1002/qj.2172, 2014.
Marcheggiani, A., Dacre, H., Spensberger, C., and Spengler, T.: Weather features drive free-tropospheric baroclinicity variability in the North Atlantic storm track, Q. J. Roy. Meteorol. Soc., p. e5061, https://doi.org/10.1002/qj.5061, 2025.
Martínez-Alvarado, O. and Plant, R.: Parametrized diabatic processes in numerical simulations of an extratropical cyclone, Q. J. Roy. Meteorol. Soc., 140, 1742–1755, https://doi.org/10.1002/qj.2254, 2014.
Martínez-Alvarado, O., Baker, L. H., Gray, S. L., Methven, J., and Plant, R. S.: Distinguishing the cold conveyor belt and sting jet airstreams in an intense extratropical cyclone, Mon. Weather Rev., 142, 2571–2595, https://doi.org/10.1175/mwr-d-13-00348.1, 2014a.
Martínez-Alvarado, O., Joos, H., Chagnon, J., Boettcher, M., Gray, S., Plant, R., Methven, J., and Wernli, H.: The dichotomous structure of the warm conveyor belt, Q. J. Roy. Meteorol. Soc., 140, 1809–1824, https://doi.org/10.1002/qj.2276, 2014b.
Martínez-Alvarado, O., Madonna, E., Gray, S. L., and Joos, H.: A route to systematic error in forecasts of Rossby waves, Q. J. Roy. Meteorol. Soc., 142, 196–210, https://doi.org/10.1002/qj.2645, 2016.
Miller, J. E.: On the concept of frontogenesis, J. Meteorol., 5, 169–171, https://doi.org/10.1175/1520-0469(1948)005<0169:OTCOF>2.0.CO;2, 1948.
Murray, R. J. and Simmonds, I.: A numerical scheme for tracking cyclone centres from digital data. Part I: Development and operation of the scheme, Aust. Meteorol. Mag., 39, 155–166, https://doi.org/10.1071/es91020, 1991a.
Murray, R. J. and Simmonds, I.: A numerical scheme for tracking cyclone centres from digital data. Part II: Application to January and July general circulation model simulations, Aust. Meteorol. Mag., 39, 167–180, https://doi.org/10.1071/es91021, 1991b.
Oertel, A., Boettcher, M., Joos, H., Sprenger, M., and Wernli, H.: Potential vorticity structure of embedded convection in a warm conveyor belt and its relevance for large-scale dynamics, Weather Clim. Dynam., 1, 127–153, https://doi.org/10.5194/wcd-1-127-2020, 2020.
Papritz, L. and Spengler, T.: Analysis of the slope of isentropic surfaces and its tendencies over the North Atlantic, Q. J. Roy. Meteorol. Soc., 141, 3226–3238, https://doi.org/10.1002/qj.2605, 2015.
Pfahl, S., Schwierz, C., Croci-Maspoli, M., Grams, C. M., and Wernli, H.: Importance of latent heat release in ascending air streams for atmospheric blocking, Nat. Geosci., 8, 610–614, https://doi.org/10.1038/ngeo2487, 2015.
Pinto, J. G., Karremann, M. K., Born, K., Della-Marta, P. M., and Klawa, M.: Loss potentials associated with European windstorms under future climate conditions, Clim. Res., 54, 1–20, https://doi.org/10.3354/cr01111, 2012.
Raveh-Rubin, S.: Dry intrusions: Lagrangian climatology and dynamical impact on the planetary boundary layer, J. Climate, 30, 6661–6682, https://doi.org/10.1175/jcli-d-16-0782.1, 2017.
Raveh-Rubin, S., Quinting, J., Kirsch, B., Oertel, A., Ramos, A., Schaefler, A., and Grams, C.: The North Atlantic Waveguide, Dry Intrusion, and Downstream Impact Campaign (NAWDIC), Tech. rep., Copernicus Meetings, https://doi.org/10.5194/ems2025-390, 2025.
Robertson, F. and Smith, P.: The impact of model moist processes on the energetics of extratropical cyclones, Mon. Weather Rev., 111, 723–744, https://doi.org/10.1175/1520-0493(1983)111<0723:tiommp>2.0.co;2, 1983.
Rodwell, M. and Palmer, T.: Using numerical weather prediction to assess climate models, Q. J. Roy. Meteorol. Soc., 133, 129–146, https://doi.org/10.1002/qj.23, 2007.
Sánchez, C., Methven, J., Gray, S., and Cullen, M.: Linking rapid forecast error growth to diabatic processes, Q. J. Roy. Meteorol. Soc., 146, 3548–3569, https://doi.org/10.1002/qj.3861, 2020.
Sawyer, J. S.: The vertical circulation at meteorological fronts and its relation to frontogenesis, P. Roy. Soc. London A, 234, 346–362, https://doi.org/10.1098/rspa.1956.0039, 1956.
Schultz, D. M.: Reexamining the cold conveyor belt, Mon. Weather Rev., 129, 2205–2225, https://doi.org/10.1175/1520-0493(2001)129<2205:rtccb>2.0.co;2, 2001.
Spensberger, C.: Dynlib: A library of diagnostics, feature detection algorithms, plotting and convenience functions for dynamic meteorology, Zenodo, https://doi.org/10.5281/zenodo.10471187, 2024.
Spensberger, C. and Marcheggiani, A.: ERA5 cyclone tracks, NIRD RDA, https://doi.org/10.11582/2024.00023, 2024.
Spensberger, C., Konstali, K., and Spengler, T.: Moisture transport axes: a unifying definition for tropical moisture exports, atmospheric rivers, and warm moist intrusions, Weather Clim. Dynam., 6, 431–446, https://doi.org/10.5194/wcd-6-431-2025, 2025.
Stoelinga, M. T.: A potential vorticity-based study of the role of diabatic heating and friction in a numerically simulated baroclinic cyclone, Mon. Weather Rev., 124, 849–874, https://doi.org/10.1175/1520-0493(1996)124<0849:apvbso>2.0.co;2, 1996.
Tsopouridis, L., Spengler, T., and Spensberger, C.: Smoother versus sharper Gulf Stream and Kuroshio sea surface temperature fronts: effects on cyclones and climatology, Weather Clim. Dynam., 2, 953–970, https://doi.org/10.5194/wcd-2-953-2021, 2021a.
Tsopouridis, L., Spensberger, C., and Spengler, T.: Characteristics of cyclones following different pathways in the Gulf Stream region, Quarterly Journal of the Royal Meteorological Society, 147, 392–407, https://doi.org/10.1002/qj.3924, 2021b.
Vaughan, G., Methven, J., Anderson, D., Antonescu, B., Baker, L., Baker, T., Ballard, S., Bower, K., Brown, P., Chagnon, J., Choularton, T. W., Chylik, J., Connolly, P. J., Cook, P. A., Cotton, R. J., Crosier, J., Dearden, C., Dorsey, J. R., Frame, T. H. A., Gallagher, M. W., Goodliff, M., Gray, S. L., Harvey, B. J., Knippertz, P., Lean, H. W., Li, D., Lloyd, G., Martínez-Alvarado, O., Nicol, J., Norris, J., Öström, E., Owen, J., Parker, D. J., Plant, R. S., Renfrew, I. A., Roberts, N. M.,Rosenberg, P., Rudd, A. C., Schultz, D. M., Taylor, J. P., Trzeciak, T., Tubbs, R., Vance, A. K., van Leeuwen, P. J., Wellpott, A., and Woolley, A.: Cloud banding and winds in intense European cyclones: Results from the DIAMET project, B. Am. Meteorol. Soc., 96, 249–265, https://doi.org/10.1175/bams-d-13-00238.1, 2015.
Weijenborg, C. and Spengler, T.: Diabatic heating as a pathway for cyclone clustering encompassing the extreme storm Dagmar, Geophys. Res. Lett., 47, e2019GL085777, https://doi.org/10.1029/2019gl085777, 2020.
Wernli, H.: A Lagrangian-based analysis of extratropical cyclones. II: A detailed case-study, Q. J. Roy. Meteorol. Soc., 123, 1677–1706, https://doi.org/10.1002/qj.49712354211, 1997.
Wernli, H. and Gray, S. L.: The importance of diabatic processes for the dynamics of synoptic-scale extratropical weather systems – a review, Weather Clim. Dynam., 5, 1299–1408, https://doi.org/10.5194/wcd-5-1299-2024, 2024.
Wimmer, M., Rivière, G., Arbogast, P., Piriou, J.-M., Delanoë, J., Labadie, C., Cazenave, Q., and Pelon, J.: Diabatic processes modulating the vertical structure of the jet stream above the cold front of an extratropical cyclone: sensitivity to deep convection schemes, Weather and Climate Dynamics, 3, 863–882, https://doi.org/10.5194/wcd-3-863-2022, 2022.
Xie, S., Ma, H.-Y., Boyle, J. S., Klein, S. A., and Zhang, Y.: On the correspondence between short- and long-time-scale systematic errors in CAM4/CAM5 for the Year of Tropical Convection, J. Climate, 25, 7937–7955, https://doi.org/10.1175/JCLI-D-12-00134.1, 2012.
Yu, Q., Spensberger, C., Magnusson, L., and Spengler, T.: Forecast Errors Attributed to Synoptic Features, Meteorol. Appl., 32, e70093, https://doi.org/10.1002/met.70093, 2025.