
the Creative Commons Attribution 4.0 License.
the Creative Commons Attribution 4.0 License.
 | 18 Sep 2026
Subseasonal predictability and Rossby wave dynamics of blocking high during transitional seasons: insights from three successive events in May–June 2023
Zhixiang Li

Yimin Liu
Extended-range prediction during the transitional seasons remains particularly challenging due to the volatile large-scale circulation background. This study investigates the dynamical linkages, Rossby wave characteristics, and subseasonal predictability of three successive atmospheric blocking episodes over Canada, the Ural Mountains, and Europe in May–June 2023, which contributed to severe Canadian wildfires, persistent East Asian precipitation, and European heatwaves. The results indicate that these blocking episodes are not independent but interconnected through downstream energy dispersion of Rossby waves. Spatiotemporal local diagnostics of phase speed, amplitude, and zonal wavenumber further reveal that all episodes are dominated by slowly propagating, large-amplitude planetary-scale Rossby waves in the troposphere, thereby contributing to the exceptional persistence and large spatial extent of the surface weather extremes. Day-to-day evolution shows abrupt transitions during blocking onset from an eastward-propagating synoptic-scale small-amplitude regime to a quasi-stationary or westward-propagating planetary-scale large-amplitude regime, with the reverse during blocking's decaying stage. ECMWF subseasonal-to-seasonal (S2S) ensemble forecasts exhibit high predictability of 500 hPa geopotential height anomalies at 15–19 d lead times for these three blocking episodes. However, the S2S forecasts underestimate the amplification of wave amplitude and spatial scale, particularly for the Canadian and European blockings. For all episodes, skillful predictions beyond two weeks depend on the successful prediction of upstream quasi-stationary troughs and the associated downstream energy dispersion of quasi-stationary Rossby waves. In contrast, poorly performing members are characterized by the propagation of synoptic-scale waves along the subtropical or mid-latitude jet. Moreover, the Canadian blocking provides a window of opportunity for the extended predictability of the subsequent Ural and European blockings through their dynamical interconnections. These findings underscore that successful prediction of upstream Rossby wave propagation is crucial for the subseasonal predictability of persistent blocking.
- Article
(14130 KB) - Full-text XML
- BibTeX
- EndNote


The transitional seasons (spring and autumn) between winter and summer are typically short in duration and associated with abrupt change in general circulation over the Northern Hemisphere (Yeh et al., 1959; Bordoni and Schneider, 2008; Yao et al., 2026). As such, the extended-range prediction (or subseasonal-to-seasonal, S2S prediction) during the transitional seasons is particularly difficult due to the volatile background of large-scale circulation (Breeden et al., 2022). However, weather conditions during the transitional seasons can be disastrous, as evidenced by extreme events that swept the Northern Hemisphere during May–June 2023, such as the wildfires in Canada (Jain et al., 2024; Byrne et al., 2024; Fig. 1a and b), floods in Italy (https://www.eumetsat.int/european-state-climate-2023, last access: 8 September 2026; Fig. 1b), persistent precipitation in East Asia in late May (Gao and Gao, 2023; Fig. 1d), and heatwave in Northwest Europe in June (Berthou et al., 2024; Fig. 1e and f).
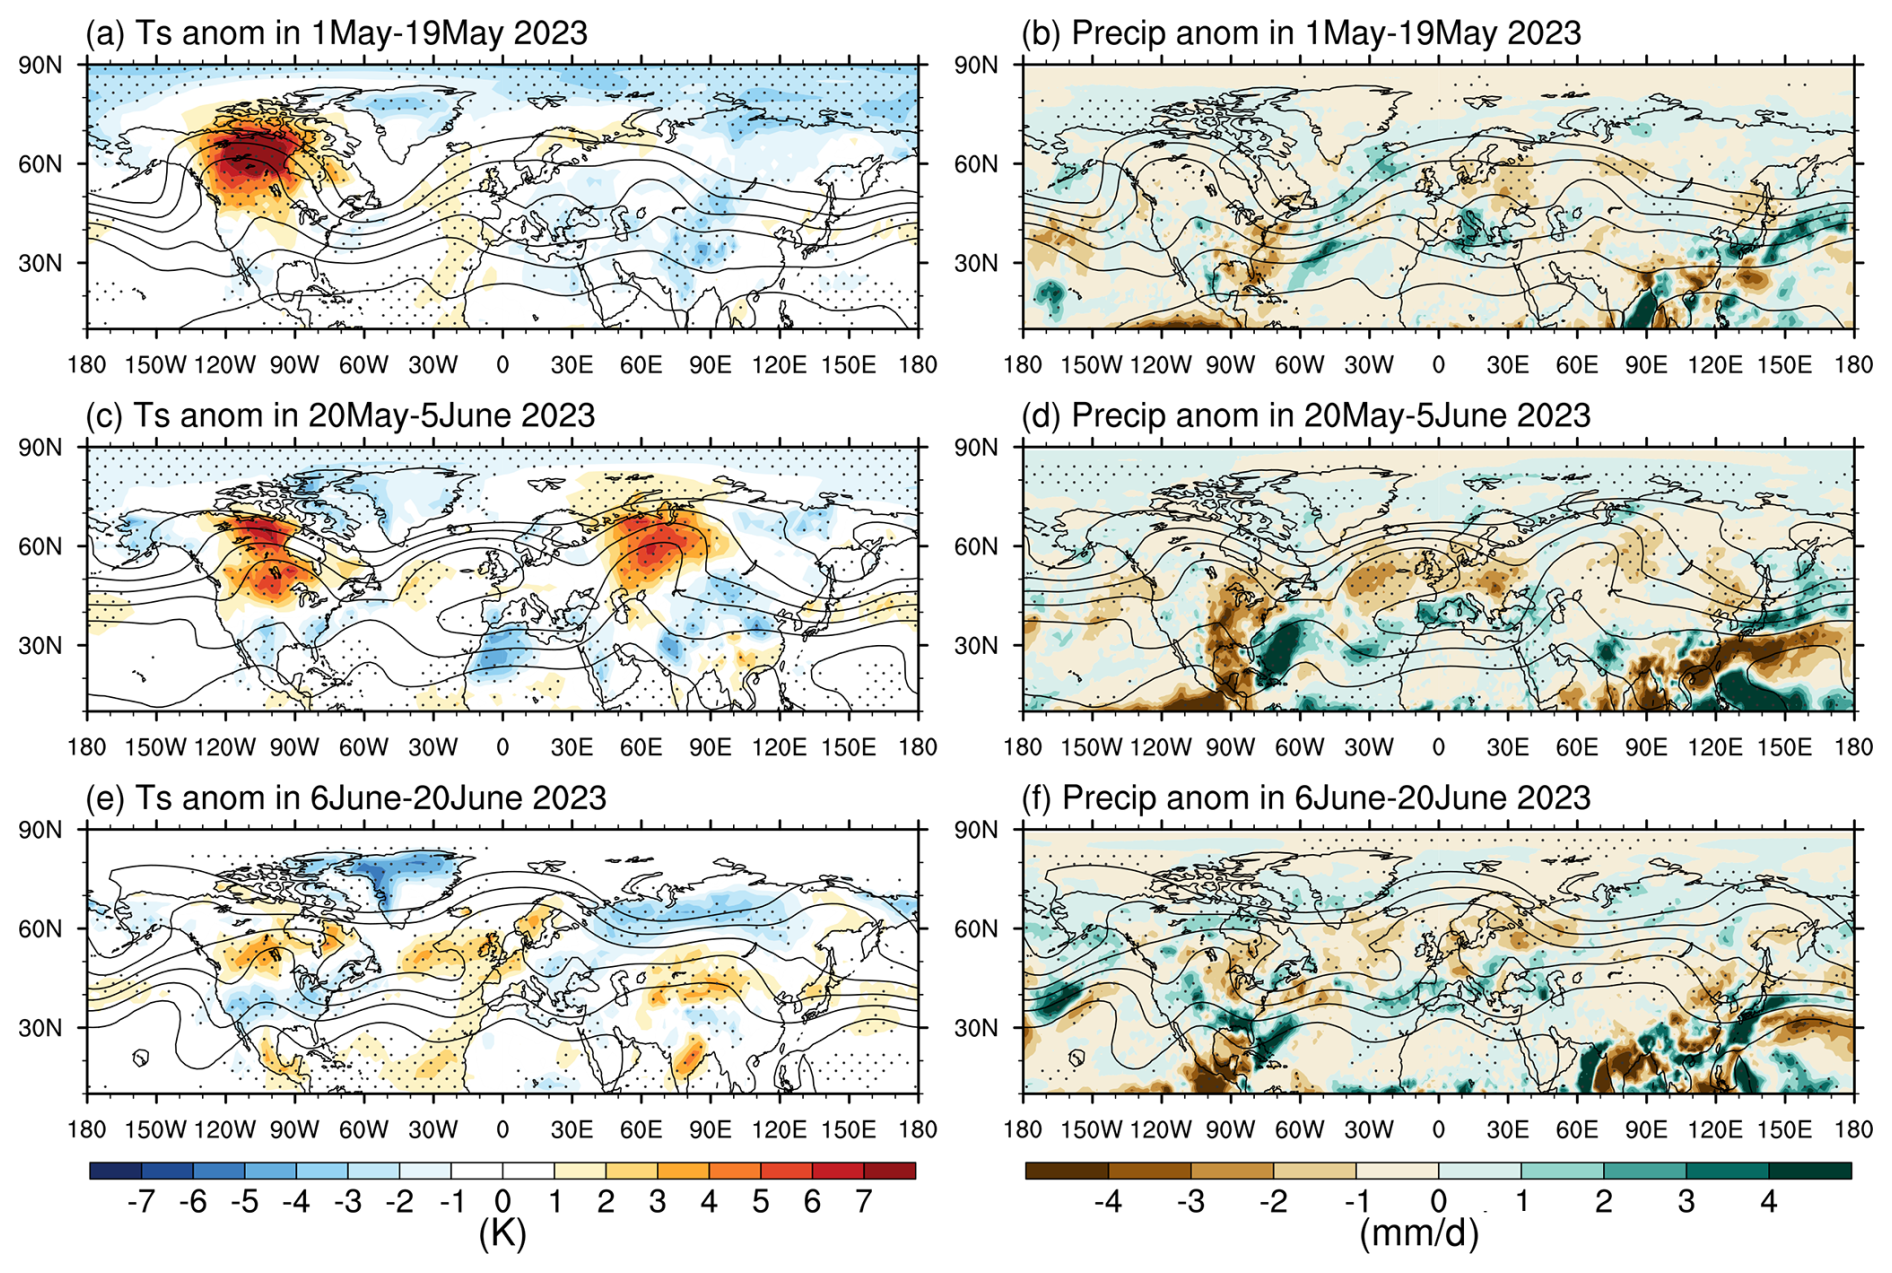
Figure 1Anomalies of surface temperature (shading; left panels, a, c, and e; units: K) and precipitation (shading; right panels, b, d, and f; units: mm d−1) during three successive episodes in 2023: 1–19 May (a, b), 20 May–5 June (c, d), and 6–20 June (e, f). Stippling indicates regions where the anomalies of surface temperature or precipitation exceed 1 standard deviation (1σ). Solid black contours show the corresponding time-mean 500 hPa geopotential height (Z500).
Previous studies have shown that these extreme events were associated with regional persistent anticyclones or blocking in the troposphere (contours in Fig. 1). Specifically, the Canadian blocking is suggested to enhance surface temperature and vapor pressure deficit while suppressing precipitation and soil moisture, thereby promoting severe Canadian wildfires (Barnes et al., 2025; Luo et al., 2025). The Ural ridge and associated East Asian trough are widely considered to lead southward cold-air transport, thereby favoring anomalous precipitation in East Asia (Tao, 1980; Diao et al., 2023). The European blocking contributed to the Northwest Europe heatwave via sustained subsidence and clear skies, further amplified by marine heatwave feedbacks (Berthou et al., 2024). Beyond these specific events, the dynamical linkages between blocking and heatwaves (Black et al., 2004; Bartusek et al., 2022; White et al., 2023), cold surges (Ding et al., 2008; Yao et al., 2023), and floods (Lau and Kim, 2012; Martius et al., 2013; Xu et al., 2023) have been revealed, but research has focused on specific regions and solstice seasons (for reviews, see Woollings et al., 2018; Lupo et al., 2021; Kautz et al., 2022; Wang et al., 2026). Therefore, understanding the dynamics and predictability of the persistent circulation anomalies during transitional seasons is not only scientifically challenging, but also societally pivotal. To address this issue, we present a study on the dynamical mechanisms and subseasonal predictability of three successive high-impact blocking events in May–June 2023, with special attention to their potential dynamical interconnections from a global perspective.
Atmospheric blocking represents one of the most prominent modes of low-frequency variability in the extratropical troposphere. Several theories have been proposed for the dynamical mechanisms of blocking. For example, Pelly and Hoskins (2003a) developed a wave-breaking theory, Luo et al. (2014) proposed a nonlinear multiscale interaction theory, and Nakamura and Huang (2018) introduced a local finite-amplitude wave activity framework. Comparative discussions of these theories can be found in Woollings et al. (2018) and Lupo (2021). From the perspective of wave propagation, blocking formation can be understood as the process by which a high-pressure ridge becomes quasi-stationary (Yeh et al., 1962). Using the nonlinear multiscale interaction model, Luo et al. (2019) and Zhang et al. (2025) investigated the movement features of high-pressure ridges throughout the life cycle of blocking. They found that when blocking is strong and the meridional potential vorticity gradient is weak, the system exhibits westward movement and slower decay. Furthermore, owing to the planetary-scale nature of blocking circulation (Cheung et al., 2013; Luo et al., 2014), the spatial scale of blocking has also been suggested as a potential impact factor of phase speed changes (Yeh et al., 1962). More recently, van Mourik et al. (2025) found that westward-moving blocks have larger size compared to eastward-moving blocks. The scale effect, which means that a larger spatial scale leads to enhanced westward propagation relative to the eastward zonal mean flow for a given disturbance amplitude (Hoskins et al., 1985), provides an intuitive explanation. Therefore, it is worthwhile to analyze the relationship between the day-to-day evolution of blocking amplitude and wavenumber and the associated changes in phase speed.
Another important aspect of the wave propagation perspective is its close connection to weather extremes. Using Fourier decomposition to derive the mid-latitude average Rossby wave phase speed, previous studies have revealed the linkage between low phase speeds and both extreme surface temperatures (Coumou et al., 2014; Kornhuber et al., 2019) and the occurrence of blocking (Riboldi et al., 2020). However, because blocking and most weather extremes are spatiotemporally localized phenomena, this inevitably raises the need for diagnostic methods capable of quantifying wave amplitudes and phase speeds with high spatiotemporal resolution. Recently, a Hilbert transform-based method has been developed to quantitatively diagnose local Rossby wave parameters (Fragkoulidis and Wirth, 2020; Li et al., 2025). This approach enables direct calculation of the time-mean as well as the day-to-day evolution of local phase speed, amplitude, and wavenumber throughout the life cycle of blocking, thereby unraveling the wave propagation characteristics and their links to surface extreme weather. In addition, the stationary wavenumber Ks provides a reference for the zonal scale at which Rossby waves tend to become quasi-stationary under a given background flow (Hoskins and Ambrizzi, 1993) and has recently been used in the studies of quasi-stationary waves (Fei and White, 2025; White and Mareshet Admasu, 2025). Therefore, comparing Ks with our diagnosed wavenumber could provide an additional perspective for understanding the propagating behavior of blocking system.
The subseasonal predictability of blocking remains a major challenge, with potential predictability typically within 2 weeks (Pelly and Hoskins, 2003b; Kautz et al., 2022). It is therefore of interest to evaluate the subseasonal forecast of the ECMWF S2S model for the blocking anticyclones during the transitional season of 2023, and to investigate how subseasonal forecast errors in blocking anticyclones are linked to errors in Rossby wave dynamics. In short, we aim in this study to investigate the dynamical linkages, Rossby wave parameters, and subseasonal predictability of three successive atmospheric blocking episodes in May–June 2023. The remainder of this study is organized as follows. Section 2 describes the data and methods. Section 3 presents observed phenomena from ERA5 Reanalysis and Rossby wave diagnostics, while Sect. 4 investigates the dynamic source of predictability in ECMWF S2S ensemble forecasts. Section 5 provides a summary and discussion.
2.1 Data
In this study, we use zonal wind (u), meridional wind (v) and geopotential height (Z) at 500 hPa from ERA5 reanalysis data (Hersbach et al., 2020) for the period from 1979 to 2023 with a temporal resolution of 6-hourly (daily at 00:00, 06:00, 12:00 and 18:00 UTC) and a horizontal resolution of 2.5° × 2.5°. The Global Precipitation Climatology Project (GPCP) daily precipitation with 1° × 1° spatial resolution from 1997 to 2023 (Huffman et al., 2001) are used to investigate the large-scale precipitation anomalies. Additionally, the daily Z at 500 hPa with a horizontal resolution of 1.5° × 1.5° from the 50-member ensemble of the ECMWF real-time S2S prediction system are utilized. The Z of S2S is interpolated to the same resolution as ERA5 to facilitate the comparison.
We use the ERA5 2.5° × 2.5° resolution rather than its original 0.25° resolution, because the present study focuses on large-scale circulation and Rossby wave dynamics. A very high resolution would introduce small-scale waves that are irrelevant to this study and could lead to physically unreasonable results in the wave parameter diagnosis of blocking circulation (Fragkoulidis and Wirth, 2020; Li et al., 2025).
2.2 Local Wave Parameters Diagnostic Method
The local wave parameters diagnostic method is conducted by applying the Hilbert transform to 6-hourly geopotential height (Fragkoulidis and Wirth, 2020; Li et al., 2025). The convolution-based Hilbert transform of wave signal s at each longitude n is given by,
where
n is the grid-point index along the zonal circle, and m represents the number of grids shifted in the convolution calculation, with the maximum shift M is set to 144, corresponding to the 2.5° × 2.5° horizontal resolution of the dataset. Second, construct the complex signal , and express it in the polar form S=Eeiϕ, where E is the local envelope or amplitude calculated from the polar radius of S, i.e.,
and ϕ is the local phase calculated from the polar angle of S,
By introducing the plane wave hypothesis, the local angular frequency ω and local zonal angular wavenumber k can be obtained from
where notations are standard. Finally, the local wave period T is defined as
while the local zonal phase speed can be obtained from
The reader is referred to Li et al. (2025) for full technical details. The method of Li et al. (2025) identifies physically meaningless results (e.g., negative zonal wavenumbers and neighboring grids) as missing values, thus allowing its application to any input wave signal (e.g., zonal wavenumbers 1–15 Z500 in this study) without the need for specific threshold for amplitude as in Fragkoulidis and Wirth (2020). For clarity, we denote the dimensionless zonal wavenumber (i.e., kacosφ) as k hereafter.
2.3 The Detection of Atmospheric Blocking
The Tibaldi–Molteni blocking index (Tibaldi and Molteni, 1990) is used to identify the timing and locations of large-scale blocking events during May–June 2023. The index is defined based on the reversal of the meridional gradient of Z500,
where ϕN = 80° N + Δ, ϕ0 = 60° N + Δ, ϕS = 40° N + Δ, and Δ = . Large-scale blocking events are defined as those satisfying GHGN < −10 gpm degree−1 and GHGS > 0, with the condition persisting over at least 15° of longitude and for 4 consecutive days.
2.4 Wave Activity Flux and Stationary Wavenumber
In order to reveal the possible dynamical linkages among the three successive blocking episodes, we use wave activity flux (WAF) to indicate the horizontal propagation of quasi-stationary Rossby wave energy, since the vectors of WAF correspond to the direction of local group velocity of quasi-stationary Rossby waves in the WKB limit (Takaya and Nakamura, 2001). The WAF is diagnosed as,
The overbar and primes represent the climatological mean and the anomalies during each episode, respectively. p and ψ denotes the pressure normalized by 1000 hPa and geostrophic stream function, respectively. . The anomalies in this study are calculated as the temporal mean in each episode, with the corresponding climatological mean and linear trend removed. This approach isolates the quasi-stationary waves, as the averaging filters out transient disturbances.
As discussed in the introduction, Ks is used as a reference for the propagating characteristics of blocking systems. Specifically, we investigate whether blocking systems remain quasi-stationary when k ≈ Ks or slightly smaller, retrograde when k < Ks, and propagate eastward when k > Ks. Following Hoskins and Ambrizzi (1993) and Lubis et al. (2024), the stationary wavenumber Ks is defined as
where is the zonal and time mean of 500 hPa zonal wind between 16 April and 30 June 2023, β∗ is the meridional gradient of absolute vorticity in a spherical coordinate system.
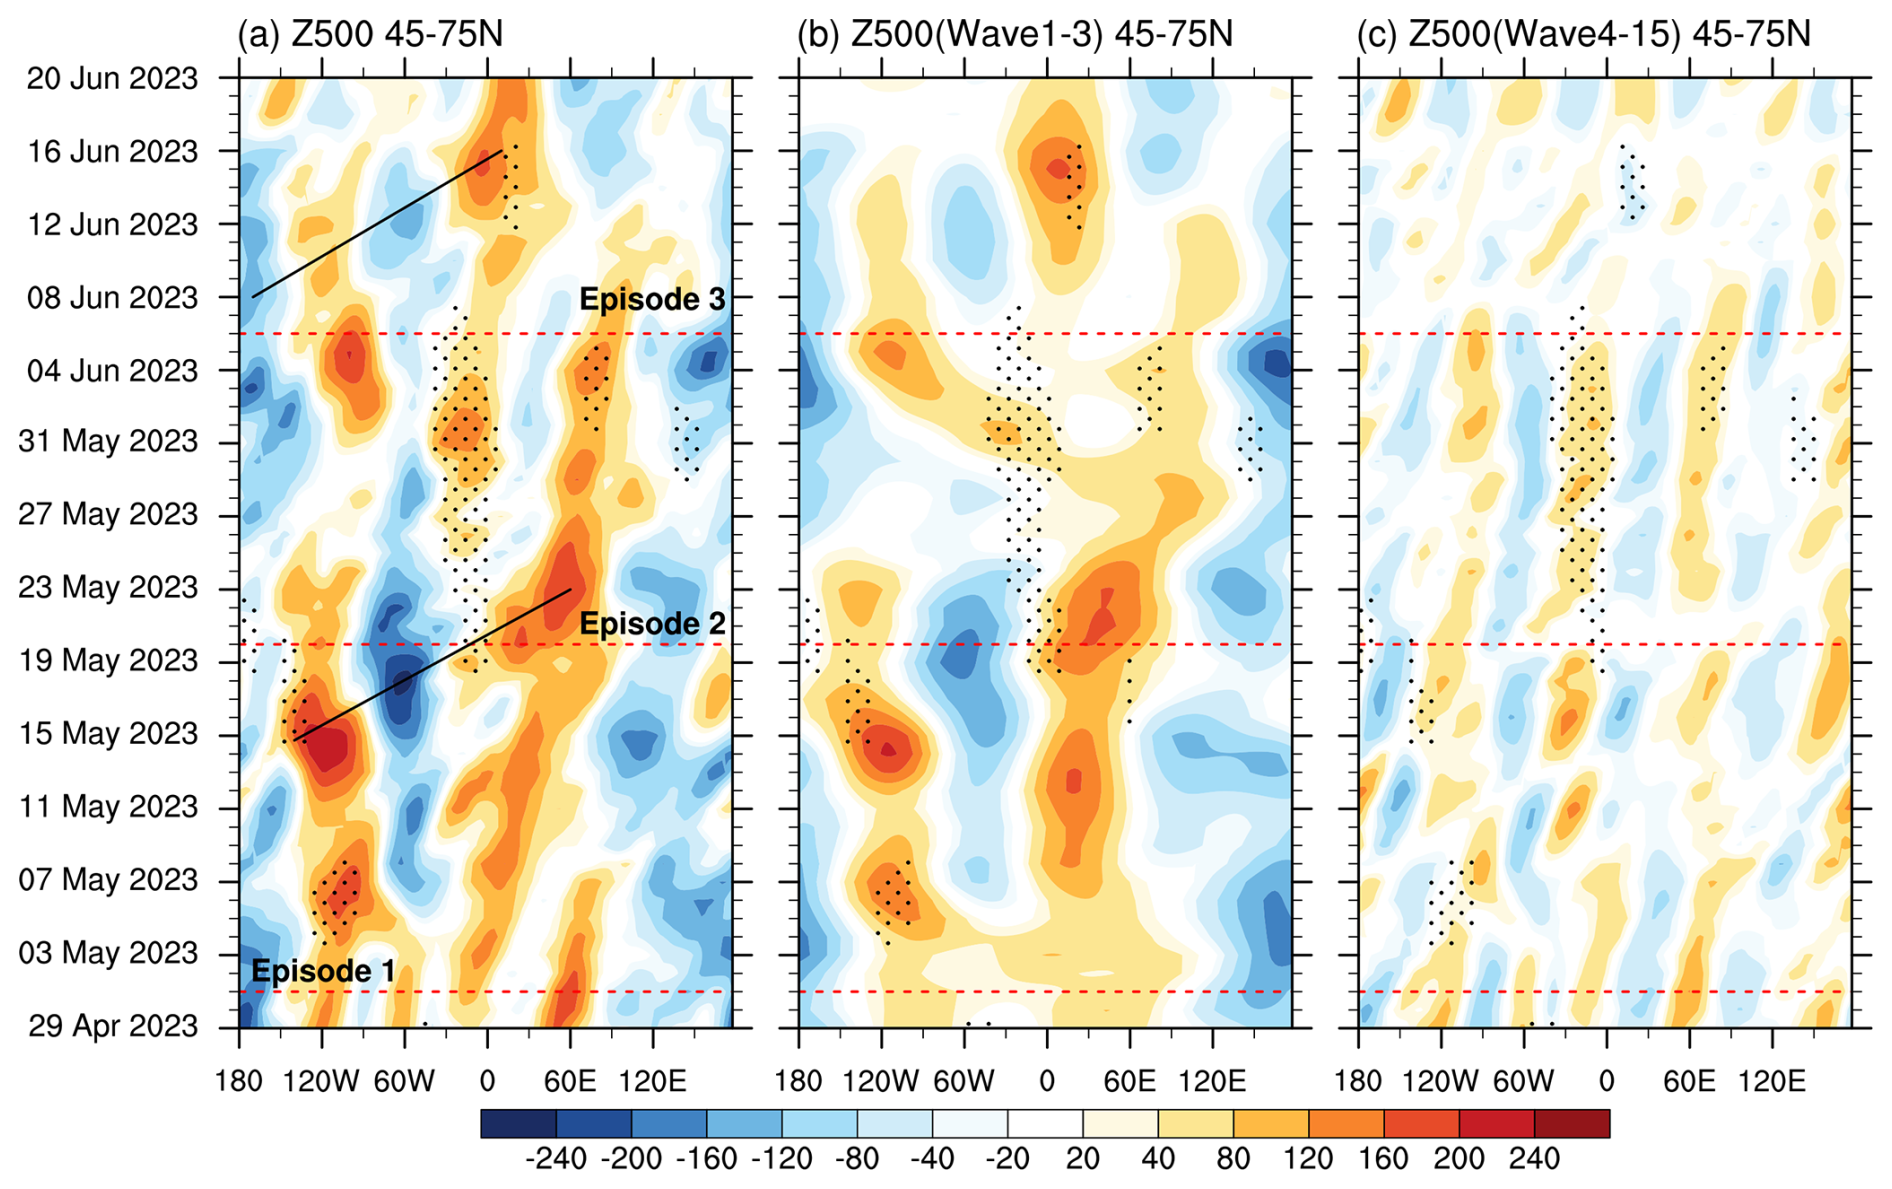
Figure 2Hovmöller diagrams of zonal-mean-removed (a), 1–3-wave (b) and 4–15-wave (c) Z500 (units: gpm) averaged over 45–75° N during three successive episodes in May–June 2023. Black lines in (a) show the downstream development of Rossby waves. Black dots mark the locations of identified large-scale blocking events.
3.1 Evolution of Blocking Episodes and Their Interconnection
Based on the timing of the Canadian blocking (1–19 May), the Ural blocking (quasi-stationary ridge between 20 May and 5 June), and the European blocking in mid-June, corresponding to the occurrences of the Canadian wildfires (May to June), East Asian precipitation anomalies (between 20 May and 5 June), and the European heatwave (June), we divided May–June 2023 into three consecutive episodes (Fig. 2).
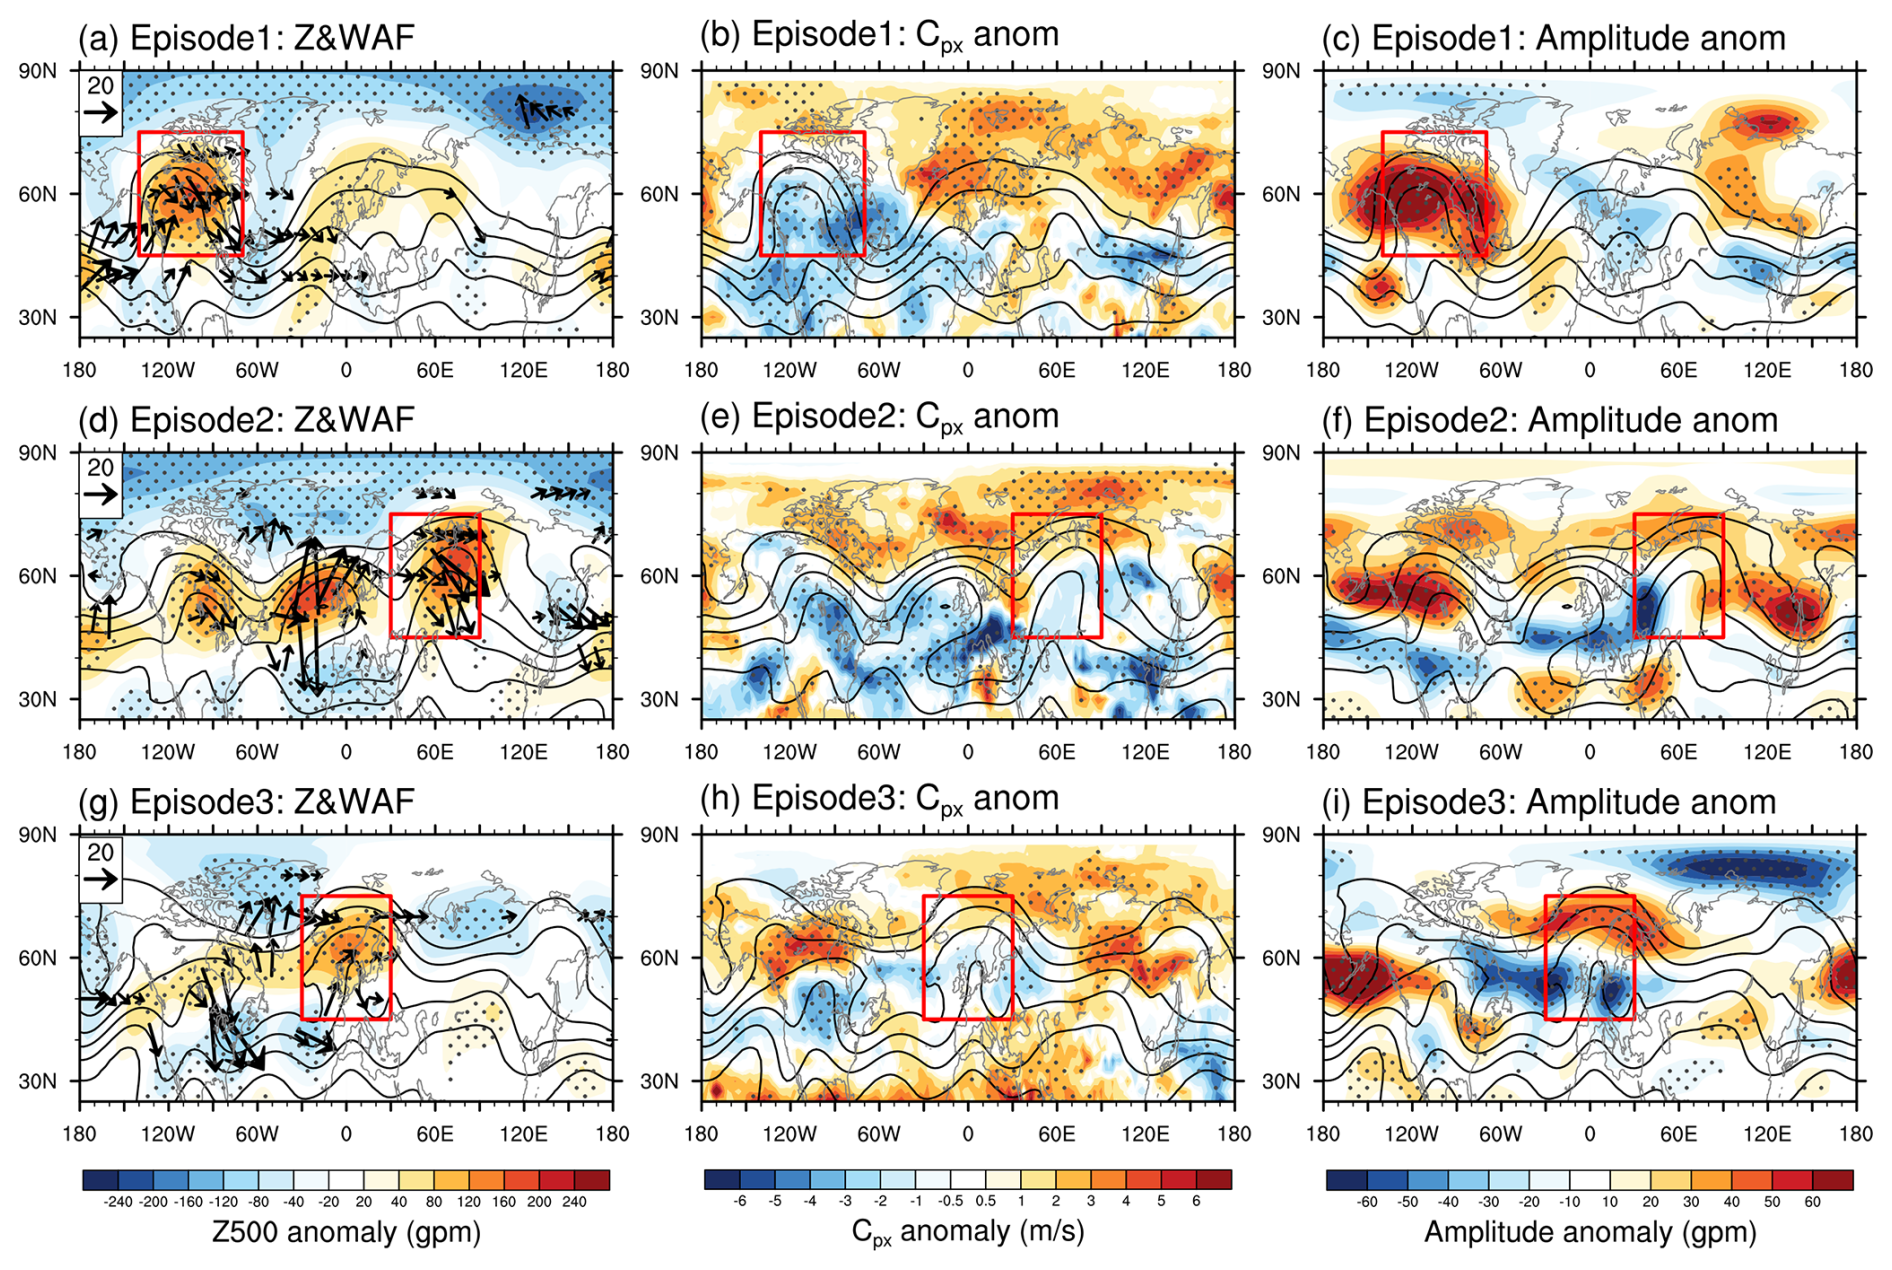
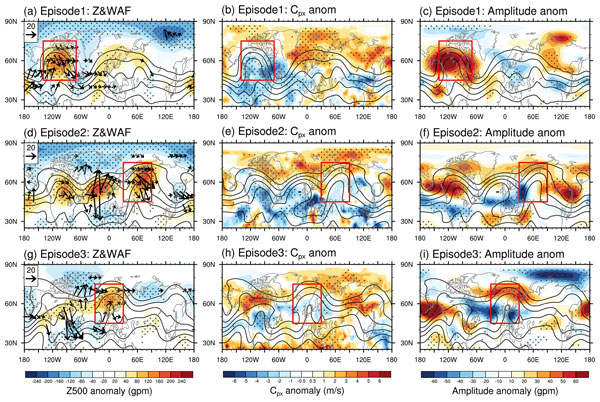
Figure 3Anomalies of Z500 (shading; left panels, a, d, and g; units: gpm), zonal phase speed (shading; middle panels, b, e, and h; units: m s−1), and wave amplitude (shading; right panels, c, f, and i; units: gpm) at 500 hPa during (a–c) episode 1, (d–f) episode 2, and (g–i) episode 3. Stippling indicates anomalies exceeding 1σ. Solid black contours show the corresponding time-mean Z500. Vectors in the left panels represent the wave activity flux at 500 hPa (units: m2 s−2).
During episode 1 (1–19 May 2023), a strong quasi-stationary ridge persists over the Canadian region, accompanied by two large-scale blocking events (dotted regions in Fig. 2a). A quasi-stationary Rossby wave train is evident from the North Pacific to the Mediterranean region, while Canada lies under the control of a strong ridge (Fig. 3a; Luo et al., 2025; Wu et al., 2025). Wave activity flux further shows that quasi-stationary wave energy disperses downstream from the North Pacific toward the Mediterranean, with Canada located in the convergence zone of upstream wave activity flux, favoring the maintenance of the high-pressure ridge (Fig. 3a).
In episode 2 (20 May–5 June 2023), the strong Canadian ridge weakens, while the large-scale blocking events establish over Europe and the Ural Mountains (Fig. 2a). Correspondingly, the energy propagation of quasi-stationary wave weakens in the upstream of Canada (i.e., over the northeastern Pacific), while downstream propagation toward Europe and the Ural Mountains strengthens, thereby favoring the formation and maintenance of the European and Ural ridges. The downstream development is also evident in the Hovmöller diagram in Fig. 2a after the Canadian anticyclone begins to decay and then collapses (black line between 15–23 May).
During episode 3 (6–20 June 2023), both the Canadian and Ural ridges weakened substantially, while a new large-scale blocking event develops over Europe between 11–16 June (Fig. 2a). From the perspective of wave activity flux, the energy propagation originating from North America splits into two branches, one disperses southeastward toward the northwestern Atlantic and the other propagates northeastward via Greenland toward Europe. Europe is situated in the convergence zone of both the northern and southern branches of wave activity flux, which favors the formation of the European blocking. The downstream development over the North America-to-Europe sector is also apparent from the Hovmöller diagram between 8–16 June (Fig. 2a).
3.2 Results from the Local Wave Parameters and Their Links to Surface Weather
Local wave parameter diagnostic method is utilized to further uncover the Cpx, amplitude and zonal wavenumber of Rossby waves during each episode. In this section, we analyze the temporal mean and temporal evolutions of these wave parameters for each episode, with particular focus on their relationships to the blocking circulation and surface weather anomalies.
3.2.1 Episode 1 (1–19 May)
In episode 1, from the northeastern Pacific to the eastern North Atlantic, markedly low phase speeds (Fig. 3b) and strongly enhanced wave amplitudes (Fig. 3c) are observed. Clearly, the slowly moving, large-amplitude ridge is the dominant circulation factor responsible for the Canadian wildfires.
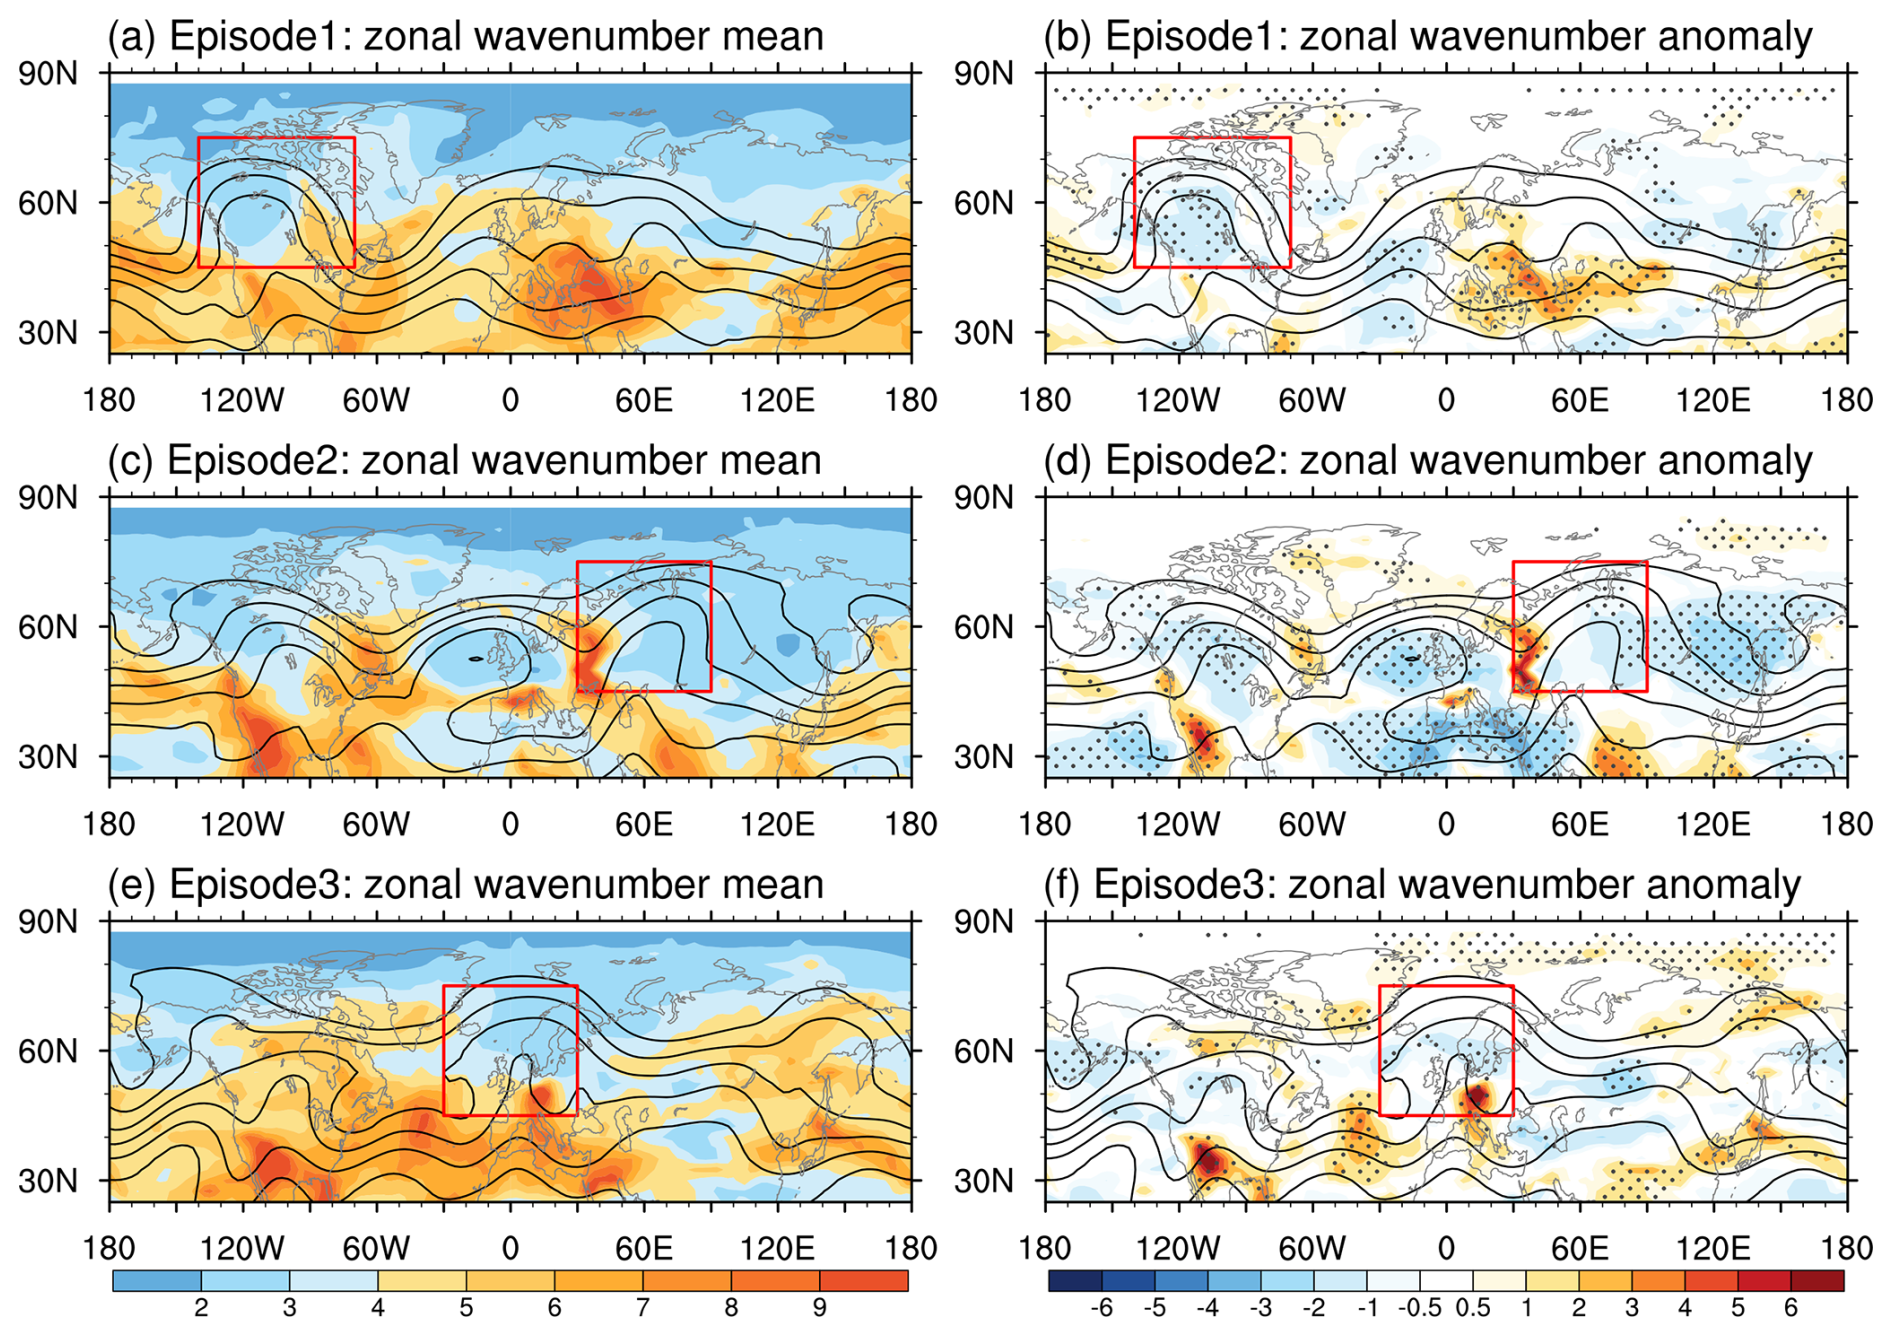
Figure 4Time-mean zonal wavenumber (shading; left panels: a, c, and e) and its anomalies (shading; right panels: b, d, and f) at 500 hPa averaged during (a, b) episode 1, (c, d) episode 2, and (e, f) episode 3. Stippling in the right panels indicates anomalies exceeding 1σ. Black solid contours show the corresponding time-mean Z500.
Local zonal wavenumber diagnostics further indicate that the Canadian blocking is dominated by wavenumbers 2–4 (Fig. 4a), which is lower than its climatological mean by one wavenumber or higher (Fig. 4b). The dominance of planetary-scale waves is also evident in the Hovmöller diagrams, as seen by comparing Fig. 2b and c. Due to the scale effects, the anomalously small wavenumber over Canada contributes to the unusually slow phase speed of the ridge (as shown in Fig. 3b) and enables the long-wave ridge to maintain a quasi-stationary state. The planetary-scale blocking circulation also contributes to the exceptionally large spatial extent of Canadian wildfires (Jain et al., 2024; Luo et al., 2025). Interestingly, upstream, downstream, and on the southern side of the Canadian blocking, the Rossby waves are instead dominated by slowly moving synoptic-scale waves (Figs. 3b and 4a), suggesting the “block” of the eastward progression of synoptic waves and possible interactions between planetary-scale blocking and surrounding synoptic-scale waves, as documented in Shutts (1983), Yamazaki and Itoh (2013), and Luo et al. (2014, 2023).
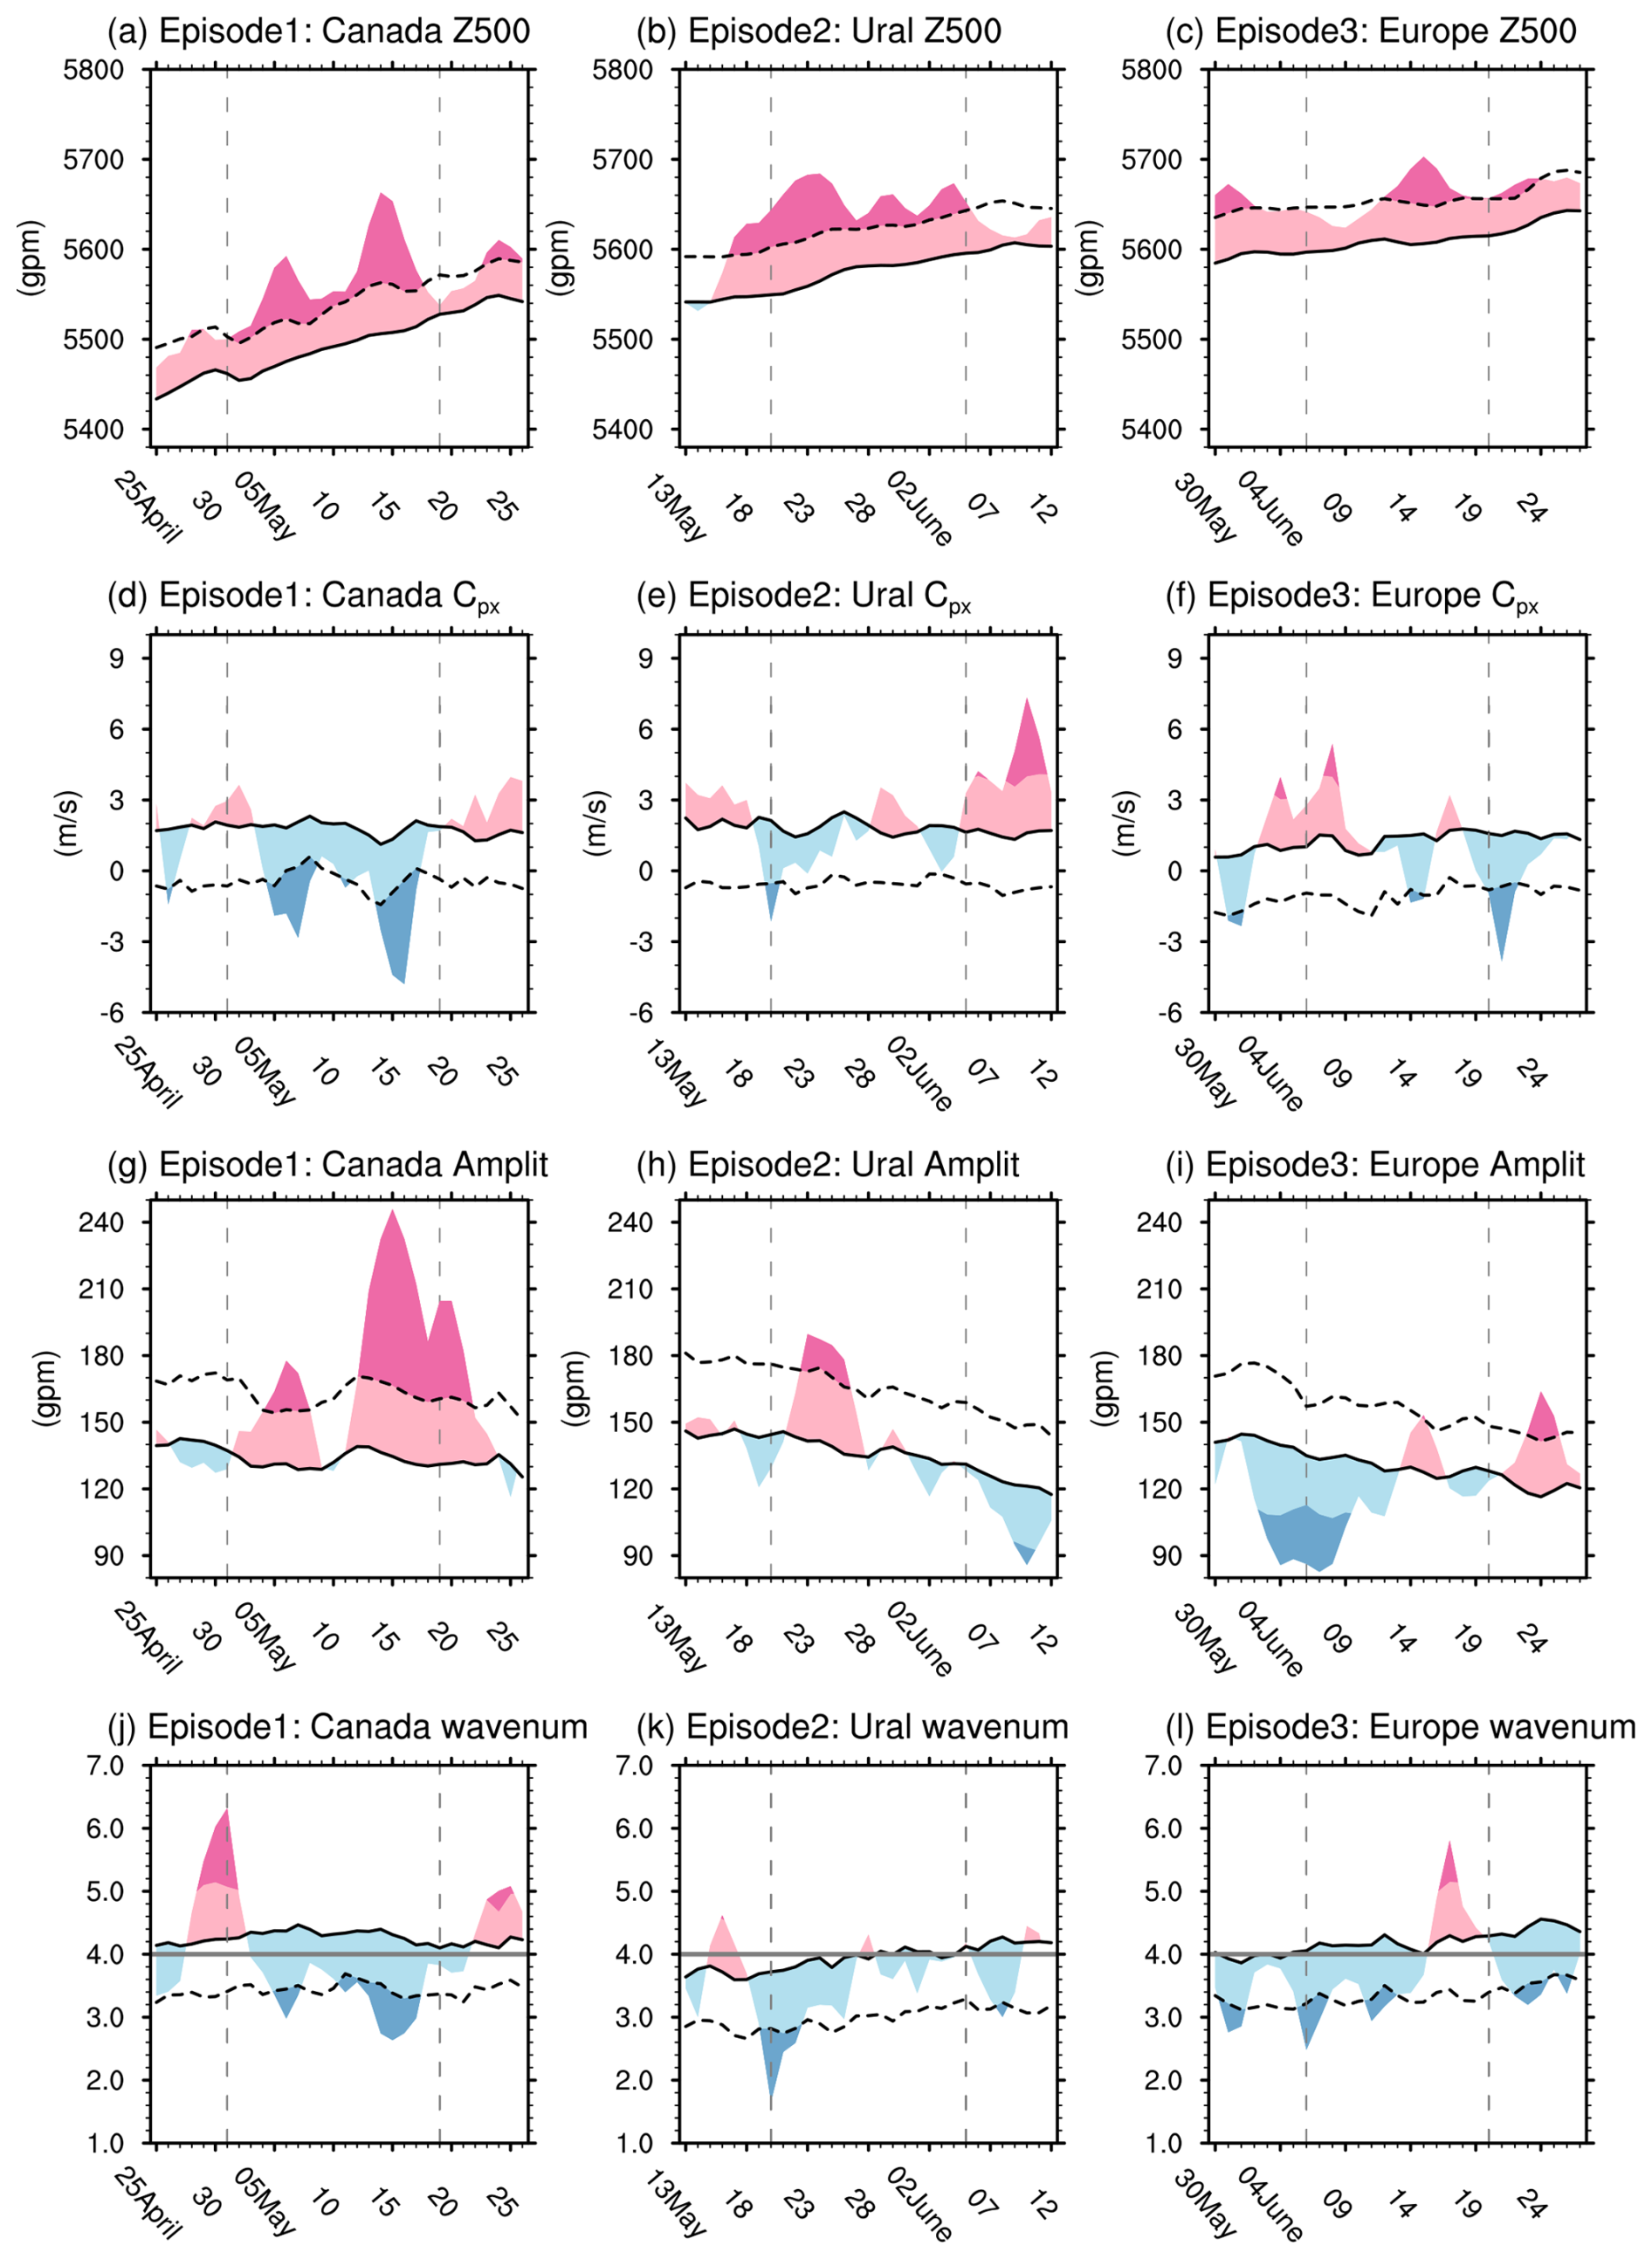
Figure 5Daily evolution of area-averaged Z500 (a–c; units: gpm), zonal phase speed (d–f; units: m s−1), wave amplitude (g–i; units: gpm), and zonal wavenumber (j–l) at 500 hPa during different blocking episodes. The three panels (from left to right) correspond to the averaged over the Canada (a, d, g, and j), the Ural Mountains (b, e, h, and k), and Europe (c, f, i, and l), respectively. The averaging regions are indicated by the red boxes in Figs. 3 and 4. In each panel, pink and dark pink shading indicate values exceeding the daily climatology (black solid line) and +1σ (black dashed line in a–c and g–i), respectively. Blue and dark blue shading indicate values below the daily climatology (black solid line) and −1σ (black dashed line in d–f and j–l), respectively. Gray solid lines in (j–l) denote the stationary wavenumber Ks. Gray vertical dashed lines mark the start and end dates of each episode.
The relationships between the day-to-day evolutions of wave parameters during the onset, maintenance, and collapse of the blocking are further shown in Fig. 5. Corresponding to the two large-scale blocking events in episode 1, Z500 and wave amplitude exhibit two distinct peaks (> 1σ; deep pink in Fig. 5a and g), while Cpx and zonal wavenumber show two pronounced minima (< −1σ; deep blue in Fig. 5d and j). These two distinct extreme values also occur close in time to the pronounced surface warm anomalies and the associated wildfires in Canada (see Fig. 2g and h in Luo et al., 2025).
During the onset of the first blocking event (1–5 May), as Z500 rapidly strengthens (Fig. 5a), Cpx decreases sharply from more than 3 m s−1 to negative values (Fig. 5d), wave amplitude rapidly increases from negative anomalies to > 1σ (Fig. 5g), and the dominant scale abruptly shifts from synoptic-scale (local zonal wavenumber > 6) to planetary-scale (around zonal wavenumber 3, with k < Ks ≈ 4) (Fig. 5j). In the subsequent decay stage of the first blocking anticyclones (7–10 May), although amplitude decreases, a planetary-scale ridge with near-zero Cpx still persists over Canada, and the local zonal wavenumber approaches the Ks. A similar rapid evolution recurs during the second onset stage (12–15 May). Following the collapse of the second blocking event, Rossby waves over Canada change from westward-propagating large-amplitude planetary-scale waves to eastward-propagating small-amplitude synoptic-scale waves (characterized by k > Ks), with these rapid changes occurring within a few days. In episode 1, the comparison between k and Ks provide a reasonable indicator of the movement characteristics of blocking (i.e., blocking remain quasi-stationary when k approaches the Ks, retrograde when k < Ks, and propagate eastward when k > Ks).
3.2.2 Episode 2 (20 May–5 June)
In this episode, wave amplitude over Canada remains anomalously strong (Fig. 3f), likely contributing to the continued severity of wildfires in late May and early June (Jain et al., 2024; Luo et al., 2025). Over Eurasia, enhanced wave amplitude extends from the ridge over Ural Mountains to trough over the Okhotsk Sea (Fig. 3f). Corresponding to the quasi-stationary waves over Canada, the North Atlantic and Eurasia, anomalously low Cpx prevail across the entire midlatitudes (Fig. 3e). The European and Ural blocking in episode 2 are likewise dominated by wavenumbers 2–4 (Fig. 4c), with the anomalously low wavenumbers across the midlatitudes (Fig. 4d) corresponding to the anomalously slow phase speeds. Therefore, the slowly moving, large-amplitude, planetary-scale pattern of the Ural ridge and East Asian trough provides a stable background circulation that facilitates continuous southward transport of cold air into East Asia, as reflected in the cold anomalies downstream of Ural blocking in Fig. 1c. This pattern, together with a northward-shifted and enhanced western Pacific subtropical high and associated moisture transport (Gao and Gao, 2023), contributes to the persistent precipitation anomalies in East Asia during episode 2.
Although the large-scale blocking event forms between 31 May and 5 June, the strong ridge indeed persists from 17 May to 5 June (Figs. 2a and 5b). During the early formation stage of the ridge (17–23 May), a rapid decrease in phase speed and zonal wavenumber occurs, with k < Ks when the system migrates westward (Fig. 5e and k), followed by a rapid increase in wave amplitude (Fig. 5h). However, during the maintenance stage, the Ural quasi-stationary ridge exhibits Cpx oscillating around 1.5 m s−1 (Fig. 5e), suggesting weak eastward propagation characteristics (as also shown in Fig. 2a–c). In this stage, the zonal wavenumbers oscillate around the Ks (Figs. 5k and 2c). After 5 June, wave amplitude decreases while Cpx increases sharply, indicating rapid weakening and downstream movement of the large-scale circulation system after the collapse of the Ural blocking.
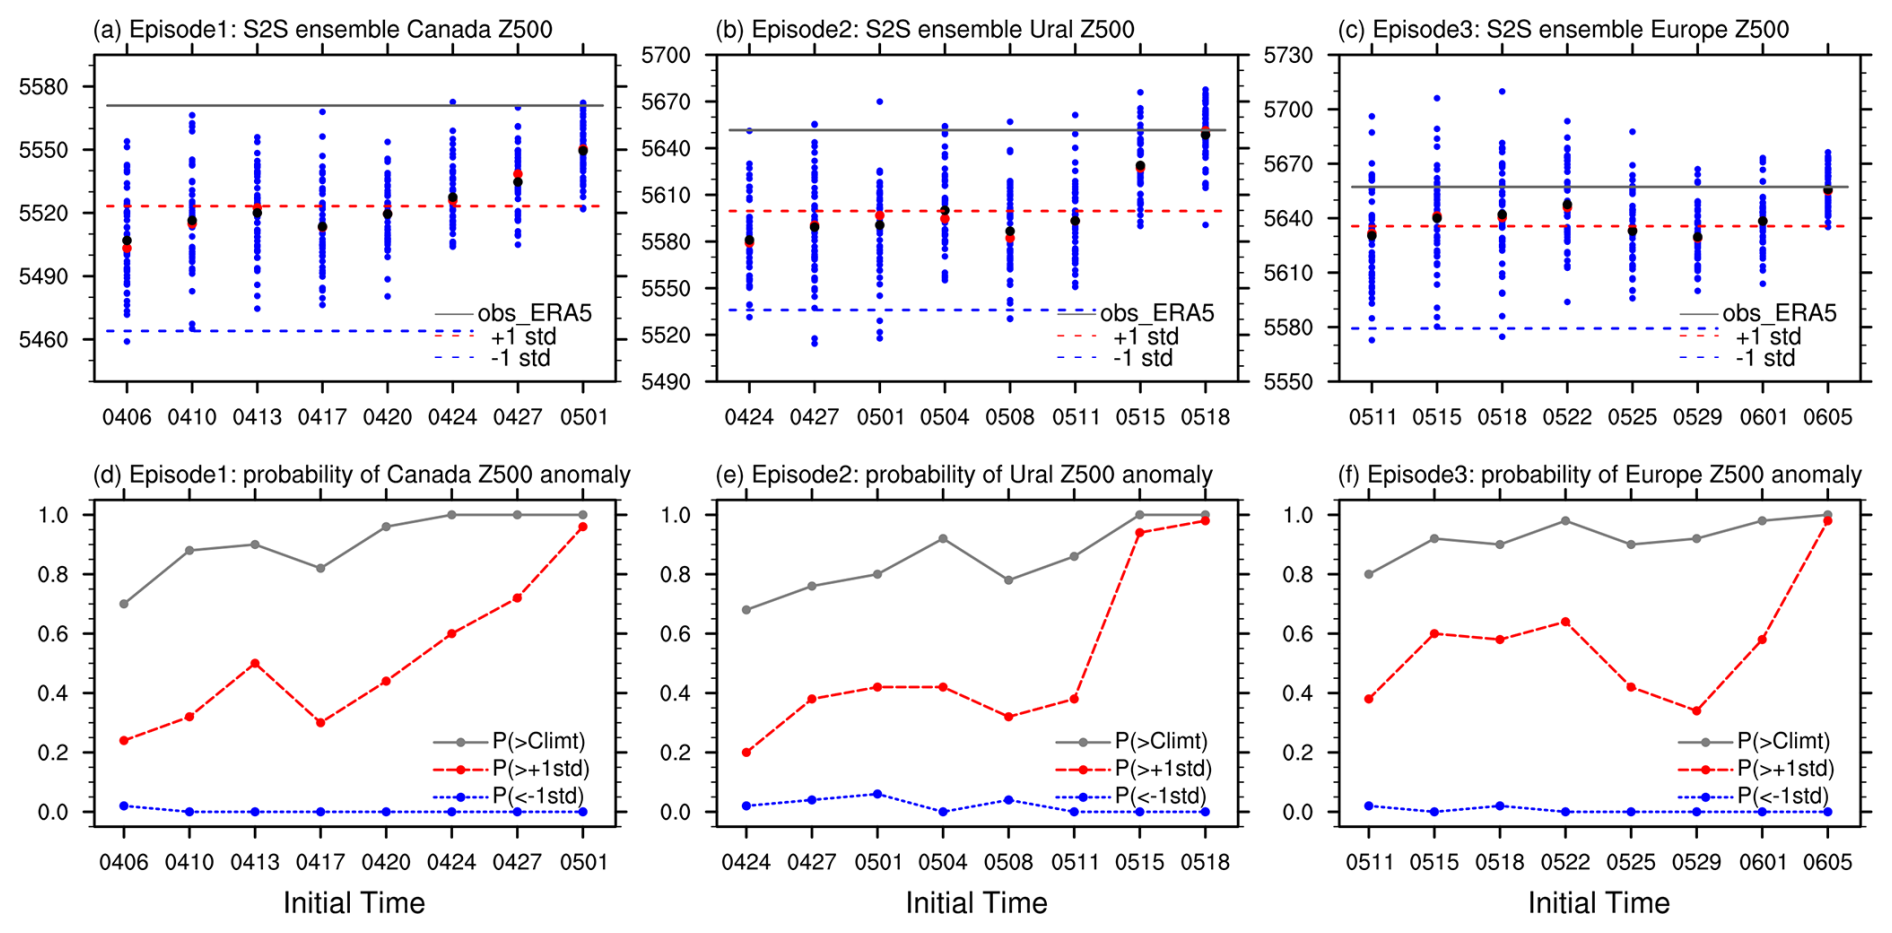
Figure 6(a–c) ECMWF S2S forecasted time- and spatially averaged Z500 for episode 1 (a), episode 2 (b), and episode 3 (c). The three panels (from left to right) correspond to averages over the Canada (a), the Ural Mountains (b), and Europe (c), respectively. Each blue dot represents one of the 50 ensemble members. Black (red) dots denote the ensemble mean (median). In each episode, the solid gray line shows the observed time- and spatially averaged Z500 in 2023 from ERA5, while the red and blue dashed lines indicate the observed +1σ and −1σ bounds based on ERA5 from 1979–2023, respectively. (d–f) Probabilities of forecasted time-mean Z500 exceeding the climatological mean (gray line), exceeding +1σ (red line), and falling below −1σ (blue line) as a function of initialization date for episode 1 (d), episode 2 (e), and episode 3 (f). The abscissa represents forecast initialized dates with twice weekly.
3.2.3 Episode 3 (6–20 June)
In episode 3, both the intensity and spatial extent of the large-amplitude anomaly over Canada decrease markedly (Fig. 3i), consistent with relatively weaker Canadian wildfires during 12–20 June (see Fig. 2h in Luo et al., 2025). Moreover, phase speed anomalies north of 60° N over Canada turn positive (Fig. 3h), and the dominant zonal wavenumber over Canada shifts to 4–6 (Fig. 4e), indicating a transition from a large-amplitude quasi-stationary planetary-scale ridge to eastward-moving synoptic-scale waves during this period.
Meanwhile, low phase speeds but relatively modest wave amplitudes prevail the region extending from the mid-latitude North Atlantic to Europe (Fig. 3h and i). Positive wave amplitude anomalies appear north of the European block, i.e., from southern Greenland to northern Europe (Fig. 3i). The European blocking in the third episode is also dominated by zonal wavenumbers 2–4 (Fig. 4e), consistent with negative phase speed anomalies there (Fig. 3h), favorable for the occurrence of heatwaves over northwestern Europe, through the mechanisms proposed by Berthou et al. (2024).
Regarding the evolution of European blocking, it is noted that the planetary-scale eastward-propagating signal around 6 June (Fig. 5f and l) resulted from the eastward movement of the preceding European blocking collapse (as shown in Fig. 2a). However, similar to the Canadian and Ural blocking events, during the onset and maintenance of the European blocking from 10 to 15 June, Cpx decreases rapidly while wave amplitude increases (Fig. 5f and i). When Z500 and amplitude reach their maxima, Cpx reaches its minimum and becomes westward. In this period the zonal wavenumbers remain between 3 and 4 with k < Ks, thereby favoring westward movement of the blocking system. During the decay of the blocking (16–20 June), the Rossby waves transition from westward-propagating planetary-scale waves to eastward-propagating synoptic-scale waves, although this regime shift is short-lived as the ridge re-intensifies on 21–22 June.
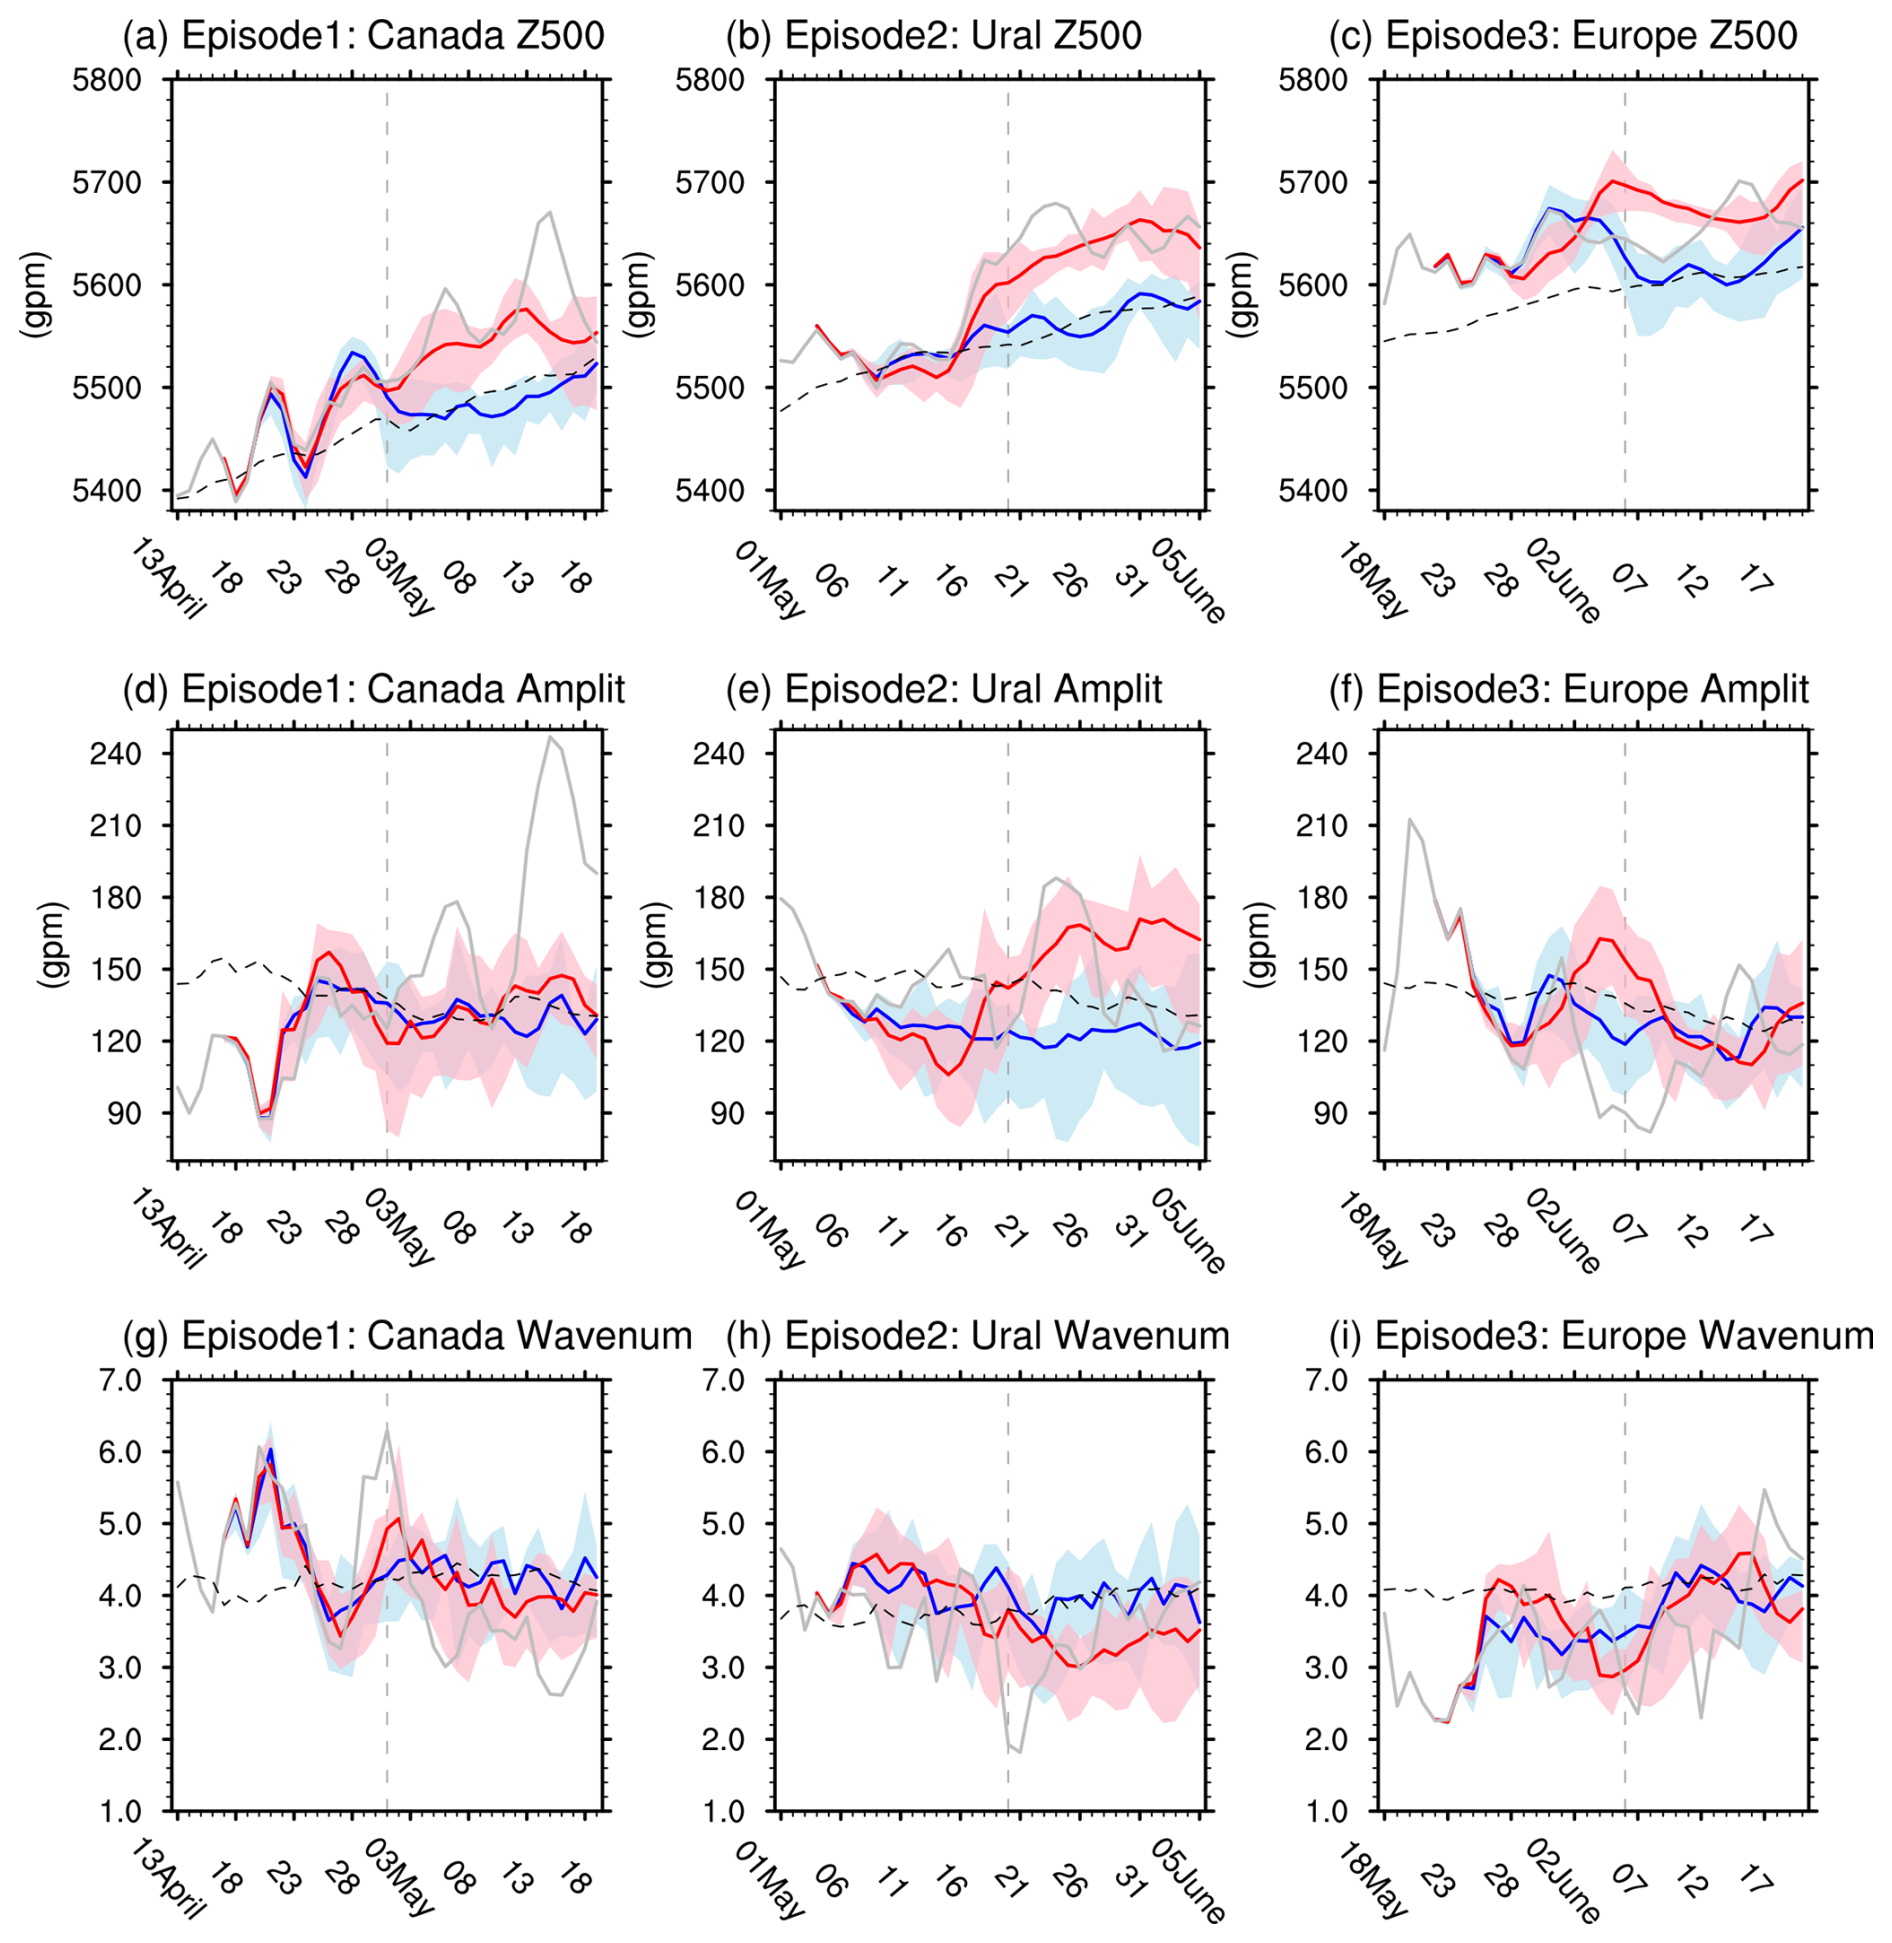
Figure 7Daily evolution of ECMWF S2S forecasted spatially averaged Z500 (a–c; units: gpm), wave amplitude (d–f; units: gpm), and zonal wavenumber (g–i) at 500 hPa during different episodes. The three panels (from left to right) correspond to averages over the Canada (initialized at 17 April; a, d, and g), the Ural Mountains (initialized at 4 May; b, e, and h), and Europe (initialized at 22 May; c, f, and i), respectively. In each panel, red and blue solid lines represent the ensemble means of the good-forecast ensemble members and bad-forecast ensemble members, respectively, while the pink and light blue shading indicate the 20 %–80 % spread of the good and bad members, respectively. The gray solid line and the black dashed line denote the observed daily evolution in 2023 and observed daily climatology based on ERA5, respectively. Vertical gray dashed lines mark the onset day of each episode.
It is interesting to check the capability of ensemble forecasts by ECMWF model in forecasting the blocking circulation in these three episodes. Figure 6a–c shows the forecasted temporal mean Z500 during each episode based on the 50 members. The subseasonal forecast results for these three episodes exhibit notable similar features. First, for each episode we note that very few members (usually less than 2) predict a negative anomaly (less than −1σ) with almost all of initialization dates (blue lines in Fig. 6d–f). Remarkably, for the forecasts initialized 15–19 d ahead of each episode, i.e. initialized at 13 April for episode 1 (Fig. 6d), initialized at 1 and 4 May for episode 2 (Fig. 6e), and initialized from 15 to 22 May for episode 3 (Fig. 6f), there are usually 40 %–65 % of the total 50 members (20–32 members) predicting a significant positive Z500 anomaly (larger than +1σ, red lines in Fig. 6d–f), and more than 80 % of the total member predicting a temporal mean Z500 above the climate mean (gray lines in Fig. 6d–f). The predictability drops for the forecasts made during the following week, but the number of correct-forecast members increases markedly and becomes dominant for initializations made 2–5 d ahead of each episode. In the following sections we try to understand the sources of predictability 2 weeks in advance for these three episodes, and examine how forecast errors relate to errors in Rossby wave dynamics.
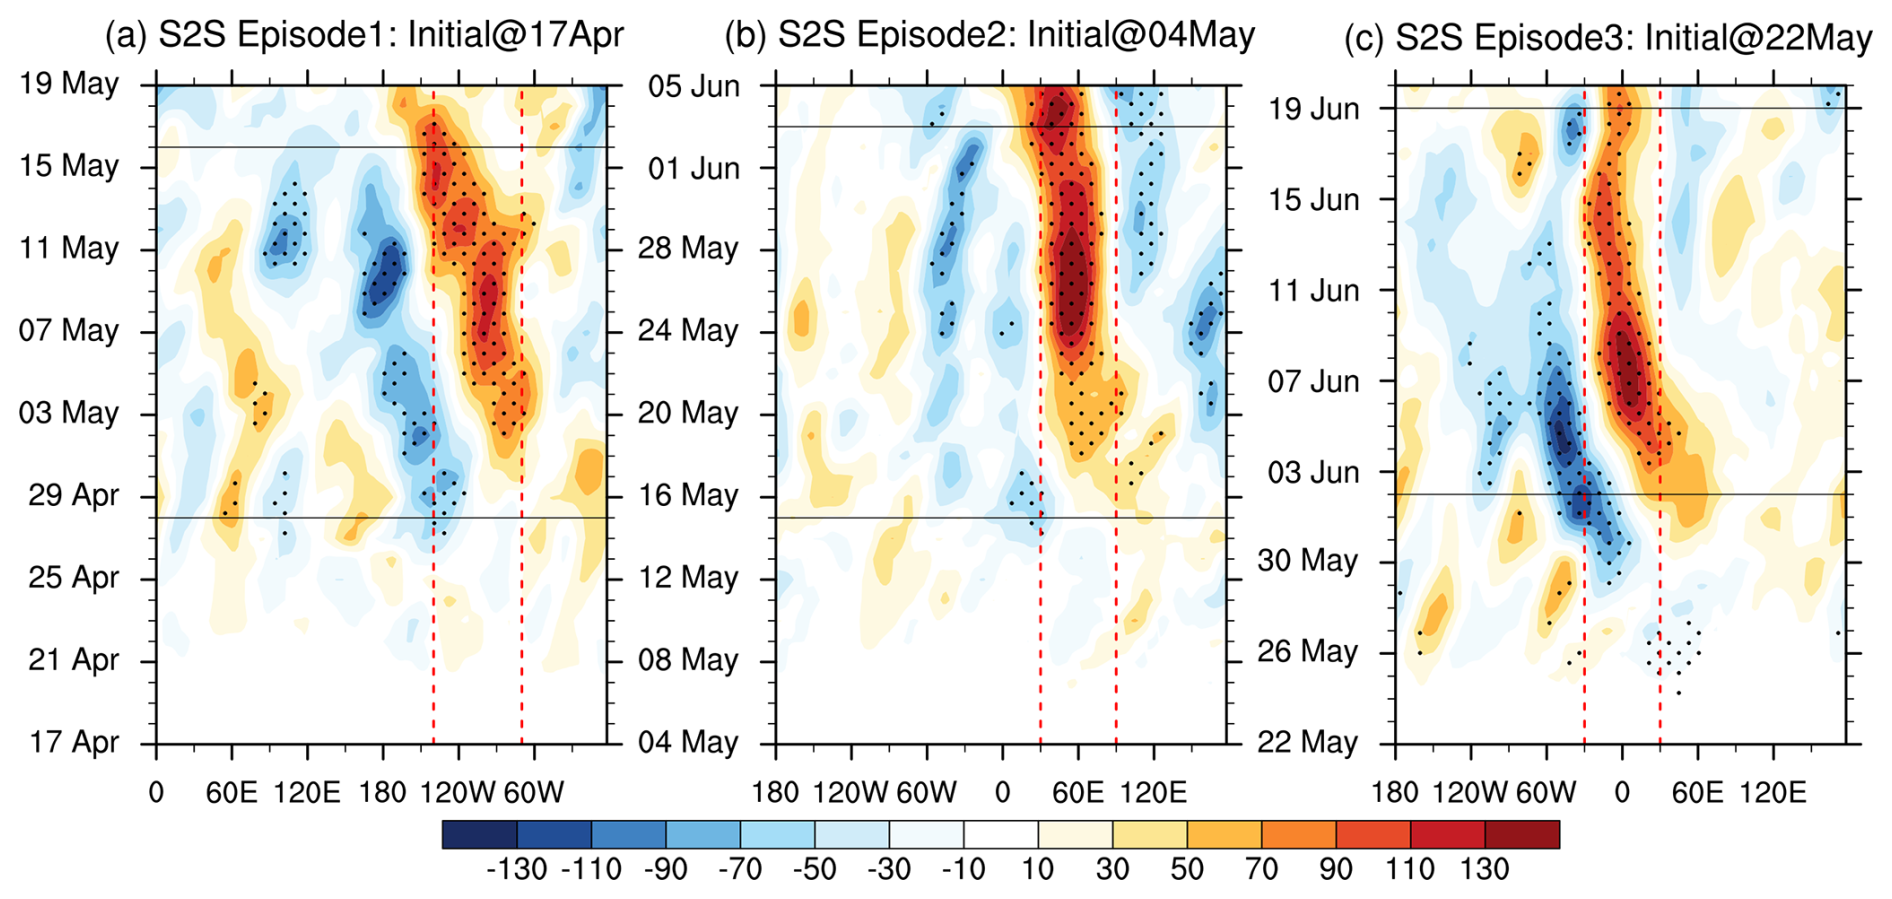
Figure 8Hovmöller diagrams of ensemble-mean Z500 differences (shading; units: gpm) averaged over 45–75° N between good- and bad-forecast members for (from left to right) the Canadian blocking (initialized at 17 April, 14 d lead; a), Ural blocking (initialized at 4 May, 16 d lead; b), and European blocking (initialized at 22 May, 15 d lead; c). Stippling denotes the differences are statistically significant above the 95 % confidence level based on the two-tailed Student's t-test. The region between the red dashed lines in (a–c) indicates the Canada, the Ural Mountains, and Europe, respectively. The time ranges bounded by the black solid lines are further used in Fig. 9 to illustrate the differences in horizontal wave propagation.
Figure 7 compares the day-to-day evolutions in Z500, wave amplitude, and zonal wavenumber between the good-forecast and bad-forecast ensemble members' forecasts initialized approximately two weeks ahead for each episode. In each episode, the good members and bad members are defined as the 10 members with the strongest and weakest time- and spatially averaged Z500 over the blocking region, respectively. The initialization dates are 17 April (14 d lead) for episode 1, 4 May (16 d lead) for episode 2, and 22 May (15 d lead) for episode 3. For episode 1 (the blocking over Canada), even the good ensemble members predict a Z500 intensity of only about half the observed value (red line in Fig. 7a), with weaker growth in wave amplitude and scale (Fig. 7d and g). Among the three episodes, episode 2 (the quasi-stationary ridge over the Ural Mountains) shows the best forecast skill. The good ensemble members successfully capture both the intensity and duration of the Z500 anomaly seen in ERA5, and the amplification of wave amplitude and spatial scale after 18 May (Fig. 7e and h). In episode 3 (the blocking over Europe), although the good ensemble members predict the prolonged positive Z500 anomaly after 6 May, the forecasted peak of Z500 occurs noticeably earlier than in ERA5 (Fig. 7c). Similarly, forecasts of wave parameters in episode 3 show weaker amplification. Overall, forecasts of wave amplitude and scale perform more poorly than those of Z500, particularly in episodes 1 and 3. Interestingly, for the bad ensemble members, the forecasts of Z500 and wave parameters show a tendency to return toward their climatology (blue lines in Fig. 7), as also noted in Pelly and Hoskins (2003b).
To further elucidate the sources of subseasonal predictability for these three episodes beyond 2 weeks, we examine the ensemble-mean Z500 differences between the good and bad ensembles in the Hovmöller diagrams (Fig. 8). The three episodes display similar pattern, with pronounced differences emerging after approximately 10 d after initialization and showing a clear connection to upstream quasi-stationary troughs. For episode 1, the good ensemble not only predicts the quasi-stationary ridge over Canada but also capture the quasi-stationary trough over the North Pacific (Fig. 8a). For episodes 2 and 3, in addition to the quasi-stationary ridges over the Ural region and Europe, respectively, the good ensemble consistently predicts the presence of an upstream trough over the North Atlantic (60° W–0° E) (Fig. 8b and c). Moreover, the successful prediction of a strong trough downstream of the Ural blocking (Fig. 8b) explains why the prediction of the wave amplitudes and the spatial scales are better in episode 2. Across all three episodes, the troughs and ridges exhibit a clear downstream development, indicating that better prediction of the upstream wave precursors (i.e., quasi-stationary trough here) plays a crucial role. This is in line with the findings of Maddison et al. (2019), who showed that upstream cyclones are important for the predictability of blocking onset.
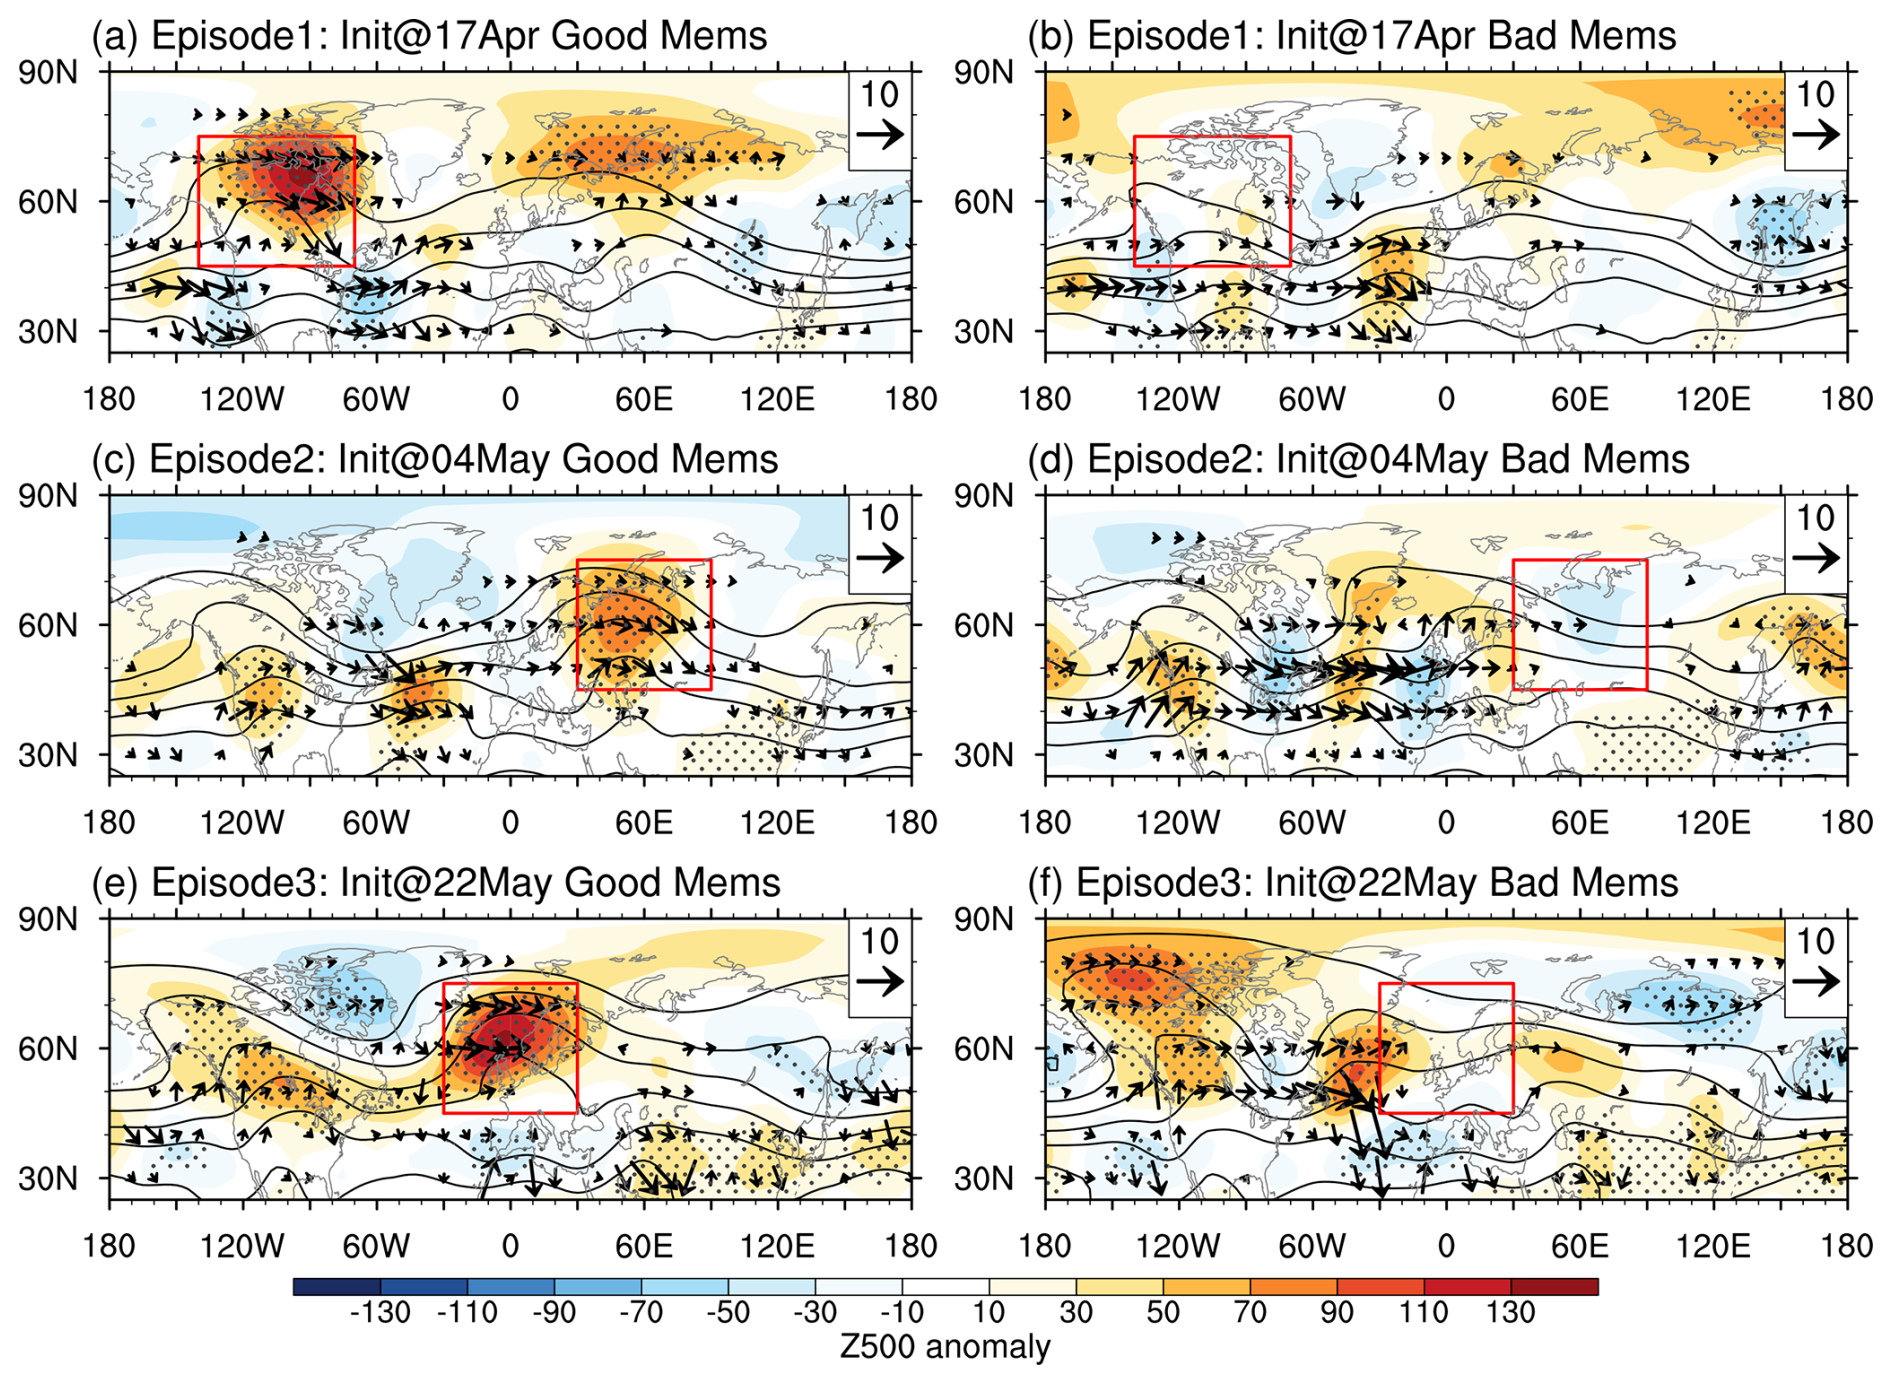
Figure 9Ensemble-mean Z500 anomalies (shading; units: gpm), associated WAF (vectors; units: m2 s−2), and Z500 (contours; units: gpm) for good ensemble members (a, c, and e) and bad ensemble members (b, d, and f). Three panels from top to bottom correspond to the Canadian blocking (initialized at 17 April; a and b), Ural blocking (initialized 4 May; c and d), and European blocking (initialized 22 May; e and f). Red boxes mark the blocking regions. Stippling denotes ensemble-mean Z500 anomalies exceeds 0.8σ based on ERA5.
We further find from the WAF diagnostic (Fig. 9) that the good ensemble successfully forecasts planetary-scale Z500 anomalies and the associated WAF (Fig. 9a, c, and e) that closely resemble those in ERA5 (Fig. 3a, d, and g). For episode 2 and 3, the good ensemble also captures the downstream dispersion of wave energy following the collapse of the Canadian blocking, as well as the subsequent formation of planetary-scale trough-ridge patterns (Fig. 9c and e; also Fig. 8b and c). In contrast, the Rossby waves in the bad ensemble primarily propagated as synoptic-scale waves along the subtropical or mid-latitude jet, showing limited amplification into blocking pattern (Fig. 9b, d, and f). The bad ensemble even predicts an erroneous intensification of the Canadian ridge in episode 3.
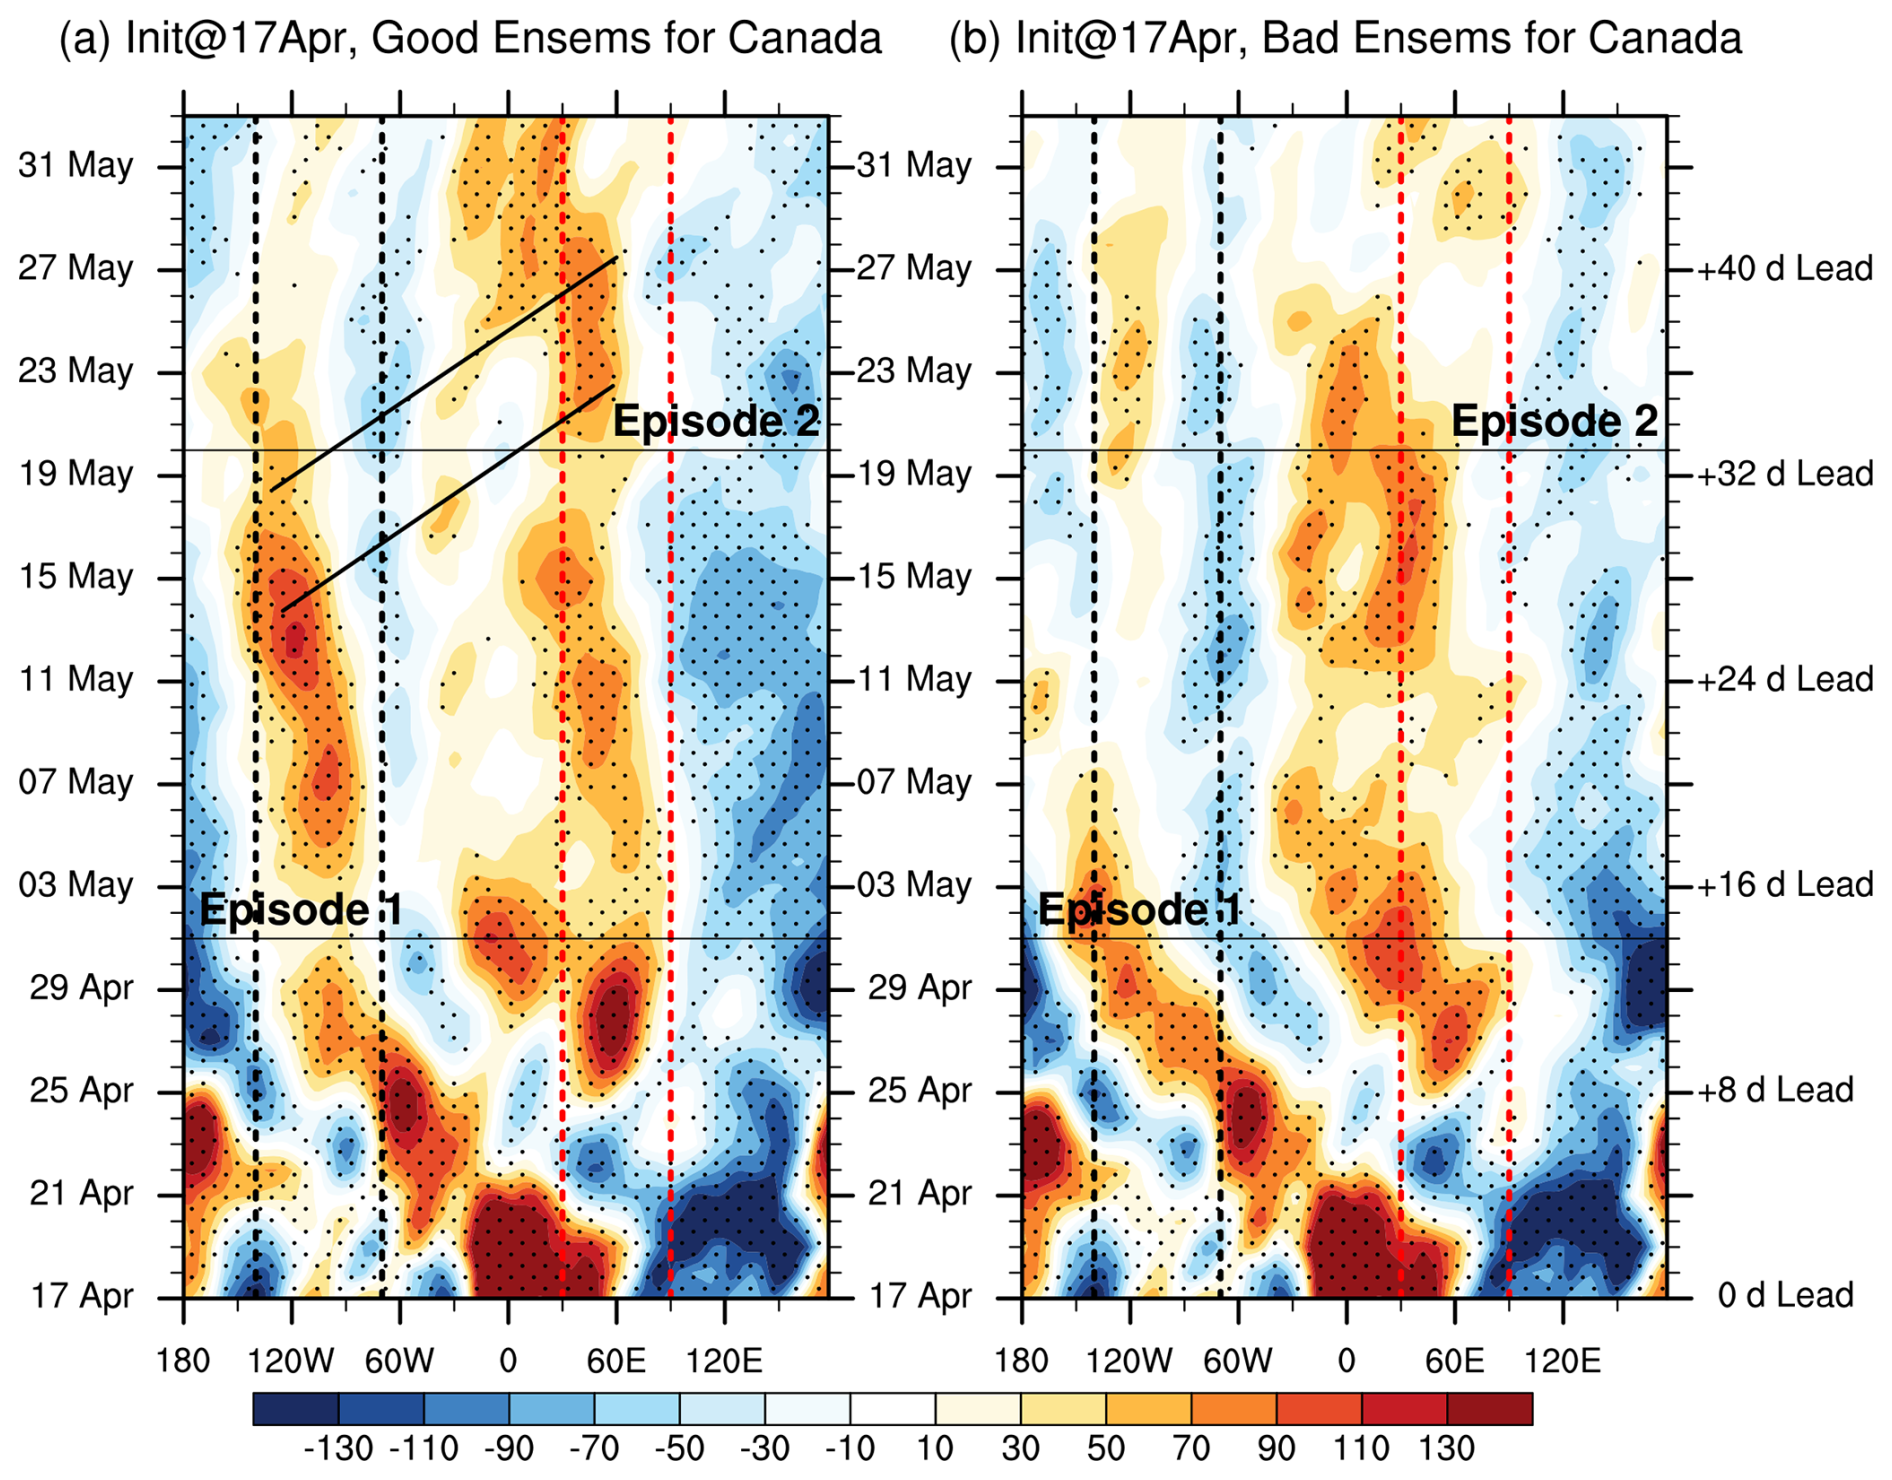
Figure 10Hovmöller diagrams of ensemble-mean zonal-mean-removed Z500 (shading; units: gpm) averaged over 45–75° N for (a) good- and (b) bad-forecast members of the Canadian blocking, initialized on 17 April. Lead times for the start dates of episode 1 and episode 2 are 14 and 33 d, respectively. Stippling denotes region where at least 8 out of 10 ensemble members agree on the sign. The regions between the black and red dashed lines indicate the positions of Canada and the Ural Mountains, respectively.
These results indicate that the collapse of the exceptionally strong Canadian blocking and the subsequent shift to North Atlantic Oscillation-like regime (as shown in Fig. 9c and e) provide a window of opportunity for the longer than 2-week predictability of the Ural and European blockings. Indeed, in forecasts initialized on 17 April, ensemble members with a strong Canadian ridge in episode 1 (good ensemble) predict a stronger Ural ridge in late May after the collapse of the Canadian ridge, with a lead time exceeding 33 d (Fig. 10a). In contrast, ensemble members that miss the Canadian ridge (bad ensemble) also fail to predict the Ural ridge in episode 2 (Fig. 10b). Overall, we show that predictability beyond 2 weeks does exist for these three blocking episodes, and it depends on the better prediction of the upstream wave precursors and associated quasi-stationary Rossby wave energy propagation.
This study investigates the subseasonal dynamical processes and predictability associated with three consecutive large-scale blocking episodes over Canada and Eurasia during May–June 2023, using ERA5 reanalysis data, ECMWF S2S ensemble forecasts, and local wave parameter diagnostics. The main conclusions are as follows:
- 1.
The three blocking events are dynamically linked through the energy propagation of quasi-stationary Rossby waves. During episode 1 (1–19 May), wave activity flux originating from the North Pacific favors the maintenance of the Canadian blocking. Following the collapse of the Canadian blocking, the wave energy propagates downstream toward Europe and the Ural region, promoting the establishment and persistence of the ridges in episode 2 (20 May–5 June). In episode 3 (6–20 June), the quasi-stationary wave energy propagation over the North America–North Atlantic sector splits into branches that converge over Europe, thereby favoring the formation and maintenance of the European blocking.
- 2.
Based on the local wave parameter diagnostics, all three blocking episodes are dominated by slowly propagating (anomalously low phase speed), large-amplitude planetary-scale Rossby waves with zonal wavenumbers typically in the range 2–4. The zonal wavenumbers, lower than their climatological values, favor the quasi-stationary or westward movement of the blocking system and contributes to the exceptionally large spatial extent of the associated weather extremes. In particular, the slowly propagating large-amplitude planetary-scale ridges over Canada during episodes 1 and 2 and over Europe during episode 2 and 3 create prolonged and widespread dry and warm conditions conducive to intense Canadian wildfires and European heatwaves, respectively, while the slowly moving planetary-scale large-amplitude trough–ridge pattern over Eurasia in episode 2 supports continuous cold-air outbreaks and persistent precipitation anomalies in East Asia.
- 3.
During blocking onset, the wave parameters undergo a rapid transition from eastward-propagating, small-amplitude synoptic-scale waves to quasi-stationary or westward-propagating, large-amplitude planetary-scale waves, with the reverse transition occurring during decay. In particular, the phase speed becomes negative when the amplitude and scale reach their maximum, facilitating the retrograde behavior of the blocking circulation. These abrupt shifts in phase speed, amplitude, and wavenumber typically occur over just a few days, highlighting the pronounced abrupt intraseasonal transitions in Rossby wave regime.
- 4.
For all three blocking episodes, the ECMWF S2S ensemble-mean forecasts exhibit accuracy at short lead times of 2–5 d. However, the ensemble forecasts demonstrate high subseasonal predictability when initialized 15–19 d ahead. Among the episodes, episode 2 displays the highest forecast skill, with good ensemble members successfully reproducing both the intensity and duration of the Ural ridge as well as the associated amplification in wave amplitude and scale. Overall, forecasts of wave amplitude and scale perform markedly worse than those of Z500, particularly in episodes 1 and 3. For all episodes, it is shown that good ensemble is closely linked to the better prediction of the development of planetary-scale trough-ridge patterns and the associated quasi-stationary Rossby wave energy propagation. In contrast, bad ensemble is characterized by the propagation of synoptic-scale waves along the subtropical or mid-latitude jet. Moreover, the collapse of Canadian blocking seems to provide a window of opportunity for the longer than 2-week predictability of the Ural and European blockings. These results underscore the critical role of upstream wave precursors and Rossby wave energy propagation in determining the subseasonal predictability of blocking circulations.
The transition from small-amplitude transient synoptic-scale waves to large-amplitude quasi-stationary planetary-scale waves during blocking onset aligns with previous studies (Luo et al., 2014; Woollings et al., 2018). What distinguishes this work from prior research is the application of the Hilbert transform to quantitatively diagnose the local phase speed, amplitude, and wavenumber throughout the life cycle of blocking, thereby enabling a detailed analysis of the evolution of these wave parameters. Furthermore, we find that the evolution of wavenumber is also important for blocking movement (Yeh et al., 1962; van Mourik et al., 2025). Comparisons between k and Ks in these cases suggest that blocking generally moves westward during its onset with k < Ks, moves rapidly eastward after collapse with k > Ks, and maintains quasi-stationary or slow movement when k approaches Ks. However, cases with k < Ks but eastward movement can also occur after the collapse of blocking. In the future, this method could be extended to statistical analyses of the links between blocking-related wave parameters and surface weather extremes, as well as to quantitative evaluations of model performance.
While this study elucidates the dynamical linkages among the successive blocking events and their subseasonal predictability through the horizontal propagation of Rossby waves, the potential roles of vertical planetary wave propagation, stratospheric processes, and lower-boundary forcing remain unclear. Future research should also extend the analysis to a larger sample of blocking events across different seasons and regions to clarify whether and why wave amplitude and spatial scale fail to amplify sufficiently in blocking forecasts, thereby providing insight into the sources of model errors and pathways for improving prediction skill. While the subseasonal predictability beyond 2 weeks and the links between different blockings demonstrated in this study is encouraging, we also note that the predictability of ensemble forecasts may oscillate between leading-time of 15 and 5 d (Fig. 6d–f), which highlights the importance of supplementary diagnostic methods in understanding this phenomenon and in sorting out the better ensemble members (Mu and Duan, 2025).
The ERA5 data were downloaded from https://apps.ecmwf.int/data-catalogues/era5/?class=ea (last access: 8 September 2026). The S2S database is available at https://apps.ecmwf.int/datasets/data/s2s/levtype=sfc/type=cf/ (last access: 8 September 2026).
ZL performed the analysis, developed the diagnostic method, drafted and revised the manuscript. JL conceptualized and supervised the study, drafted and revised the manuscript. YL revised the manuscript and supervised the study.
The contact author has declared that none of the authors has any competing interests.
Publisher's note: Copernicus Publications remains neutral with regard to jurisdictional claims made in the text, published maps, institutional affiliations, or any other geographical representation in this paper. The authors bear the ultimate responsibility for providing appropriate place names. Views expressed in the text are those of the authors and do not necessarily reflect the views of the publisher.
We thank for the technical support of the National Large Scientific and Technological Infrastructure “Earth System Numerical Simulation Facility” (https://cstr.cn/31134.02.EL, last access: 8 September 2026). The comments from the two anonymous reviewers are appreciated, and the first author appreciates discussion with Drs. Tim Woollings, Sebastian Schemm, and Stephan Pfahl during his visit in the UK, particularly the discussion with Dr. Sebastian Schemm led to the newly added Fig. 10.
This research has been supported by the National Natural Science Foundation of China (grant nos. 42175070, 42288101).
This paper was edited by Andrea Lopez Lang and reviewed by Tyler Leicht and one anonymous referee.
Barnes, C., Jain, P., Keeping, T., Gillett, N., Boucher, J., Gachon, P., Heinrich, D., Kirchmeier-Young, M., and Boulanger, Y.: Disentangling the roles of natural variability and climate change in Canada's 2023 fire season, Environ. Res.-Climate, 4, 035013, https://doi.org/10.1088/2752-5295/adec0f, 2025.
Bartusek, S., Kornhuber, K., and Ting, M.: 2021 North American heatwave amplified by climate change-driven nonlinear interactions, Nat. Clim. Change, 12, 1143–1150, https://doi.org/10.1038/s41558-022-01520-4, 2022.
Berthou, S., Renshaw, R., Smyth, T., Tinker, J., Grist, J. P., Wihsgott, J. U., Jones, S., Inall, M., Nolan, G., Berx, B., Arnold, A., Blunn, L. P., Castillo, J. M., Cotterill, D., Daly, E., Dow, G., Gómez, B., Fraser-Leonhardt, V., Hirschi, J. J.-M., Lewis, H. W., Mahmood, S., and Worsfold, M.: Exceptional atmospheric conditions in June 2023 generated a northwest European marine heatwave which contributed to breaking land temperature records, Commun. Earth Environ., 5, 287, https://doi.org/10.1038/s43247-024-01413-8, 2024.
Black, E., Blackburn, M., Harrison, G., Hoskins, B., and Methven, J.: Factors contributing to the summer 2003 European heatwave, Weather, 59, 217–223, https://doi.org/10.1256/wea.74.04, 2004.
Bordoni, S. and Schneider, T.: Monsoons as eddy-mediated regime transitions of the tropical overturning circulation, Nat. Geosci., 1, 515–519, https://doi.org/10.1038/ngeo248, 2008.
Breeden, M. L., Albers, J. R., Butler, A. H., and Newman, M.: The spring minimum in subseasonal 2-meter temperature forecast skill over North America, Mon. Weather Rev., 150, 2617–2628, https://doi.org/10.1175/MWR-D-22-0062.1, 2022.
Byrne, B., Liu, J., Bowman, K. W., Pascolini-Campbell, M., Chatterjee, A., Pandey, S., Miyazaki, K., van der Werf, G. R., Wunch, D., Wennberg, P. O., Roehl, C. M., and Sinha, S.: Carbon emissions from the 2023 Canadian wildfires, Nature, 633, 835–839, https://doi.org/10.1038/s41586-024-07878-z, 2024.
Cheung, H. N., Zhou, W., Mok, H. Y., Wu, M. C., and Shao, Y. P.: Revisiting the climatology of atmospheric blocking in the Northern Hemisphere, Adv. Atmos. Sci., 30, 397–410, https://doi.org/10.1007/s00376-012-2006-y, 2013.
Coumou, D., Petoukhov, V., Rahmstorf, S., Petri, S., and Schellnhuber, H. J.: Quasi-resonant circulation regimes and hemispheric synchronization of extreme weather in boreal summer, P. Natl Acad. Sci. USA, 111, 12331–12336, https://doi.org/10.1073/pnas.1412797111, 2014.
Diao, Y., Guo, J., Zhang, Y., Hou, Z., and Luo, B.: Trend turning of North China summer extreme precipitations around early 2000s and its possible reason, Clim. Dynam., 61, 5367–5386, https://doi.org/10.1007/s00382-023-06860-1, 2023.
Ding, Y., Wang, Z., Song, Y., and Zhang, J.: Causes of the unprecedented freezing disaster in January 2008 and its possible association with the global warming, Acta Meteorol. Sin., 66, 808–825, https://doi.org/10.11676/qxxb2008.074, 2008 (in Chinese).
Fei, C. and White, R. H.: The role of topography, land and sea surface temperature on quasi-stationary waves in Northern Hemisphere winter: insights from CAM6 simulations, Weather Clim. Dynam., 6, 1119–1146, https://doi.org/10.5194/wcd-6-1119-2025, 2025.
Fragkoulidis, G. and Wirth, V.: Local Rossby wave packet amplitude, phase speed, and group velocity: Seasonal variability and their role in temperature extremes, J. Climate, 33, 8767–8787, https://doi.org/10.1175/JCLI-D-19-0377.1, 2020.
Gao, J. and Gao, H.: “Wheat-Soaked Persistent Precipitation” in Late Spring 2023 in the Huang-Huai-Hai Plain and the Large-Scale Circulation Pattern, Meteorol. Mon., 49, 1227–1234, https://doi.org/10.7519/j.issn.1000-0526.2023.082901, 2023 (in Chinese).
Hersbach, H., Bell, B., Berrisford, P., Hirahara, S., Horányi, A., Muñoz‐Sabater, J., Nicolas, J., Peubey, C., Radu, R., Schepers, D., Simmons, A., Soci, C., Abdalla, S., Abellan, X., Balsamo, G., Bechtold, P., Biavati, G., Bidlot, J., Bonavita, M., De Chiara, G., Dahlgren, P., Dee, D., Diamantakis, M., Dragani, R., Flemming, J., Forbes, R., Fuentes, M., Geer, A., Haimberger, L., Healy, S., Hogan, R. J., Hólm, E., Janisková, M., Keeley, S., Laloyaux, P., Lopez, P., Lupu, C., Radnoti, G., De Rosnay, P., Rozum, I., Vamborg, F., Villaume, S., and Thépaut, J.: The ERA5 global reanalysis, Q. J. Roy. Meteor. Soc., 146, 1999–2049, https://doi.org/10.1002/qj.3803, 2020.
Hoskins, B. J. and Ambrizzi, T.: Rossby wave propagation on a realistic longitudinally varying flow, J. Atmos. Sci., 50, 1661–1671, https://doi.org/10.1175/1520-0469(1993)050<1661:RWPOAR>2.0.CO;2, 1993.
Hoskins, B. J., McIntyre, M. E., and Robertson, A. W.: On the use and significance of isentropic potential vorticity maps, Q. J. Roy. Meteor. Soc., 111, 877–946, https://doi.org/10.1002/qj.49711147002, 1985.
Huffman, G. J., Adler, R. F., Morrissey, M. M., Bolvin, D. T., Curtis, S., Joyce, R., McGavock, B., and Susskind, J.: Global precipitation at one-degree daily resolution from multisatellite observations, J. Hydrometeorol., 2, 36–50, https://doi.org/10.1175/1525-7541(2001)002<0036:gpaodd>2.0.co;2, 2001.
Jain, P., Barber, Q. E., Taylor, S. W., Whitman, E., Castellanos-Acuna, D., Boulanger, Y., Chavardès, R. D., Chen, J., Englefield, P., Flannigan, M., Girardin, M. P., Hanes, C. C., Little, J., Morrison, K., Skakun, R. S., Thompson, D. K., Wang, X., and Parisien, M.-A.: Drivers and Impacts of the Record-Breaking 2023 Wildfire Season in Canada, Nat. Commun., 15, 6764, https://doi.org/10.1038/s41467-024-51154-7, 2024.
Kautz, L.-A., Martius, O., Pfahl, S., Pinto, J. G., Ramos, A. M., Sousa, P. M., and Woollings, T.: Atmospheric blocking and weather extremes over the Euro-Atlantic sector – a review, Weather Clim. Dynam., 3, 305–336, https://doi.org/10.5194/wcd-3-305-2022, 2022.
Kornhuber, K., Osprey, S., Coumou, D., Petri, S., Petoukhov, V., Rahmstorf, S., and Gray, L.: Extreme weather events in early summer 2018 connected by a recurrent hemispheric wave-7 pattern, Environ. Res. Lett., 14, 054002, https://doi.org/10.1088/1748-9326/ab13bf, 2019.
Lau, W. K. M. and Kim, K.-M.: The 2010 Pakistan Flood and Russian Heat Wave: Teleconnection of Hydrome teorological Extremes, J. Hydrometeorol., 13, 392–403, https://doi.org/10.1175/JHM-D-11-016.1, 2012.
Li, Z., Lu, J., and Liu, Y.: The Period and Phase Speed of Upper-tropospheric Planetary- and Synoptic-scale Waves during the Solstice Seasons: Climatology and Trends during 1979–2023, Adv. Atmos. Sci., 42, 2223–2234, https://doi.org/10.1007/s00376-024-4236-1, 2025.
Lubis, S. W., Chen, Z., Lu, J., Hagos, S., Chang, C.-C., and Leung, L. R.: Enhanced Pacific Northwest heat extremes and wildfire risks induced by the boreal summer intraseasonal oscillation, npj Clim. Atmos. Sci., 7, 232, https://doi.org/10.1038/s41612-024-00766-3, 2024.
Luo, B., Xiao, C., Luo, D., Fu, Q., Chen, D., Zhang, Q., Ge, Y., and Diao, Y.: Atmospheric and oceanic drivers behind the 2023 Canadian wildfires, Commun. Earth. Environ., 6, 446, https://doi.org/10.1038/s43247-025-02387-x, 2025.
Luo, D., Cha, J., Zhong, L., and Dai, A.: A nonlinear multiscale interaction model for atmospheric blocking: The eddy-blocking matching mechanism, Q. J. Roy. Meteor. Soc., 140, 1785–1808, https://doi.org/10.1002/qj.2337, 2014.
Luo, D., Chen, X., Overland, J., Simmonds, I., Wu, Y., and Zhang, P.: Weakened Potential Vortility Barrier Linked to Recent Winter Arctic Sea Ice Loss and Midlatitude Cold Extremes, J. Climate, 32, 4235–4261, https://doi.org/10.1175/JCLI-D-18-0449.1, 2019.
Luo, D., Luo, B., and Zhang, W.: A perspective on the evolution of atmospheric blocking theories: From eddy-mean flow Interaction to nonlinear multiscale interaction, Adv. Atmos. Sci., 40, 553–569, https://doi.org/10.1007/s00376-022-2194-z, 2023.
Lupo, A. R.: Atmospheric blocking events: a review, Ann. N. Y. Acad. Sci., 1504, 5–24, https://doi.org/10.1111/nyas.14557, 2021.
Maddison, J., Gray, S., Martínez-Alvarado, O., and Williams, K.: Upstream cyclone influence on the predictability of block onsets over the Euro-Atlantic region, Mon. Weather Rev., 147, 1277–1296, https://doi.org/10.1175/MWR-D-18-0226.1, 2019.
Martius, O., Sodemann, H., Joos, H., Pfahl, S., Winschall, A., Croci-Maspoli, M., Graf, M., Madonna, E., Mueller, B., Schemm, S., Sedláček, J., Sprenger, M., and Wernli, H.: The role of upper-level dynamics and surface processes for the Pakistan flood of July 2010, Q. J. Roy. Meteor. Soc., 139, 1780–1797, https://doi.org/10.1002/qj.2082, 2013.
Mu, M. and Duan, W.: A nonlinear theory and technology for reducing the uncertainty of high-impact ocean–atmosphere event prediction, Adv. Atmos. Sci., 42, 1981–1995, https://doi.org/10.1007/s00376-025-4467-9, 2025.
Nakamura, N. and Huang, C. S. Y.: Atmospheric blocking as a traffic jam in the jet stream, Science, 361, 42–47, https://doi.org/10.1126/science.aat0721, 2018.
Pelly, J. L. and Hoskins, B. J.: A new perspective on blocking, J. Atmos. Sci., 60, 743–755, https://doi.org/10.1175/1520-0469(2003)060<0743:ANPOB>2.0.CO;2, 2003a.
Pelly, J. L. and Hoskins, B. J.: How well does the ECMWF Ensemble Prediction System predict blocking?, Q. J. Roy. Meteor. Soc., 129, 1683–1702, https://doi.org/10.1256/qj.01.173, 2003b.
Riboldi, J., Lott, F., D'Andrea, F., and Rivière, G.: On the linkage between Rossby wave phase speed, atmospheric blocking, and Arctic amplification, Geophys. Res. Lett., 47, e2020GL087796, https://doi.org/10.1029/2020GL087796, 2020.
Shutts, G. J.: The propagation of eddies in diffluent jetstreams: Eddy vorticity forcing of `blocking' flow fields. Q. J. Roy. Meteor. Soc., 109, 737–761, https://doi.org/10.1002/qj.49710946204, 1983.
Takaya, K. and Nakamura, H.: A formulation of a phase-independent wave activity flux for stationary and migratory quasigeostrophic eddies on a zonally varying basic flow, J. Atmos. Sci., 58, 608–627, https://doi.org/10.1175/1520-0469(2001)058<0608:AFOAPI>2.0.CO;2, 2001.
Tao, S.: Heavy Rainfalls in China, Science Press, Beijing, China, 225 pp., 1980 (in Chinese).
Tibaldi, S. and Molteni, F.: On the operational predictability of blocking, Tellus A, 42, 343–365, https://doi.org/10.3402/tellusa.v42i3.11882, 1990.
van Mourik, J., de Vries, H., and Baatsen, M.: On the movement of atmospheric blocking systems and the associated temperature responses, Weather Clim. Dynam., 6, 413–429, https://doi.org/10.5194/wcd-6-413-2025, 2025.
Wang, L., Lu, J., Breeden, M. L., Chen, G., Henderson, S. A., Narinesingh, V., Simpson, I. R., Woollings, T., Hu, Y., and Lubis, S. W.: Gaps and ways forward in atmospheric blocking and extreme weather research, Nat. Commun., 17, 2873, https://doi.org/10.1038/s41467-026-70487-z, 2026.
White, R. H. and Mareshet Admasu, L.: Temporally and zonally varying atmospheric waveguides – climatologies and connections to quasi-stationary waves, Weather Clim. Dynam., 6, 549–570, https://doi.org/10.5194/wcd-6-549-2025, 2025.
White, R. H., Anderson, S., Booth, J. F., Braich, G., Draeger, C., Fei, C., Harley, C. D. G., Henderson, S. B., Jakob, M., Lau, C.-A., Mareshet Admasu, L., Narinesingh, V., Rodell, C., Roocroft, E., Weinberger, K. R., and West, G.: The unprecedented Pacific Northwest heatwave of June 2021, Nat. Commun., 14, 727, https://doi.org/10.1038/s41467-023-36289-3, 2023.
Woollings, T., Barriopedro, D., Methven, J., Son, S.-W., Martius, O., Harvey, B., Sillmann, J., Lupo, A. R., and Seneviratne, S.: Blocking and its response to climate change, Curr. Clim. Change Rep., 4, 287–300, https://doi.org/10.1007/s40641-018-0108-z, 2018.
Wu, D., Zhang, J., Niu, X., Shi, R., Wang, X., Liu, J., Wen, H., Zhou, Y., Pu, W., Zhang, B., Zhang, D., and Wang, X.: Triggers of the record-breaking 2023 Canadian wildfires: Extreme heat waves and droughts driven by abnormally high sea surface temperatures, J. Geophys. Res.-Atmos., 130, e2025JD044451, https://doi.org/10.1029/2025JD044451, 2025.
Xu, Z., Yang, X.-Q., Tao, L., and Sun, L.: Impact of anomalous Eurasian blocking activities on the East Asian Meiyu rainfall, Clim. Dynam., 61, 3127–3146, https://doi.org/10.1007/s00382-023-06735-5, 2023.
Yamazaki, A. and Itoh, H.: Vortex–vortex interactions for the maintenance of blocking. Part I: The selective absorption mechanism and a case study, J. Atmos. Sci., 70, 725–742, https://doi.org/10.1175/JAS-D-11-0295.1, 2013.
Yao, W., Lu, J., and Liu, Y.: Rotational flow dominates abrupt seasonal change in zonally asymmetric tropical meridional circulation, Geophys. Res. Lett., 53, e2025GL118924, https://doi.org/10.1029/2025GL118924, 2026.
Yao, Y., Zhuo, W., Gong, Z., Luo, B., Luo, D., Zheng, F., Zhong, L., Huang, F., Ma, S., Zhu, C., and Zhou, T.: Extreme cold events in North America and Eurasia in November–December 2022: A potential vorticity gradient perspective, Adv. Atmos. Sci., 40, 953–962, https://doi.org/10.1007/s00376-023-2384-3, 2023.
Yeh, T.-C., Dao, S.-Y., and Li, M.-T.: The abrupt change of circulation over the Northern Hemisphere during June and October, in: The Atmosphere and the Sea in Motion. The Rossby Memorial Volume, edited by: Bolin, B., Rockefeller Institute Press, New York, 249–267, ISBN 9780874700336, 1959.
Yeh, T.-C., Tao, S.-Y., Chu, P.-C., and Chen, L. S.: Studies on the Blocking Situations in Northern Hemisphere Winter, Science Press, Beijing, China, 135 pp., 1962 (in Chinese).
Zhang, W., Wang, L., Luo, D., Yao, Y., Luo, B., Simmonds, I., and Semenov, V.: Impacts of background conditions on the evolutionary disparities between Greenland and Euro-Atlantic blocking, J. Atmos. Sci., 82, 501–517, https://doi.org/10.1175/JAS-D-24-0016.1, 2025.
- Abstract
- Introduction
- Data and Methods
- Observed Phenomena from ERA5 Reanalysis and Rossby Wave Diagnostics
- The Dynamic Source of Predictability in ECMWF S2S Ensemble Forecasts
- Summary and discussion
- Data availability
- Author contributions
- Competing interests
- Disclaimer
- Acknowledgements
- Financial support
- Review statement
- References
- Abstract
- Introduction
- Data and Methods
- Observed Phenomena from ERA5 Reanalysis and Rossby Wave Diagnostics
- The Dynamic Source of Predictability in ECMWF S2S Ensemble Forecasts
- Summary and discussion
- Data availability
- Author contributions
- Competing interests
- Disclaimer
- Acknowledgements
- Financial support
- Review statement
- References